How Much Has Medicare Spent on the EpiPen Since 2007?
The latest example of high and rising prescription drug prices to attract significant media and public attention relates to the EpiPen, an auto-injector containing the drug epinephrine which is used to reverse the effects of severe allergic reactions. Since Mylan acquired the EpiPen from Merck in 2007, the company has increased the list price for a pack of two EpiPens nearly 550%, from $94 in January 2007 to $609 in May 2016.1 While the EpiPen can be a lifesaver for children with serious food allergies, it is also used to treat life-threatening allergic reactions experienced by the older adults and people with disabilities who are covered by Medicare. The EpiPen is covered under Medicare Part D, which provides outpatient prescription drug coverage to beneficiaries who enroll in private drug plans.
This data note examines the effects of rising EpiPen prices on Medicare and beneficiaries. Using data from a 5% sample of Medicare prescription drug event claims from the Centers for Medicare & Medicaid Services (CMS) Chronic Conditions Data Warehouse, we analyze EpiPen spending, in the aggregate and per user, in Medicare Part D between 2007 (the year after the drug benefit took effect, and the year Mylan acquired the product) and 2014 (the most recent year of data available). Our analysis is restricted to Medicare beneficiaries who had at least one month of Part D enrollment during the year and at least one prescription drug event with a brand name of EpiPen 2-pak, EpiPen Jr. 2-pak, EpiPen, or EpiPen Jr. during the year. The analysis is based on retail claims data that do not take into account manufacturer discounts (rebates) to plans, which ranged from an average of 9.6% of total Part D spending in 2007 to 14.3% in 2014, according to Medicare’s actuaries.2 Part D rebate information submitted to CMS is confidential3; therefore, no data on rebates for the EpiPen to Part D plans is publicly available.
Total Medicare Part D spending on the EpiPen. According to our analysis, total Medicare Part D spending for the EpiPen increased from $7.0 million in 2007 to $87.9 million in 2014, an increase of 1151% (Figure 1).

Figure 1: Since 2007, Medicare Part D total spending for the EpiPen has grown substantially—by 1151%—while the total number of Part D EpiPen users has grown by 164%
While the total number of Part D enrollees using the EpiPen also increased over this time period—from nearly 80,000 users in 2007 to more than 211,000 in 2014—the increase was significantly lower in percentage terms (164%).
Over this same time period, average total Part D spending per EpiPen prescription increased nearly five-fold, from an average of $71 in 2007 to $344 in 2014 (a 383% increase) (Figure 2).

Figure 2: Since 2007, Medicare Part D total spending per EpiPen prescription has grown substantially—nearly 5 fold—from $71 in 2007 to $344 in 2014
To put EpiPen spending increases in context, we compared annual growth in average total Part D spending per EpiPen prescription in each year from 2008 to 2014 to annual growth in average per capita costs for Part D overall and in medical price inflation (the Consumer Price Index, or CPI, for medical care). The annual rate of growth for total Part D EpiPen spending per prescription was significantly higher each year (Figure 3).
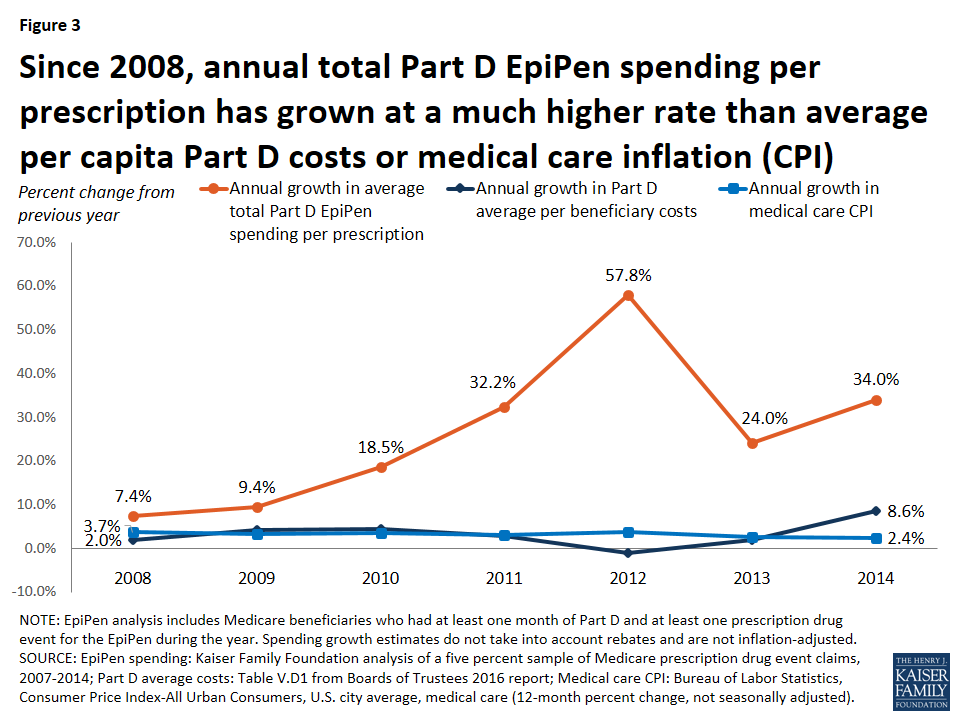
Figure 3: Since 2008, annual total Part D EpiPen spending per prescription has grown at a much higher rate than average per capita Part D costs or medical care inflation (CPI)
For example, in 2008, Part D spending per EpiPen prescription increased by 7.4%, more than 3.5 times greater than the increase in total Part D per capita spending (2.0%) and twice the rate of medical care price inflation (3.7%). In 2014, Part D spending per EpiPen prescription increased by 34.0%, four times the rate of increase in Part D per capita spending (8.6%) and 14 times larger than the 2.4% increase in medical care price inflation.
Out-of-pocket spending on the EpiPen by Medicare Part D enrollees. Since Medicare Part D plans cover a portion of enrollees’ total drug costs, beneficiaries in Part D plans pay less than the full retail cost of drugs covered by their plan, including the EpiPen. Still, average out-of-pocket spending by Part D enrollees for each EpiPen prescription nearly doubled between 2007 and 2014, from $30 to $56, among enrollees who do not receive Low-Income Subsidies (LIS) under Part D4 (Table 1). In the aggregate, out-of-pocket spending by all Part D enrollees who used the EpiPen increased more than five-fold between 2007 and 2014, from $1.6 million to $8.5 million, reflecting both an increase in the number of users and price increases for the EpiPen.
| Table 1: Medicare Part D Spending for the EpiPen, 2007-2014 | ||||||
| Year | Number of EpiPen users | Number of EpiPen prescriptions1 | Total EpiPen spending | Average total spending per EpiPen prescription | Total out-of-pocket spending on the EpiPen | Average out-of-pocket spending by non-LIS enrollees per EpiPen prescription 2 |
| 2007 | 79,980 | 98,579 | $7,027,685 | $71 | $1,608,896 | $30 |
| 2008 | 90,840 | 113,027 | $8,653,183 | $77 | $1,979,054 | $31 |
| 2009 | 104,040 | 128,624 | $10,769,049 | $84 | $2,543,034 | $36 |
| 2010 | 113,080 | 138,212 | $13,713,744 | $99 | $3,000,749 | $40 |
| 2011 | 127,200 | 154,460 | $20,264,292 | $131 | $3,685,566 | $42 |
| 2012 | 166,400 | 199,853 | $41,379,681 | $207 | $5,831,017 | $51 |
| 2013 | 204,860 | 246,725 | $63,342,313 | $257 | $7,504,229 | $51 |
| 2014 | 211,500 | 255,419 | $87,892,967 | $344 | $8,481,497 | $56 |
| NOTE: LIS is Low-Income Subsidy. Analysis includes Medicare beneficiaries who had at least one month of Part D coverage and at least one prescription drug event for the EpiPen during the year. Total spending does not take into account rebates and is not inflation-adjusted. 1Standardized to a 30-day supply. 2Reflects out-of-pocket spending by Part D enrollees not receiving Low-Income Subsidies. SOURCE: Kaiser Family Foundation analysis of a 5% sample of Medicare prescription drug event claims, 2007-2014. |
||||||
The impact of rising EpiPen prices since 2014. Because our analysis is based on data available only to 2014, our estimates do not reflect additional EpiPen price increases that have occurred since then. The list price of the EpiPen has increased (in nominal terms) from $349 in May 2014 to $609 in May 2016, a 74% increase. If total Part D spending per EpiPen prescription also increased by 74% between 2014 and 2016, Medicare Part D spending for the EpiPen would have increased from $344 per prescription in 2014 to $600 per prescription in 2016—more than an eight-fold increase since 2007.
Illustrating the potential effect of rebates. As noted above, Medicare does not disclose drug-specific rebates, and therefore we are unable to determine the extent to which our estimates of total Part D spending on the EpiPen might overstate actual plan costs for the EpiPen over this time period. To approximate the potential effect of rebates on total Part D spending, if we assume that all Part D plans had received for the EpiPen the average rebate reported by Medicare’s actuaries each year between 2007 and 2014, EpiPen spending would have increased from $6.4 million in 2007 (applying the 9.6% average rebate in 2007) to $75.3 million in 2014 (applying the 14.3% average rebate in 2014)—for an increase in total spending of nearly 1100%. This is similar to the 1151% increase based on total gross Medicare spending not accounting for rebates. In other words, even if total Part D spending for the EpiPen had been lower each year as a result of rebates, we might still expect to see a similar trend in the rate of Medicare Part D spending growth for the EpiPen, unless plans received significantly larger rebates over time. But it could also be the case that plans received relatively low rebates for the EpiPen, due to the lack of competition for this product—a situation that gives drug manufacturers less incentive to negotiate price discounts with insurers.
Implications. Although the total cost of the EpiPen to Medicare and beneficiaries may seem modest relative to the cost of more expensive specialty drugs and biologics, our analysis demonstrates that EpiPen price increases have translated into higher spending for Medicare Part D plans, enrollees, and the program overall. When drug manufacturers raise prices for their products and insurers’ costs increase as a result, these increases can translate into higher cost sharing and higher premiums for consumers. Rising prices for the EpiPen in recent years and the resulting significant increases in Medicare Part D spending illustrate why the cost of prescription drugs is an ongoing concern for consumers, public and private payers, and policy makers alike.
Juliette Cubanski and Tricia Neuman are with the Kaiser Family Foundation.
Anthony Damico is an independent consultant.