2023 Employer Health Benefits Survey
Section 3: Employee Coverage, Eligibility, and Participation
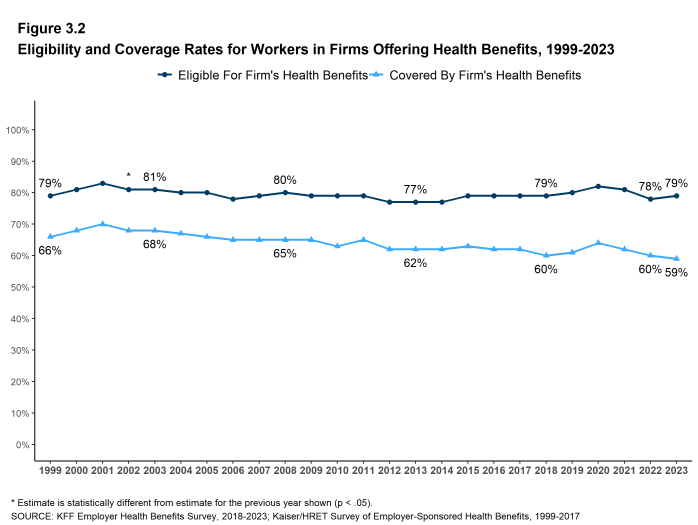
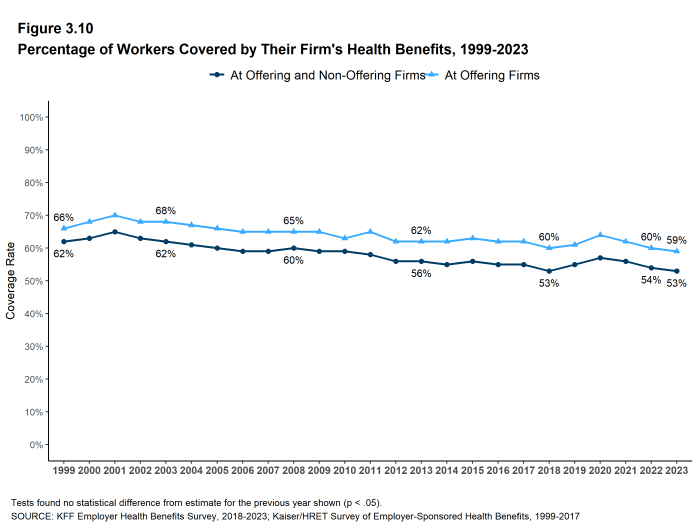
Employers are the principal source of health insurance in the United States, providing health benefits for almost 153 million nonelderly people.11 Most workers are offered health coverage at work, and most of the workers who are offered coverage take it. Workers may not be covered by their own employer for several reasons: their employer may not offer coverage, they may not be eligible for the benefits offered by their firm, they may elect to receive coverage from another source (such as through their spouse’s employer), or they may just refuse the offer of coverage from their firm. In 2023, 59% of workers in firms offering health benefits are covered by their own firm, similar to the percentages last year, five years ago, and ten years ago.
ELIGIBILITY
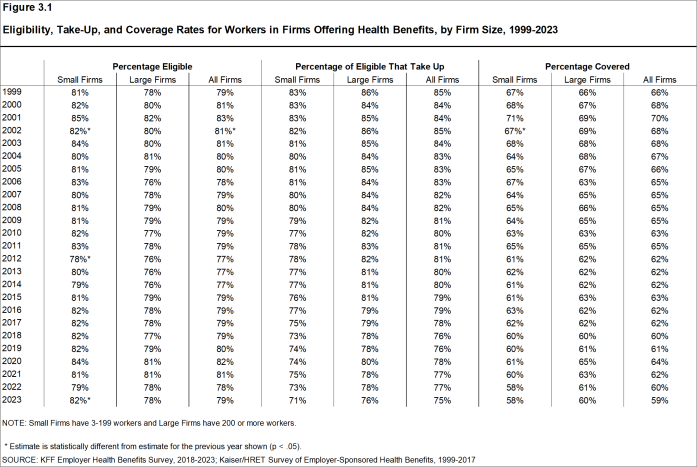
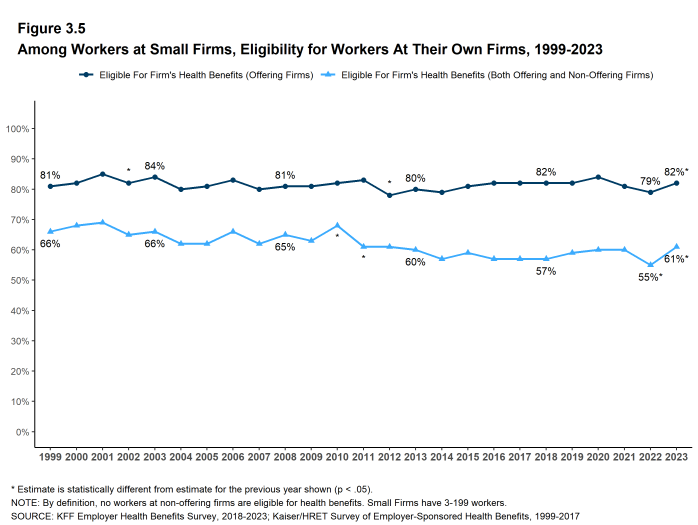
- Even in firms that offer health benefits, some workers may not be eligible to participate.12 Many firms, for example, do not offer coverage to part-time or temporary workers. Among workers in firms offering health benefits in 2023, 79% are eligible to enroll in the benefits offered by their firm, similar to the percentages last year, five years ago, and ten years ago for large firms. For small firms, the percentage eligible to enroll in benefits offered by their firm (82%) is different from last year (79%), but similar to the percentages five years ago and ten years ago. [Figures 3.1 and 3.2].
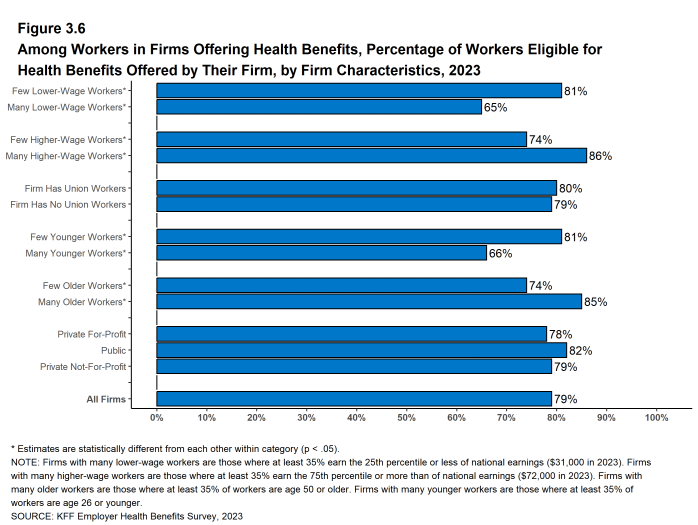
- Eligibility varies considerably by firm wage level. Workers in firms with a relatively large share of lower-wage workers (where at least 35% of workers earn $31,000 a year or less) have a lower average eligibility rate than workers in firms with a smaller share of lower-wage workers (65% vs. 81%) [Figure 3.6].
- Workers in firms with a relatively large share of higher-wage workers (where at least 35% earn $72,000 or more annually) have a higher average eligibility rate than workers in firms with a smaller share of higher-wage workers (86% vs. 74%) [Figure 3.6].
- Eligibility also varies by the age of the workforce. Those in firms with a relatively small share of younger workers (where fewer than 35% of the workers are age 26 or younger) have a higher average eligibility rate than those in firms with a larger share of younger workers (81% vs. 66%). Those in firms with a relatively large share of older workers (where more than 35% of the workers are age 50 or older) have a higher average eligibility rate than those in firms with a smaller share of older workers (85% vs. 74%) [Figure 3.6].
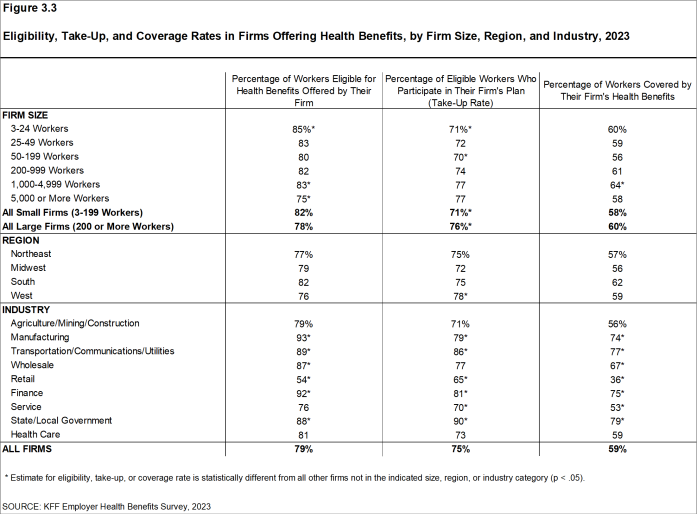
- Eligibility rates vary considerably for workers in different industries. The average eligibility rate remains particularly low for workers in retail firms (54%) [Figure 3.3].
Figure 3.1: Eligibility, Take-Up, and Coverage Rates for Workers in Firms Offering Health Benefits, by Firm Size, 1999-2023
Figure 3.3: Eligibility, Take-Up, and Coverage Rates in Firms Offering Health Benefits, by Firm Size, Region, and Industry, 2023
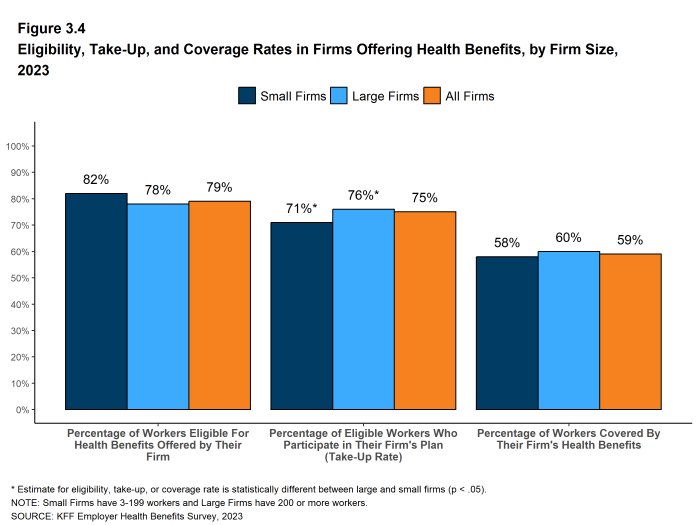
Figure 3.4: Eligibility, Take-Up, and Coverage Rates in Firms Offering Health Benefits, by Firm Size, 2023
TAKE-UP RATE
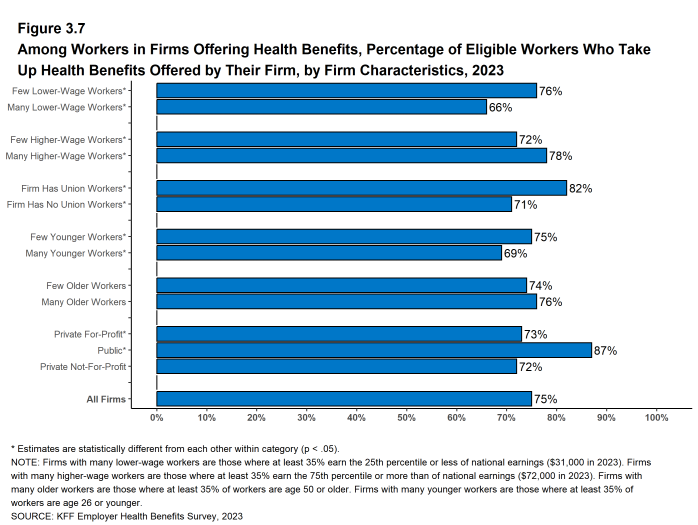
- Seventy-five percent of eligible workers take up coverage when it is offered to them, similar to the percentage last year [Figure 3.7].13
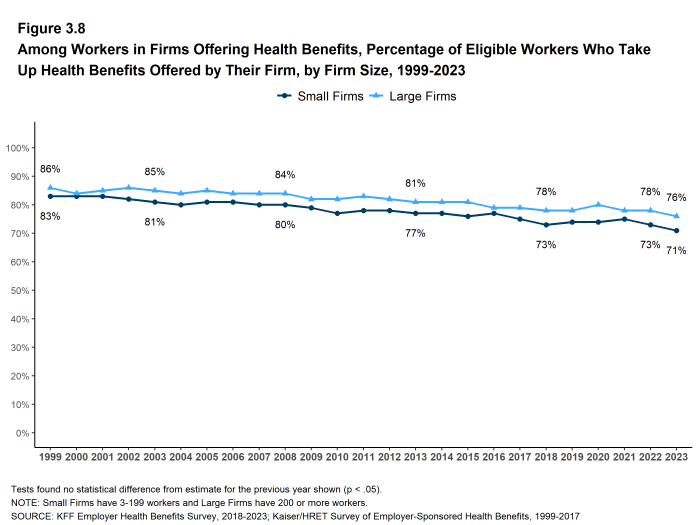
- Eligible workers in small firms have a lower average take up rate than those in larger firms (71% vs. 76%) [Figure 3.8].
- The likelihood of a worker accepting a firm’s offer of coverage varies by firm wage level. Eligible workers in firms with a relatively large share of lower-wage workers have a lower average take up rate than eligible workers in firms with a smaller share of lower-wage workers (66% vs. 76%) [Figure 3.7].
- Eligible workers in firms with a relatively large share of higher-wage workers have a higher average take up rate than those in firms with a smaller share of higher-wage workers (78% vs. 72%) [Figure 3.7].
- The likelihood of a worker accepting a firm’s offer of coverage also varies with the age distribution of the workforce. Eligible workers in firms with a relatively large share of younger workers have a lower average take up rate than those in firms with a smaller share of younger workers (69% vs. 75%) [Figure 3.7].
- Eligible workers in private, for-profit firms have a lower average take up rate (73%) and eligible workers in public firms have a higher average take up rate (87%) than workers in other firm types [Figure 3.7].
- Eligible workers in firms with some union workers have a higher average take up rate (82%) than eligible workers in firms with no union workers (71%) [Figure 3.7].
- The average percentages of eligible workers taking up benefits in offering firms also varies across industries, with workers in retail and service firms having the lowest take up rates [Figure 3.3].
- The share of eligible workers taking up benefits in offering firms (75%) is similar to the share in 2018 (76%) but lower than the share in 2013 (80%) [Figure 3.1].
Figure 3.7: Among Workers in Firms Offering Health Benefits, Percentage of Eligible Workers Who Take Up Health Benefits Offered by Their Firm, by Firm Characteristics, 2023
COVERAGE
- In 2023, the percentage of workers at firms offering health benefits covered by their firm’s health plan is 59%, similar to the percentage last year [Figure 3.1] and [Figure 3.2].
- The coverage rate at firms offering health benefits is similar for small firms and large firms in 2023. These rates are similar to the rates last year for both small firms and large firms [Figure 3.1] and [Figure 3.3].
- There is significant variation by industry in the coverage rate among workers in firms offering health benefits. The average coverage rate is particularly low in the retail industry (36%) [Figure 3.3].
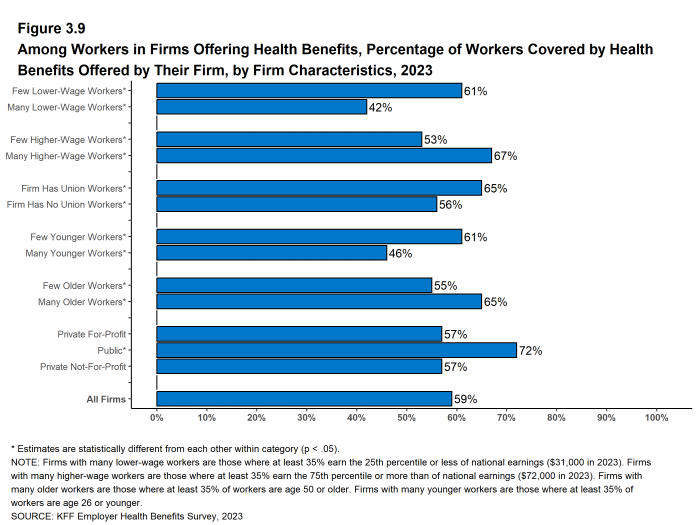
- The coverage rate also varies with firm wage levels. Among workers in firms offering health benefits, those in firms with a relatively large share of lower-wage workers are less likely to be covered by their own firm than workers in firms with a smaller share of lower-wage workers (42% vs. 61%). A similar pattern exists in firms with a relatively large share of higher-wage workers, with workers in these firms being more likely to be covered by their employer’s health benefits than those in firms with a smaller share of higher-wage workers (67% vs. 53%) [Figure 3.9].
- The age distribution of workers is also related to variation in coverage rates. Among workers in firms offering health benefits, those in firms with a relatively small share of younger workers are more likely to be covered by their own firm than those in firms with a larger share of younger workers (61% vs. 46%). Similarly, workers in offering firms with a relatively large share of older workers are more likely to be covered by their own firm than those in firms with a smaller share of older workers (65% vs. 55%) [Figure 3.9].
- Among workers in firms offering health benefits, those employed at a firm with some union workers are more likely than workers in firms without union workers to be covered by their own firm [Figure 3.9].
- Among workers in firms offering health benefits, those working in public firms are more likely than workers in other firm types to be covered by their own firm [Figure 3.9].
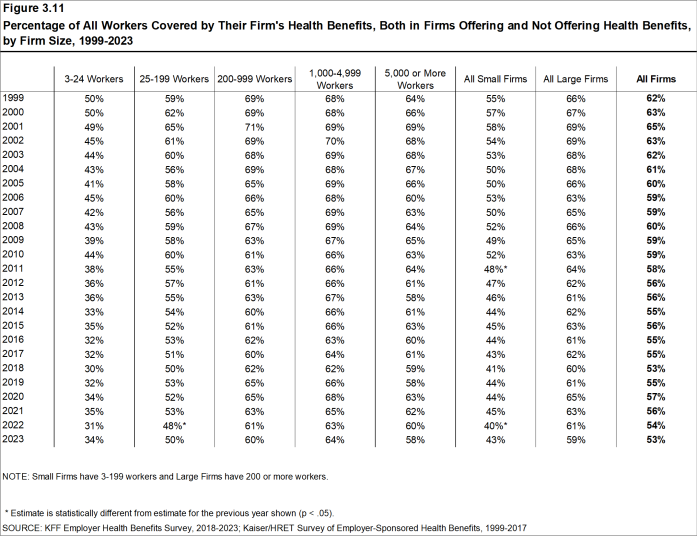
- Among workers in all firms, including those that offer and those that do not offer health benefits, 53% are covered by health benefits offered by their employer, similar to the percentages last year (54%), five years ago (53%), and ten years ago (56%) [Figure 3.10].
Figure 3.9: Among Workers in Firms Offering Health Benefits, Percentage of Workers Covered by Health Benefits Offered by Their Firm, by Firm Characteristics, 2023
WAITING PERIODS
- Waiting periods are a specified length of time after beginning employment before a worker is eligible to enroll in health benefits. With some exceptions, the Affordable Care Act (ACA) requires that waiting periods cannot exceed 90 days. For example, employers are permitted to have orientation periods before the waiting period begins which, in effect, means a worker is not eligible for coverage three months after being hired. If a worker is eligible to enroll on the 1st of the month after three months of employment, this survey rounds up and considers the firm’s waiting period four months. For these reasons, some employers still have waiting periods exceeding the 90-day maximum.
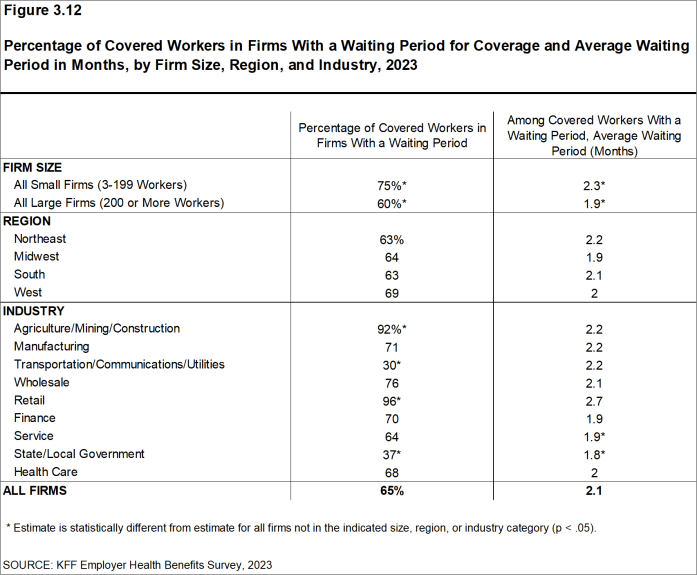
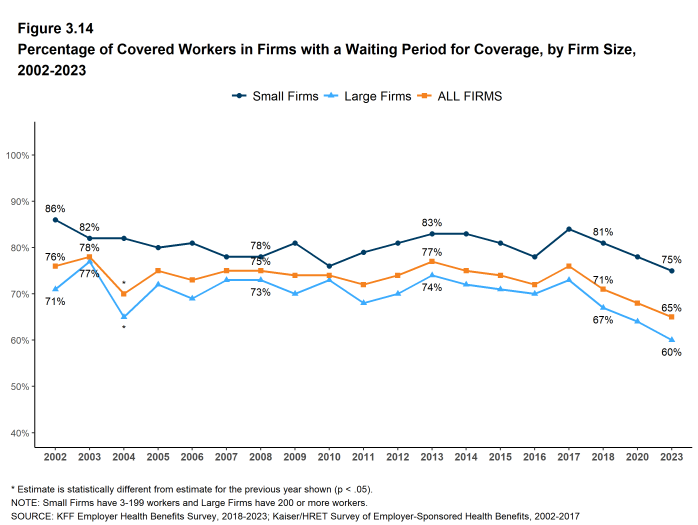
- Sixty-five percent of covered workers face a waiting period before coverage is available, similar to three years ago, the last time we asked this question [Figure 3.14]. Covered workers in small firms are more likely than those in large firms to have a waiting period (75% vs. 60%) [Figure 3.12].
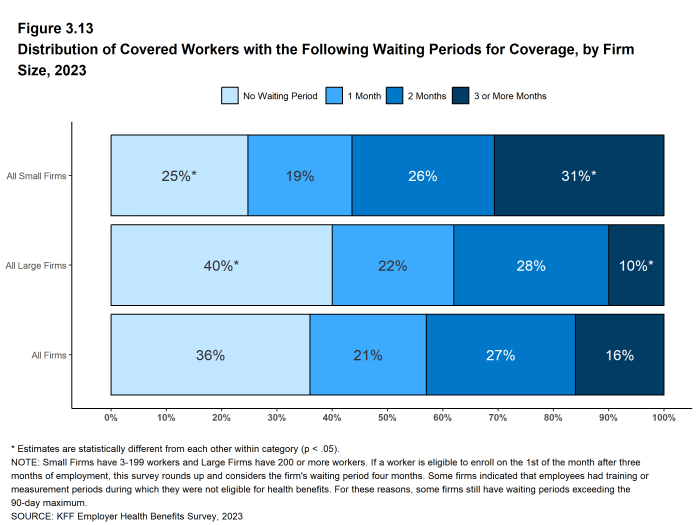
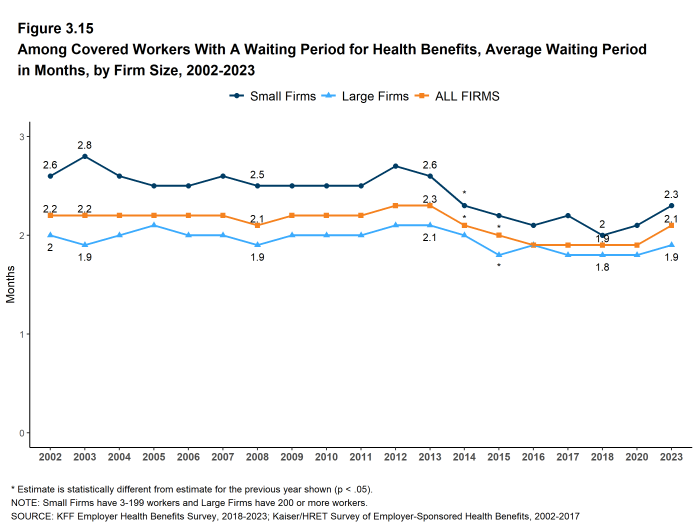
- The average waiting period among covered workers who face a waiting period is 2 months [Figure 3.12]. A small percentage (7%) of covered workers with a waiting period have a waiting period of more than 3 months.
- Respondents with waiting periods greater than 4 months generally indicated that employees had training, orientation, or measurement periods in which they were employees but were not eligible for health benefits. Some employers have measurement periods to determine whether variable hour employees will meet the requirements for the firm’s health benefits.
Figure 3.12: Percentage of Covered Workers in Firms With a Waiting Period for Coverage and Average Waiting Period in Months, by Firm Size, Region, and Industry, 2023
Figure 3.13: Distribution of Covered Workers With the Following Waiting Periods for Coverage, by Firm Size, 2023
Figure 3.14: Percentage of Covered Workers in Firms With a Waiting Period for Coverage, by Firm Size, 2002-2023
- KFF. Health Insurance Coverage of the Nonelderly [Internet]. San Francisco (CA): KFF; 2021 [cited 2023 July 31]. Available from: https://www.kff.org/other/state-indicator/nonelderly-0-64/ Estimate from the KFF’s analysis of the 2021 American Community Survey.↩︎
- See Section 2 for part-time and temporary worker offer rates.↩︎
- In 2009, we began weighting the percentage of workers that take up coverage by the number of workers eligible for coverage. The historical take-up estimates have also been updated. See the Survey Design and Methods section for more information.↩︎

