Double Jeopardy: Low Wage Workers at Risk for Health and Financial Implications of COVID-19
Issue Brief
The public health crisis caused by the coronavirus pandemic carries both health and economic implications. In addition to widespread illness and high death rates, social distancing policies required to address COVID-19 have led many businesses to cut hours, cease operations, or close altogether. People who work in certain industries, such as restaurant, hospitality, retail, and other service industries, are particularly at risk for loss of income. Those who maintain jobs amid the coronavirus outbreak, such as health care workers, grocery store workers, and delivery drivers, are at increased risk of contracting coronavirus since they remain exposed to other individuals. Many of these workers are low-wage workers and will have limited ability to absorb income declines or afford health care costs. Over 25 million nonelderly adults worked in low-wage jobs in 2018, meaning they were among the bottom 20% of earners among working nonelderly adults.1 This brief analyzes data on low-wage workers in the context of COVID-19 and discusses the implications of the pandemic for their jobs, health, and financial security.
What risks do low-wage workers face?
Low-wage workers are employed in jobs that are at high risk for loss of income. Recent unemployment filing data indicates that millions have filed for unemployment benefits in recent weeks, reflecting widespread layoffs. State comments on data filings indicate that most claims are for people previously employed in service industries, particularly accommodation and food services, with an increasing rate for people in retail, wholesale trade, and construction industries. Workers in these industries are disproportionately likely to be low-wage, with about a fifth of low-wage workers employed in each of the entertainment/accommodation/food services (20%) and retail (19%) industries, and another tenth in service (5%) or construction (5%) (Appendix Table 1).2 Low-wage workers who remain employed may be marginally employed or experience a loss of income. Data from another source3 indicates that a third of low-wage workers were employed part time (defined in this analysis as fewer than 35 hours per week) and may therefore be working fewer hours if hours were cut. The vast majority of low-wage workers (80%) were paid hourly, meaning if their hours are scaled back they lose pay directly. A large share (43%) of low-wage workers are employed in firms with fewer than 25 people, and small firms may be less able to weather the financial crisis.4
Low-wage workers who are still employed may face health risks due to the nature of their jobs. Common occupations for low-wage workers include cashiers and retail salespersons, many of whom may not be working as businesses have closed (Table 1); however, those who are working in “essential businesses” that remain open (such as grocery stores) are still in close contact with the public. Other top occupations, such as cooks and waiters/waitresses, may similarly still be working as restaurants move to delivery and take-out options, putting these workers in contact with colleagues and perhaps the public. A notable number of low-wage workers are engaged in positions that are likely involved with delivery of goods and services to people who remain at home under stay at home orders (e.g., laborers/freight, stock and material movers, stockers/order fillers, and drivers/truck drivers). Nearly one in ten (9%) low-wage workers reports that they are in fair or poor health,5 possibly putting them at increased risk for serious illness if they contract coronavirus.
| Table 1: Top 10 Occupations Among Low-Wage Workers, 2018 | |
| Occupation | Number of Low-Wage Workers |
| Cashiers | 1,660,200 |
| Retail Salespersons | 1,112,700 |
| Cooks | 1,083,900 |
| Waiters and Waitresses | 1,008,800 |
| Customer Service Representatives | 798,000 |
| Laborers & Freight, Stock, and Material Movers | 790,200 |
| Janitors and Building Cleaners | 756,400 |
| Stockers and Order Fillers | 652,800 |
| Drivers/Sales Workers and Truck Drivers | 550,200 |
| Teaching Assistants | 535,400 |
| Figure 3: Financial Insecurity Among Low-Wage Workers, 2018Notes: Low-Wage Workers defined as those in bottom quintile of people who earned at least $1000 in past year and worked at least 20 hours in usual week working.Source: KFF analysis of 2018 American Community Survey, 1-Year Estimates. | |
A large number of low-wage workers are working directly in the health care workforce. 3.5 million low-wage workers are in the health and social services industry, with the greatest number of those (1.3 million) working as aides or personal care workers (e.g., nursing assistants or personal care aides) whose jobs will bring them into frequent, close contact with patients (Table 2). Nearly a million more work as direct contact support workers—jobs such as maids/janitors, housekeeping and laundry, or food service workers—whose jobs also will bring them into direct contact with others. Within these two occupation groups, a third or more of workers are low-wage. Many of these workers are “essential workers” who likely are still employed but facing substantial health risks due to the nature of their jobs.
| Table 2: Workers in Health and Social Services Industry, by Occupation and Wage Group, 2018 | |||
| Occupation | Total Workers | Low-Wage Workers | |
| Number | Share of Total Workers Who are Low-Wage Within Occupation | ||
| All Occupations | 19,479,000 | 3,455,000 | 18% |
| Aides and Personal Care Workers | 4,164,000 | 1,322,000 | 32% |
| Direct Contact Support Workers | 2,396,000 | 922,000 | 39% |
| Other Support Workers & Managers | 5,383,000 | 658,000 | 12% |
| Health Care Providers | 6,530,000 | 439,000 | 7% |
| Social Workers and Behavioral Health Providers | 1,006,000 | 114,000 | 11% |
| NOTE: Workers includes nonelderly adults earning at least $1,000 in past year and working at least 20 hours per week in a usual week working. Low-Wage Workers defined as those in the bottom earnings quintile among all workers.SOURCE: KFF analysis of 2018 American Community Survey, 1-Year Estimates. | |||
Who works in low-wage jobs?
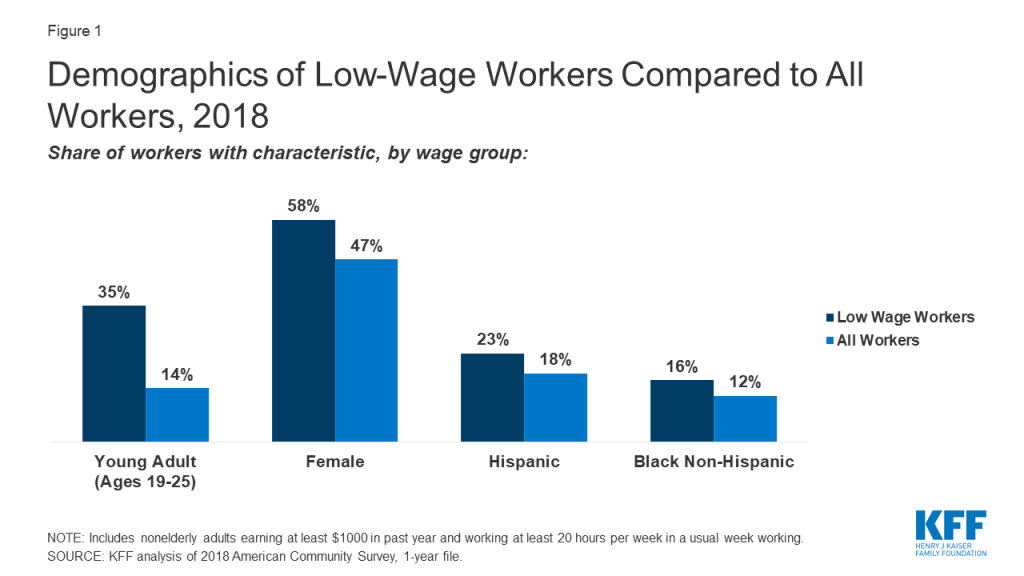
Women, young adults, and groups of color are particularly likely to be low-wage workers. Reflecting the fact that people who more recently entered the workforce are likely to earn less, over a third (35%) are young adults aged 19-25—representing half of all workers in this age group— and another 22% are aged 26-34. Low-wage workers are also more likely to be female (58%, versus 47% for all workers). Although most low-wage workers are White, they are disproportionately Hispanic or Black Non-Hispanic race/ethnicity (Figure 1). While higher rates of underlying health conditions partially explains the disproportionate impact that the pandemic is having on groups of color in the United States, other risk factors such as type of employment and ongoing exposure may also explain disparities in cases and deaths.
What other risks do low-wage workers face due to COVID-19?
Medicaid plays a key role in providing health coverage to low-wage workers, covering more than one in five (22%) low-wage workers in 2018 (Figure 2), and is likely to continue to be an important source of coverage for this group. Most low-wage workers who had Medicaid while working are likely to remain eligible for Medicaid even if their income drops due to lost hours or employment, since there is no lower floor on Medicaid eligibility. Some people who lose their jobs—especially those who live in states that expanded Medicaid under the ACA— may become newly eligible for Medicaid if their income (calculated based on other income in the family plus any state unemployment benefit they receive) falls below state eligibility limits (138% of poverty in states that expanded under the ACA).
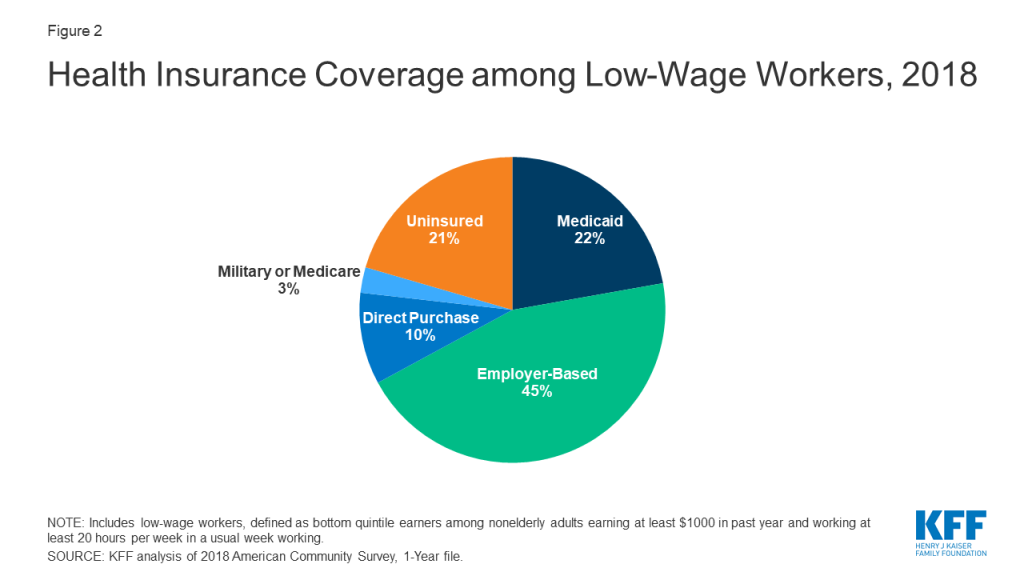
Nearly half of low-wage workers relied on an employer for health coverage (45%) in 2018, putting this coverage at risk if they lose their jobs or income. Many people in this income range will not be able to afford COBRA coverage, if it is available to them, as the cost is on average over $600 a month for an individual plan and more than $1,700 for family coverage. Many people who lose job-based coverage and receive unemployment insurance (UI) benefits would become eligible for either Medicaid coverage or ACA marketplace subsidies, which are available to people who do not qualify for Medicaid and have income between 100% and 400% of poverty, calculated based on other family income plus any state and new federal unemployment benefit received.6 People who lose employment-based coverage due to job loss qualify for a special enrollment period for marketplace coverage. However, some people newly-eligible for Marketplace coverage may face challenges in navigating the application and enrollment process.
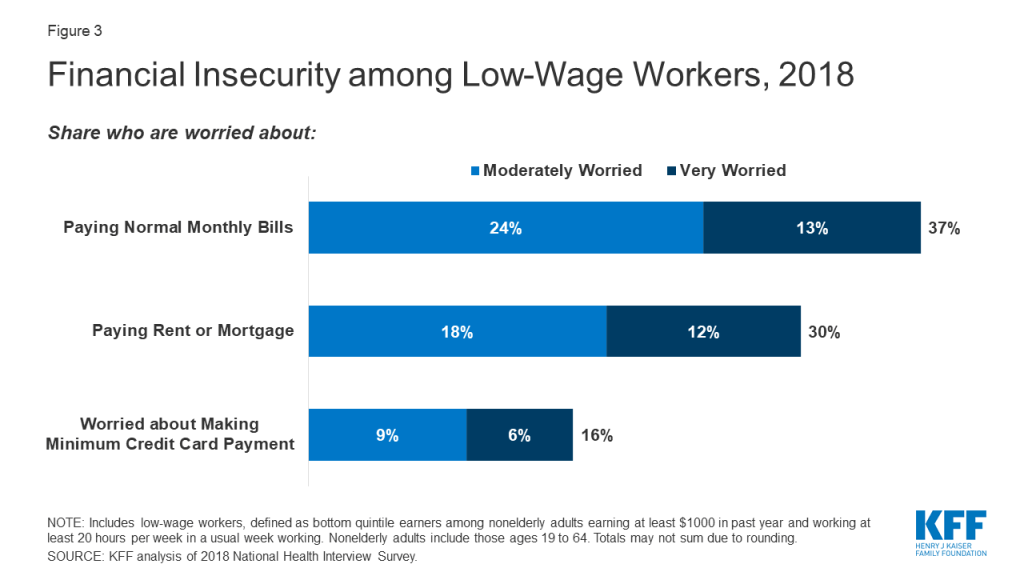
One in five low-wage workers lacked health coverage in 2018 (Figure 2), putting them at high risk for out-of-pocket costs or access barriers if they become ill. Some of these workers who are still employed may in fact be eligible for Medicaid or for subsidies for Affordable Care Act (ACA) marketplace coverage but not enrolled. Others may fall into the “coverage gap” that exists for adults with incomes above Medicaid limits but below poverty in states that have not expanded Medicaid under the ACA. Uninsured workers who lose jobs or income may become newly eligible for Medicaid or marketplace subsidies. Nearly all state-run marketplaces have re-opened enrollment to allow residents to obtain marketplace coverage if eligible. However, people who were uninsured while working and live in one of the 32 states that uses the federal marketplace do not qualify for a “special enrollment period” to enroll in coverage through the federal marketplace. Thus, if their unemployed family income puts them above Medicaid eligibility, they will remain uninsured.Many low-wage workers were already living in precarious financial situations before the pandemic and may not be able to absorb loss of income or pay health care costs if they become ill. Over a quarter (28%) of low-wage workers live in a household without a full-time worker in the family, and more than half (53%) were in a family with total family income below 200% of poverty ($26,200 for a family of four in 2020).7 Reflecting their more limited incomes, high shares of low-wage workers reported day-to-day financial concerns (on top of concerns over affording health care) even before COVID-19, with over a third saying they were very or moderately worried about paying monthly bills; three in ten expressing worry over paying rent or mortgage; and nearly one in six saying they were worried about meeting minimum payments on credit cards (Figure 3). Low-wage workers also were likely to experience food insecurity, with 15% meeting federal definitions of low (9%) or very low (6%) food security.8 Many lower income households do not have sufficient savings for long periods of unemployment: half of multi-person households at or below 150% of poverty have $492 or less in liquid assets.
Beyond their own personal risk, many people working in low-wage jobs have living situations that could put them or their household at additional risk. Low-wage workers are more likely than all workers to live in large households and more likely to have an older adult living in the house. Specifically, 22% live in a household of at least five people (compared to just 13% of those in the highest wage quintile),9 and a quarter live with someone over the age of 60 in the household (13% live with someone over age 65).10 Nearly one in five (17%) live in a household in which someone has a personal care need (versus just 7% of those in the highest quintile)11 , indicating poor health or functioning and possible need for ongoing long-term services and supports.
Even before the pandemic, many low-wage workers reported problems affording needed health care.12 More than one in ten (12%) low-wage workers said they could not afford needed care in the past year, and a similar share (10%) said they did not get the needed care due to affordability. Higher shares report family-level problems with medical bills, with nearly one in five (18%) reporting that someone in their family had a problem paying medical bills in the past year and a quarter (25%) saying someone in their family was paying off a medical bill. While recent legislation aims to protect people from out-of-pocket costs due to coronavirus testing and many insurers are waiving cost sharing for COVID-related services, some people who seek care for symptoms or illness will face out-of-pocket costs for that care. Prior problems affording care may lead some to hesitate due to fear of taking on additional medical debt.
Looking Ahead
As of April 18, nearly than 27 million people had filed for unemployment insurance since March 14, an unprecedented loss of employment. Actual loss of jobs and income is likely even higher, as some people may be marginally employed or may not have filed for benefits, and further loss of jobs is expected. Others continue to work and face personal and family risks to their health. Low-wage workers are particularly affected by these trends.
In response to the health and economic crisis, Congress has passed a series of laws to assist people facing health and economic strain due to the pandemic. The Families First Coronavirus Response Act expanded food and nutrition assistance and required paid family or medical leave for many workers, among other provisions. The more recently enacted CARES Act builds on these actions, further addressing food security and paid leave policies. It also provides assistance to small businesses to help them weather or recover from the crisis and assists unemployed individuals directly by increasing and supplementing state unemployment benefits with federal funds. In particular, the Act provides a $600 weekly federal supplement (available through July 31) to state unemployment benefits and extends the period for receiving unemployment benefits by up to 13 weeks. The Act also extends benefits to many types of workers (e.g., self-employed) not currently eligible for unemployment benefits under state laws.
While these actions provide some relief to low-wage workers, the health and financial crisis is still causing major burden on the nation, with those in the lowest income group likely to be the hardest hit. In addition, it is too early to determine how well actions taken will address need. To access unemployment benefits, people need to navigate outdated state unemployment systems, and backlogs at some state offices due to high demand may delay or deter some unemployed workers from applying for benefits. Further, financial assistance may not always be paired with health coverage, particularly for low-wage workers who were uninsured even prior to the pandemic. Others may have difficulty navigating or affording health insurance options, as evidenced by the number of people who were eligible for ACA coverage but unenrolled in the past. Health coverage is particularly important to protect against financial burden due to treatment costs or facilitate access to care in the midst of a public health crisis. As policy makers continue to take action to address the coronavirus pandemic, understanding the implications for those most affected, including low-wage workers, can help target responses and resources.
Appendix
| Appendix Table 1: Low-Wage Workers by State and Industry, 2018 | ||||||
| Low Wage Workers By Industry | ||||||
| State | All Workers | Low-WageWorkers | Retail | Health Care | Ent/Acc./Food | Other |
| Alabama | 1,863,000 | 448,500 | 19% | 10% | 20% | 51% |
| Alaska | 316,300 | 60,500 | 20% | 9% | 17% | 54% |
| Arizona | 2,848,400 | 572,200 | 18% | 8% | 20% | 53% |
| Arkansas | 1,141,000 | 254,300 | 17% | 11% | 18% | 54% |
| California | 16,441,200 | 3,166,400 | 17% | 7% | 19% | 56% |
| Colorado | 2,624,000 | 431,800 | 19% | 8% | 20% | 53% |
| Connecticut | 1,550,700 | 248,300 | 18% | 12% | 17% | 53% |
| Delaware | 405,500 | 81,200 | 24% | 10% | 20% | 46% |
| DC | 350,500 | 40,800 | 12% | 5% | 25% | 58% |
| Florida | 8,552,300 | 1,885,700 | 20% | 8% | 21% | 50% |
| Georgia | 4,414,900 | 921,700 | 19% | 7% | 20% | 53% |
| Hawaii | 574,400 | 91,000 | 18% | 8% | 25% | 50% |
| Idaho | 705,100 | 171,000 | 21% | 9% | 17% | 53% |
| Illinois | 5,572,900 | 1,019,800 | 18% | 10% | 20% | 53% |
| Indiana | 2,870,300 | 581,800 | 17% | 11% | 19% | 53% |
| Iowa | 1,386,100 | 244,000 | 17% | 9% | 21% | 54% |
| Kansas | 1,235,100 | 258,000 | 17% | 9% | 19% | 55% |
| Kentucky | 1,771,900 | 402,200 | 19% | 10% | 18% | 53% |
| Louisiana | 1,794,400 | 439,900 | 19% | 12% | 23% | 46% |
| Maine | 568,100 | 98,000 | 16% | 12% | 19% | 53% |
| Maryland | 2,721,000 | 417,300 | 18% | 10% | 22% | 50% |
| Massachusetts | 3,101,700 | 435,400 | 19% | 9% | 20% | 52% |
| Michigan | 4,170,200 | 901,500 | 19% | 10% | 20% | 51% |
| Minnesota | 2,592,700 | 415,000 | 19% | 13% | 17% | 51% |
| Mississippi | 1,103,000 | 285,200 | 18% | 12% | 21% | 49% |
| Missouri | 2,586,200 | 527,200 | 20% | 12% | 19% | 49% |
| Montana | 440,200 | 94,200 | 17% | 8% | 25% | 50% |
| Nebraska | 840,100 | 155,400 | 19% | 9% | 19% | 54% |
| Nevada | 1,292,100 | 258,400 | 19% | 5% | 28% | 48% |
| New Hampshire | 613,900 | 93,300 | 27% | 8% | 19% | 46% |
| New Jersey | 3,956,800 | 634,800 | 20% | 9% | 17% | 54% |
| New Mexico | 771,400 | 207,500 | 17% | 9% | 23% | 51% |
| New York | 8,331,500 | 1,421,500 | 19% | 12% | 18% | 52% |
| North Carolina | 4,301,100 | 911,800 | 19% | 8% | 21% | 52% |
| North Dakota | 342,400 | 52,500 | 20% | 11% | 18% | 50% |
| Ohio | 4,989,400 | 1,005,300 | 18% | 12% | 21% | 50% |
| Oklahoma | 1,568,300 | 367,400 | 21% | 10% | 19% | 50% |
| Oregon | 1,761,000 | 334,900 | 18% | 9% | 20% | 53% |
| Pennsylvania | 5,461,800 | 1,034,700 | 19% | 11% | 19% | 51% |
| Rhode Island | 463,300 | 74,800 | 20% | 12% | 21% | 48% |
| South Carolina | 2,038,500 | 455,400 | 19% | 9% | 22% | 50% |
| South Dakota | 375,800 | 77,500 | 18% | 9% | 19% | 53% |
| Tennessee | 2,752,600 | 613,500 | 19% | 8% | 20% | 52% |
| Texas | 11,903,600 | 2,580,700 | 19% | 9% | 20% | 52% |
| Utah | 1,322,900 | 277,300 | 17% | 9% | 16% | 58% |
| Vermont | 268,200 | 43,600 | 17% | 9% | 17% | 58% |
| Virginia | 3,690,700 | 655,500 | 19% | 8% | 20% | 53% |
| Washington | 3,293,800 | 537,700 | 18% | 9% | 19% | 54% |
| West Virginia | 665,400 | 148,200 | 22% | 13% | 23% | 42% |
| Wisconsin | 2,619,600 | 446,500 | 18% | 11% | 17% | 54% |
| Wyoming | 251,500 | 55,600 | 19% | 9% | 23% | 49% |
| Note: “Workers” includes nonelderly adults earning at least $1000 in past year and working at least 20 hours per week in a usual week working. “Low Wage Workers” includes workers in bottom quintile of earners.Source: KFF analysis of 2018 American Community Survey, 1-Year Estimates. | ||||||
Endnotes
- This analysis limits u201cworkersu201d to people who earned at least $1,000 during the past year and worked at least 20 hours in a typical week when working. ↩︎
- KFF analysis of 2018 American Community Survey, 1-Year Estimates. ↩︎
- KFF analysis of 2018 National Health Interview Survey. ↩︎
- KFF analysis of 2019 Current Population Survey. ↩︎
- Ibid. ↩︎
- Notably, eligibility for marketplace subsidies (but not Medicaid) includes the new federal supplemental unemployment insurance benefits recently enacted by Congress for people affected by COVID-19. This supplemental benefit could lead some unemployed low-wage workers who previously were in the u201ccoverage gapu201d (income below poverty but above state Medicaid limits) to have income above poverty, making them newly eligible for Marketplace subsidies. ↩︎
- KFF analysis of 2018 American Community Survey, 1-Year Estimates. ↩︎
- KFF analysis of 2018 National Health Interview Survey. ↩︎
- Ibid. ↩︎
- KFF analysis of 2018 American Community Survey, 1-Year Estimates. ↩︎
- KFF analysis of 2018 National Health Interview Survey. ↩︎
- All data in this paragraph based on KFF analysis of 2018 National health Interview Survey. ↩︎