Coverage Expansions and the Remaining Uninsured: A Look at California During Year One of ACA Implementation
Who gained coverage and who remained uninsured?
In many ways, the “newly insured” population (those who gained coverage in 2014 and were uninsured before gaining that coverage) and “remaining uninsured” population (those who lacked coverage in fall 2014) resemble each other. For example, they are similar with respect to income, age, and health status, and they have different characteristics from the “previously insured” population (people who had coverage before 2014 and still had it in 2014). These patterns likely reflect the characteristics of the population that has historically lacked coverage. However, the insured and uninsured populations in California differ on some important factors, such as race/ethnicity, work status, gender, immigration status, and family status. These differences are important to understanding who was left out of coverage expansions in 2014 and targeting ongoing outreach to the remaining uninsured.
More than half of the newly insured and remaining uninsured populations have family income at or below 138% of poverty, the income range for the Medicaid expansion. As was the case before 2014,1 more than half of uninsured adults (51%) have family incomes at or below 138% of poverty, or about $27,000 for a family of three. Over a third (35%) has family incomes in the range for tax credits (139 to 400% of poverty). This distribution is similar to the newly insured population, the vast majority of whom (94%) had incomes in the range for financial assistance under the ACA. In contrast, the previously insured population is significantly less likely than either the uninsured or newly insured to be low-income and significantly more likely to be higher income (greater than 400% of poverty). This pattern reflects the longstanding association between having low income and lacking insurance coverage. Provisions in the ACA aim to make coverage more affordable for low and middle-income families.
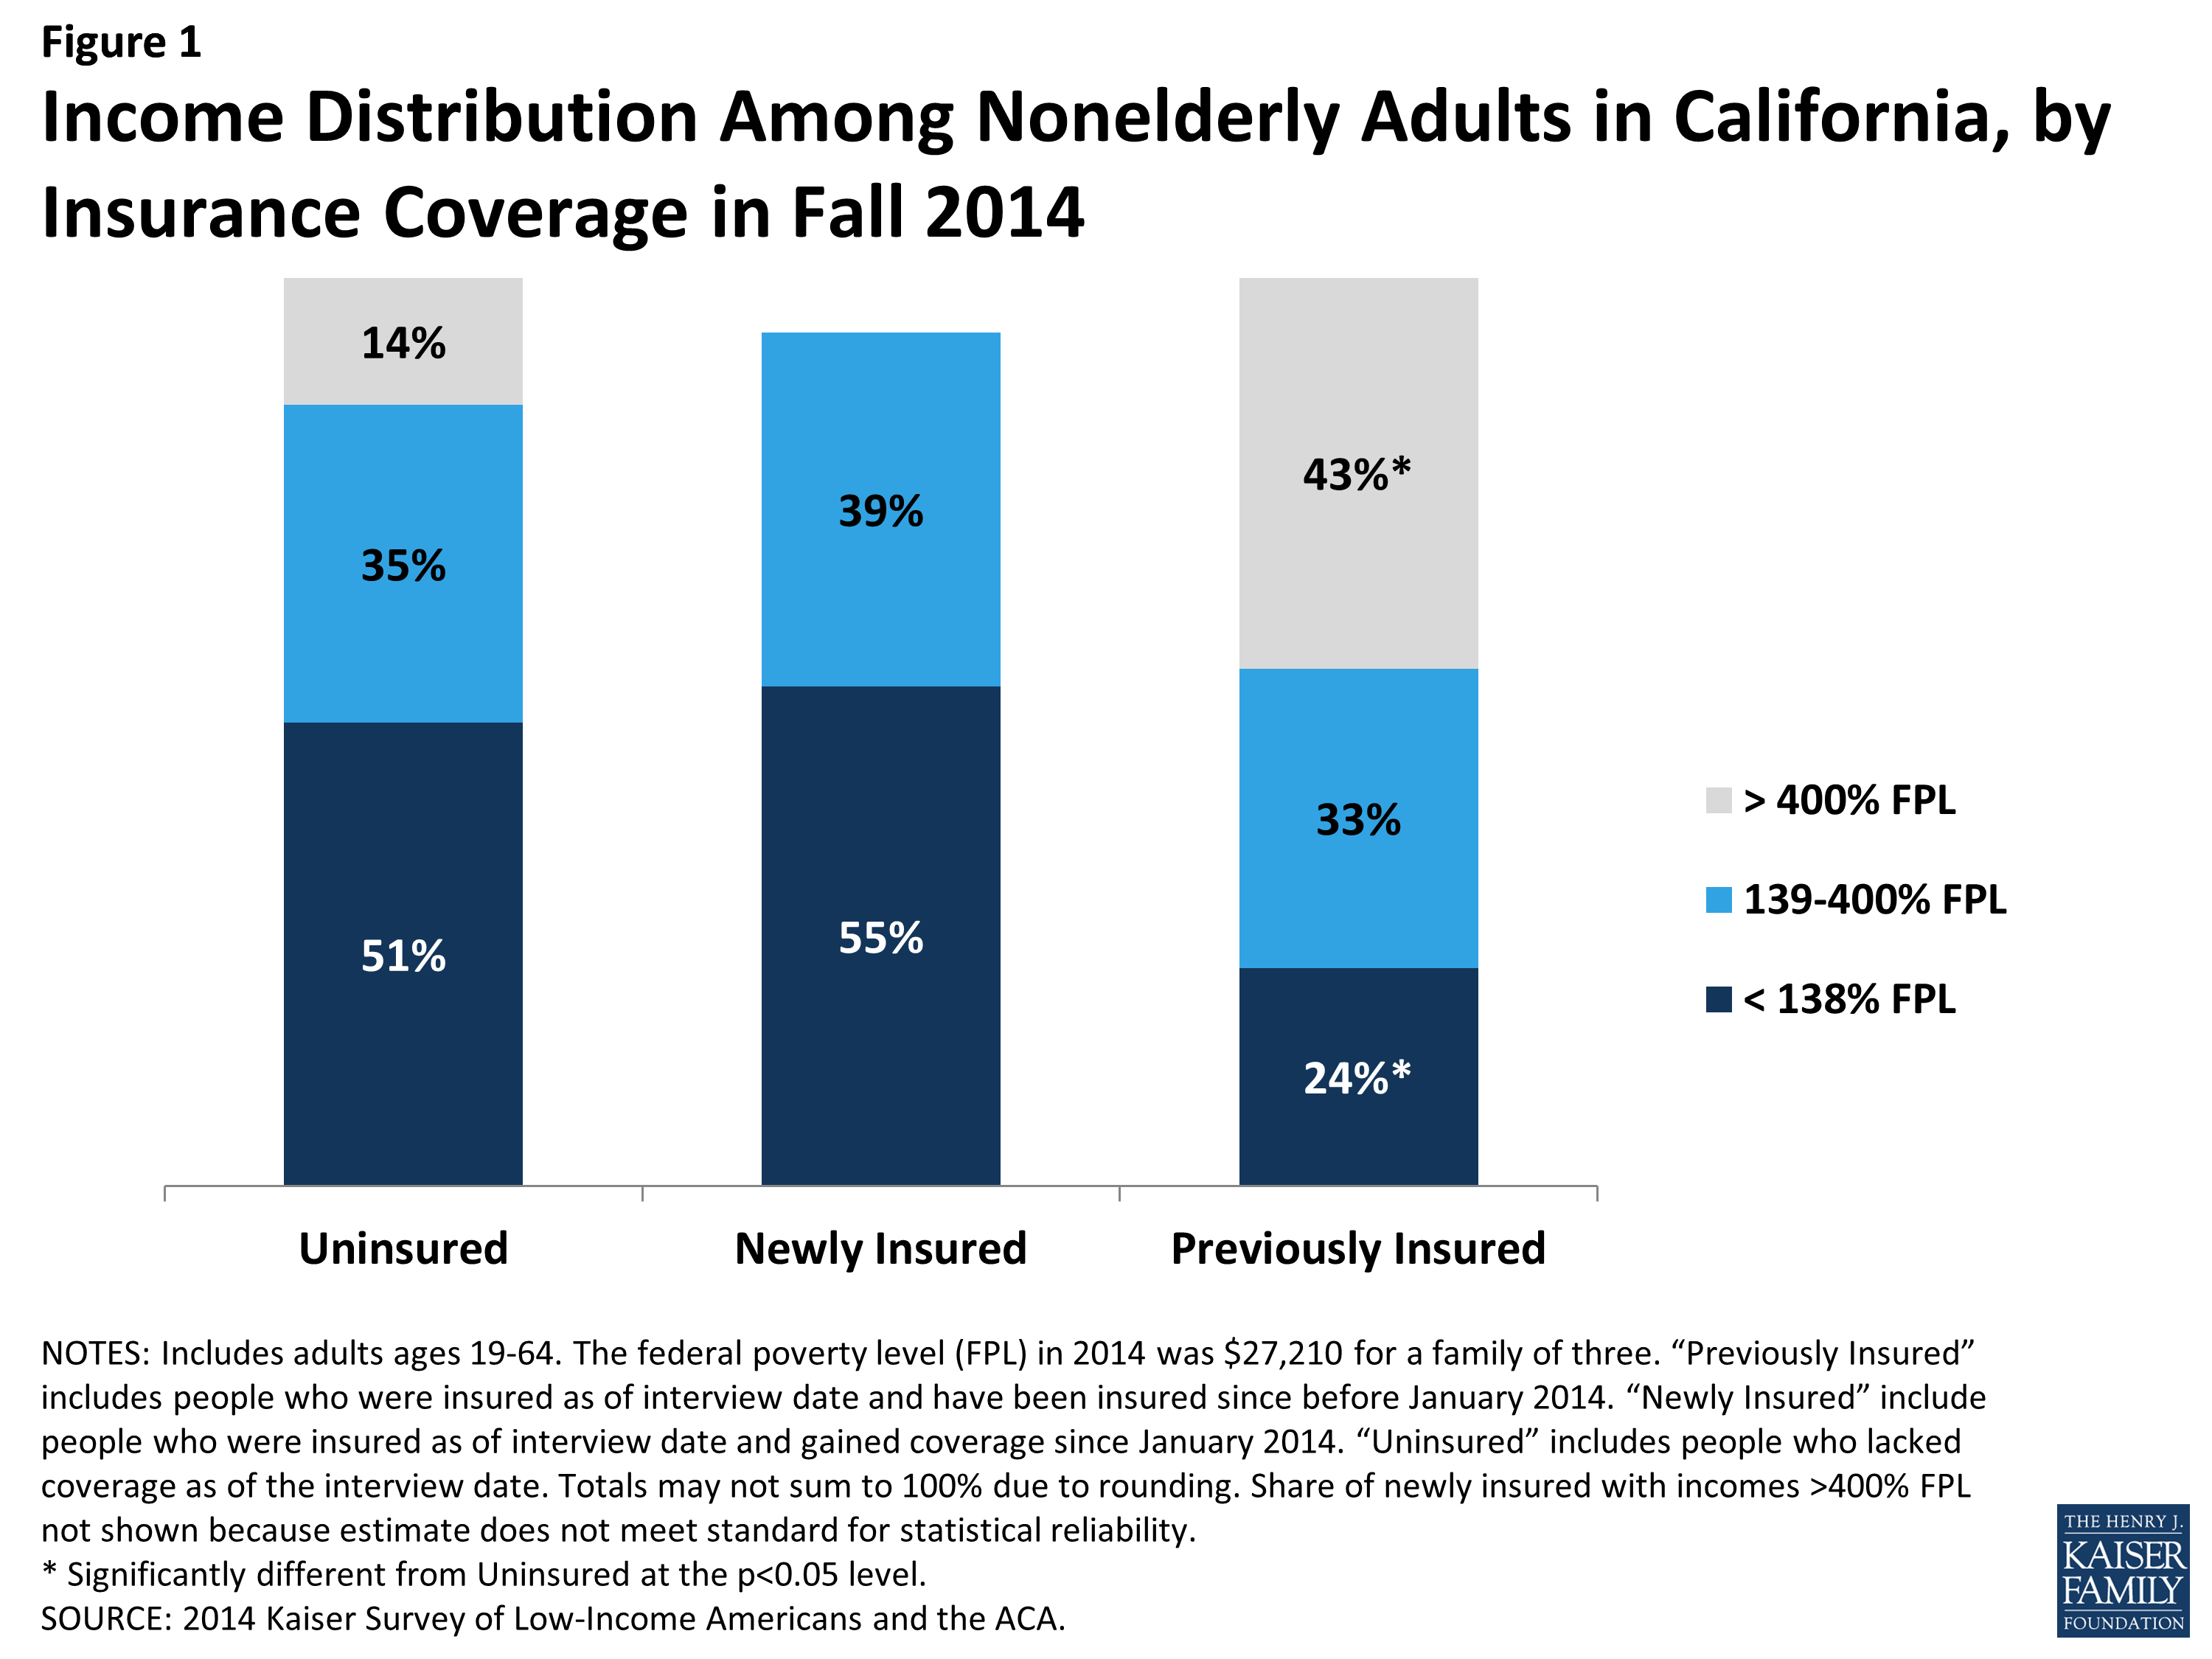
Figure 1: Income Distribution Among Nonelderly Adults in California, by Insurance Coverage in Fall 2014
A majority of both the remaining uninsured and newly insured are in a family with at least one worker. Nearly three quarters of uninsured adults are in a family in which either they or their spouse is working, a pattern that has held since before the ACA.2 More than half (52%) are in a family with a full-time worker. While there is no difference in the share of newly insured adults in a working family overall, newly insured adults are less likely than remaining uninsured adults to be in a family with a full-time worker. Those who have been insured since before 2014 are more likely to have a full-time worker and less likely to have a part-time worker in the family. These patterns reflect the historical ties between work and health insurance, since most people who had coverage before the ACA obtained that coverage through a job. With new coverage provisions in place as of 2014, there were more options for health insurance outside employment, and groups traditionally left out of the employer based system—such as part-time workers or low-wage workers—had new avenues for coverage.
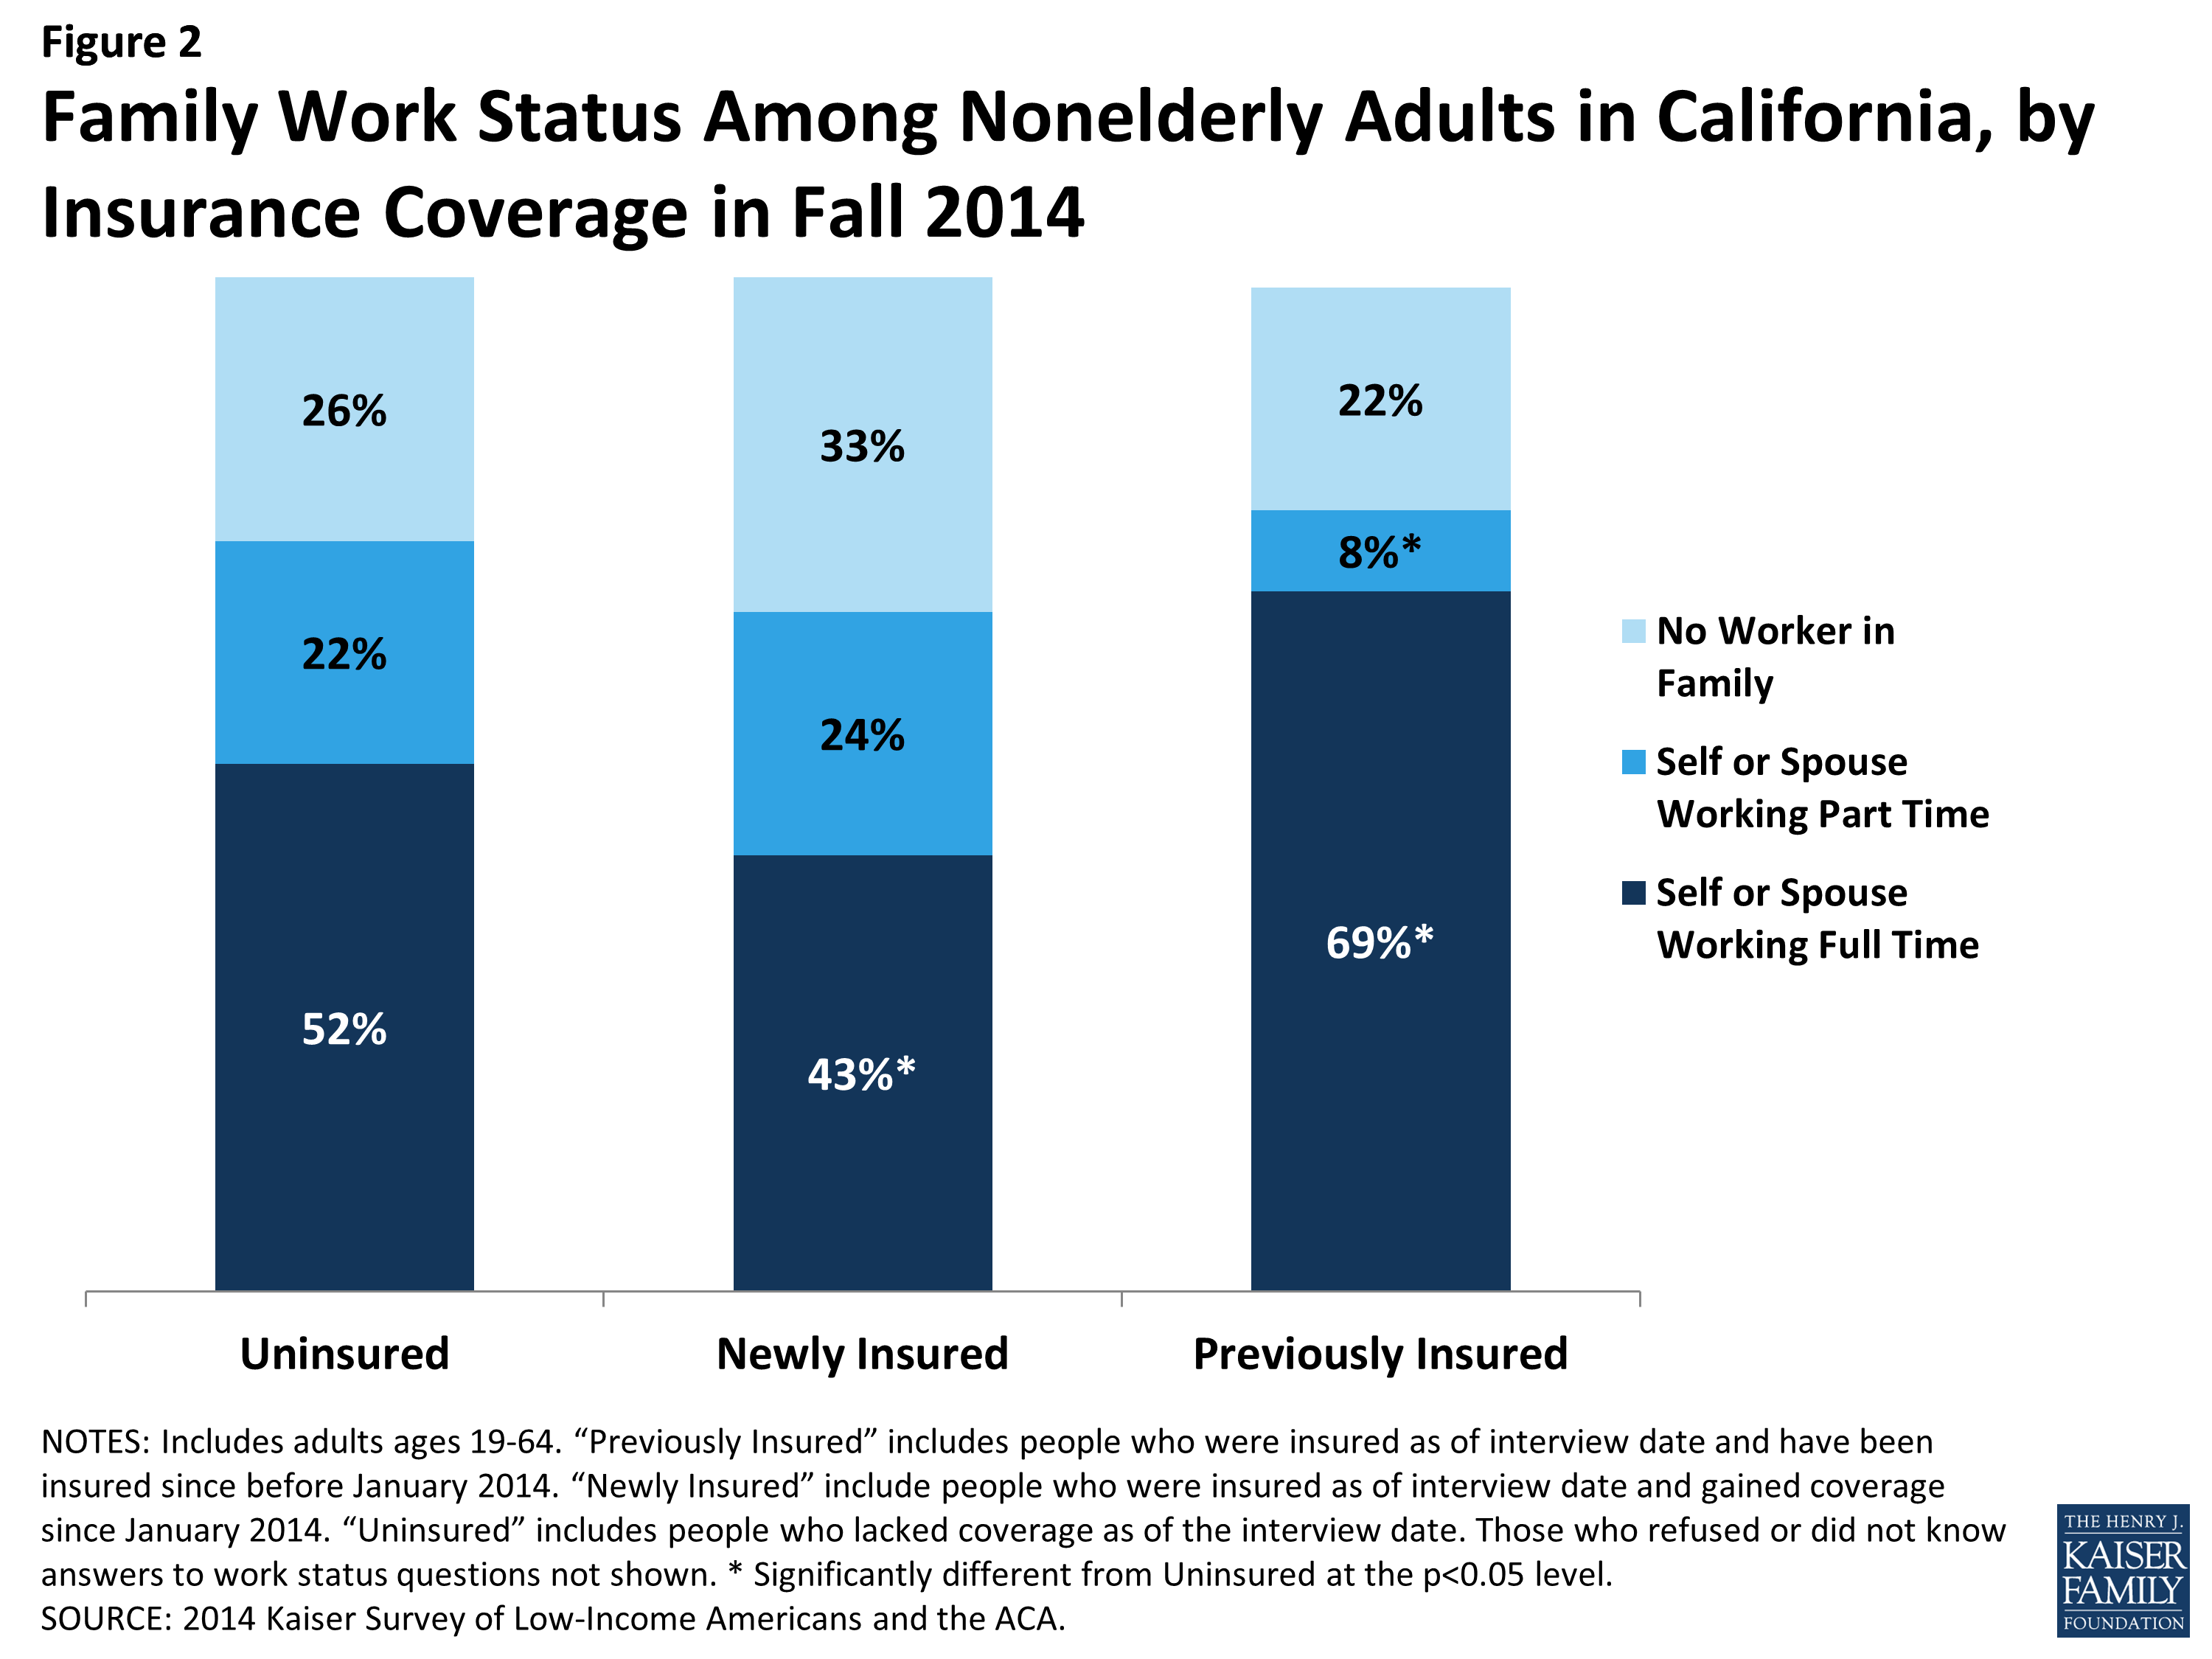
Figure 2: Family Work Status Among Nonelderly Adults in California, by Insurance Coverage in Fall 2014
Hispanics are disproportionately represented among the remaining uninsured population. Reflecting historical patterns of the uninsured being more likely to be people of color than the insured,3 the remaining uninsured and the newly insured are both more likely than the previously insured to be Hispanic and less likely to be White. However, the remaining uninsured population is more likely to be Hispanic than either the newly insured or previously insured population: 54% of the remaining uninsured population is Hispanic, a share significantly higher than among the newly insured or previously insured. This pattern likely reflects a combination of factors, including language barriers and immigration policy. Experts believe that lower enrollment among Hispanics may be related to the delay in having accurate Spanish-language enrollment materials.4 Another notable barrier was fear among some mixed-immigration status families that applying for coverage for eligible family members may expose other family members to risk of deportation. Last, the higher share of remaining uninsured who are Hispanic may reflect eligibility limits based on immigration status.
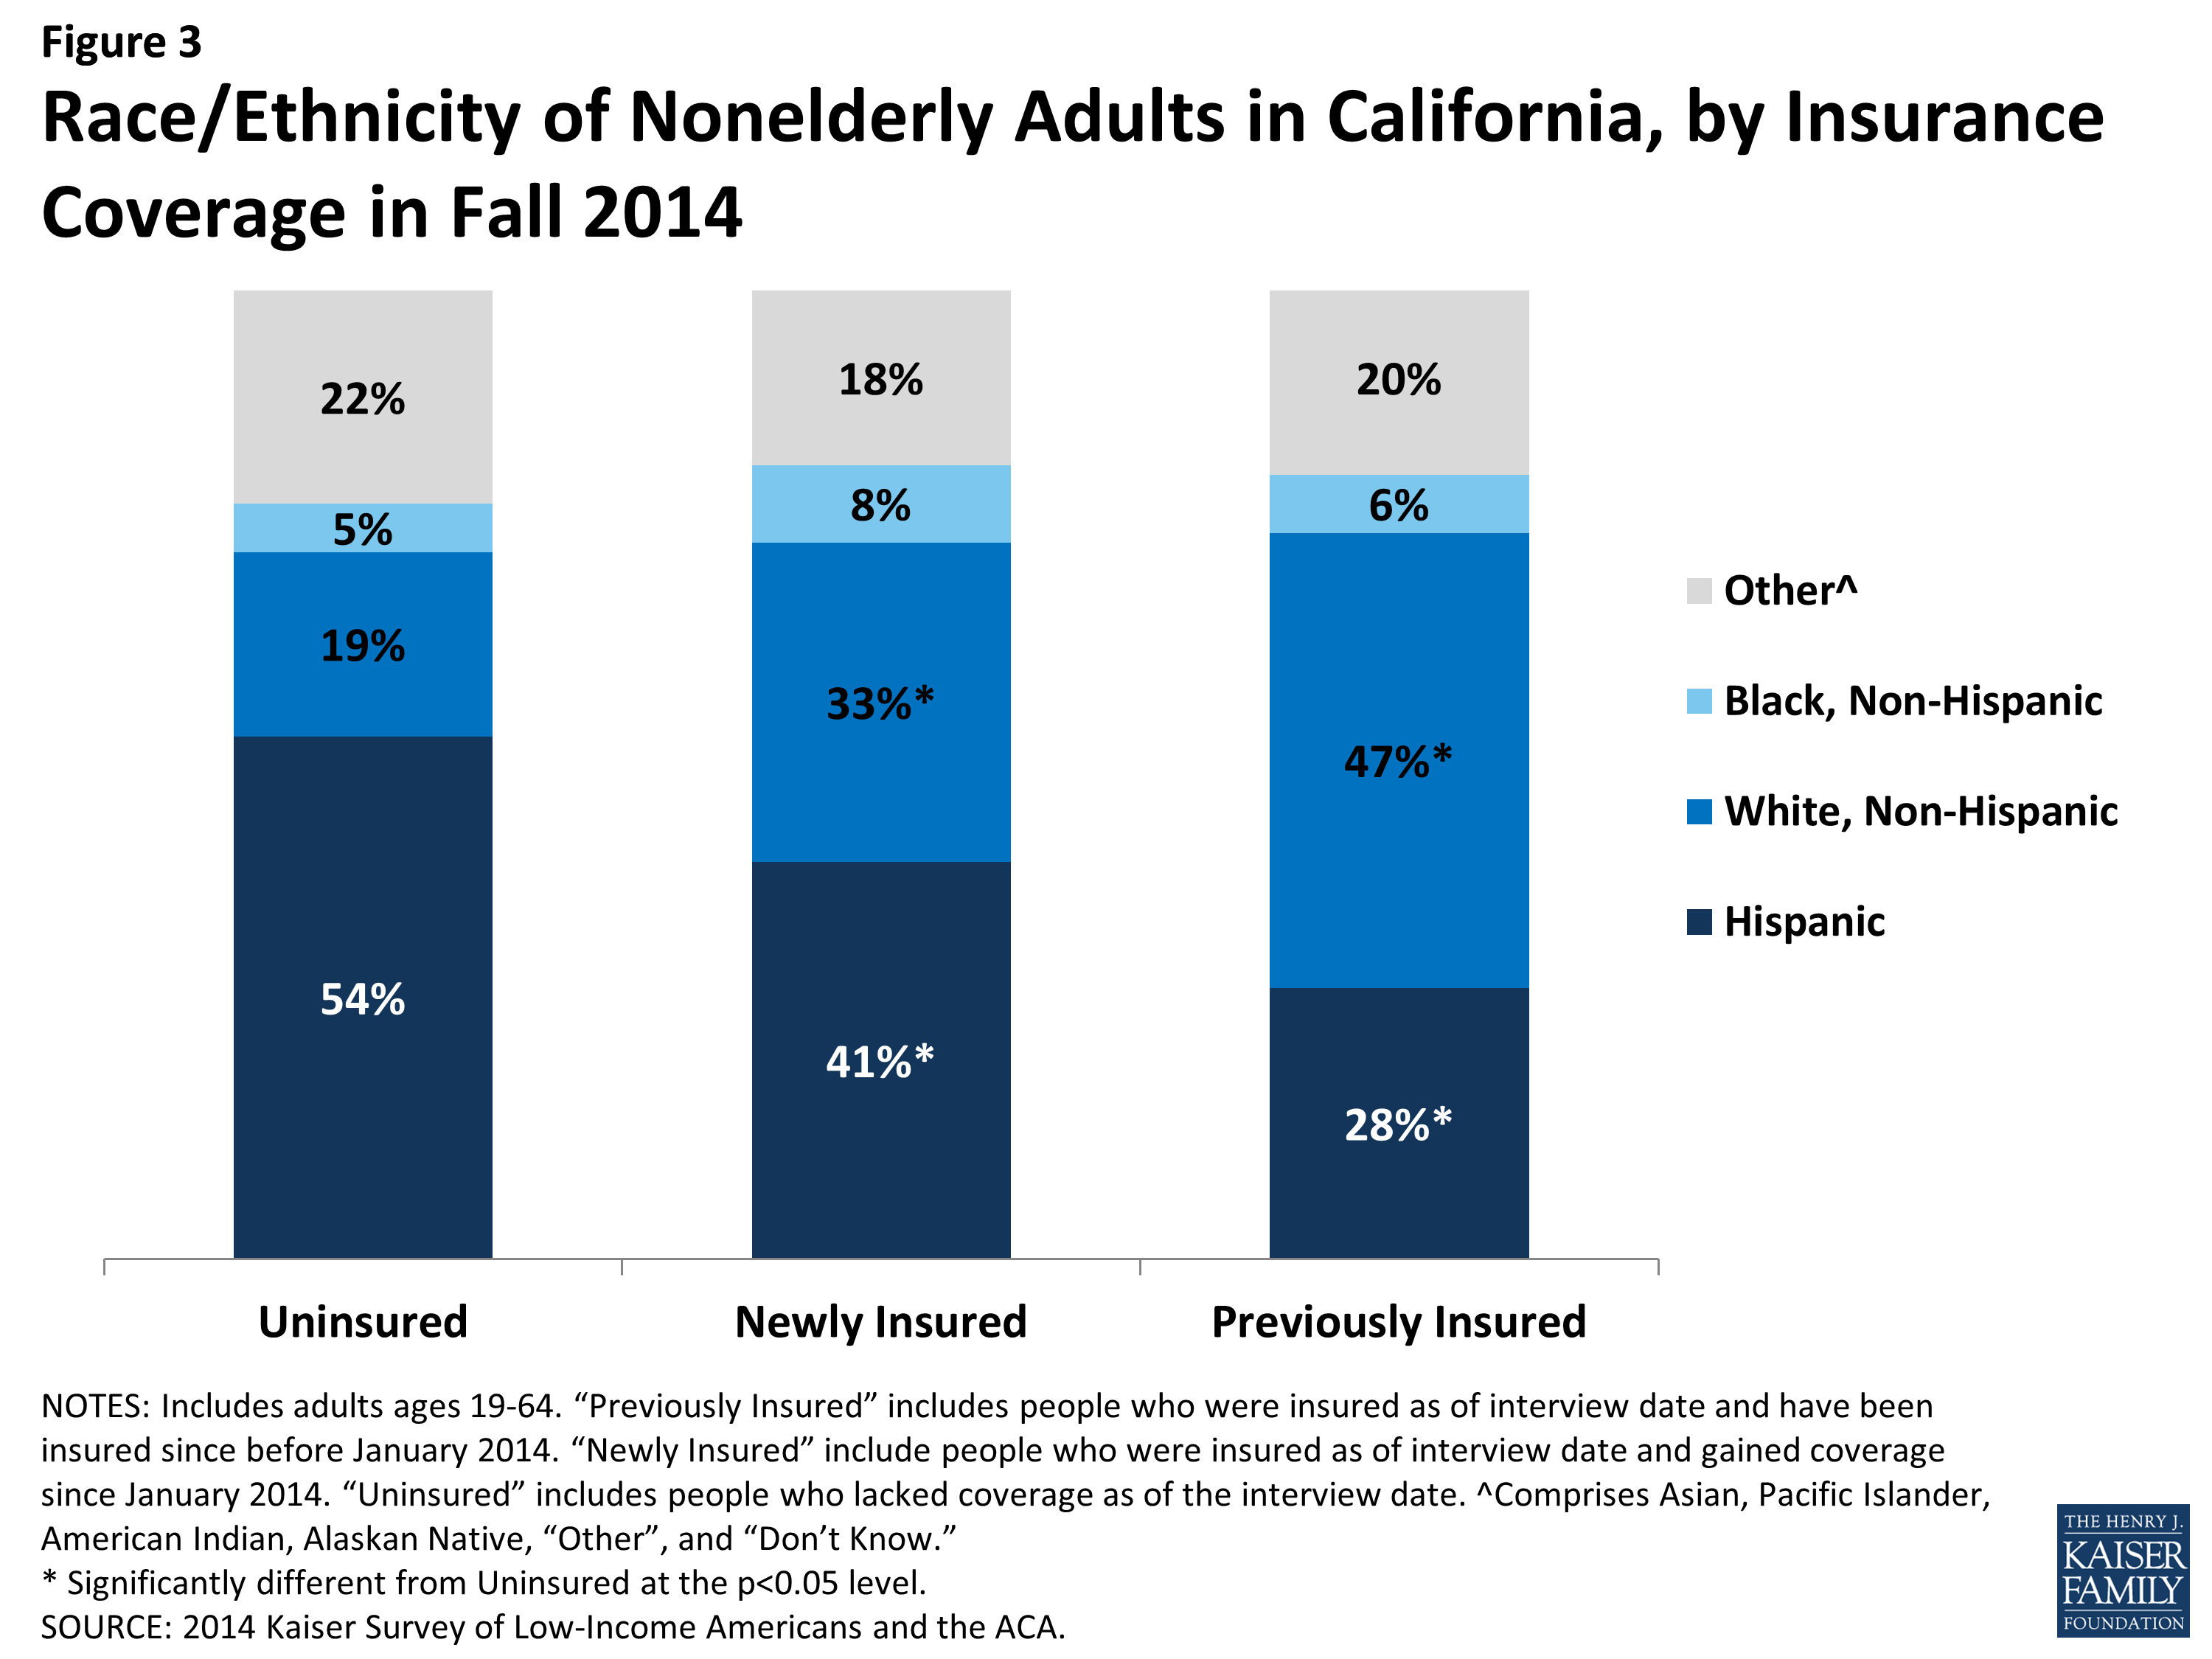
Figure 3: Race/Ethnicity of Nonelderly Adults in California, by Insurance Coverage in Fall 2014
The newly insured population is more likely to be female than their counterparts who remained without coverage. More than half (56%) of the newly insured population is female, a share significantly higher than that among the remaining uninsured (41%) but not significantly different from the previously insured. This pattern may reflect different take-up rates between men and women: Compared to 2013, the uninsured population in 2014 is more likely to be male.5 Women have historically had a lower uninsured rate than men, and the gender patterns in who gained coverage in California may reflect this historical and national pattern.6
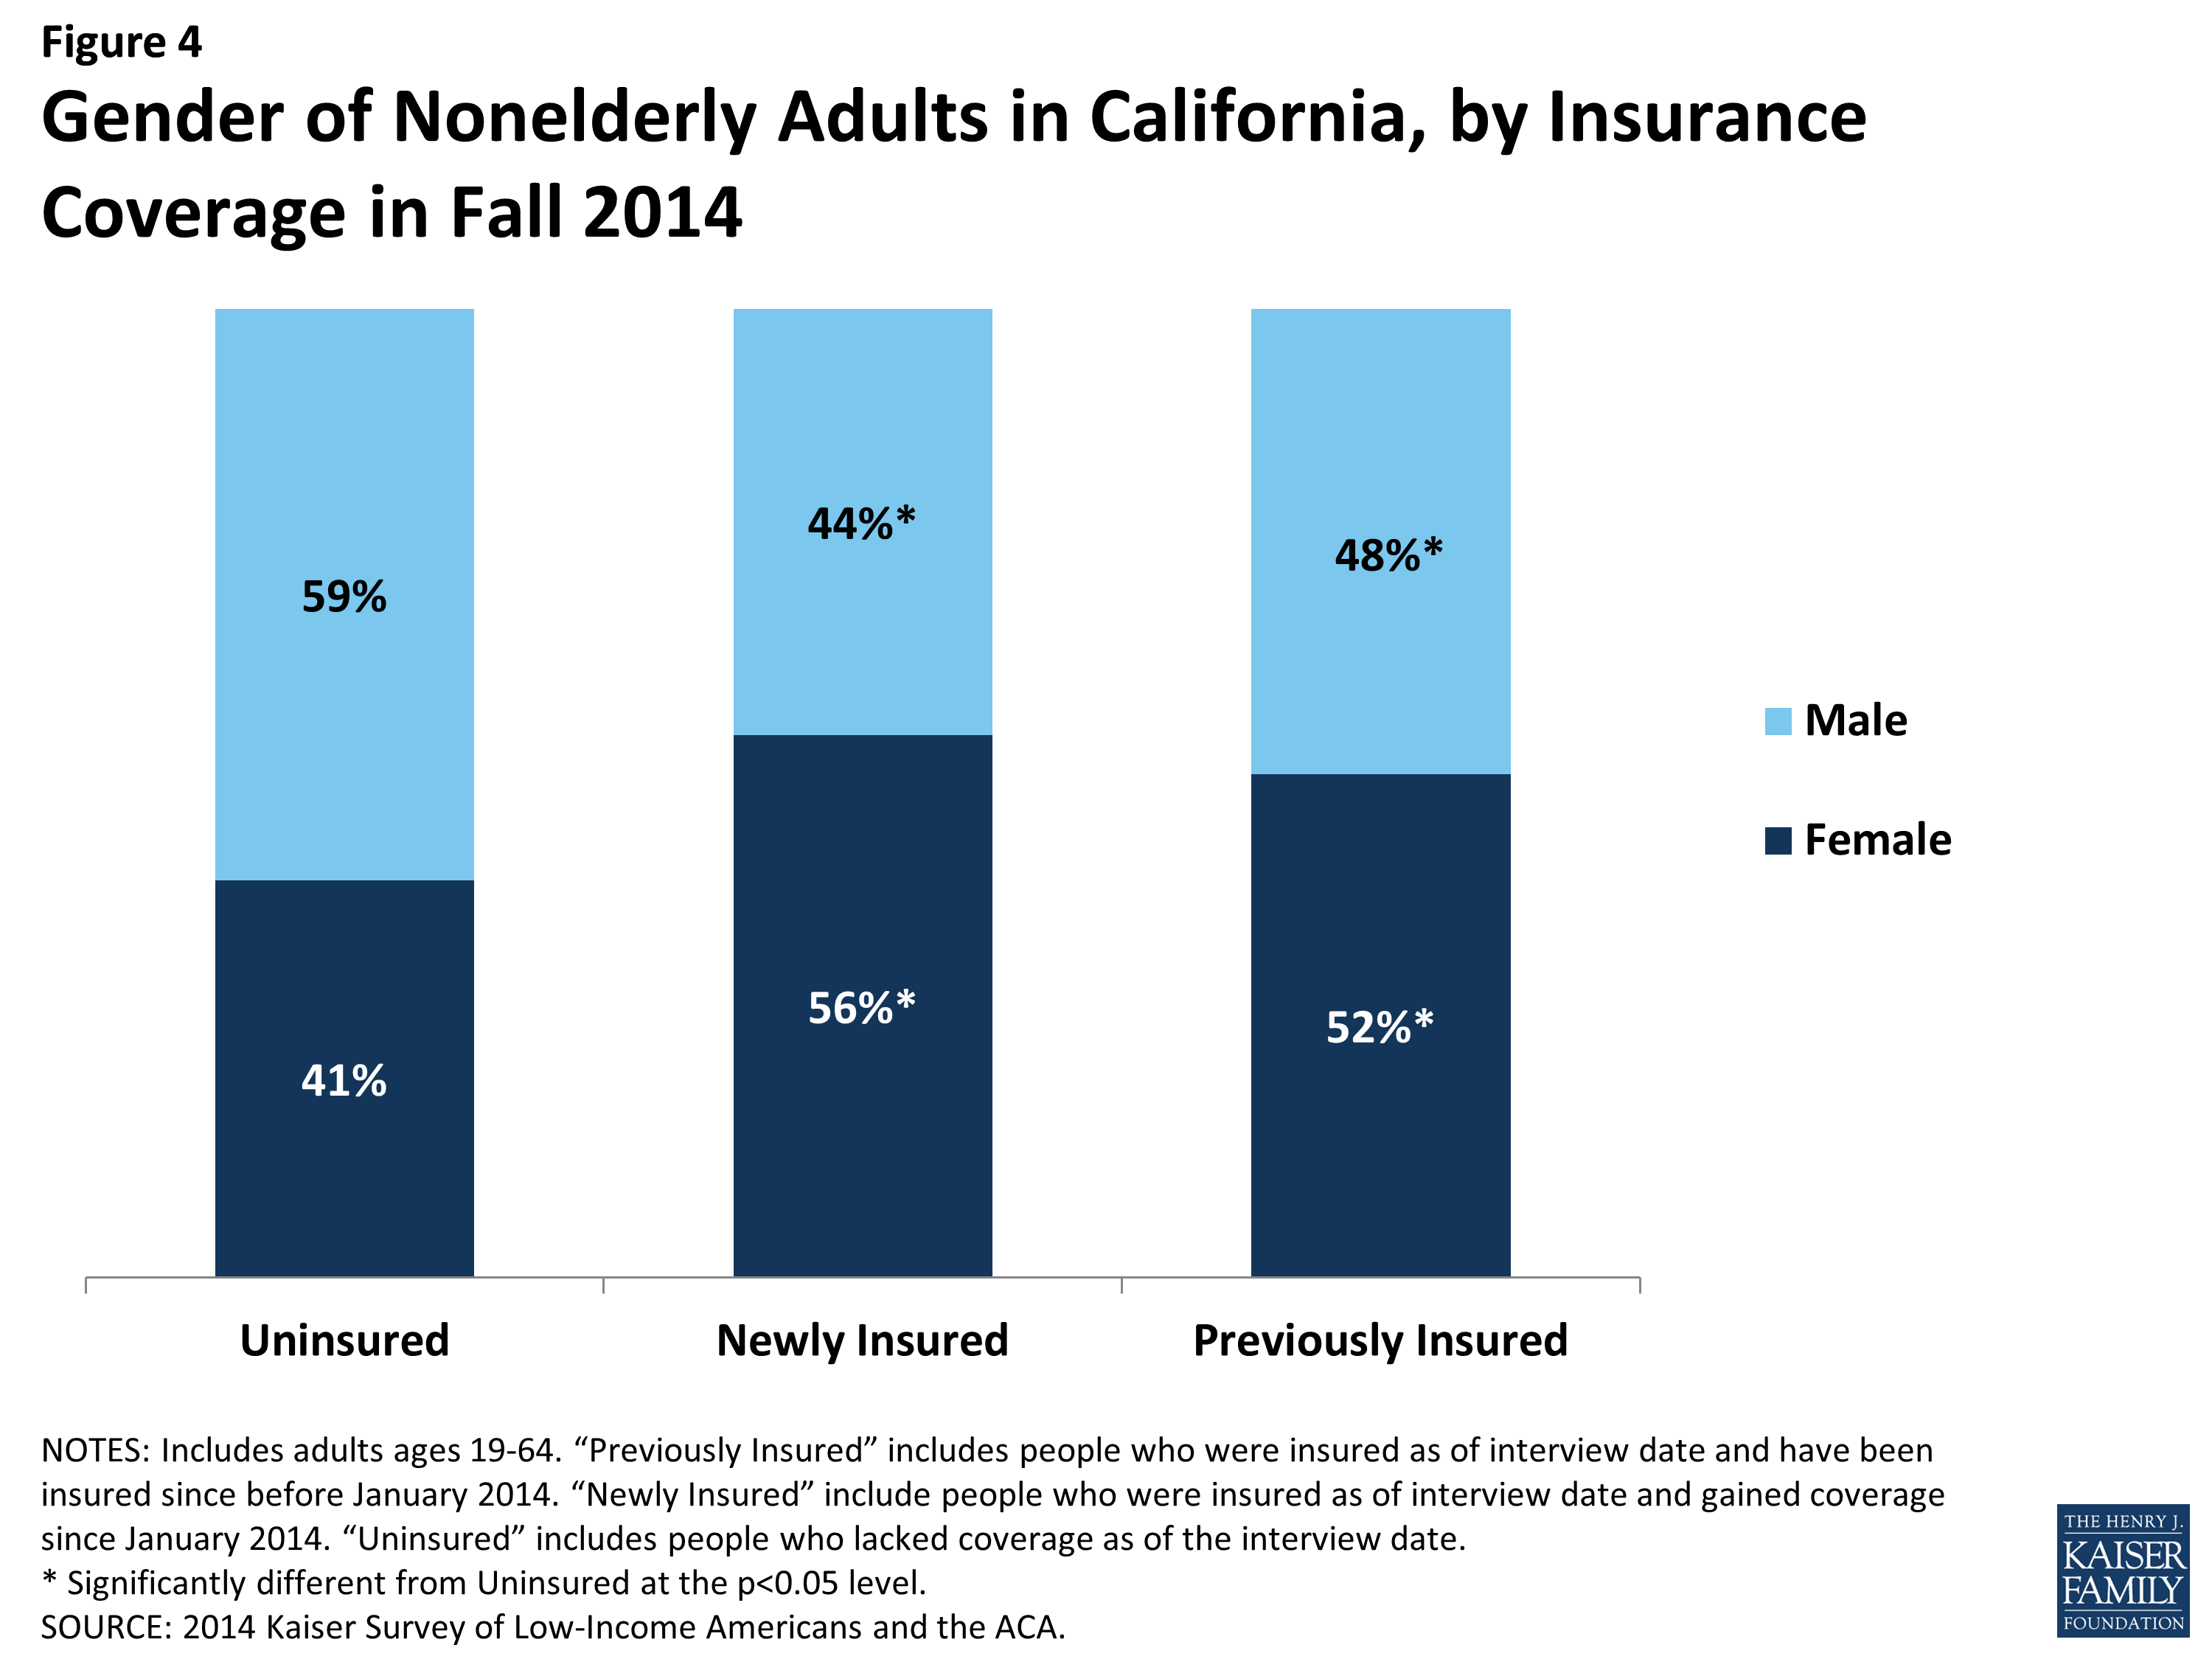
Figure 4: Gender of Nonelderly Adults in California, by Insurance Coverage in Fall 2014
The remaining uninsured population is of similar age distribution as adults who gained coverage in 2014. While many were concerned that younger adults would disproportionately opt not to enroll in coverage, the share of uninsured and newly insured who were young adults (age 19-25) were about the same, and the share of the uninsured who were young adults in 2014 was the same as in 2013.7 However, both the uninsured and the newly insured populations were younger than the group of adults who were previously insured. About a fifth of the uninsured (21%) and newly insured (22%) populations were young adults, ages 19 through 25, compared to just 13 percent of the previously insured. About half of the uninsured and about half of the newly insured were under age 35, compared to just 31 percent of the continuously insured. This pattern reflects the fact that those who lacked coverage prior to 2014 were more likely to be young, since younger adults have looser ties to employment and lower incomes.
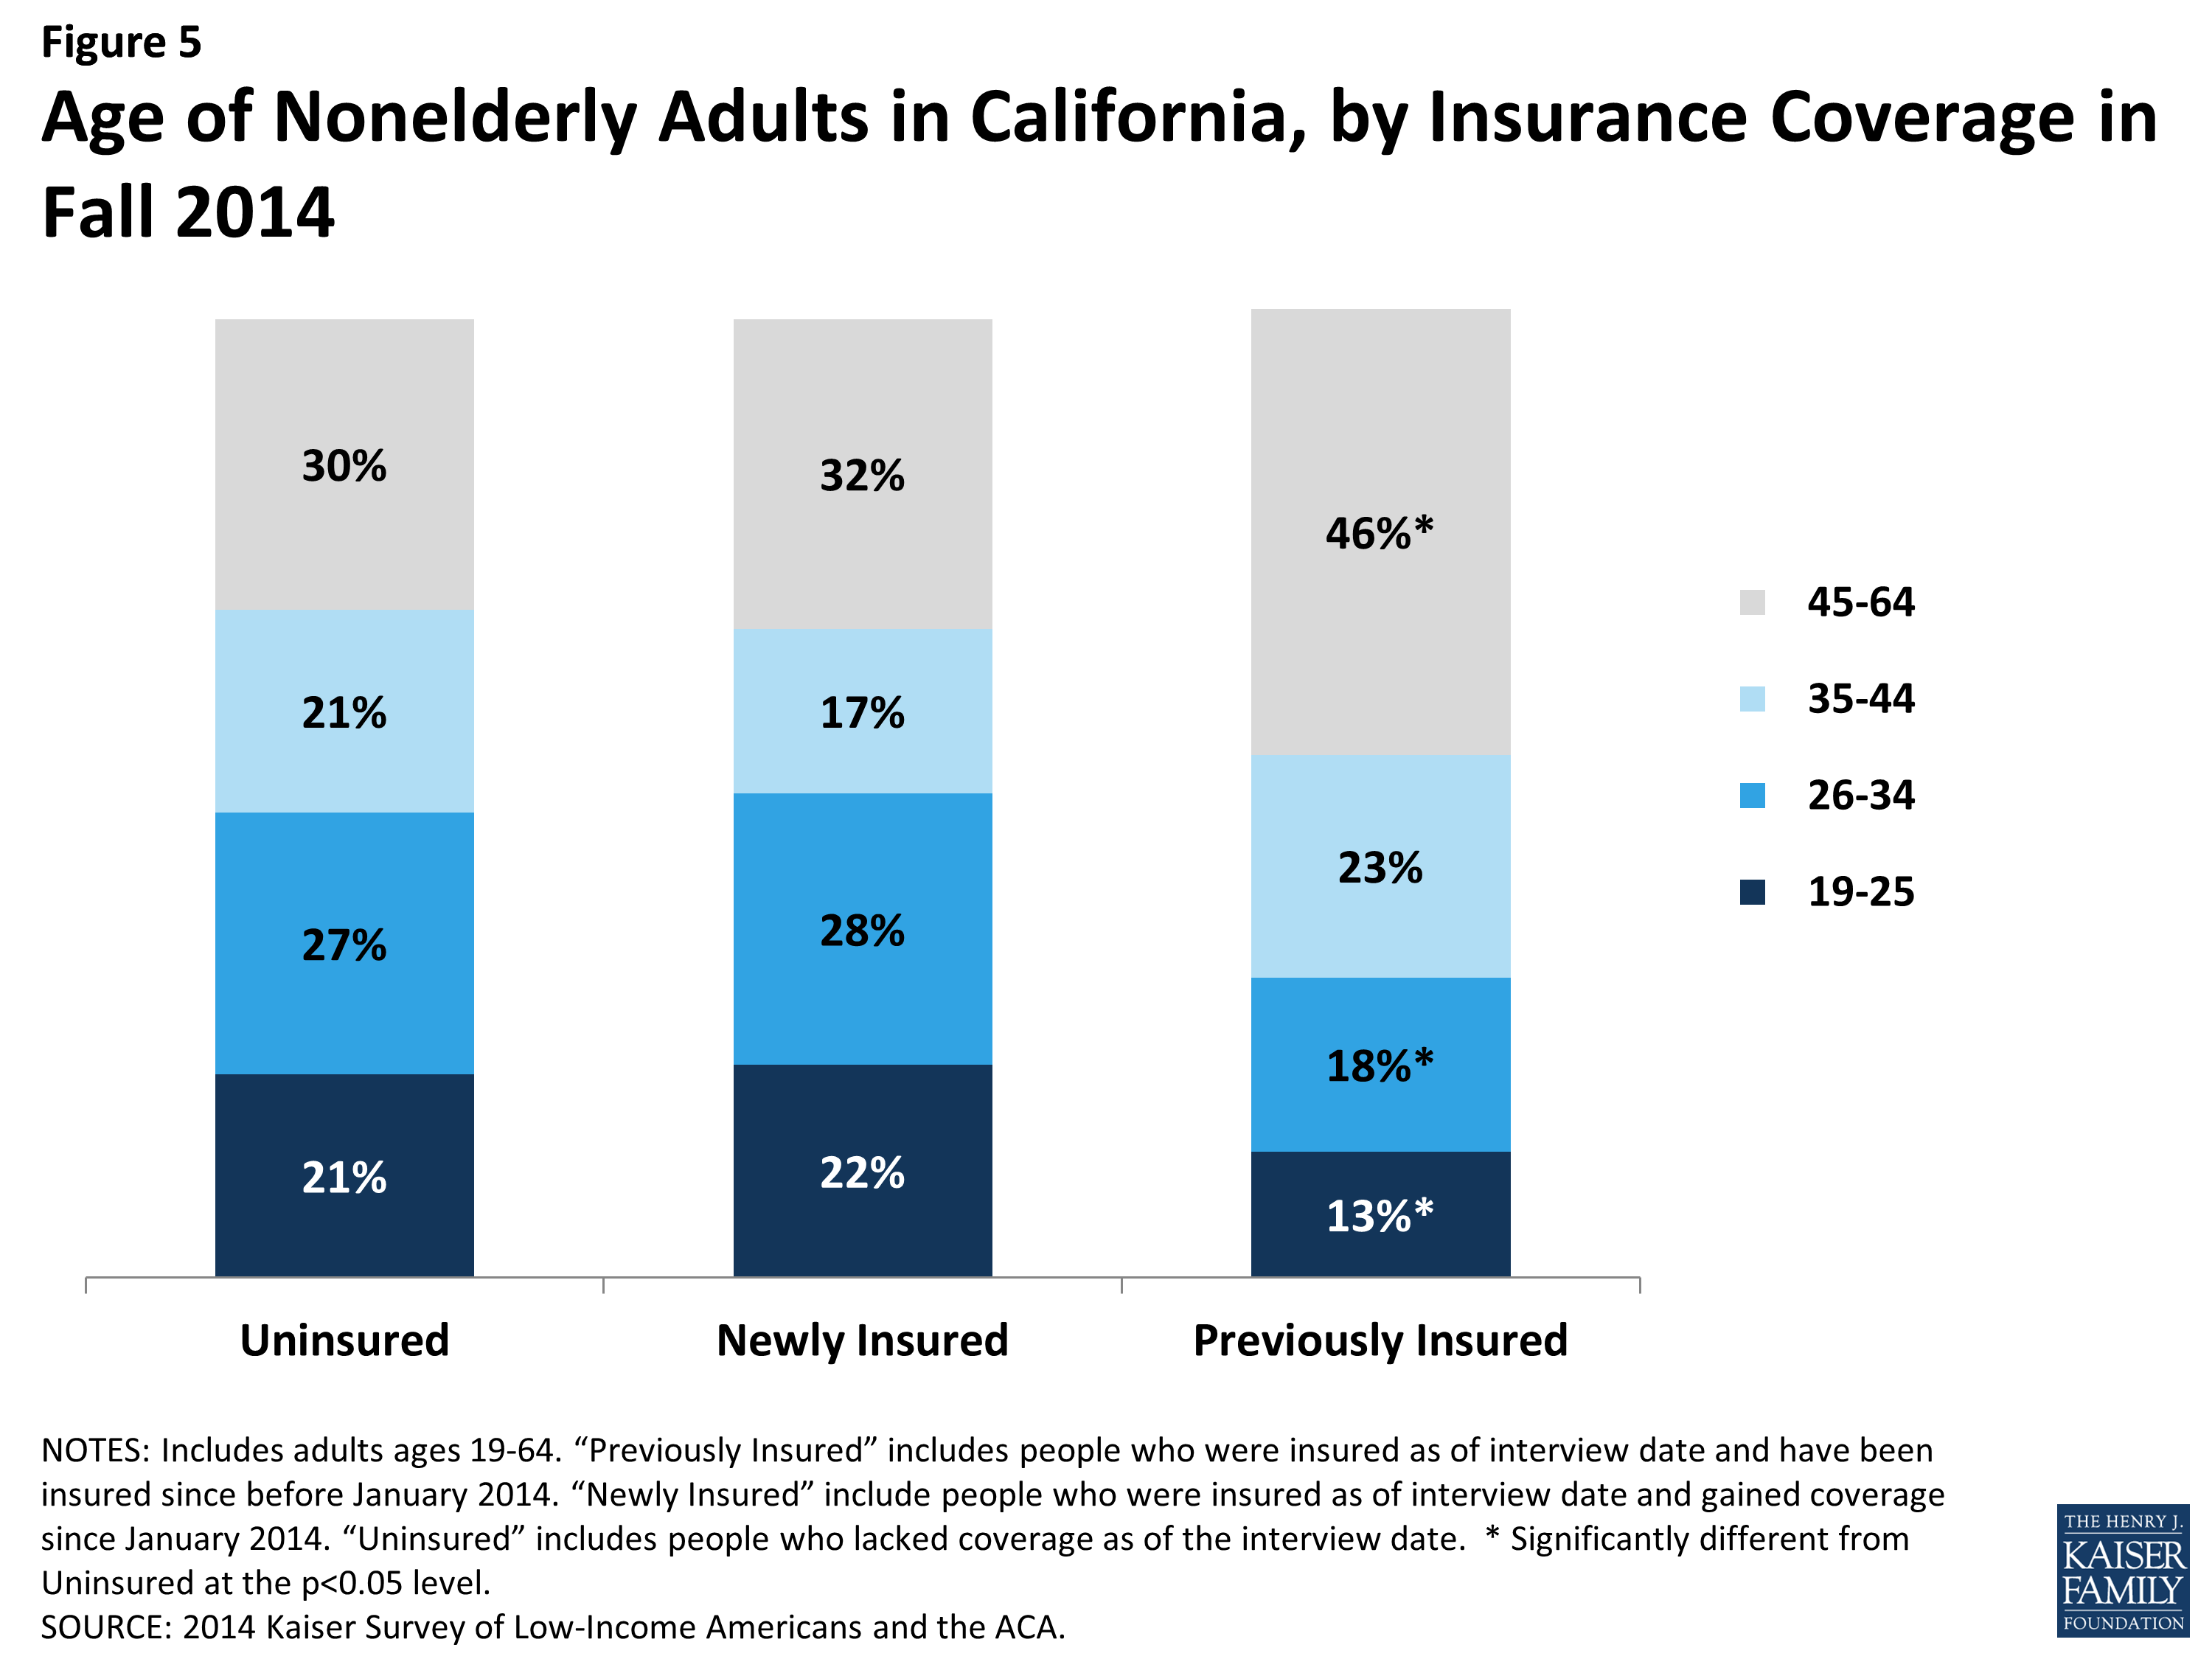
Figure 5: Age of Nonelderly Adults in California, by Insurance Coverage in Fall 2014
While there are no significant differences in the share of uninsured and newly insured adults who say their health is fair or poor, uninsured adults are less likely than adults with coverage to have a diagnosed medical condition. Compared to 2013, the uninsured in 2014 have a similar health profile;8 more than a third of uninsured adults (37%) and 30% of newly insured adults rate their overall health as fair or poor, in contrast to just 20% of previously insured adults. About a fifth (17% or uninsured and 23% of newly insured) report their mental health is fair or poor, compared to just 11% of the previously insured. However, the remaining uninsured are less likely than either the newly insured or previously insured to report being under care for a chronic condition: Insured adults are more likely than the uninsured to say that they have an ongoing medical condition that requires regular care, and both newly insured and previously insured adults are more likely than the uninsured to say they take a prescription on a regular basis. Comparing the newly insured and previously insured populations reveals that the previously insured are less likely to report fair/poor physical or mental health and are more likely to take a prescription. These patterns may reflect the fact that uninsured individuals are more likely than insured to have undiagnosed illnesses,9 and people with stable insurance coverage are more likely to receive regular and specialty care.10
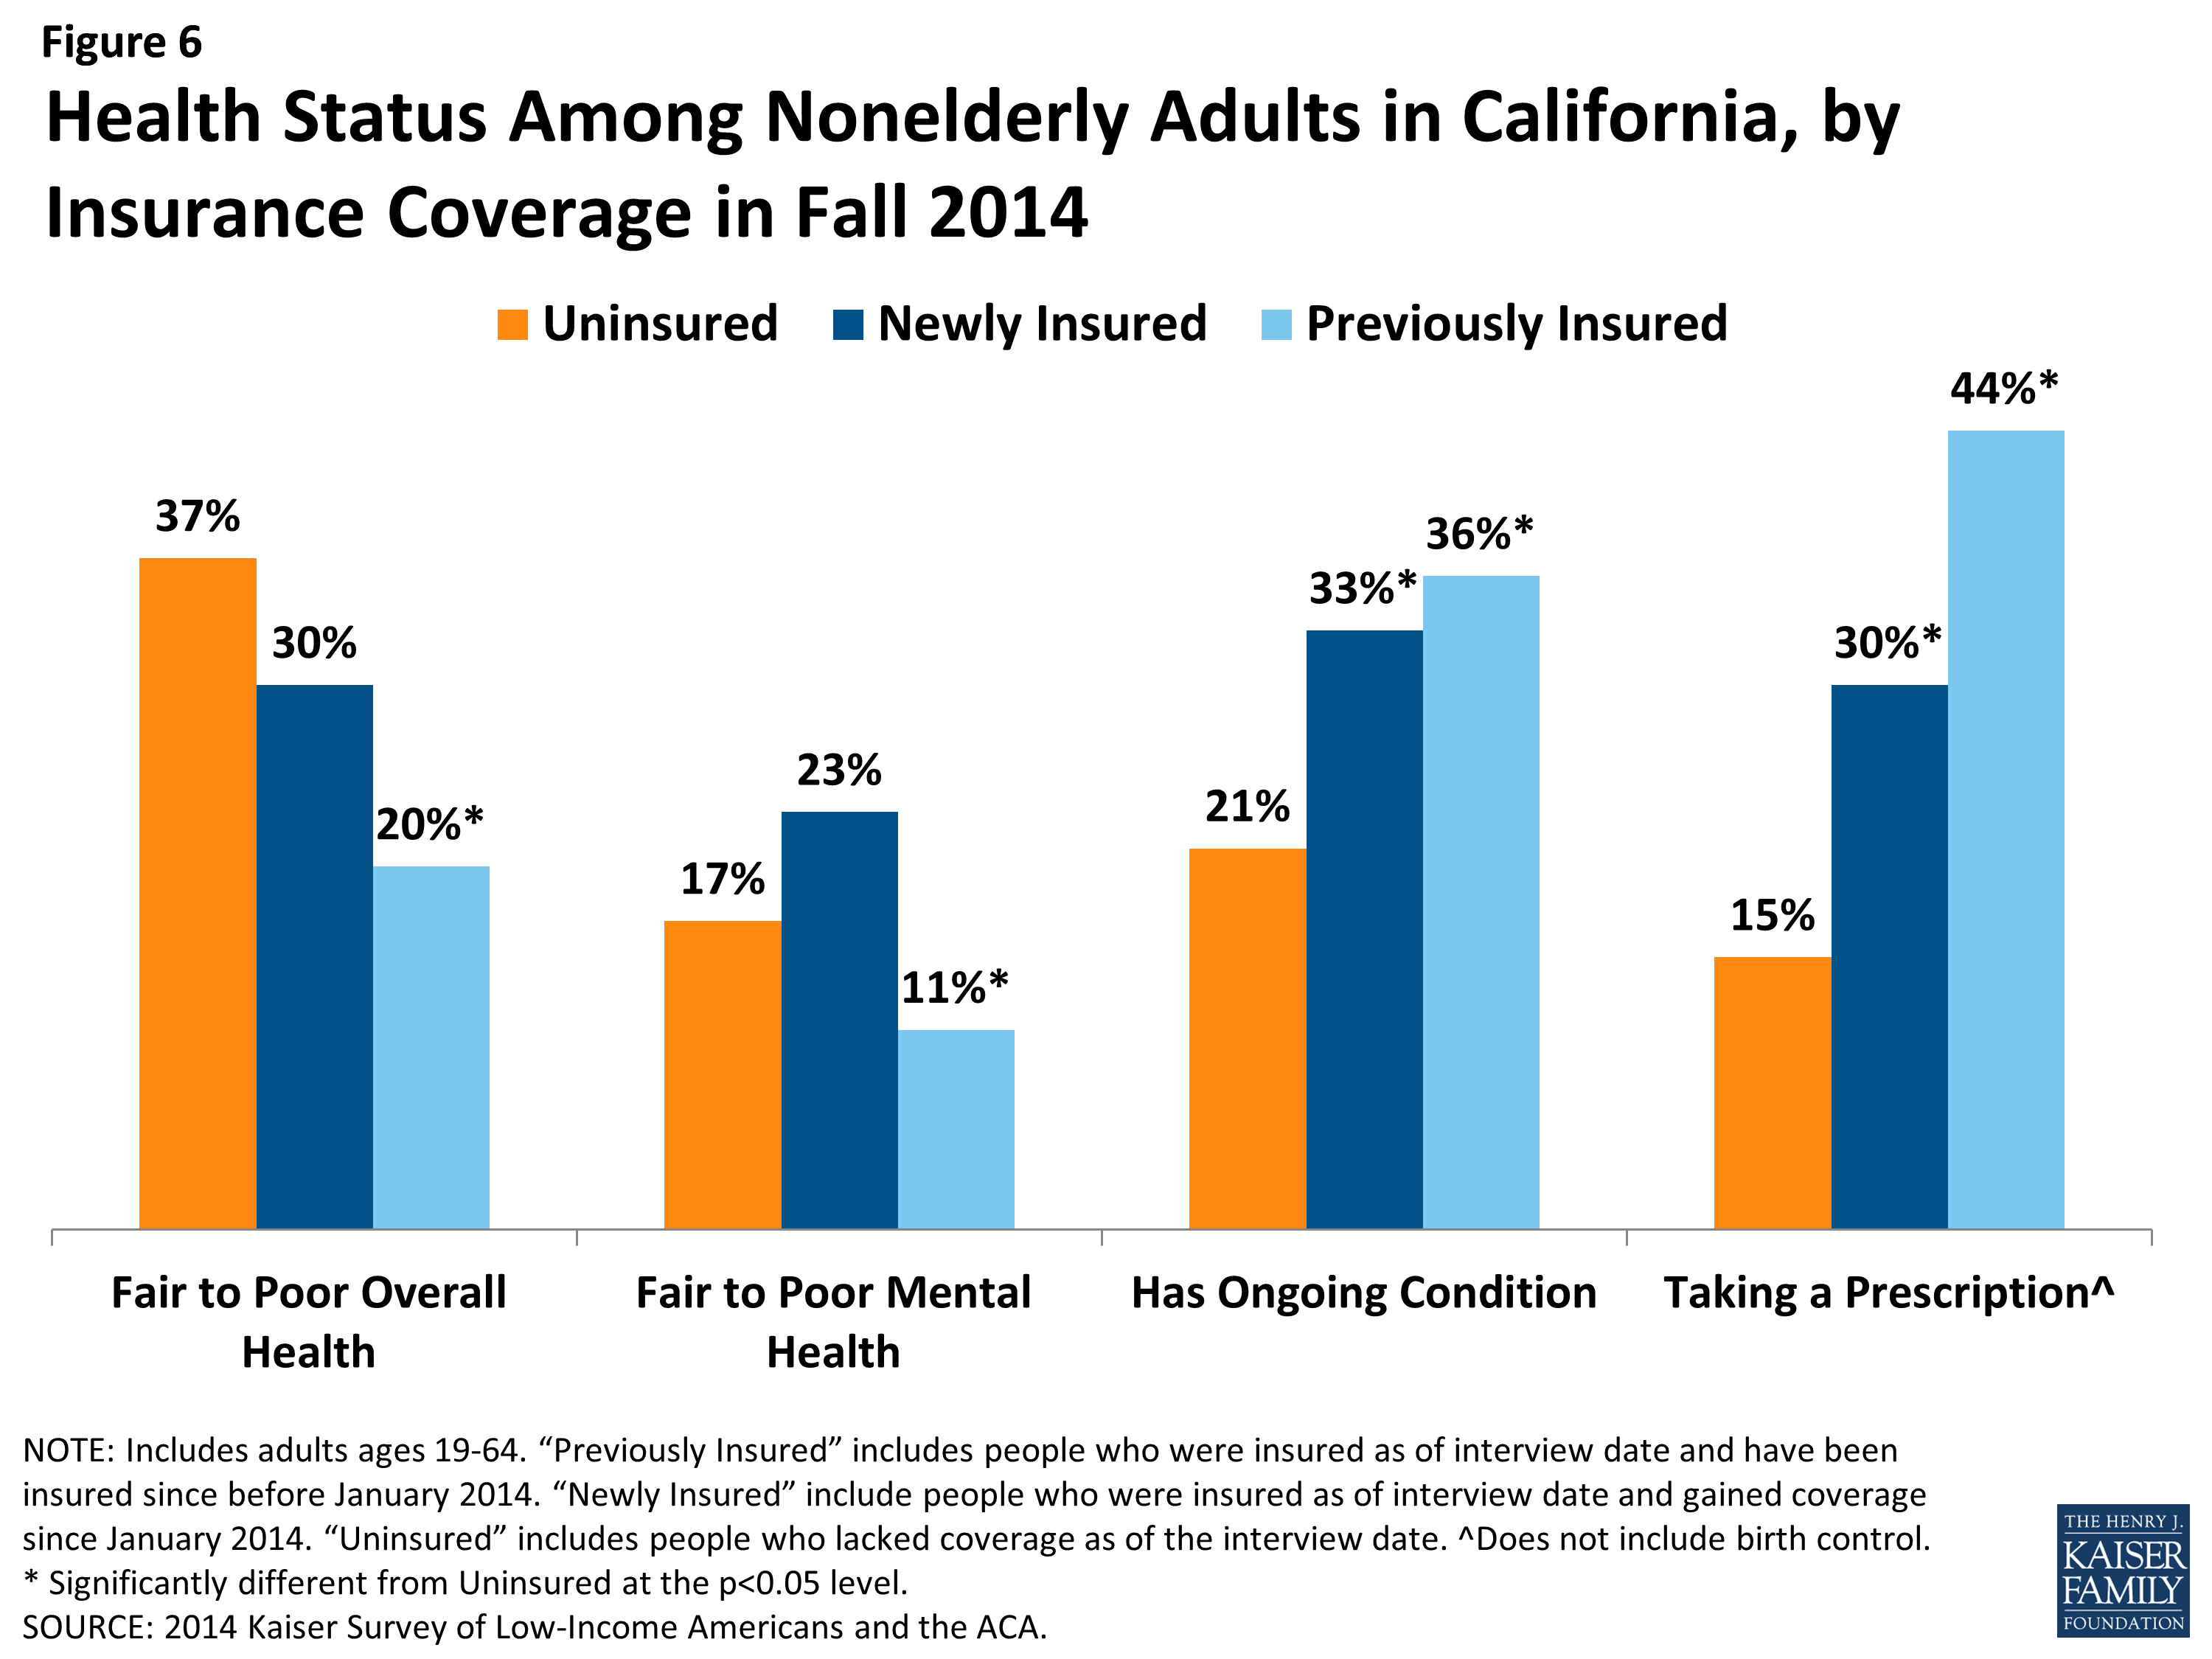
Figure 6: Health Status Among Nonelderly Adults in California, by Insurance Coverage in Fall 2014