Contraception in the United States: A Closer Look at Experiences, Preferences, and Coverage
Executive Summary
Contraceptive care is an important component of overall health care for many people. Federal and state policies shape access to and the availability of contraceptive care, but factors such as provider characteristics, as well as individual preferences and experiences also impact contraceptive choices and use. This report provides a close examination of reproductive age (18-49) females’ (including those who identify as women and other genders) experiences with contraception, insurance coverage, contraceptive preferences, and interactions with the health care system based on an analysis of the 2022 KFF Women’s Health Survey, a nationally representative survey of females ages 18 to 64 in the U.S.
Use of Contraceptives
The majority of females 18 to 64 (90%) have used contraception at some point in their reproductive years and many have used more than one contraceptive method throughout their lifetime (76%). People’s needs and preferences for different types of methods can change and speaks to the importance of having a broad range of contraceptive options available. Not surprisingly, most people use contraception to prevent pregnancy (85%), but four in ten also say that they use contraception for another reason such as managing a medical condition or preventing a sexually transmitted infection (STI).
Not all people who want to prevent pregnancy use contraceptives. One in six (17%) sexually active females who say they are not trying to get pregnant are not using contraception. There are many reasons why people may not use contraceptives, ranging from concerns about side effects, lack of desire to use a method, to those who aren’t trying but would not mind if they got pregnant or have religious reasons.
Contraceptive Coverage
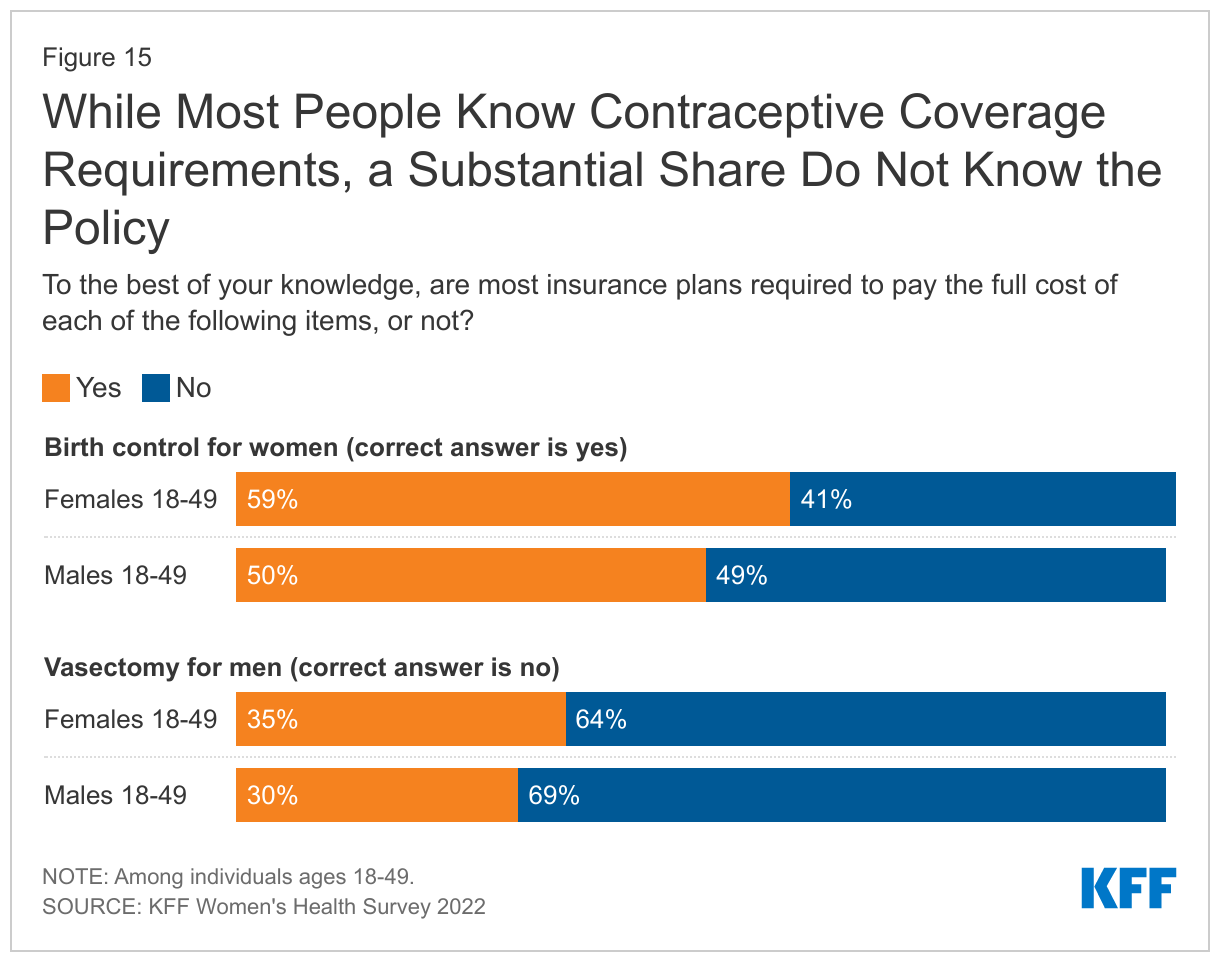
Although the ACA has required contraceptive coverage for over a decade, many still do not know about the policy and some privately insured females are still paying for their contraceptives. Four in ten (41%) females of reproductive age do not know that most insurance plans are required to pay the full cost of birth control for women.
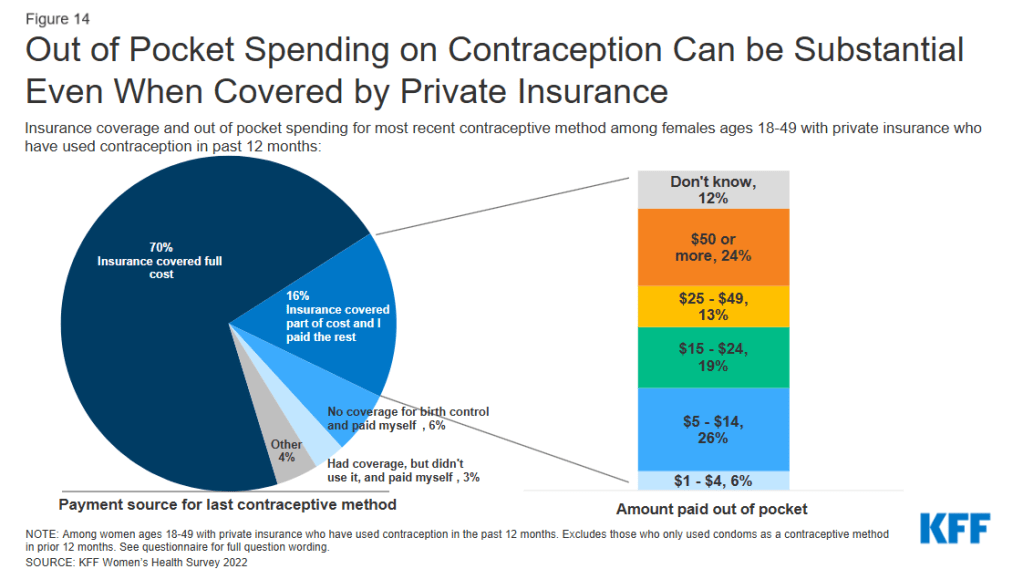
While most females (70%) with private insurance say their insurance covered the full cost of their most recent birth control method, a quarter say they paid at least part of the cost out-of-pocket. Of those who paid out of pocket, 16% say it was because they wanted a certain brand of contraception that was not covered by their plan (even though their plan should cover it if their provider recommends it for them). Others say it is because their prescribing provider (10%) or pharmacy (5%) was out of network. Half did not know why they had to pay.
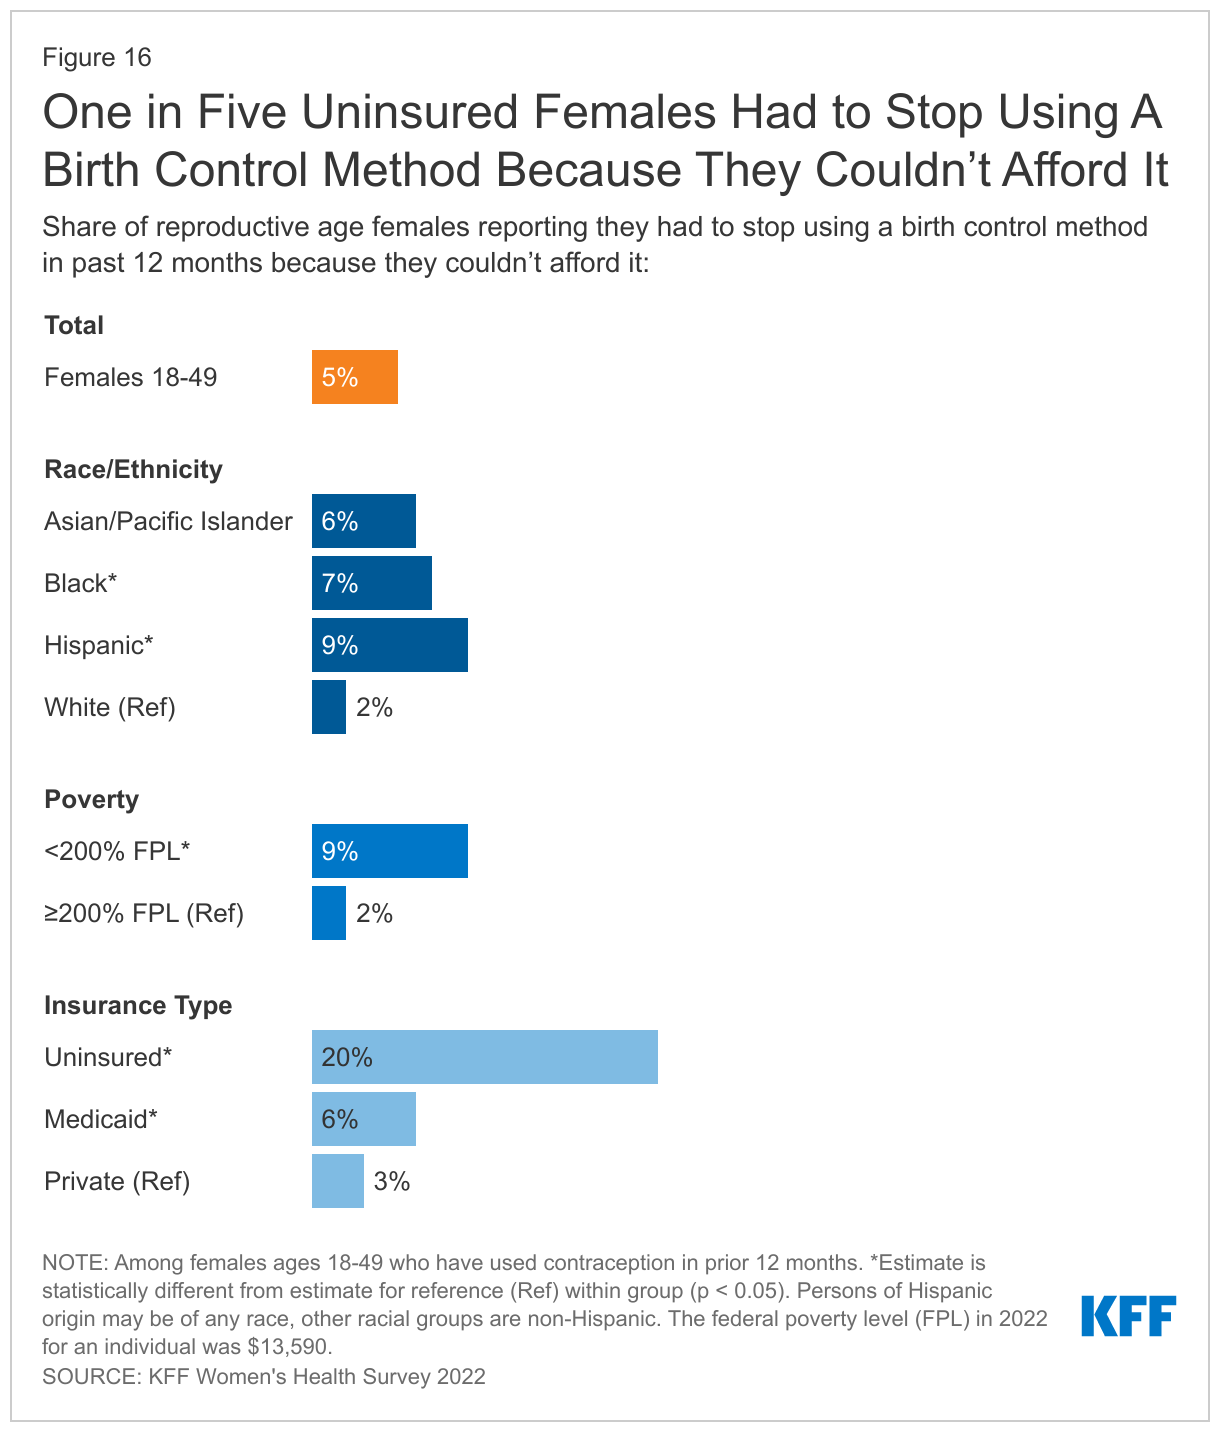
Cost can be a barrier to contraceptive use for some. One in five uninsured females of reproductive age say they had to stop using a contraceptive method because they couldn’t afford it. A smaller share of those on Medicaid (6%) or with private coverage (3%) cited cost as a barrier to continued use. For low-income women, 17% said cost was the leading reason they weren’t using their preferred method.
Contraceptive Preferences and Side Effects
Overall, one quarter of females who are using contraception are not using their preferred method. The leading reason for this is concern about side effects, a theme that comes up in many aspects of contraceptive care. Almost one-third of contraceptive users (31%) say they are experiencing side effects from their current method, and just over half (52%) say the side effects are more severe than they expected.
Just 30% of females say they received all the information they needed before choosing their birth control method. This is even lower among Asian/Pacific Islander females, just 12% of whom say they had all the information they needed before choosing a method, compared to more than a quarter of Hispanic (26%) and Black (28%) females and one-third of White females (34%). Person-centered contraceptive counseling is a key element to assuring people can select the contraceptive method that suits them. However, only 40% of those receiving contraceptive care rate their most recent contraceptive counseling as “excellent.”
Accessing Contraception
The majority of reproductive age females get their birth control care at a doctor’s office (77%) and prefer to get their care there, even as more services have become available online with growing numbers of online contraception platforms. Many also rely on clinics and health centers for their care, particularly those who are low-income, uninsured, Black or Hispanic. Far fewer (7%) have received a prescription or obtained a health care service from an online company in the prior 12 months. Convenience is the main reason those who would prefer to get their birth control care from an online company cite for their preference.
Emergency contraceptive pills (EC) are an effective form of back up birth control, but a sizable minority of people who might benefit from them don’t know where to get them or that they’re available over the counter. Emergency contraceptive pills, which can be taken to prevent pregnancy after a contraceptive failure or unprotected sex, have been available over the counter for more than 15 years. One in four reproductive age females (27%) either don’t know EC pills are available over the counter or have never heard of them. Among those who have heard of EC pills and could become pregnant, three in ten (31%) don’t know where they could get it.
Not only was there a lack of awareness about where to get emergency contraceptive pills, but even before the Supreme Court overturned Roe v. Wade, few knew where they could get an abortion if they needed one. Prior to the ruling in Dobbs, just one-quarter (26%) of females ages 18-49 said they knew what clinic or health care provider they could go to for an abortion if they wanted or needed one. Smaller shares of females living in rural areas, where services are more limited, knew where they could go to get an abortion compared to females living in more urban areas (16% vs. 28%).
Access to abortion and contraception continues to remain at the center of policy debates across the nation. Not only has abortion access been banned in many states, but access to effective methods to prevent pregnancy, like emergency contraceptive pills and long-acting reversible contraception (such as IUDs), may also become restricted. Doctors and health care providers are trusted sources of information for many people, which means they could play an important role in filling information gaps and addressing misinformation. While the ACA preventive services coverage requirement has markedly improved the affordability of contraceptives, the policy is being challenged yet again in the courts by those who object to preventive services such as contraception on religious or moral grounds. The outcomes of these debates, along with state, federal and private sector actions will continue to shape the availability and use of contraceptive care for millions in the years to come.
This work was supported in part by Arnold Ventures. KFF maintains full editorial control over all of its policy analysis, polling, and journalism activities.
Findings
Introduction
Contraceptive care is an important component of overall health care for many people. Federal and state policies shape access to and the availability of contraceptive care, but factors such as provider characteristics, as well as individual preferences and experiences also impact contraceptive choices and use. For most people, private coverage and Medicaid greatly reduce or eliminate financial barriers to contraceptive care, but access to contraceptive services is still limited in many parts of the U.S. with more than 19 million women living in contraceptive deserts where they may not have access to a health center offering the full range of contraceptive methods. The federal Title X family planning program aims to provide quality contraceptive care to low-income and uninsured females across the country, but not all are reached.
The public programs that subsidize contraceptive services and coverage expansions for contraception under private insurance and Medicaid aim to expand access to contraception. In addition, there have been more efforts to broaden contraceptive availability outside of traditional clinical settings, including through commercial apps, state efforts to allow pharmacists to prescribe birth control, and growing momentum toward gaining FDA approval for over-the-counter (OTC) oral contraception without a prescription.
The recent Supreme Court decision in Dobbs v. Jackson Women’s Health Organization, eliminating the federal standard for abortion access brings new salience to and reinforces the importance of access to effective and affordable contraception, particularly for those who live in states that seek to ban abortion.
This brief provides new information about the state of contraceptive access for females in the US, with the goal of better understanding the factors that influence use and experiences with contraceptive care. From May 10 to June 7, 2022, prior to the Dobbs decision, KFF partnered with SSRS to field the 2022 KFF Sexual and Reproductive Health Survey. The survey, developed and analyzed by KFF staff, is a nationally representative survey of 5,201 females (self-reported sex at birth) and 1,241 males ages 18 to 64. SSRS conducted the field work for the survey, with most respondents answering online and a small share by telephone. The sample was drawn from two nationally representative, probability-based survey panels – the SSRS Opinion Panel and IPSOS’s KnowledgePanel. The sample was constructed to ensure sufficient sample sizes for analysis of key groups of interest, including females who are Black, Hispanic, Asian/Pacific Islander, low-income, covered by Medicaid, lesbian, gay, or bisexual, and living in rural areas. The data were weighted to represent U.S. adults ages 18 to 64, based on benchmarks from the U.S. Census Bureau’s Current Population Survey. See the methodology section for more information.
Individuals were asked about their sex at birth as well as their gender identity. To be as inclusive as possible to all those who use contraceptive methods regardless of their gender identity, this brief presents data on individuals who responded their sex at birth was female, including those who identify as cisgender women and those who identify as a different gender such as transmen and other gender nonbinary individuals. The survey covers several aspects of reproductive health and well-being, including access, coverage, and utilization of health care outside of sexual and reproductive health. This brief presents survey findings on females’ experiences using contraception, including access, payment, as well as their preferences and concerns regarding different methods and care.
Use of Contraceptives
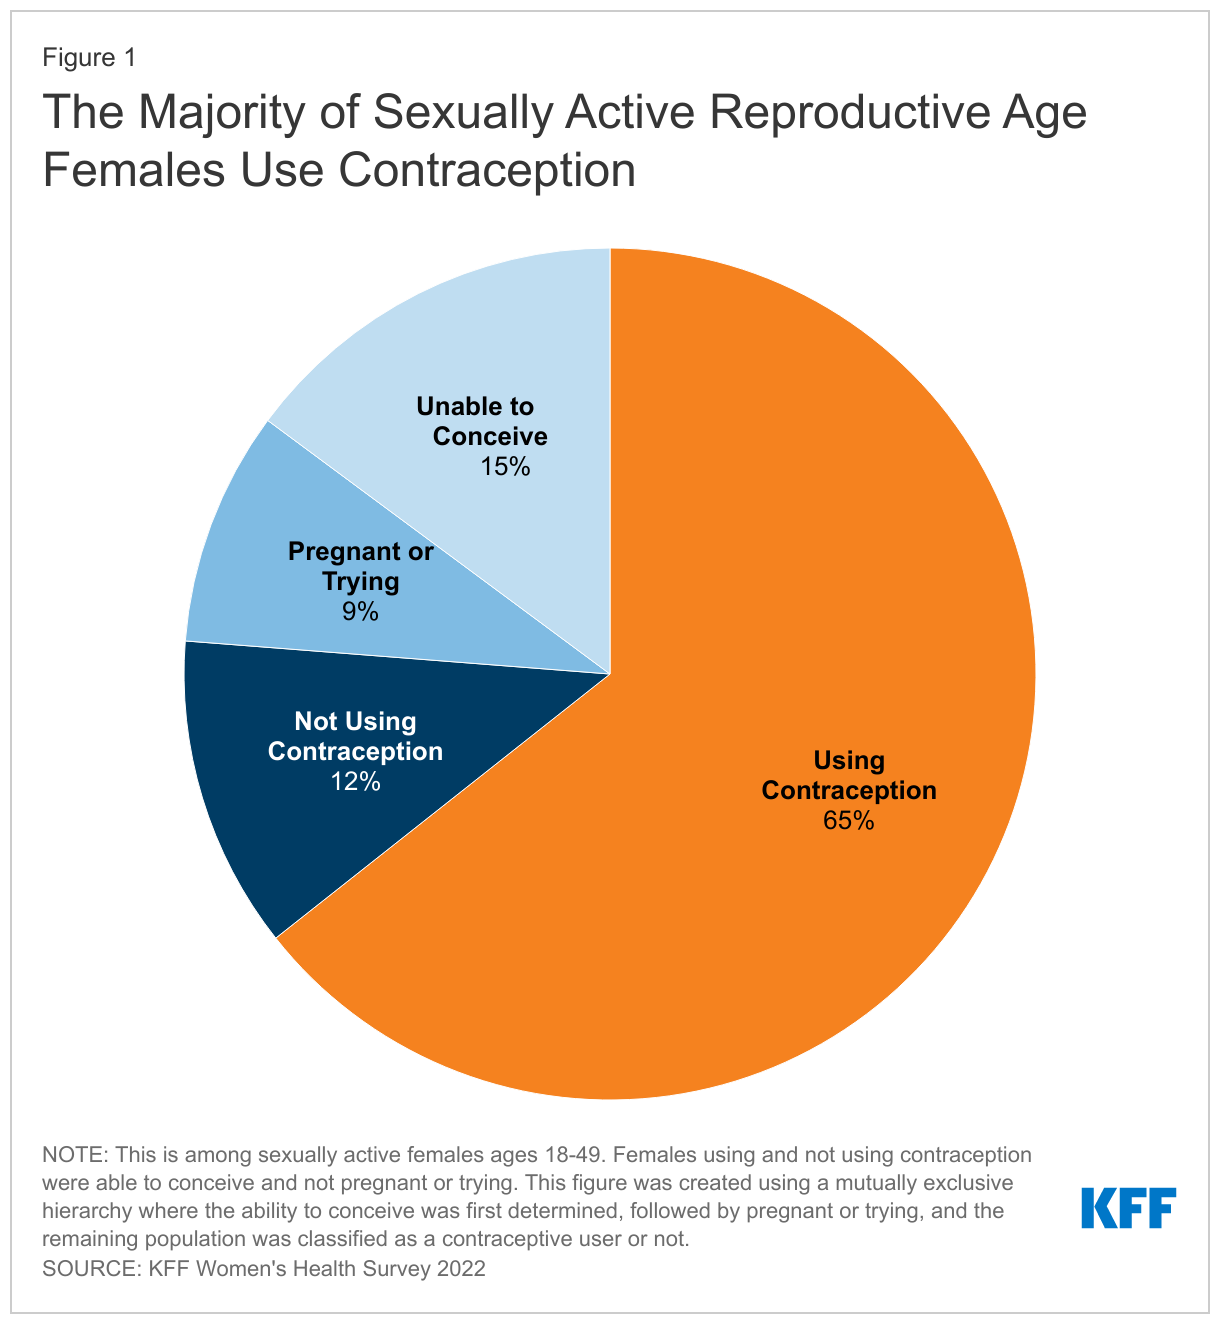
Most sexually active females ages 18-49 are using some form of contraception. When looking at the profile of sexually active reproductive age females, 15% report that either they or their most recent sexual partner have a medical condition that makes it impossible for them to ever get pregnant (15%), while 9% are pregnant or trying to get pregnant. Two-thirds of females ages 18-49 say they are using some form of contraception (65%) and 12% report not using contraception (Figure 1).
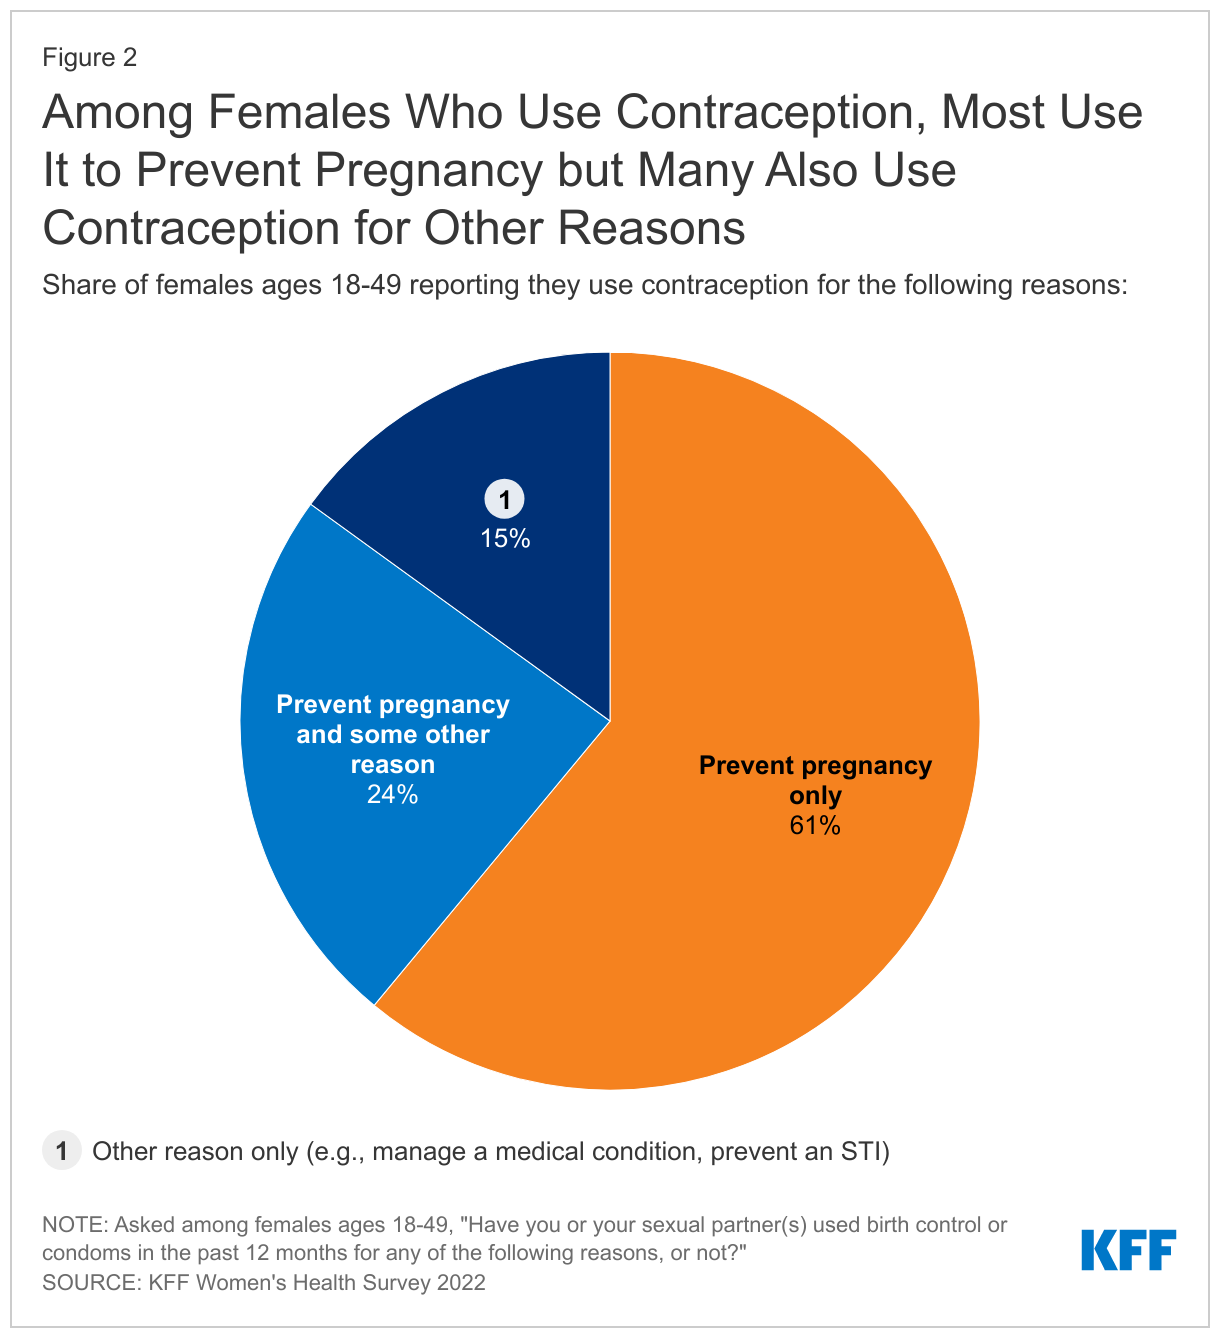
Among females who are using contraception, six in ten (61%) say they use contraception only to prevent pregnancy, but almost one-quarter (24%) say they use contraception both to prevent pregnancy and some other reason (Figure 2). One in seven (15%) use contraception solely for a reason not related to preventing pregnancy such as managing a medical condition or preventing a sexually transmitted infection (STI).
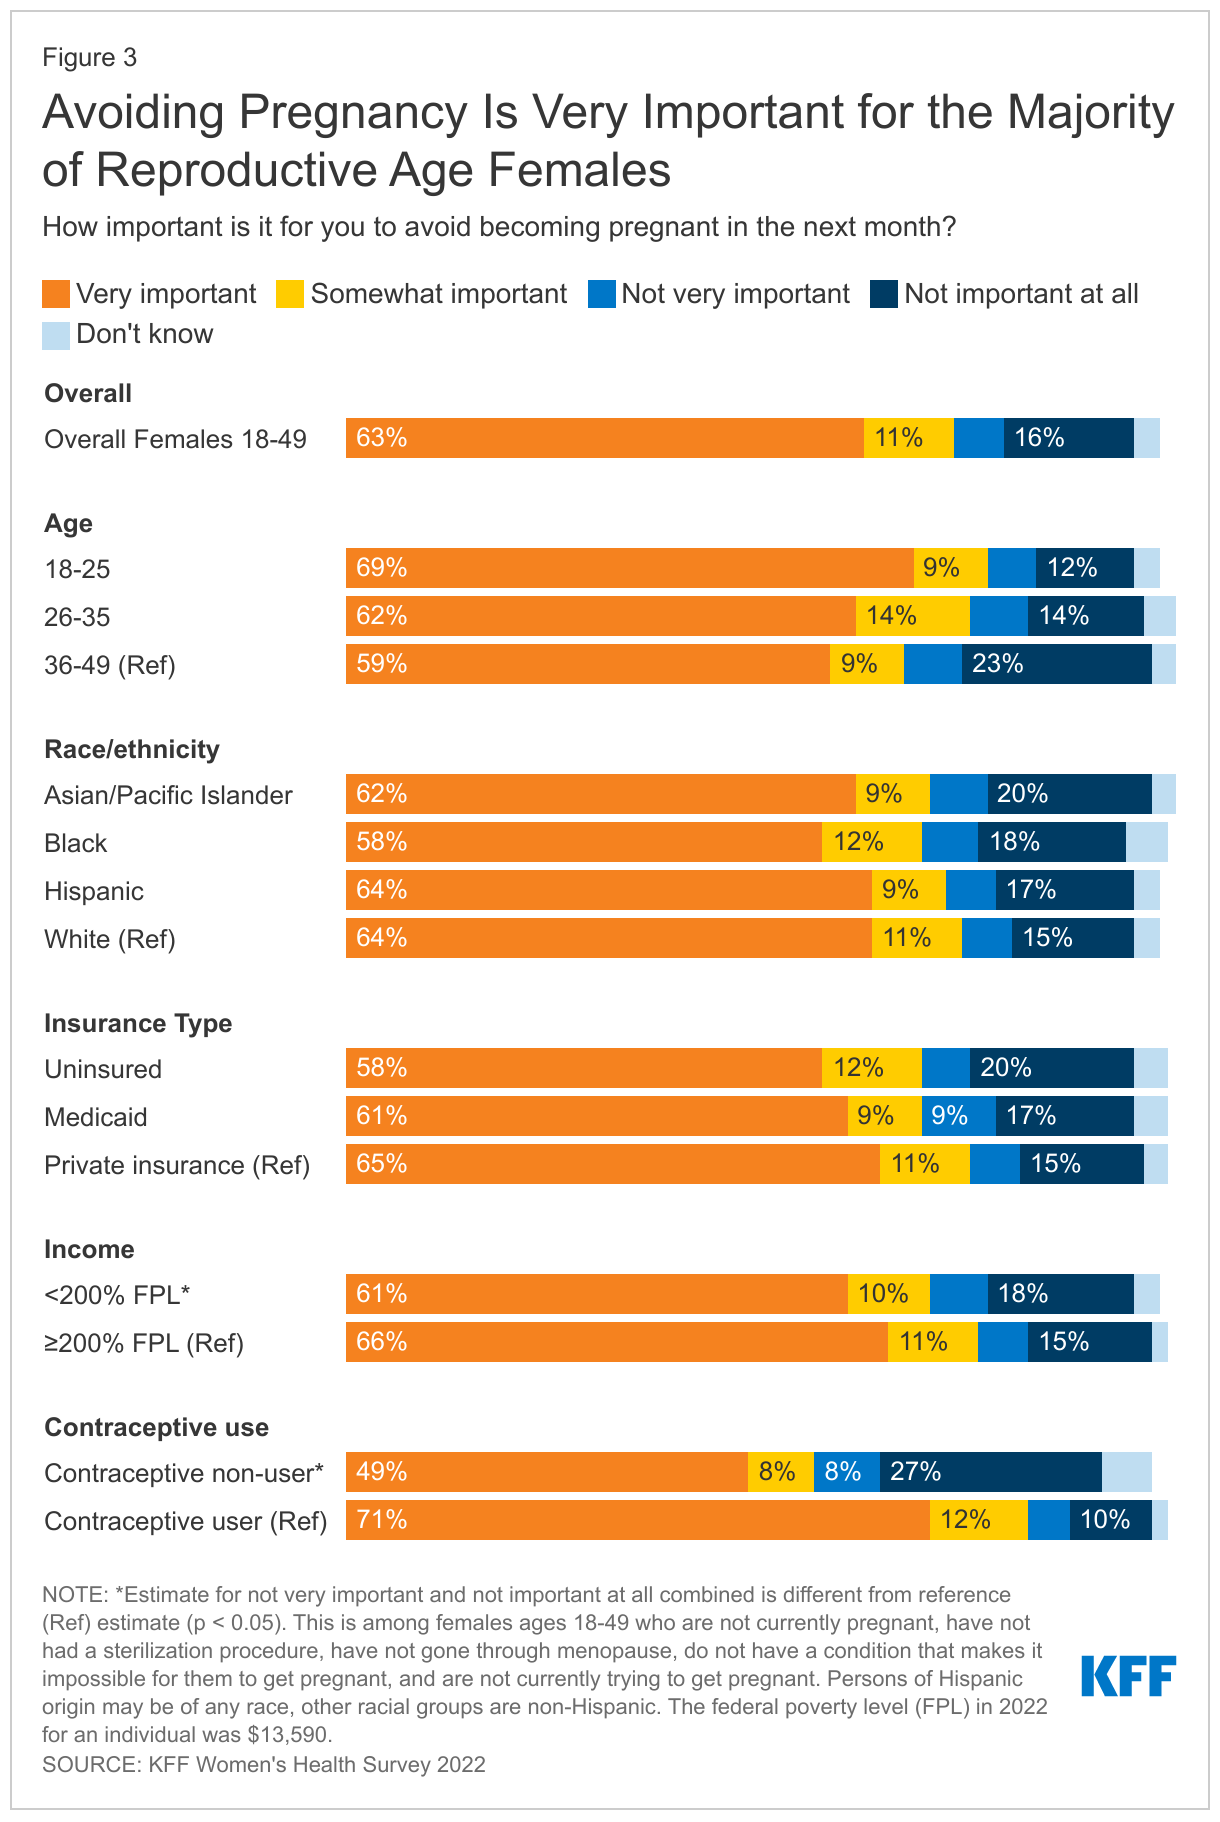
Most reproductive age females who are not actively trying to get pregnant say it is important to them to prevent pregnancy. However, one in five say avoiding pregnancy is not a priority.It is often assumed that pregnancy prevention is a priority for women who are not actively trying to get pregnant, but that is not always the case. Among females ages 18-49 who are not currently trying to get pregnant, the majority say it is very important (63%) or somewhat important (11%) for them to avoid becoming pregnant in the next month, but one in five (22%) females say it is not very important or not important at all (Figure 3). (Note that this survey was conducted before Roe v. Wade was overturned and this share could have changed now that abortion is no longer available in many states.)
Conversely, among females who are who are capable of becoming pregnant, not trying to get pregnant, and not using contraception, over half (57%) say that it is very important or somewhat important for them to avoid pregnancy. These data speak to the fact that some females may not have found a method that meets their needs or that they can access. In addition, there are others who are not necessarily trying to get pregnant but may be open to having a pregnancy and may not want to use contraception for reasons ranging from prior personal experiences, lack of acceptable contraceptive options, or religious beliefs.
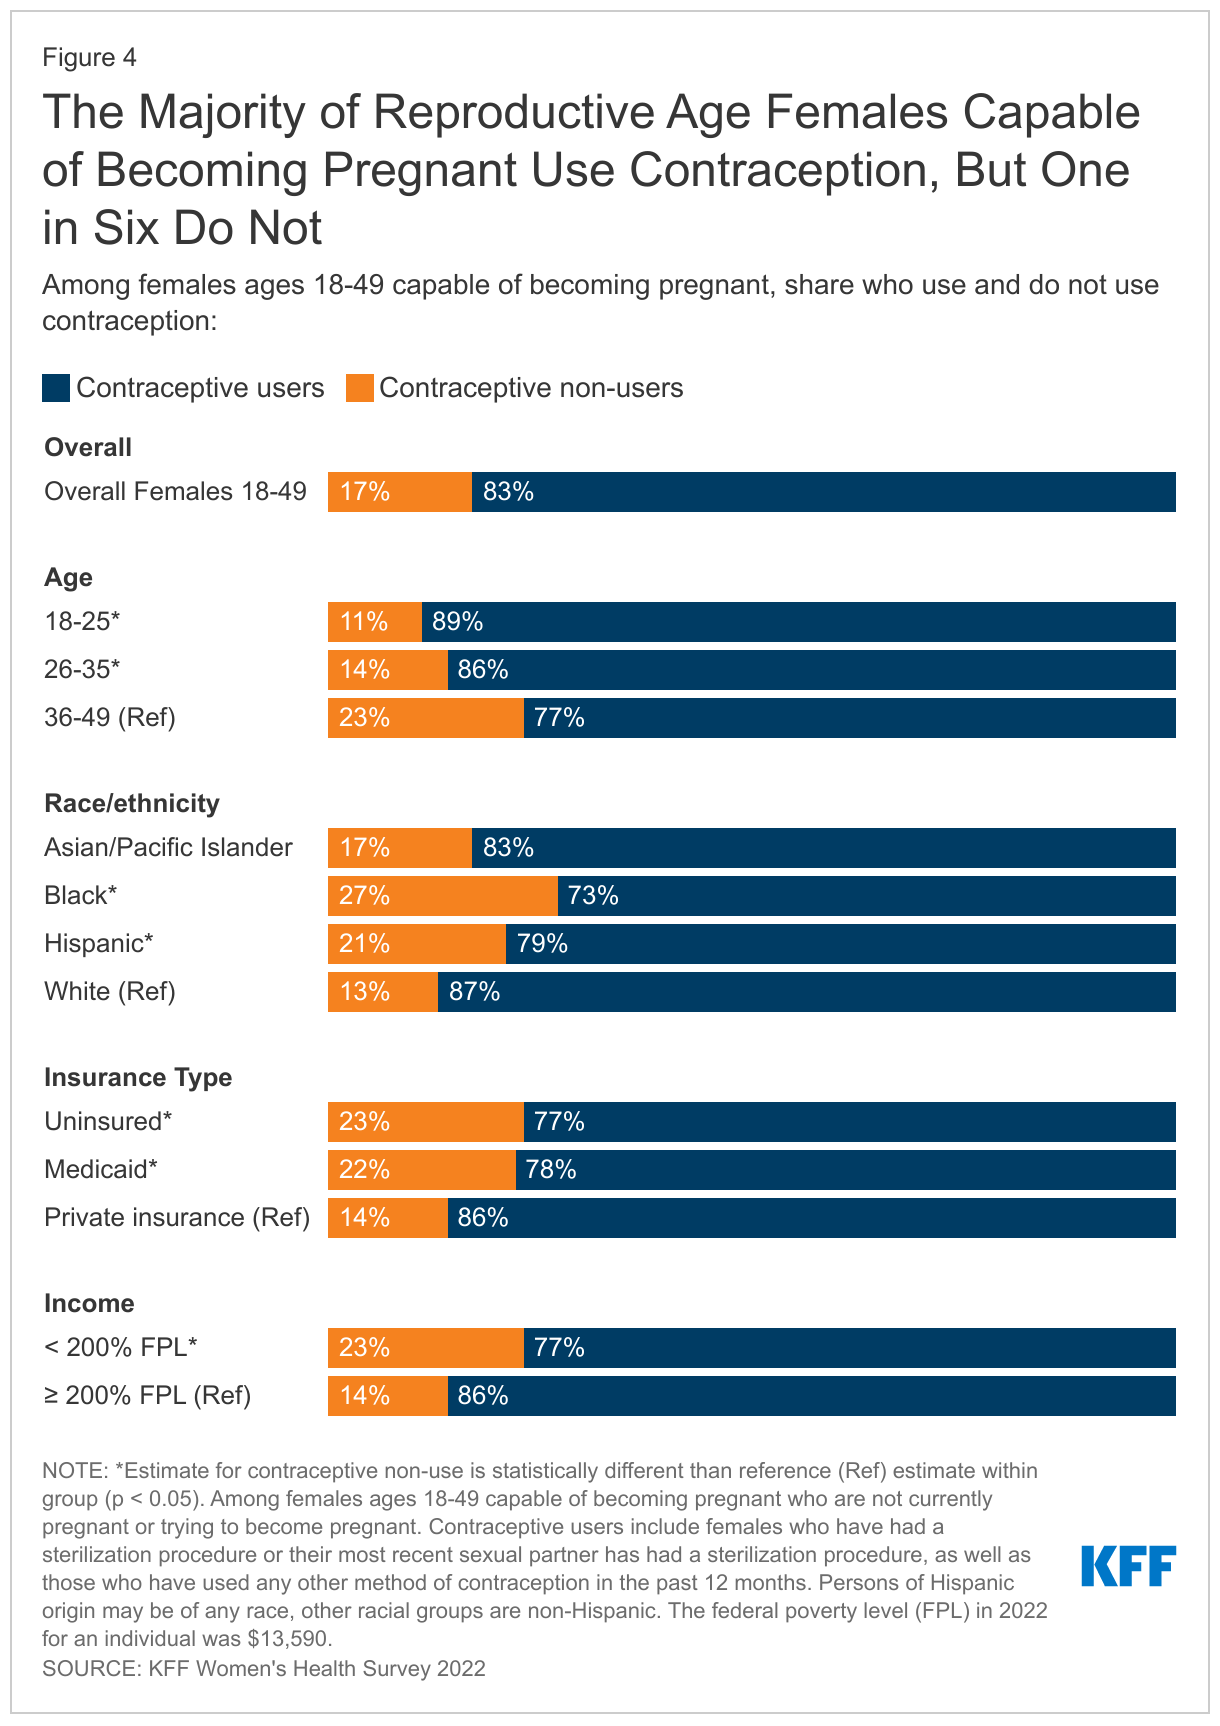
More than eight in ten sexually active females who are not currently pregnant and capable of becoming pregnant use contraception, but one in six do not. The majority (83%) of sexually active reproductive age females who are able to conceive, not currently pregnant nor trying to become pregnant report using at least one method of contraception in the past 12 months (Figure 4). However, one in six (17%) report that they do not use contraception and are not trying to conceive. More than a quarter (27%) of Black females in this group report that they are not using contraception compared to one in five (21%) Hispanic females, 17% of Asian/Pacific Islander females, and 13% of White females. Nearly one in four (23%) uninsured females and those with Medicaid coverage (22%) report not using contraception compared to 14% of females with private insurance (employer-sponsored and individual). Similarly, 23% of females with low incomes report not using contraception compared to 14% of individuals with higher incomes.
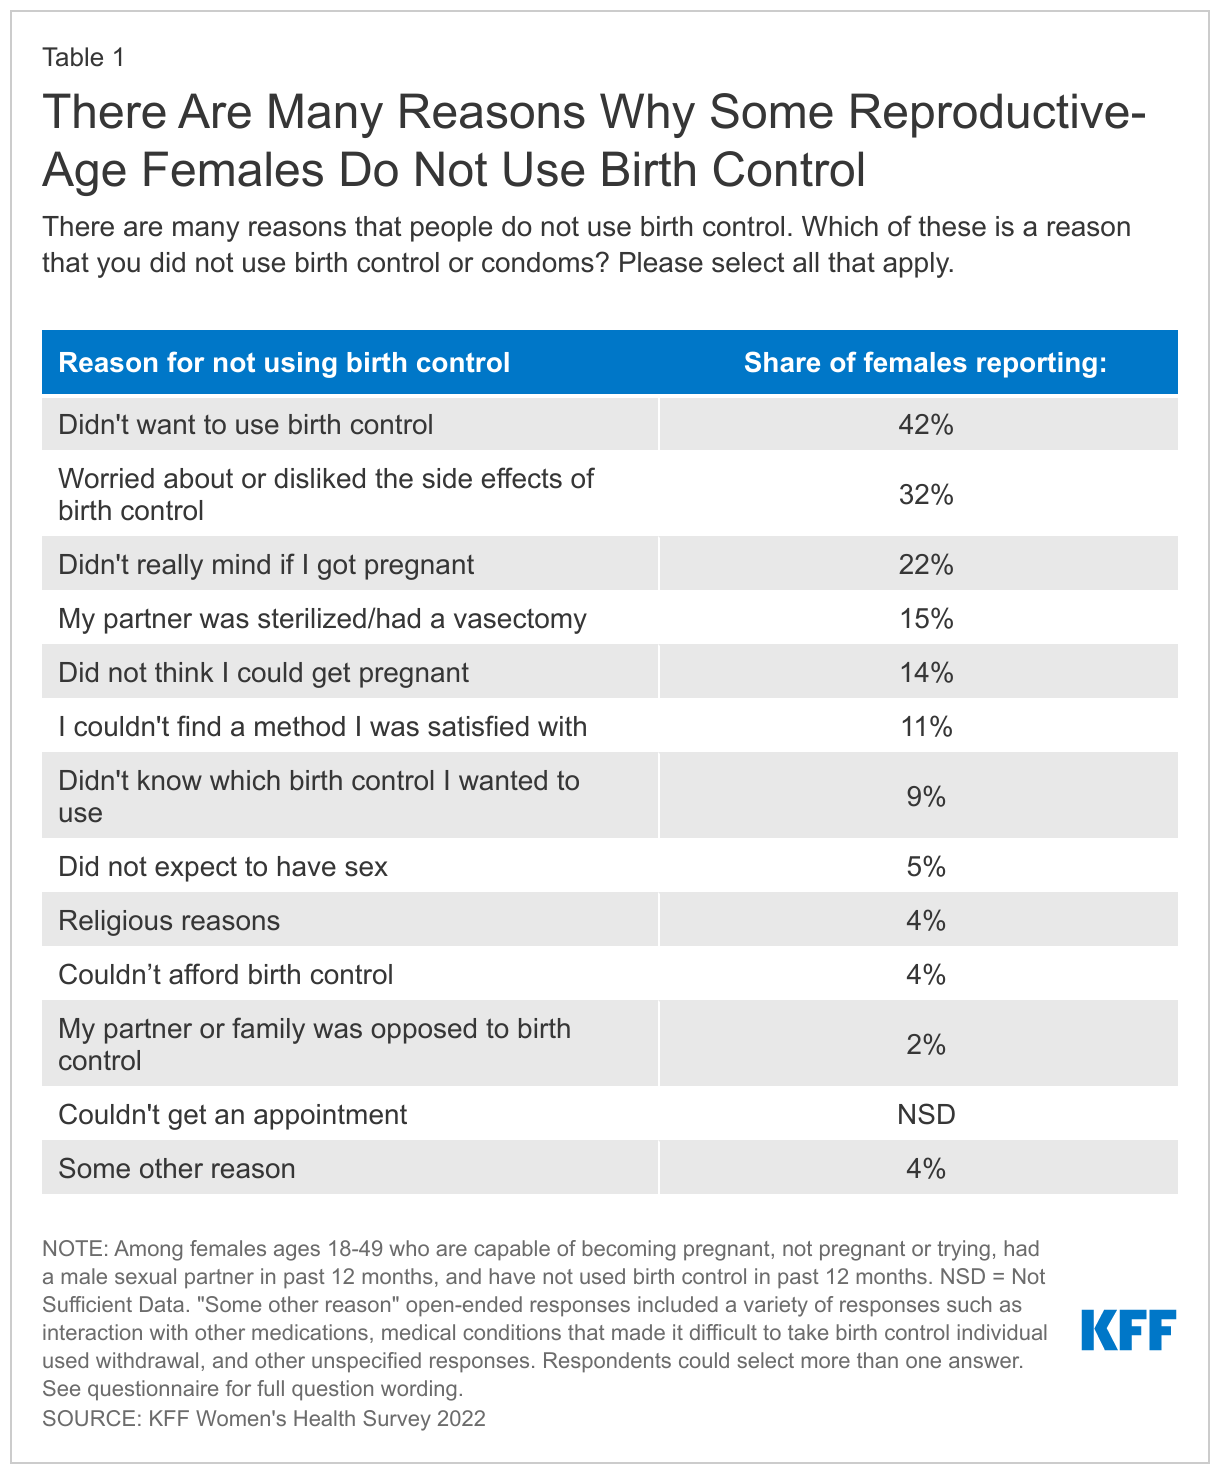
Among reproductive age females who are able to conceive and are not pregnant or trying to become pregnant who are not using contraception, four in ten they say it is because they did not want to use birth control (42%). One in three females who are not currently using contraception report concern about side effects (32%), and one in five (22%) say they don’t really mind if they become pregnant (Table 1). Fourteen percent say that they do not think they could get pregnant and about one in ten couldn’t find a method they were satisfied with (11%) or don’t know which birth control they want to use (9%). Four percent say “some other reason”, and responses include having medical conditions that made it difficult to take birth control or using withdrawal.
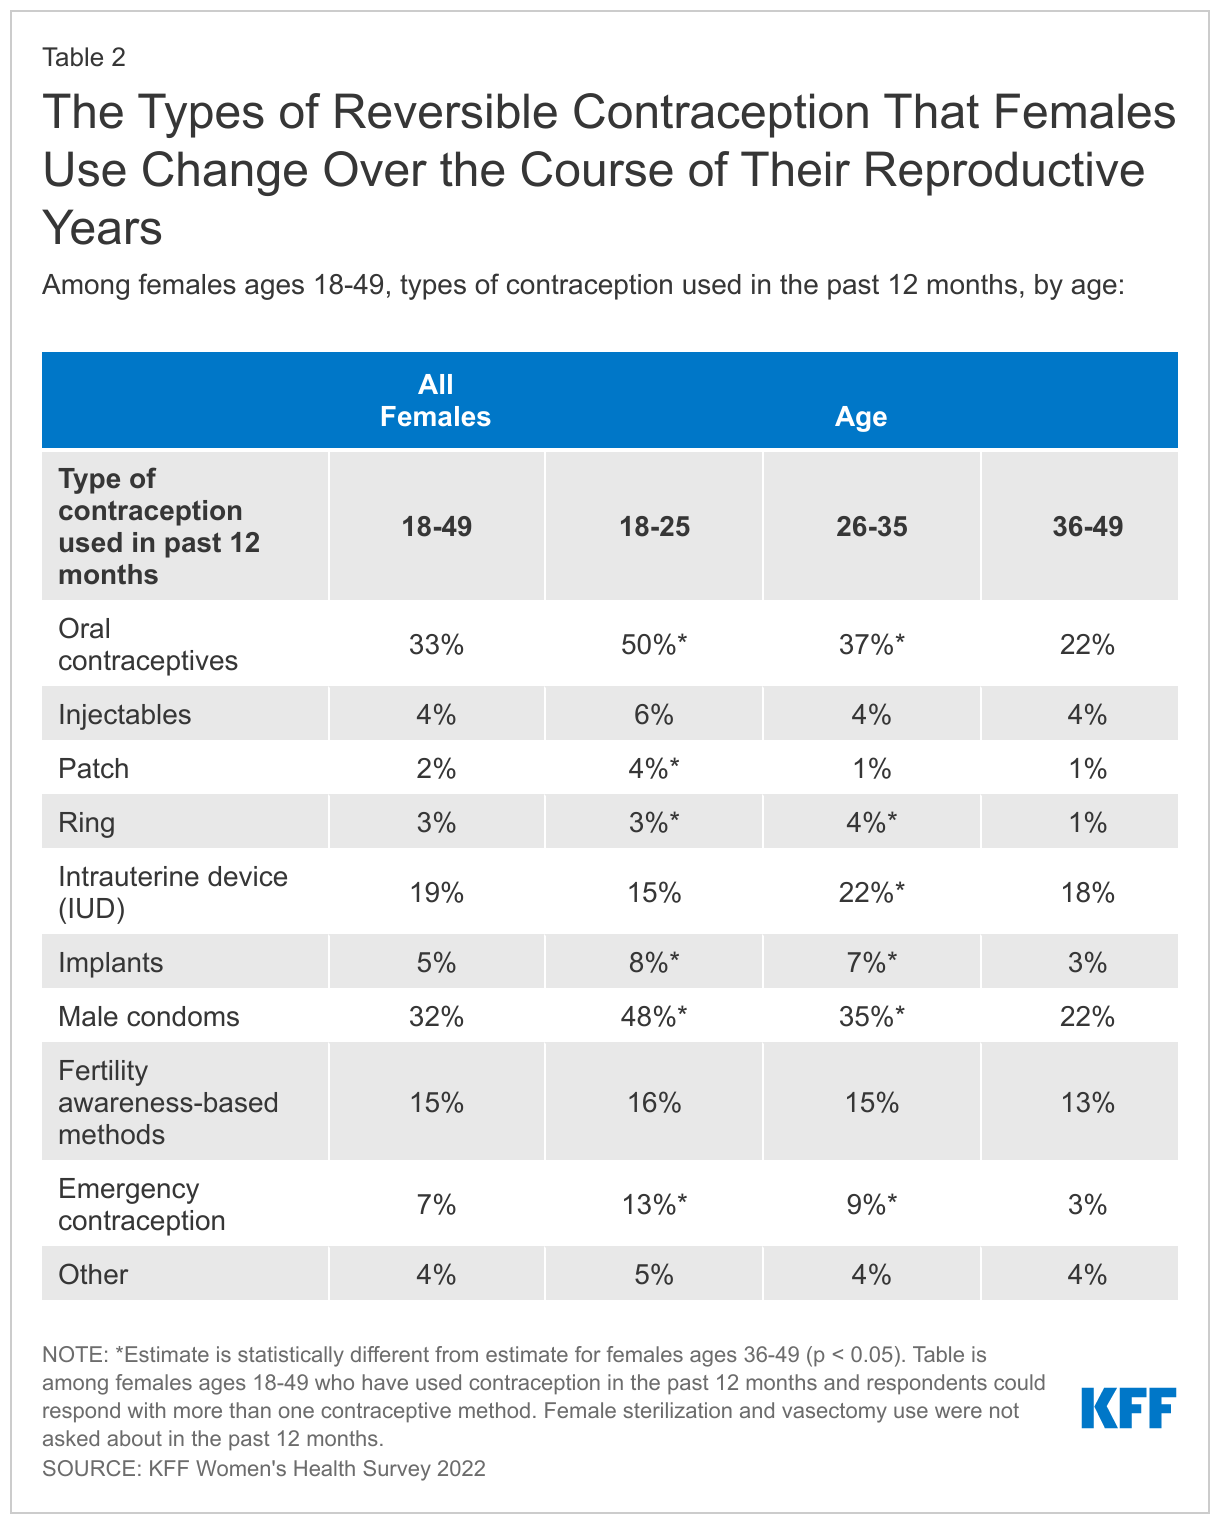
Among those that currently use contraception, condoms, oral contraception, and IUDs are the most commonly used methods. When looking at current contraceptive use (in the prior 12 months), one-third of reproductive age females report using oral contraceptives (33%) and condoms (32%) (Table 2). One in five report using IUDs (19%). Larger shares of younger female contraceptive users ages 18-25 report using all contraceptive method types compared to older female contraceptive users ages 36-49, except for IUDs where the largest share of users are females ages 26-35. For all age groups, oral contraceptives and condoms are the most frequently used methods. One in seven females (15%) across all age groups reports using fertility-awareness based methods to avoid pregnancy in the past 12 months.
Fewer than half of people say they used contraception including condoms the last time they had sex.Four in ten (42%) reproductive age females and males (41%) say they used contraception, including condoms, the last time they had sex. Use of a contraceptive method at last sex is lower among females (38%) and males (38%) who are married or living with a partner, compared to just over half (52%) of females and nearly half (47%) of males who are not married or living with a partner (Figure 5).

Overall, 17% of females say their partner used a condom the last time they had sex, and 22% of males report using a condom. This differs significantly by whether someone is married or living with a partner compared to not. In addition to preventing pregnancy, condoms are also effective in reducing the risk of transmission of STIs. Males who are married or living with a partner are almost twice as likely to use a condom than males who are widowed, divorced, separated, or never married (32% vs. 18%). Thirteen percent of females who are married or living with a partner say their partner used a condom the last time they had sex compared to 27% of females who are widowed, divorced, separated, or never married.
When asked if they had discussed birth control or condom use with their most recent sexual partner, the majority of males (69%) and females (72%), regardless of partner status, say they discussed with their partner.
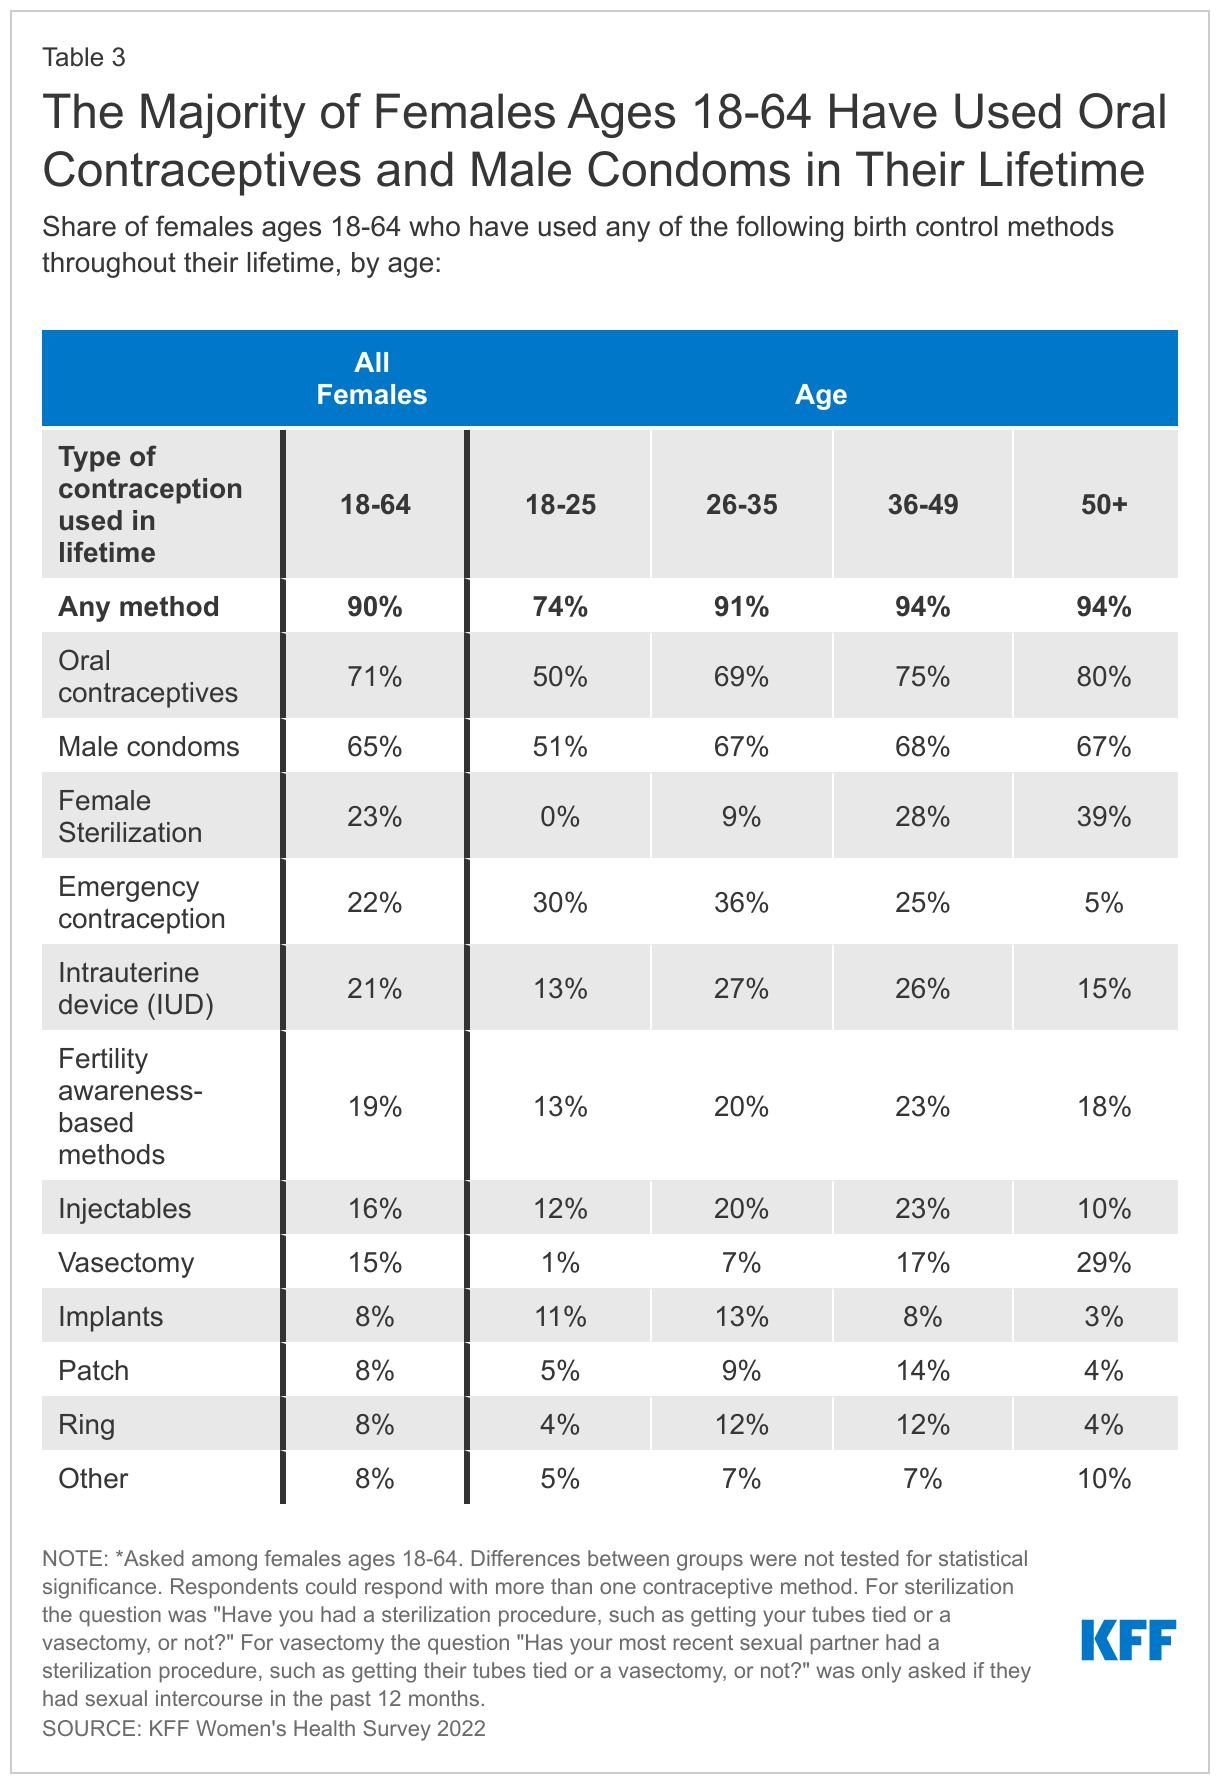
Nine in ten females (90%) report using contraception at some point in their lifetime and most (76%) use more than one type of contraception across their lifespan.Contraceptive preferences often change throughout one’s reproductive years. On average, females use 2.7 different contraceptive methods throughout their lifetime. Seven in ten females (71%) ages 18-64 say they have used oral contraceptives, including a larger share of females ages 36-64 (Table 3). Male condoms are the second most frequently used contraceptive among females ages 18-64 (65%). Among younger females ages 18-35, higher shares have used implants and emergency contraception compared to females overall. Switching to different contraceptive methods is common, reinforcing the importance of access to the full range of contraceptive methods without financial barriers. Also, because contraceptive needs can change over one’s reproductive lifespan; what works in one’s twenties may not be what is best for them in their thirties or forties.
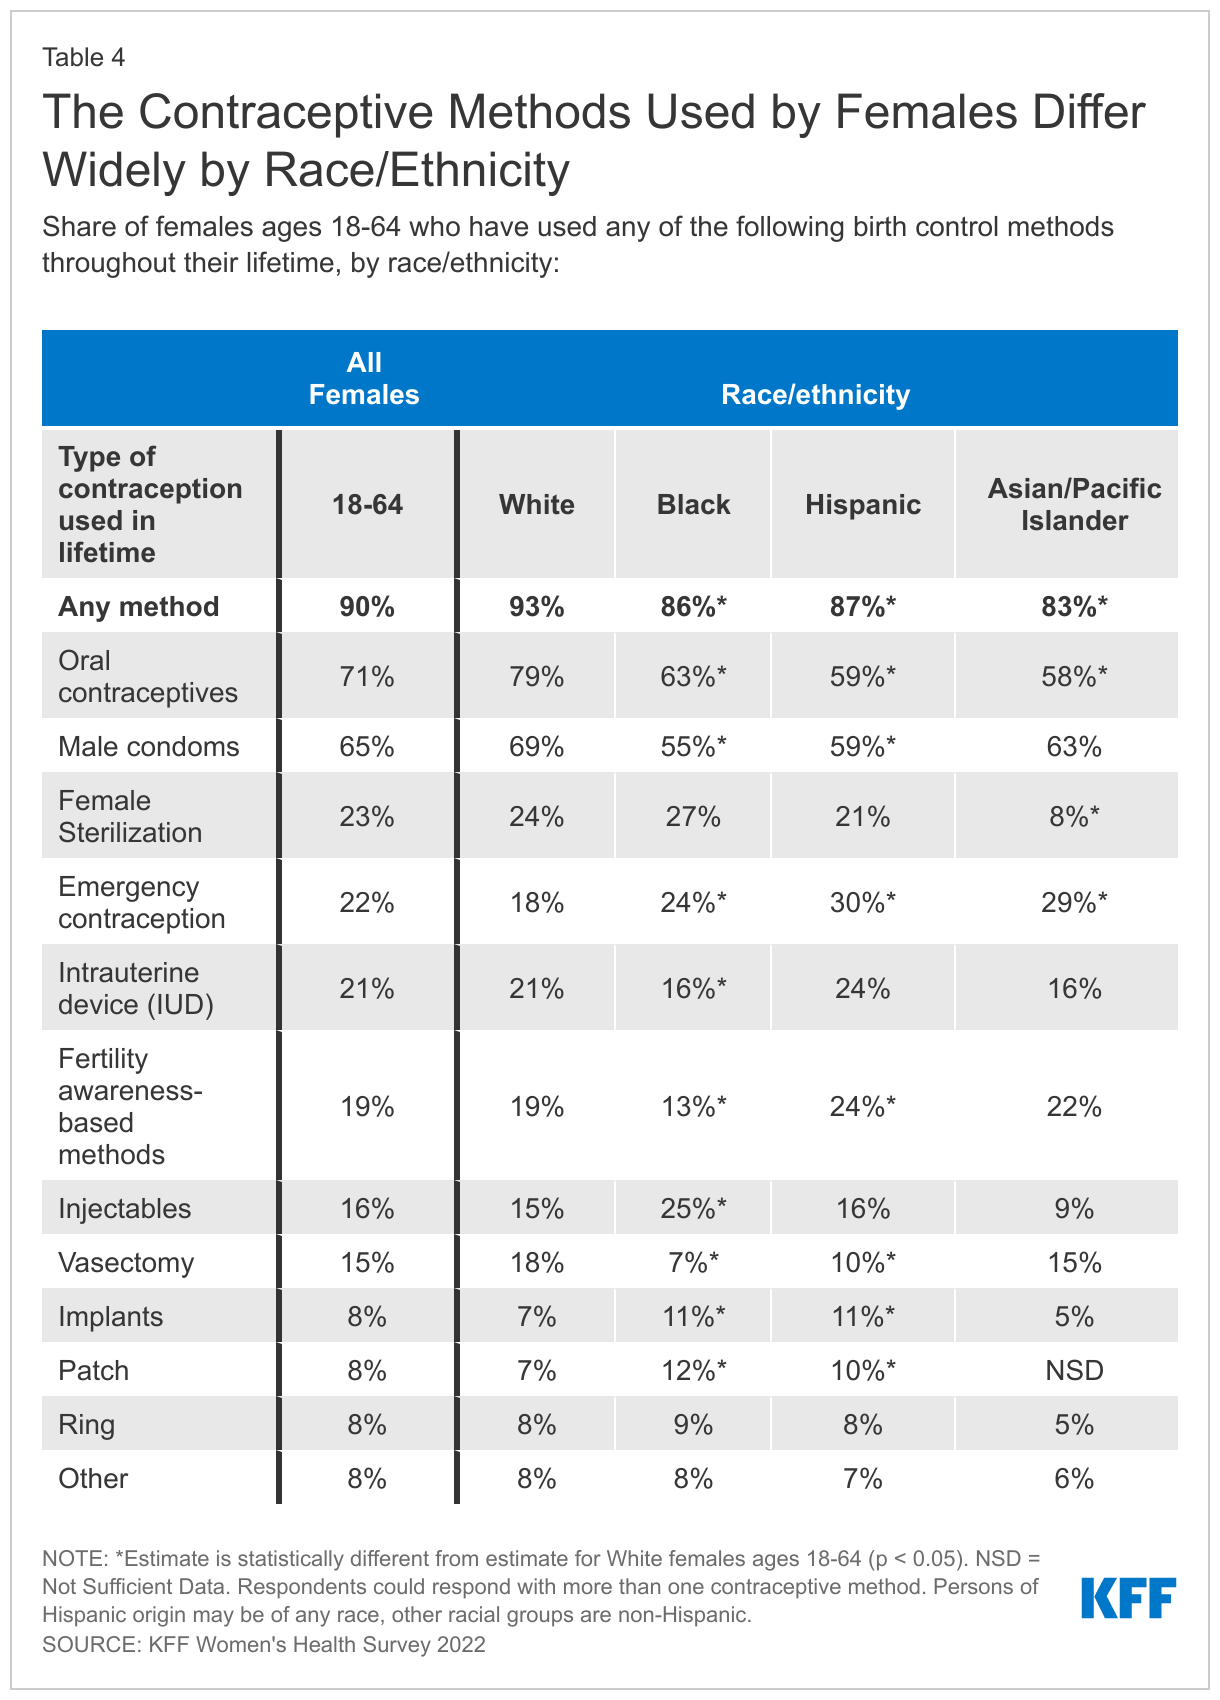
The types of contraceptive methods females use also can differ by race/ethnicity groups (Table 4). Smaller shares of Asian/Pacific Islander females (8%) report being sterilized compared to White females (24%). However, similar shares of both White (18%) and Asian/Pacific Islander (15%) females report relying on a partner’s vasectomy for contraception. One in four (25%) Black females report using injectable contraception in their lifetime compared to only 15% of White females. There are not significant differences in intrauterine device (IUD) lifetime use, but larger shares of Black (11%) and Hispanic (11%) females report using contraceptive implants compared to White females (7%). Black and Hispanic females are also less likely to say they have used condoms and more likely to say they have used fertility-awareness based methods compared to White females.
Accessing Contraception
The majority of reproductive age females get their birth control care at a doctor’s office, but distribution of site of care differs by race/ethnicity, insurance coverage, and income. Overall, more than three in four females using contraception (77%) had their most recent birth control care visit at a doctor’s office (Figure 6). One in ten (11%) went to a clinic like Planned Parenthood, another family planning clinic or a community health care, or a walk-in clinic, such as an urgent care center or clinic inside a store. Less than one in ten females (8%) got their birth control care at a pharmacy or drug store or some other place and just 3% had their most recent visit through an online birth control website or app like Nurx, The Pill Club, or Hims or Hers.
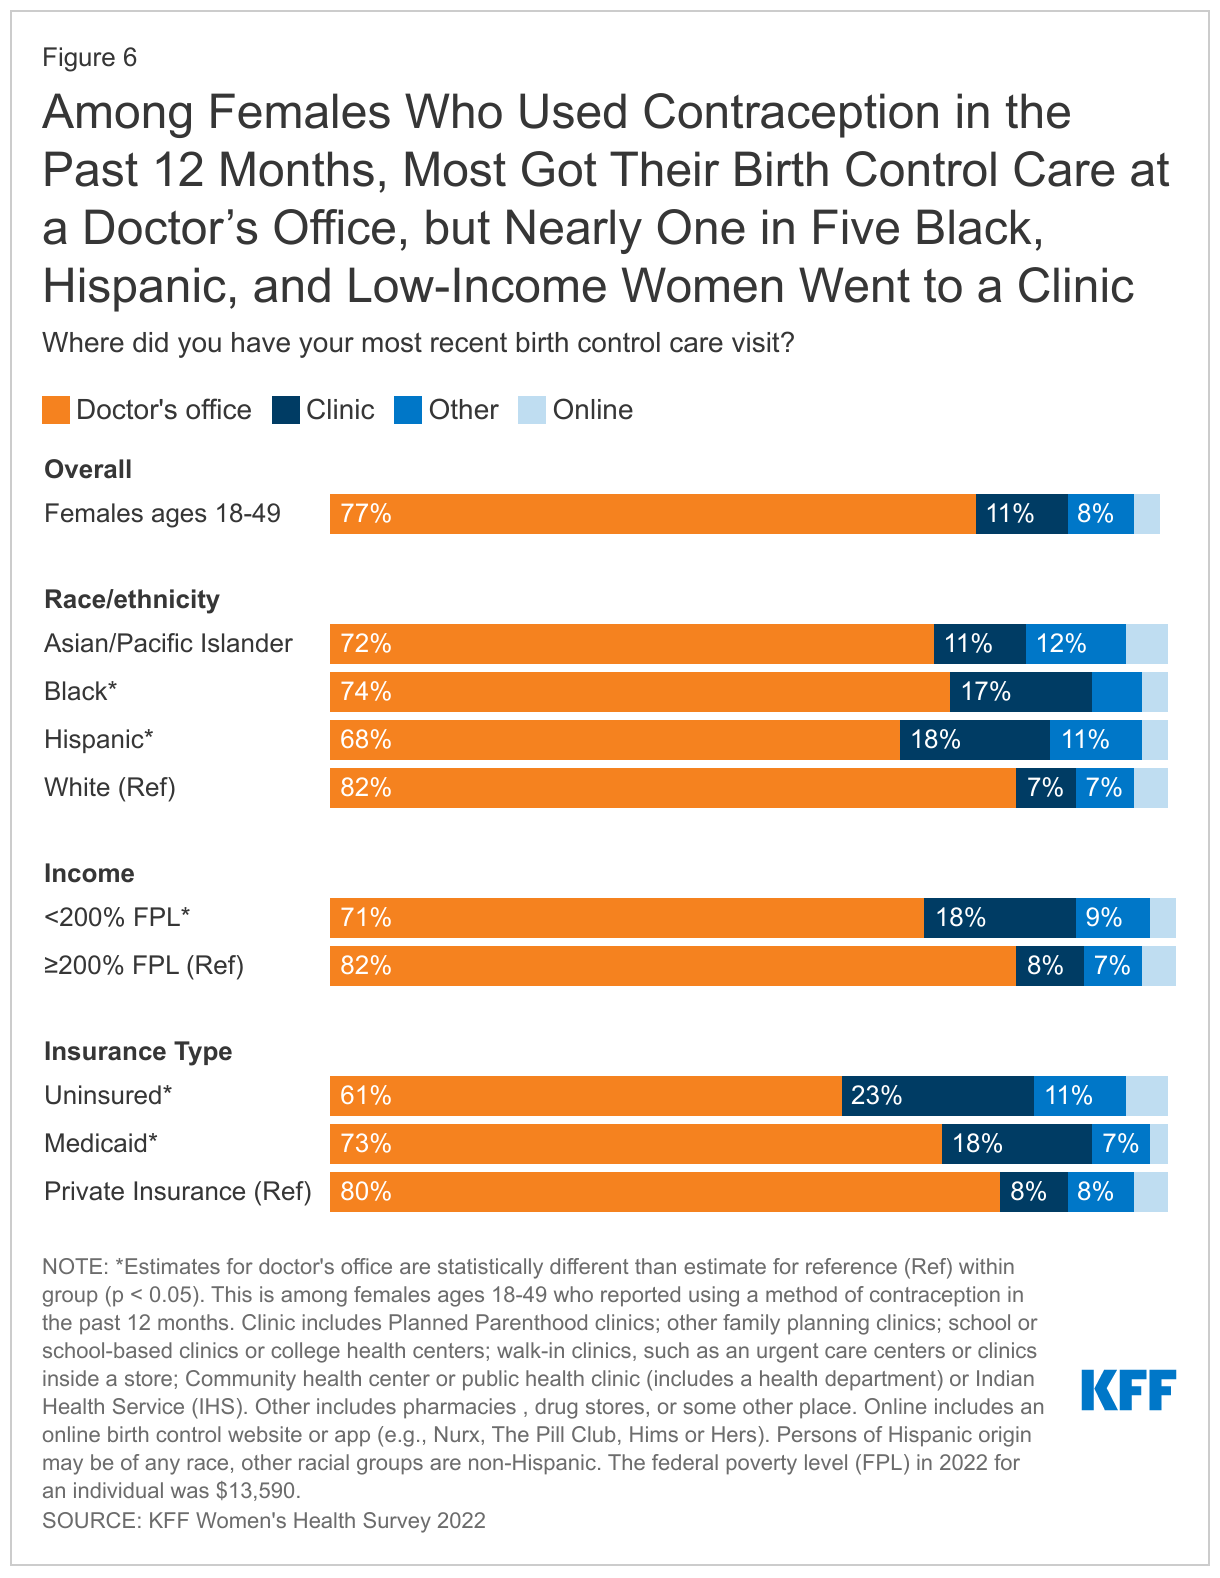
Larger shares of Black (17%) and Hispanic (18%) females got their most recent birth control care at a clinic compared to White females (7%). Similarly, larger shares of uninsured females (23%) and females with Medicaid coverage (18%) went to clinics compared to those with private insurance (8%).
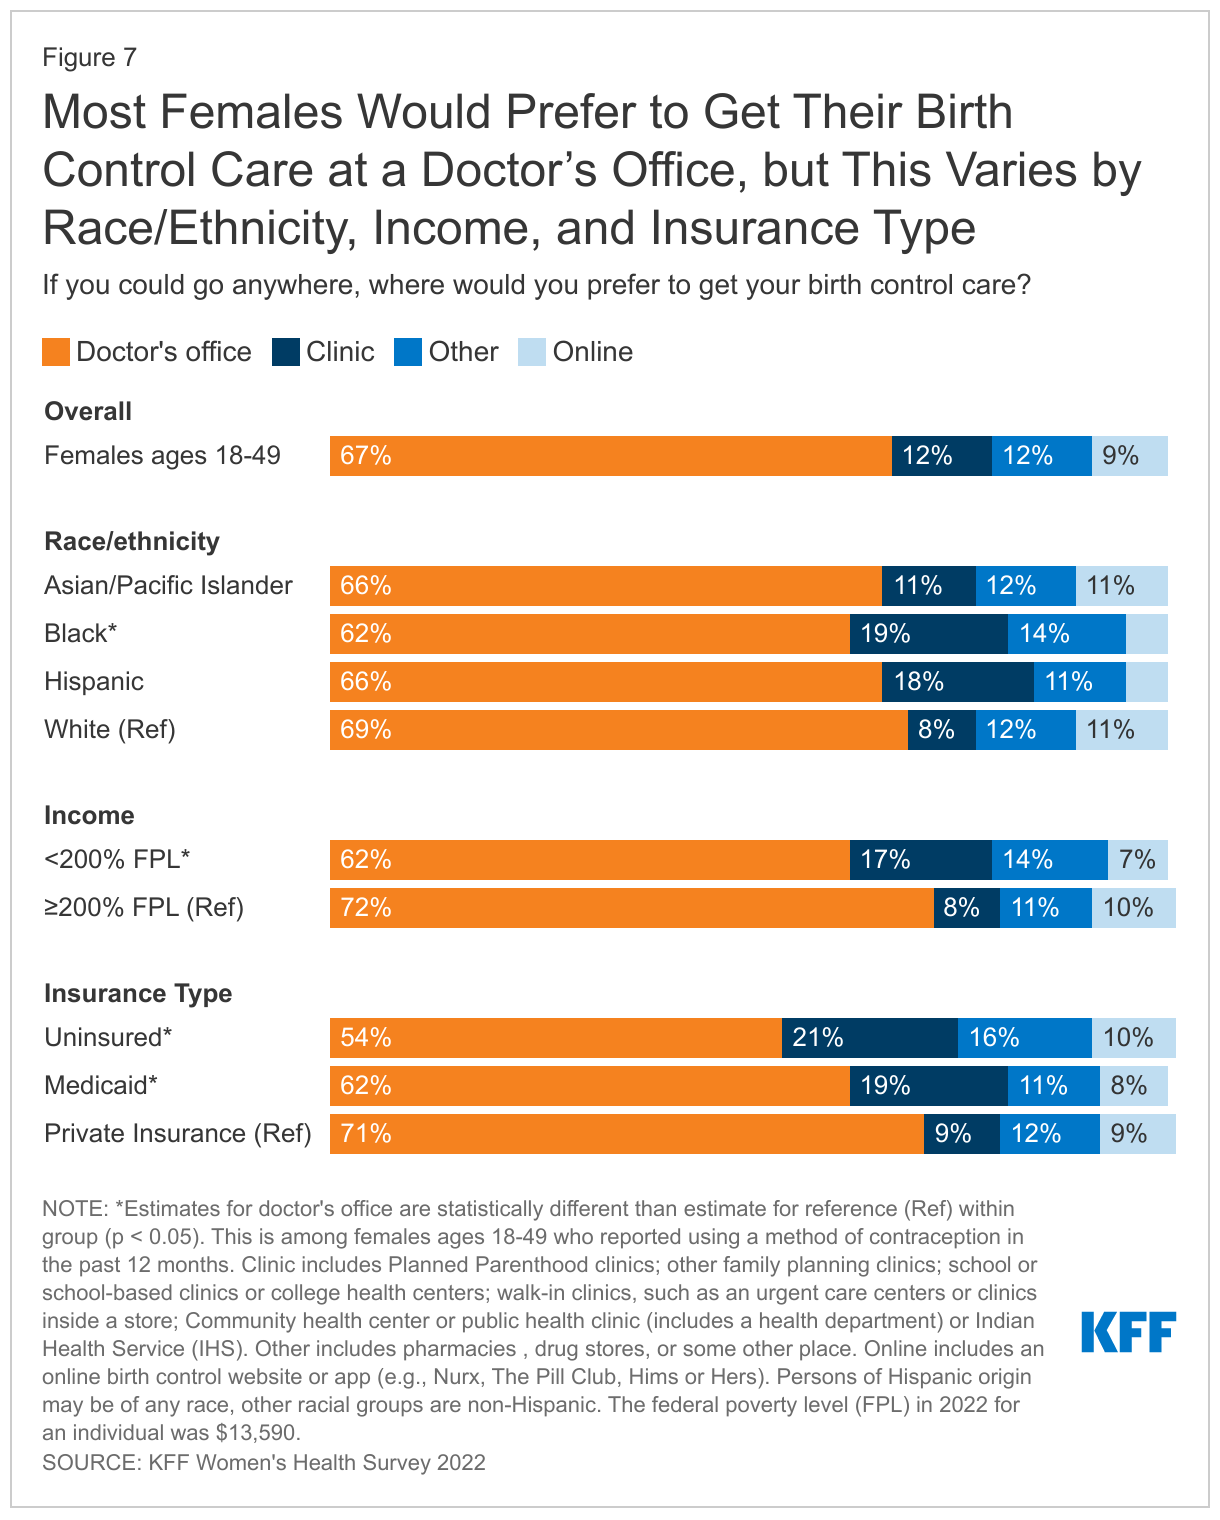
When asked where they would prefer to get their birth control care, most females say a doctor’s office, but this varies by income and insurance. Two-thirds (67%) of reproductive age females say that if they could go anywhere for birth control care, they would choose a doctor’s office (Figure 7). About one in ten would choose a clinic (12%), online (9%), or another location, such as a pharmacy or drug store (12%). While majorities across all groups would choose a doctor’s office, about one in five females who are Black (19%), Hispanic (18%), low-income (17%), uninsured (21%), and covered by Medicaid (19%) would choose a clinic as their preferred site of contraceptive care. Preferences may be influenced by where people usually seek care or where they can get affordable care.
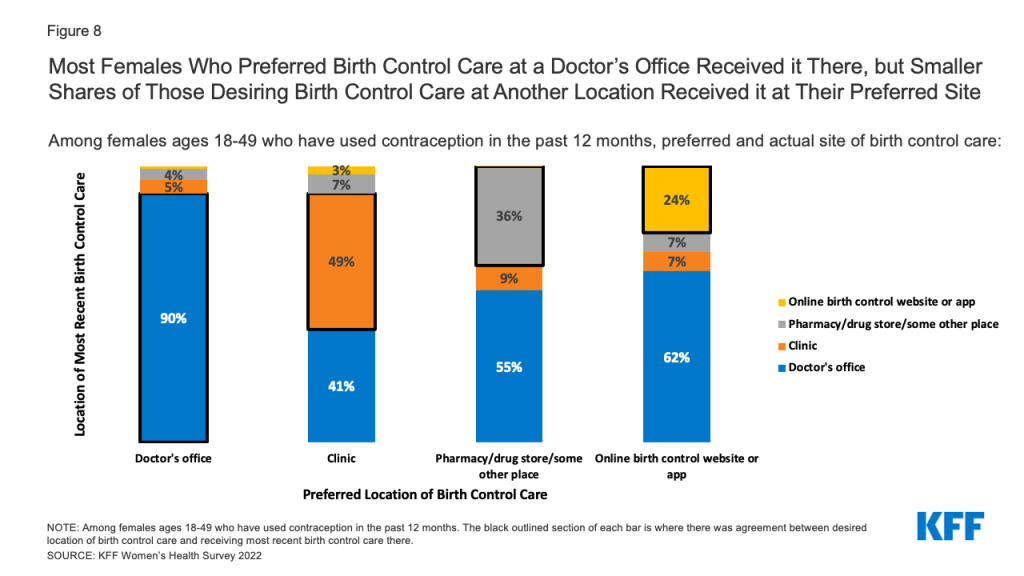
Females have several options for where to receive their birth control care, however, there is not always alignment between the site they prefer and the site they end up using. Six in ten females (59%) who used contraception in the past 12 months get their birth control care at their preferred location. Among females who prefer to receive their birth control care at a doctor’s office, 90% received their most recent care at a doctor’s office (Figure 8). However, only 49% of females who prefer to receive their birth control care at a clinic received their care there. Just over a third (36%) of females who prefer to receive their birth control at a pharmacy or drug store received their care there, and just about one-quarter (24%) of females who prefer to receive their birth control care through an online birth control website or app actually receive their most recent care through one (Figure X).
Females also report different reasons for preferring one setting over another for contraceptive care. Most people who prefer doctor’s offices say they choose it because that’s where they usually go (36%) or they trust the providers there (37%). Similarly, people who prefer clinics say they choose it because they trust the providers (28%), convenience (24%), and it’s where they usually go (22%). A large majority who prefer a pharmacy or drug store (71%) or online birth control app (88%) as their site of care say convenience is the reason.
Online Provision of Contraception
In recent years, there has been growth in companies, such as Nurx, The Pill Club, Roman, or hims/hers, which are online prescribing platforms or apps that operate outside of the traditional medical care system to provide a variety of primary care services, including contraception. While there have been reports of an influx of customers to these apps in recent years, particularly during the pandemic, they still serve only a small fraction of contraceptive users.
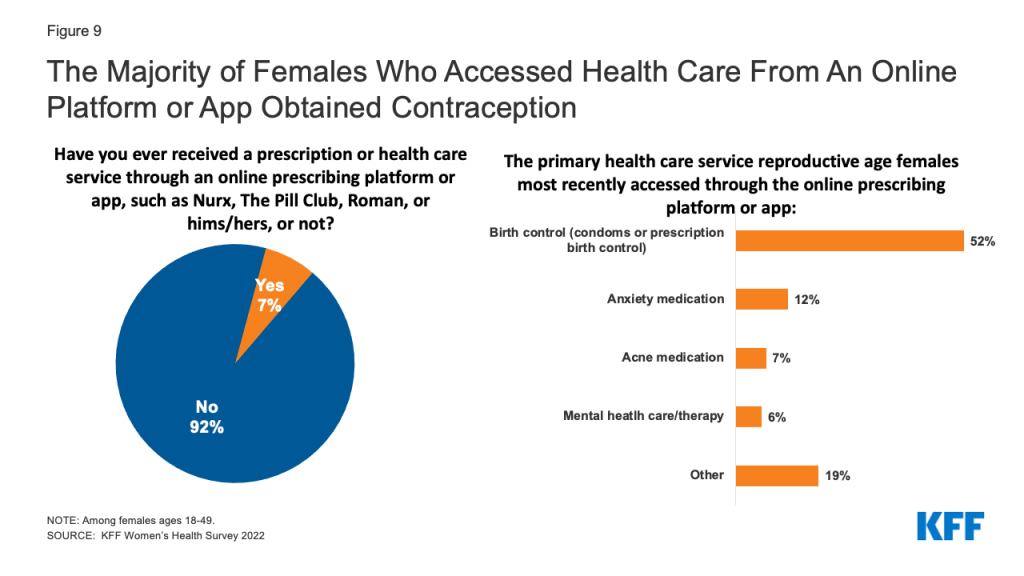
Overall, 7% of females ages 18-49 say they have received a prescription or obtained a health care service from one of these companies in the prior 12 months. Among this group, the majority have received birth control (condoms or prescription birth control) (52%). A smaller share of users obtained other services or products, including anxiety medications (12%), acne medications (7%), and mental health care/therapy (6%) (Figure 9). Common reasons for accessing health care services through an online prescribing platform include management of a chronic condition, including medications, as well as treatment for infections.
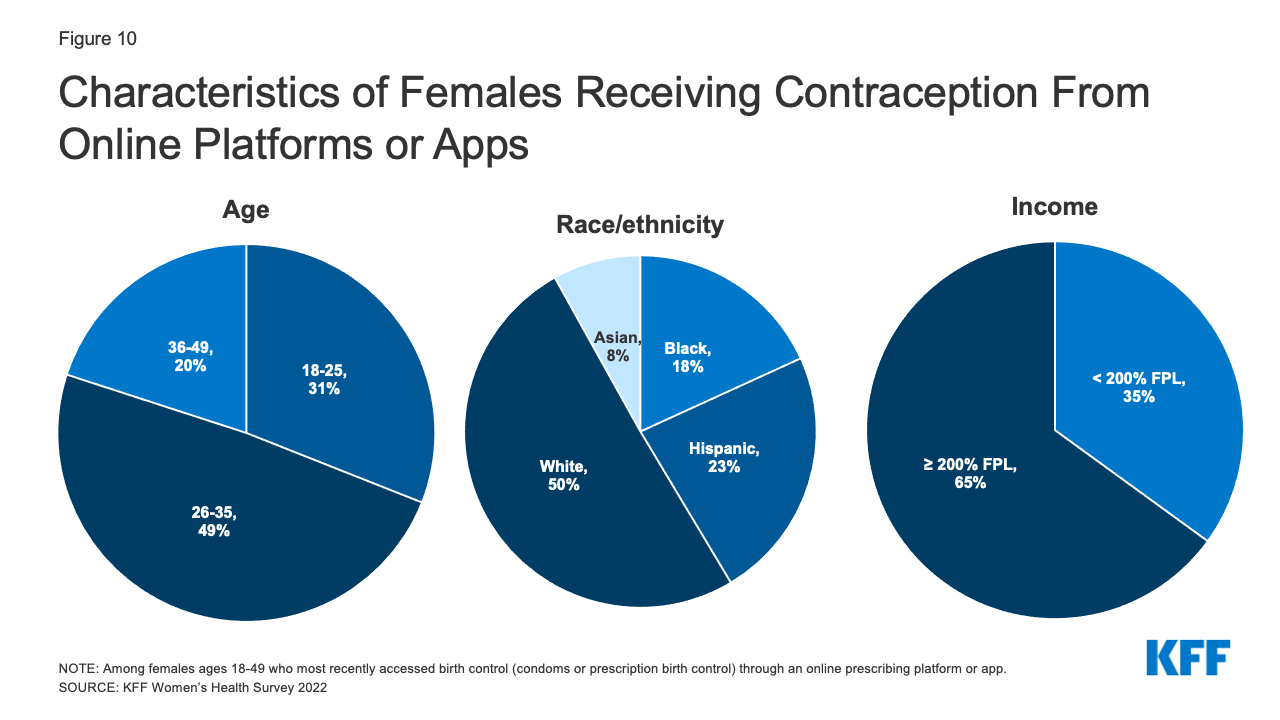
Among females who most recently obtained contraception from an online platform or app, 80% are under the age of 36, half (50%) are White, and more than one-third have low incomes (35%) (Figure 10).
Most online contraception platforms accept some form of insurance for some services and products, although not all companies accept both private insurance and Medicaid. Over half of reproductive age females who have received contraception through an online platform say their insurance, Medicaid, or some other public program covered the full cost of the service they received through the online prescribing platform or app (52%). Theoretically, they would be eligible for no cost coverage of their contraceptive visits and method if they went to an in-network provider. However, over half report paying out-of-pocket for at least some of the service (54%). This includes 13% whose insurance covered part of the cost and they paid the rest; 8% who had insurance, but it did not cover the product and they ended up paying out-of-pocket; and 8% who had coverage for the product, but the online platform didn’t accept it and they paid for it themselves. Fifteen percent said they didn’t have any insurance and paid the full amount of the service and product.
Contraceptive Supply
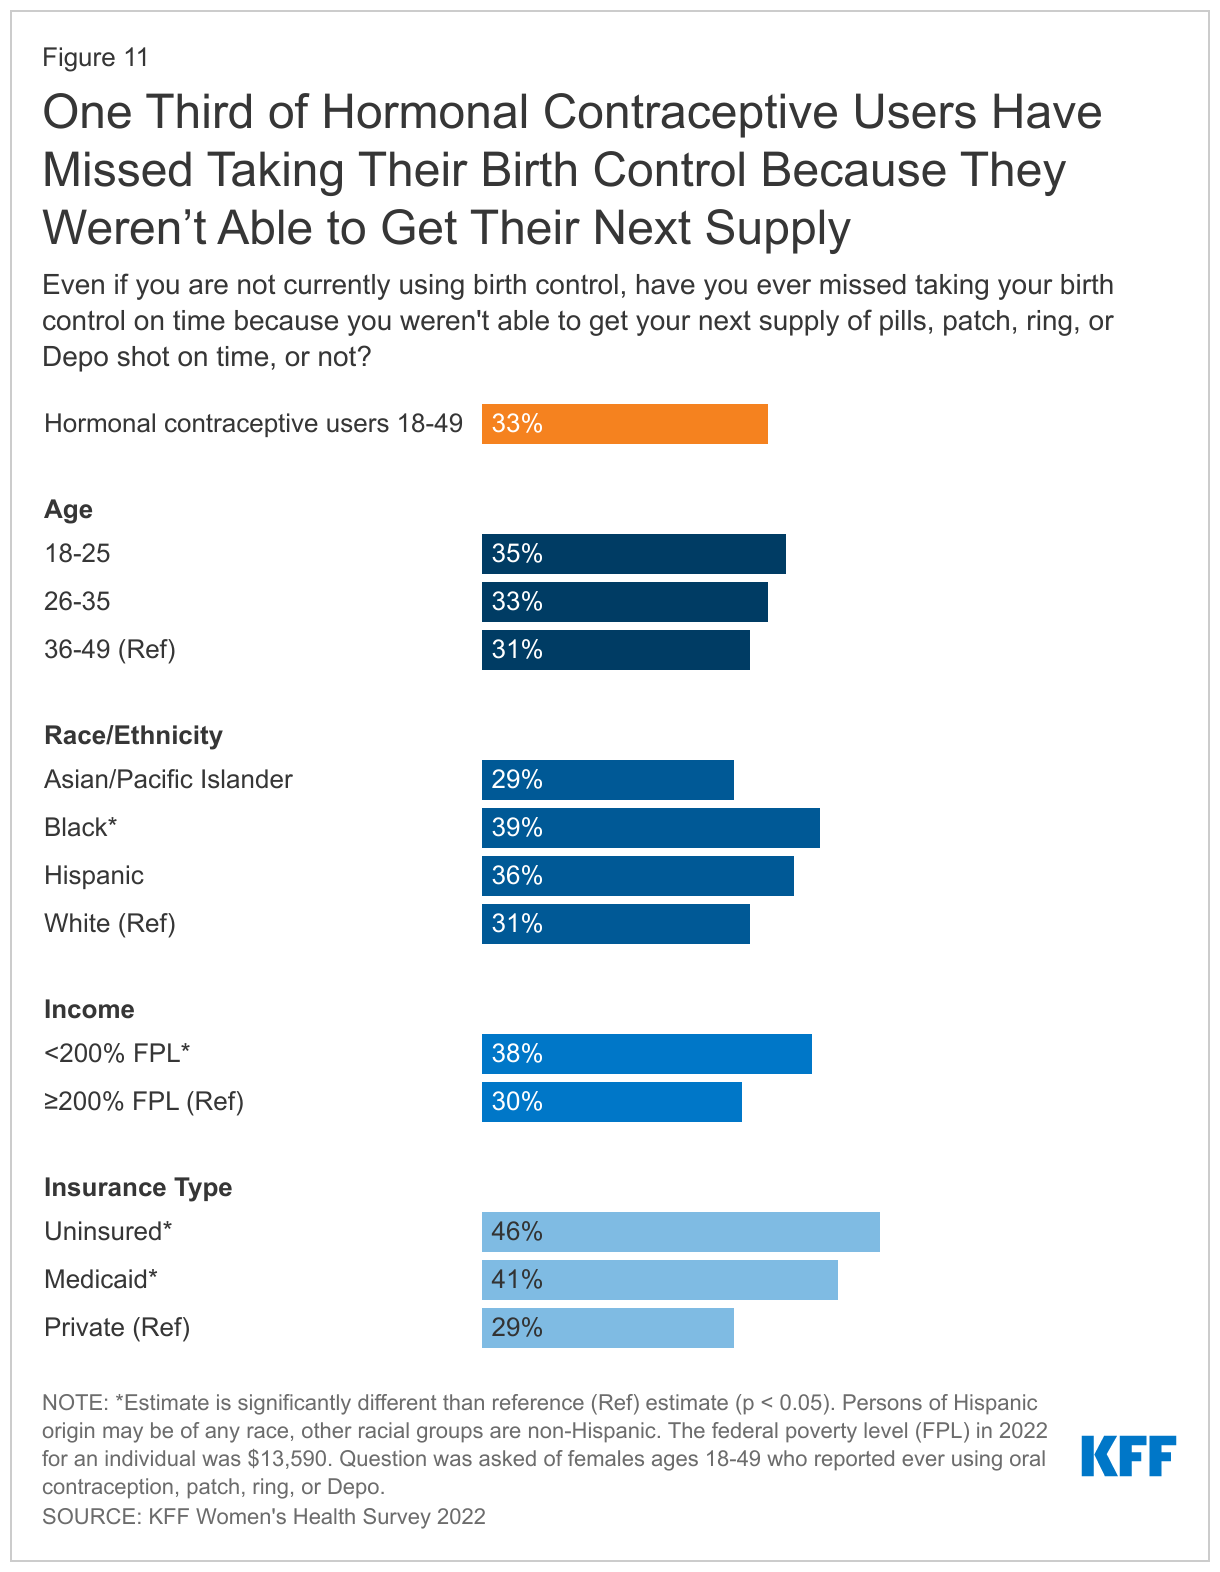
One-third (33%) of hormonal contraceptive users say they have missed taking their birth control because they were not able to get their next supply on time. This share is higher among Black females (39%) compared to White females (31%) and those with low incomes (38%) compared to those with higher incomes (30%). This was a problem for nearly half (46%) of uninsured females and four in ten (41%) females with Medicaid (Figure 11). Studies have documented the importance of ensuring people have adequate contraceptive supply in adherence to their contraceptive method.
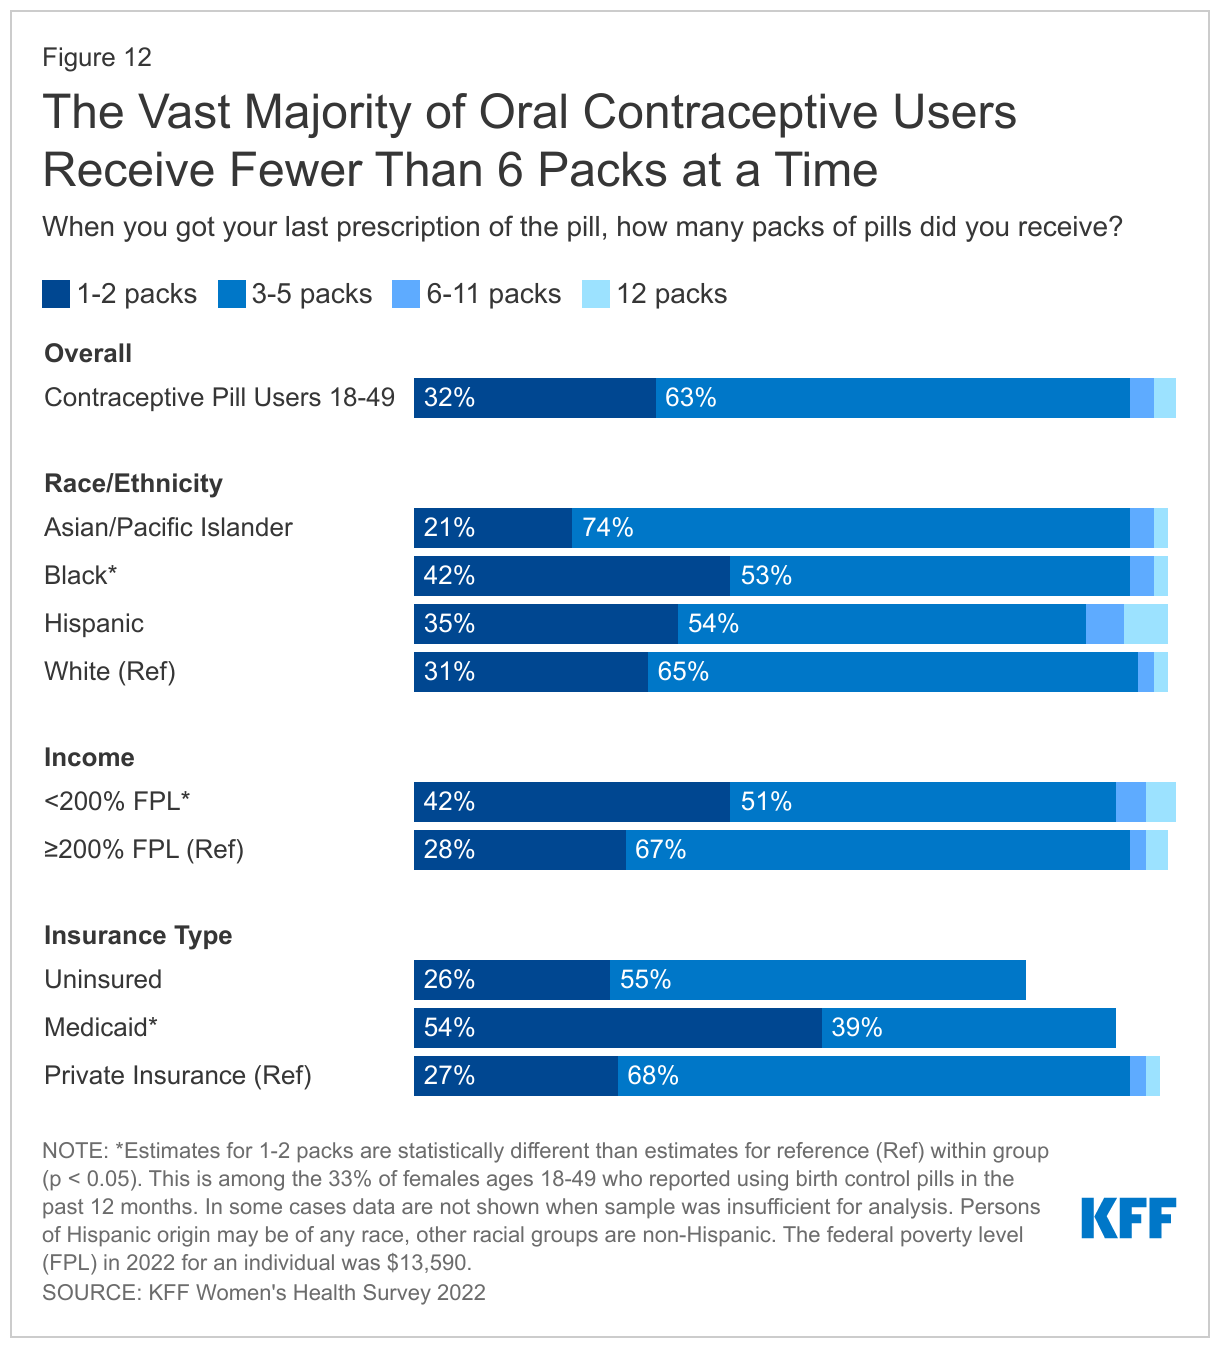
There has been a growing interest in making an extended supply of contraceptive pills and other hormonal methods available to those who use them. However, many females are still only getting one to two months' supply at time. Overall, about one third of females who used oral contraceptives got a one- or two-month supply. This share was higher among Black females, as well as those with low incomes, and those with Medicaid coverage (Figure 12).
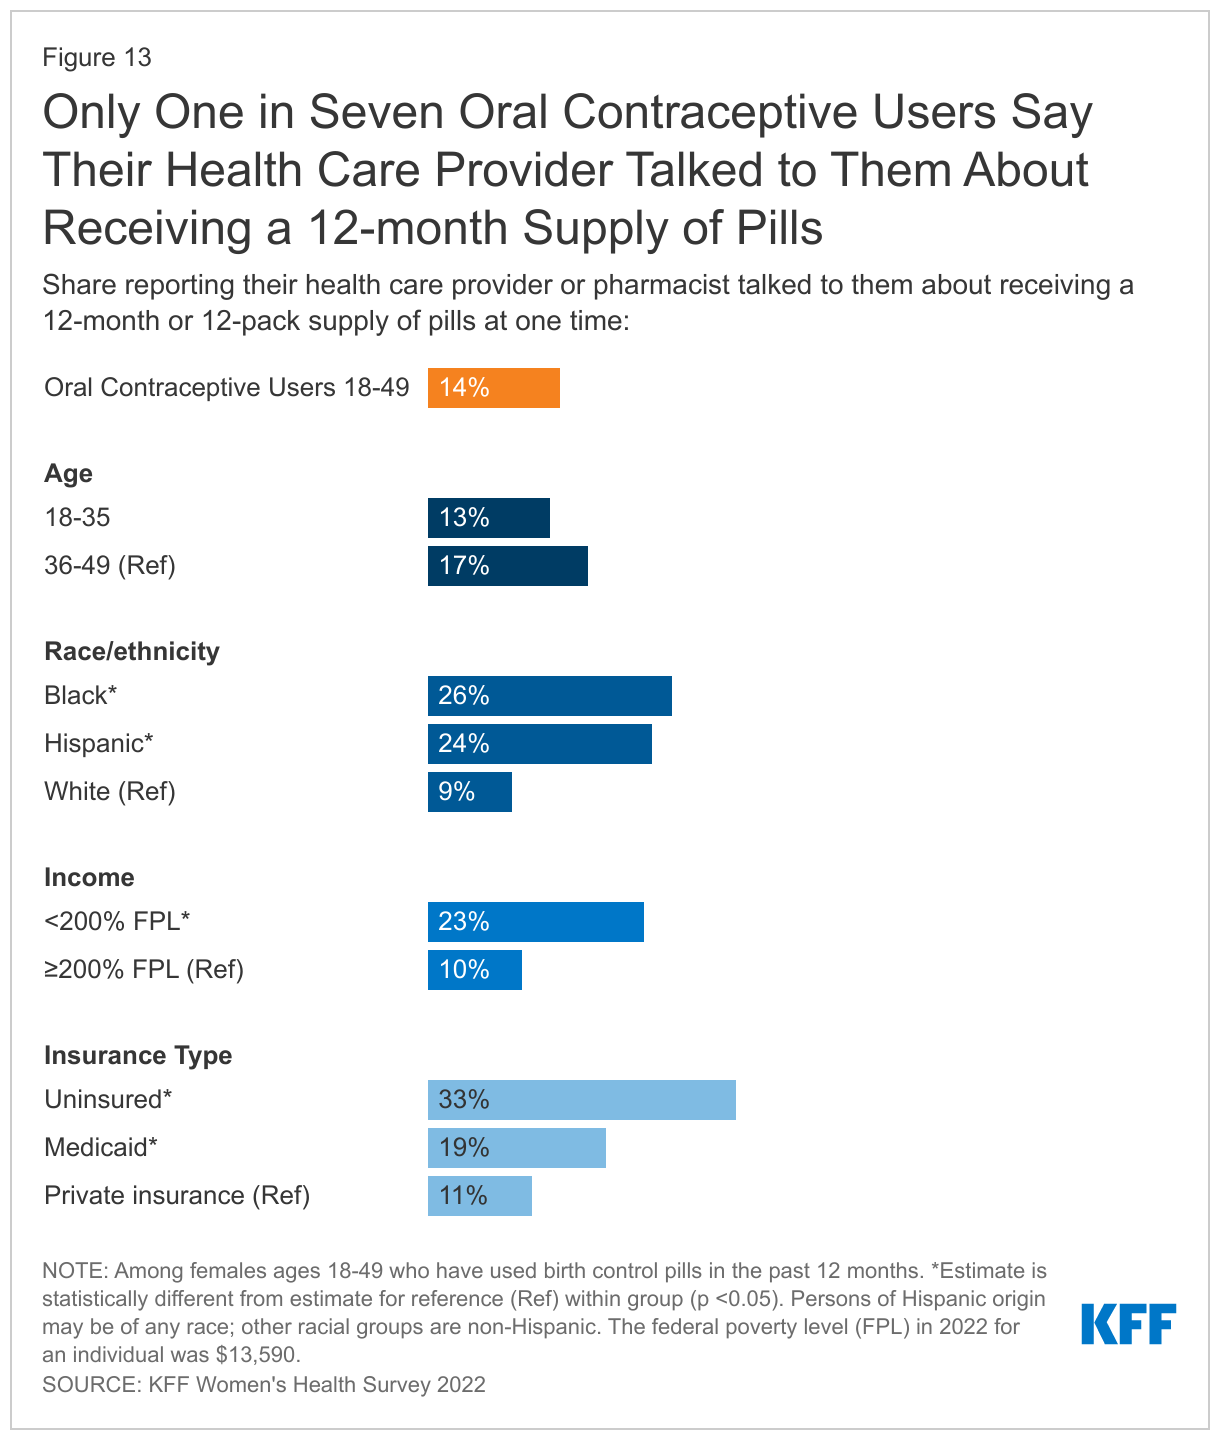
Research has shown that best practice is to offer oral contraceptive users an extended supply, and some states now require their state-regulated plans to cover a 12-month supply of contraceptives. However, few females get a 12-month supply. Furthermore, only 14% of females who have used birth control pills in the past 12 months say their health care provider or pharmacist talked to them about receiving a 12-months or 12-pack supply of pills at one time. Larger shares of Hispanic (24%), Black (26%), uninsured (33%), females with Medicaid (19%), and females with low incomes (23%) say their health care provider or pharmacist talked to them about receiving a 12-month or 12-pack supply of pills at one time than their counterparts (Figure 13).
Contraceptive Coverage
The ACA requires that most private plans cover contraceptive services for females without cost-sharing – this includes patient education and counseling and FDA approved methods of contraception with a prescription. This provision has dramatically reduced cost-sharing for contraception among females with employer or individual insurance market plans.
Among those using contraception in the past 12 months, seven in ten females with private insurance report that their insurance covered the full cost of their contraceptive method (70%), but 25% say they paid at least part of the cost out-of-pocket (Figure 14). There are a number of reasons that someone might have to pay part of the cost for contraceptives even though they have private coverage. For example, someone could be using a brand-name contraceptive that is not in the plan’s formulary or they are unaware of or not offered a generic alternative. Some people paying out-of-pocket could also be receiving care out-of-network or still be enrolled in a grandfathered health insurance plan, which is exempt from the requirement. However, half (50%) of this group do not know why they had to pay part of the cost out-of-pocket. Sixteen percent say they had to pay part of the cost themselves because they wanted a certain brand of contraception that was not covered by their plan (even though their plan should cover it if their provider recommends it for them). Some say it is because their prescribing provider (10%) or pharmacy (5%) was out of network, and one in five say it is for some other reason. Just one in five females who paid part of the cost out-of-pocket say that a health care provider or pharmacist offered them a no-cost alternative. Among those who had partial coverage for contraception and paid the rest out-of-pocket, almost one-third (32%) paid less than $15, almost one in five (19%) paid between $15 and $24, and one-third (37%) paid $25 or more (Figure 14).
Many people do not know that insurance plans are required to cover contraceptives for females. Although the ACA’s requirement for most private insurance plans to cover the cost of contraceptives for women took effect over ten years ago, many people are still not aware of it of this requirement. Four in ten reproductive age females (41%) do not know that plans are required to contraceptives for women. Conversely, while there is no federal requirement for coverage of vasectomies, three in ten males incorrectly believe there is (Figure 15).
No cost contraceptive coverage has helped alleviate cost barriers to contraceptives for many people, yet some still experience problems with getting their plan to cover their method in full. Six percent of reproductive age females with some form of coverage who used contraception in the past year report that they encountered problems getting their plan to cover or pay the full cost of their prescription birth control. Notably, a higher share of Black females, 11%, say they had problems getting their plan to cover or pay the full cost of their prescription birth control compared to 5% of White females. Of those who had problems, just 29% appealed the decision to their insurance company, even though federal rules require insurance companies to have a process for their enrollees to appeal contraceptive coverage denials.
The cost of contraceptives remains a barrier for some, even limiting their ability to continue their method. For those who are uninsured, costs can pose an even greater barrier. One in five uninsured females of reproductive age say they had to stop using a contraceptive method because they couldn’t afford it (Figure 16). This was also the case for nearly one in ten females who are Hispanic (9%) or make less than 200% of the federal poverty level (9%). Without coverage or access to free or low-cost services, uninsured females are faced with having have to pay out of pocket for contraceptives, use a method they do not prefer, or go without contraception altogether. Among females who say they had to stop using a method due to affordability problems, many (60%) did let their health care provider know, but nearly four in ten (38%) did not.
Quality of Care/Contraceptive Counseling
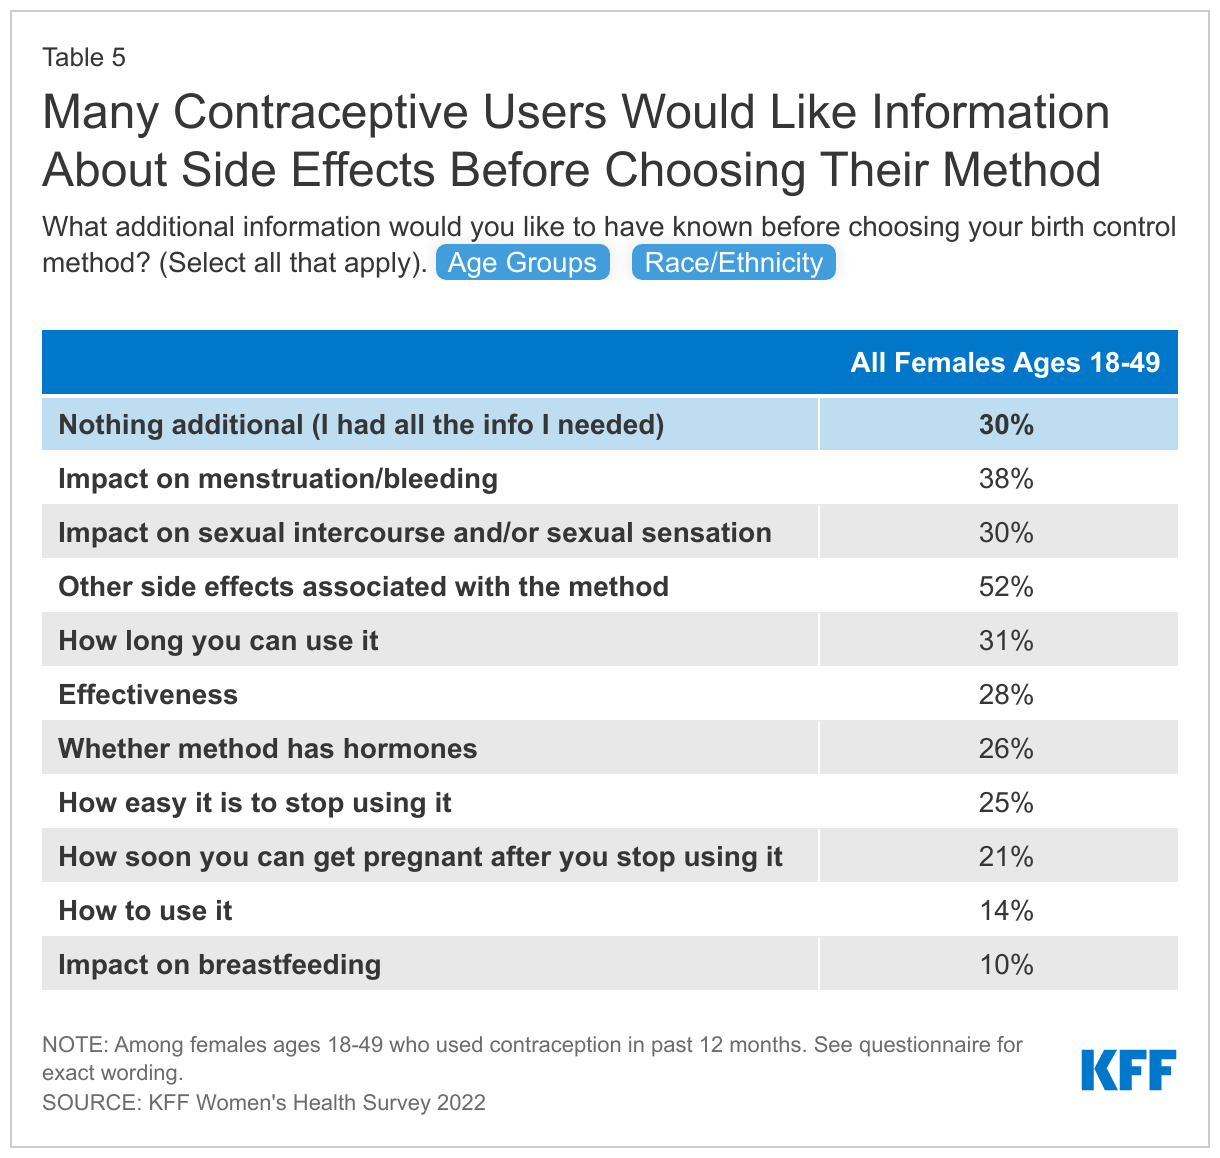
Just three in ten (30%) reproductive age contraceptive users say they had all the information they needed to choose a contraceptive method. Side effects from contraception are a major concern for females. When asked what information they would have liked to have had before starting on their current method, nearly four in ten (38%) contraceptive users say impact on menstruation and bleeding, 30% say impact on sex, and over half (52%) say other side effects associated with the method (Table 5). Other top informational needs are how long you can use the method (31%) and effectiveness (28%). In addition, a higher share of younger females than older females say they would have liked information on how easy it is to stop using a contraceptive and how soon you can get pregnant after stopping it.
While 35% of females ages 36-49 say that they did not need any additional information, this was the case for only 24% of females ages 18-25. A higher share of females ages 18-25 than females ages 36-49 would have liked information on how easy it is to stop using a contraceptive and how soon you can get pregnant after stopping it.
Across race/ethnicity groups, side effects associated with the method is the leading informational need. About half of White (51%), Black (50%), and Hispanic (48%) females would have liked to know about side effects before choosing a contraceptive method, while two-thirds of Asian/Pacific Islander females (67%) say they wished they had that information. Just 12% of Asian/Pacific Islander females say they had all the information they needed before choosing a method, compared to more than a quarter of Hispanic (26%) and Black (28%) females and one-third of White females (34%).
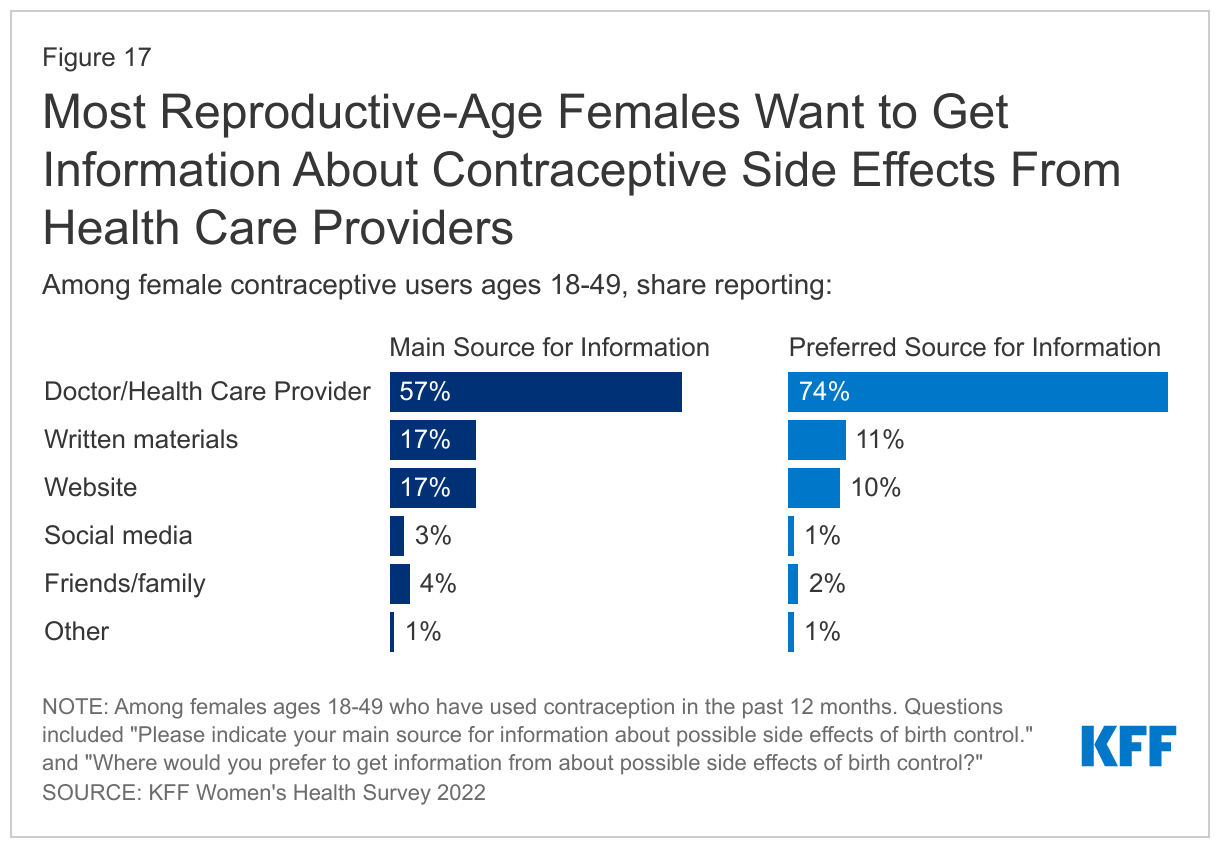
Health care providers are the main source of information about possible side effects from birth control for over half (57%) of reproductive-age females who use contraception (Figure 17). Fewer rely on written materials (17%) or a website (17%). When asked their preferred source for information about birth control side effects, three in four (74%) say doctors and health care providers. Although many (52%) say they would have wanted additional information about side effects, most females who have had a recent provider visit and use contraception (62%) say that their provider had talked to them about possible side effects before they started their current method. Providers often have limited time to counsel patients, which can leave patients without the information they want to make an informed decision about contraception.
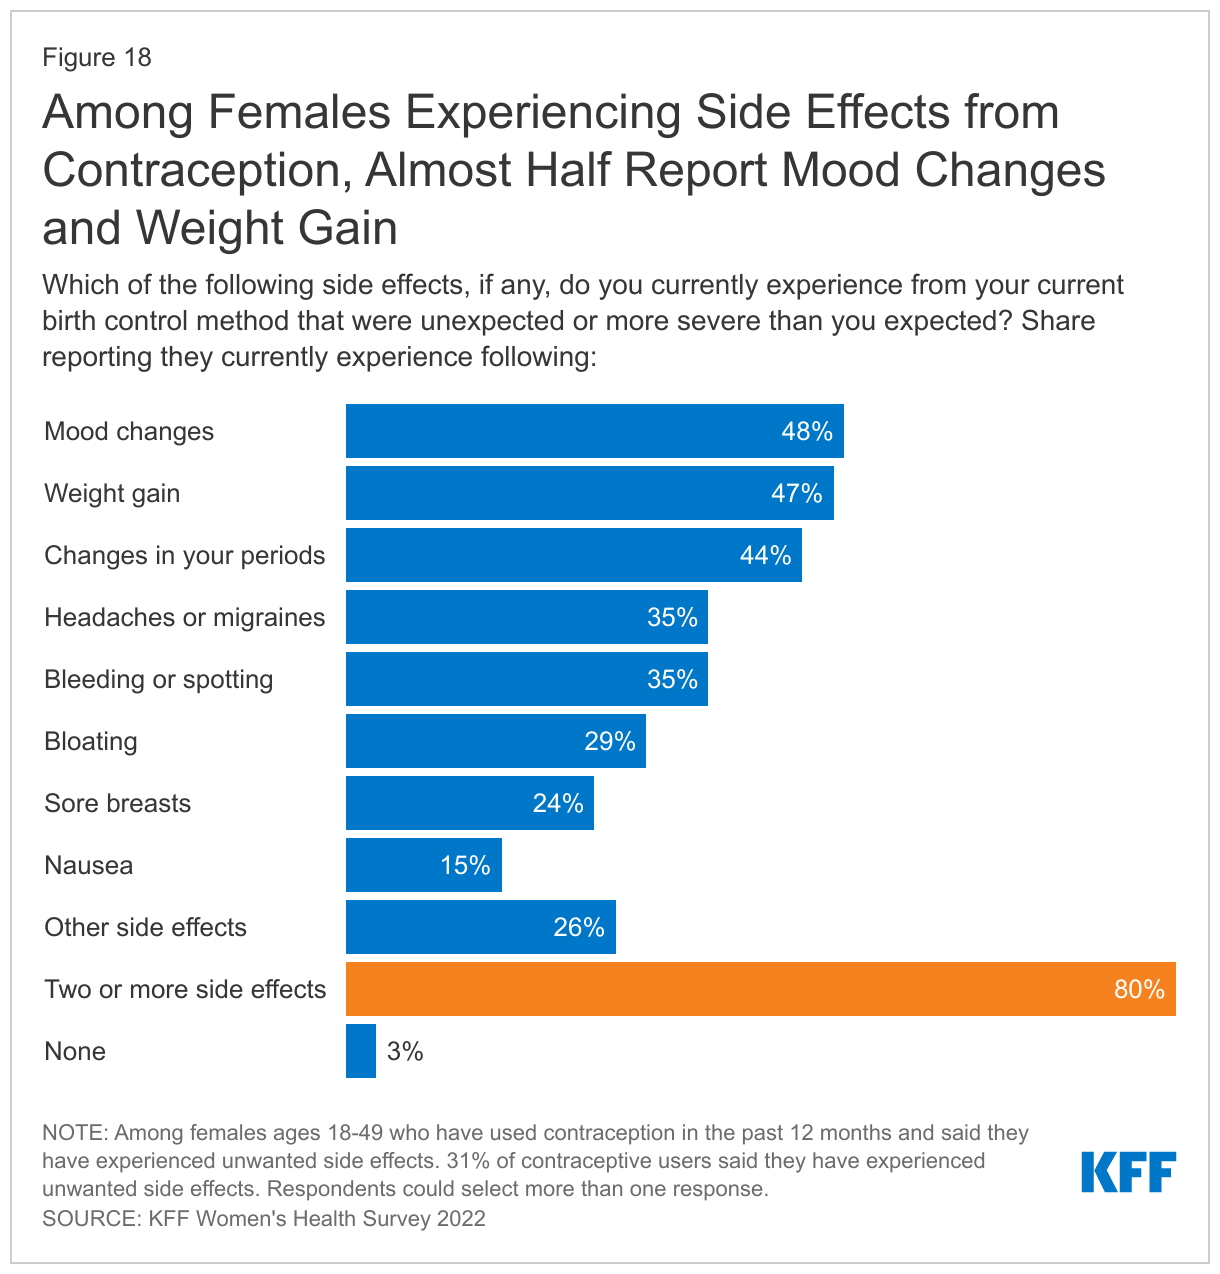
Almost one-third of contraceptive users (31%) say they are experiencing side effects from their current method, and just over half (52%) say the side effects are more severe than they expected. Among those experiencing side effects, more than four in ten report mood changes (48%), weight gain (47%), and changes in periods (44%) (Figure 18). Eight in ten (80%) say they experienced more than one of these side effects. Just over half (54%) say they have talked to their health care provider about these side effects.
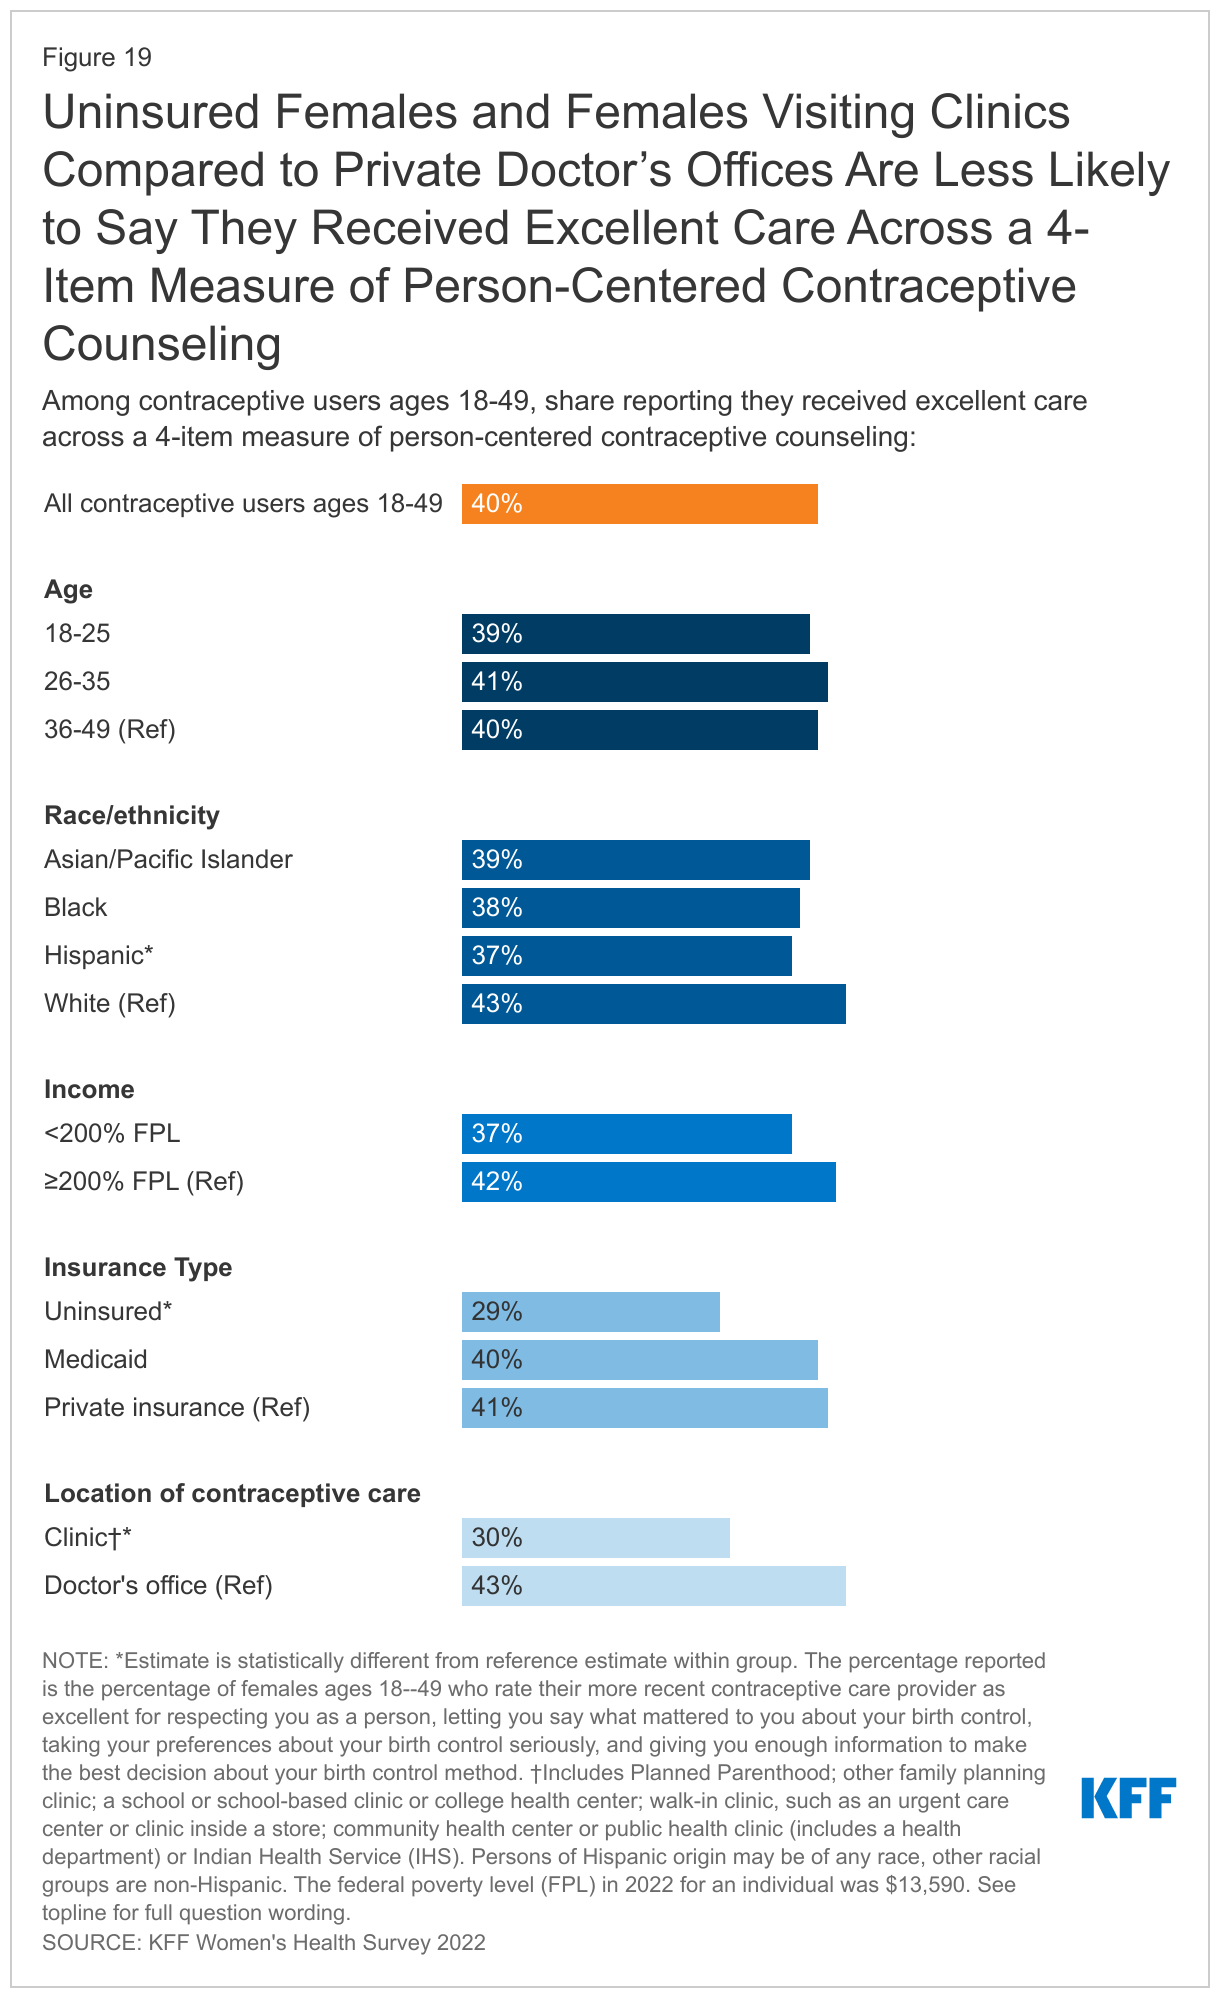
Only four in ten females report receiving person-centered counseling that is rated excellent on all dimensions.
Interactions with providers play an important role in the quality of contraceptive care, as providers are the main source of information that people have when making a decision about their birth control and understand potential side effects. While there has been considerable emphasis on prioritizing access to the most effective methods, there is also growing recognition of the importance of ensuring that patient-provider relationships are patient-centered and support patient decision making in the context of contraceptive counseling. Approximately 40% of female contraceptive users rate their most recent contraceptive care provider as “excellent” on all four items of person-centered contraceptive counseling (Figure 19): respecting them as a person, letting them say what mattered to them about their birth control method, taking their preferences about their birth control seriously, and giving them enough information to make the best decision about their birth control. Uninsured females and females receiving contraceptive counseling at clinics compared to private doctor’s offices are less likely to rate their care as excellent.
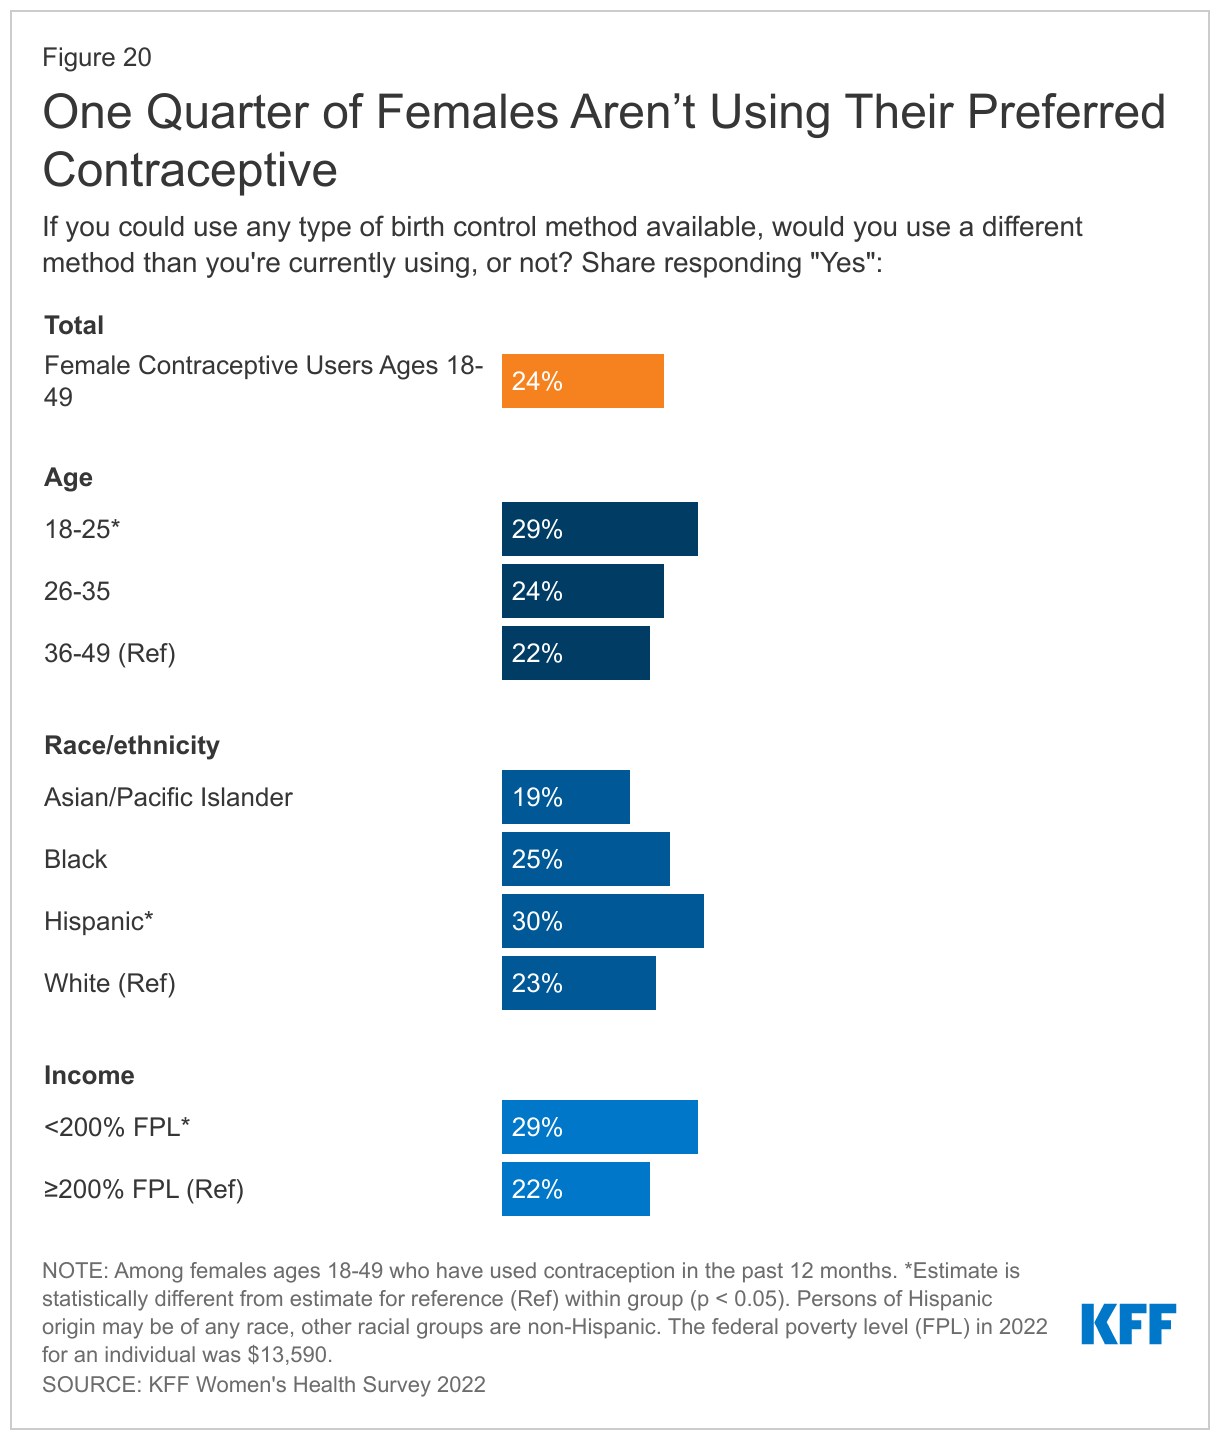
While most people are using their preferred method of contraception, a sizable minority -- one in four contraceptive users -- are not. Another important component of high-quality contraceptive counseling is taking seriously patients’ preferences and letting them say what matters to them about their birth control method. When asked if they would use a different method than the one they are using, three in four contraceptive users say “no”, but one in four (24%) say “yes.” Higher shares of Hispanic females (30%) and females with lower incomes (29%) are not using their preferred method, compared to their counterparts (Figure 20).
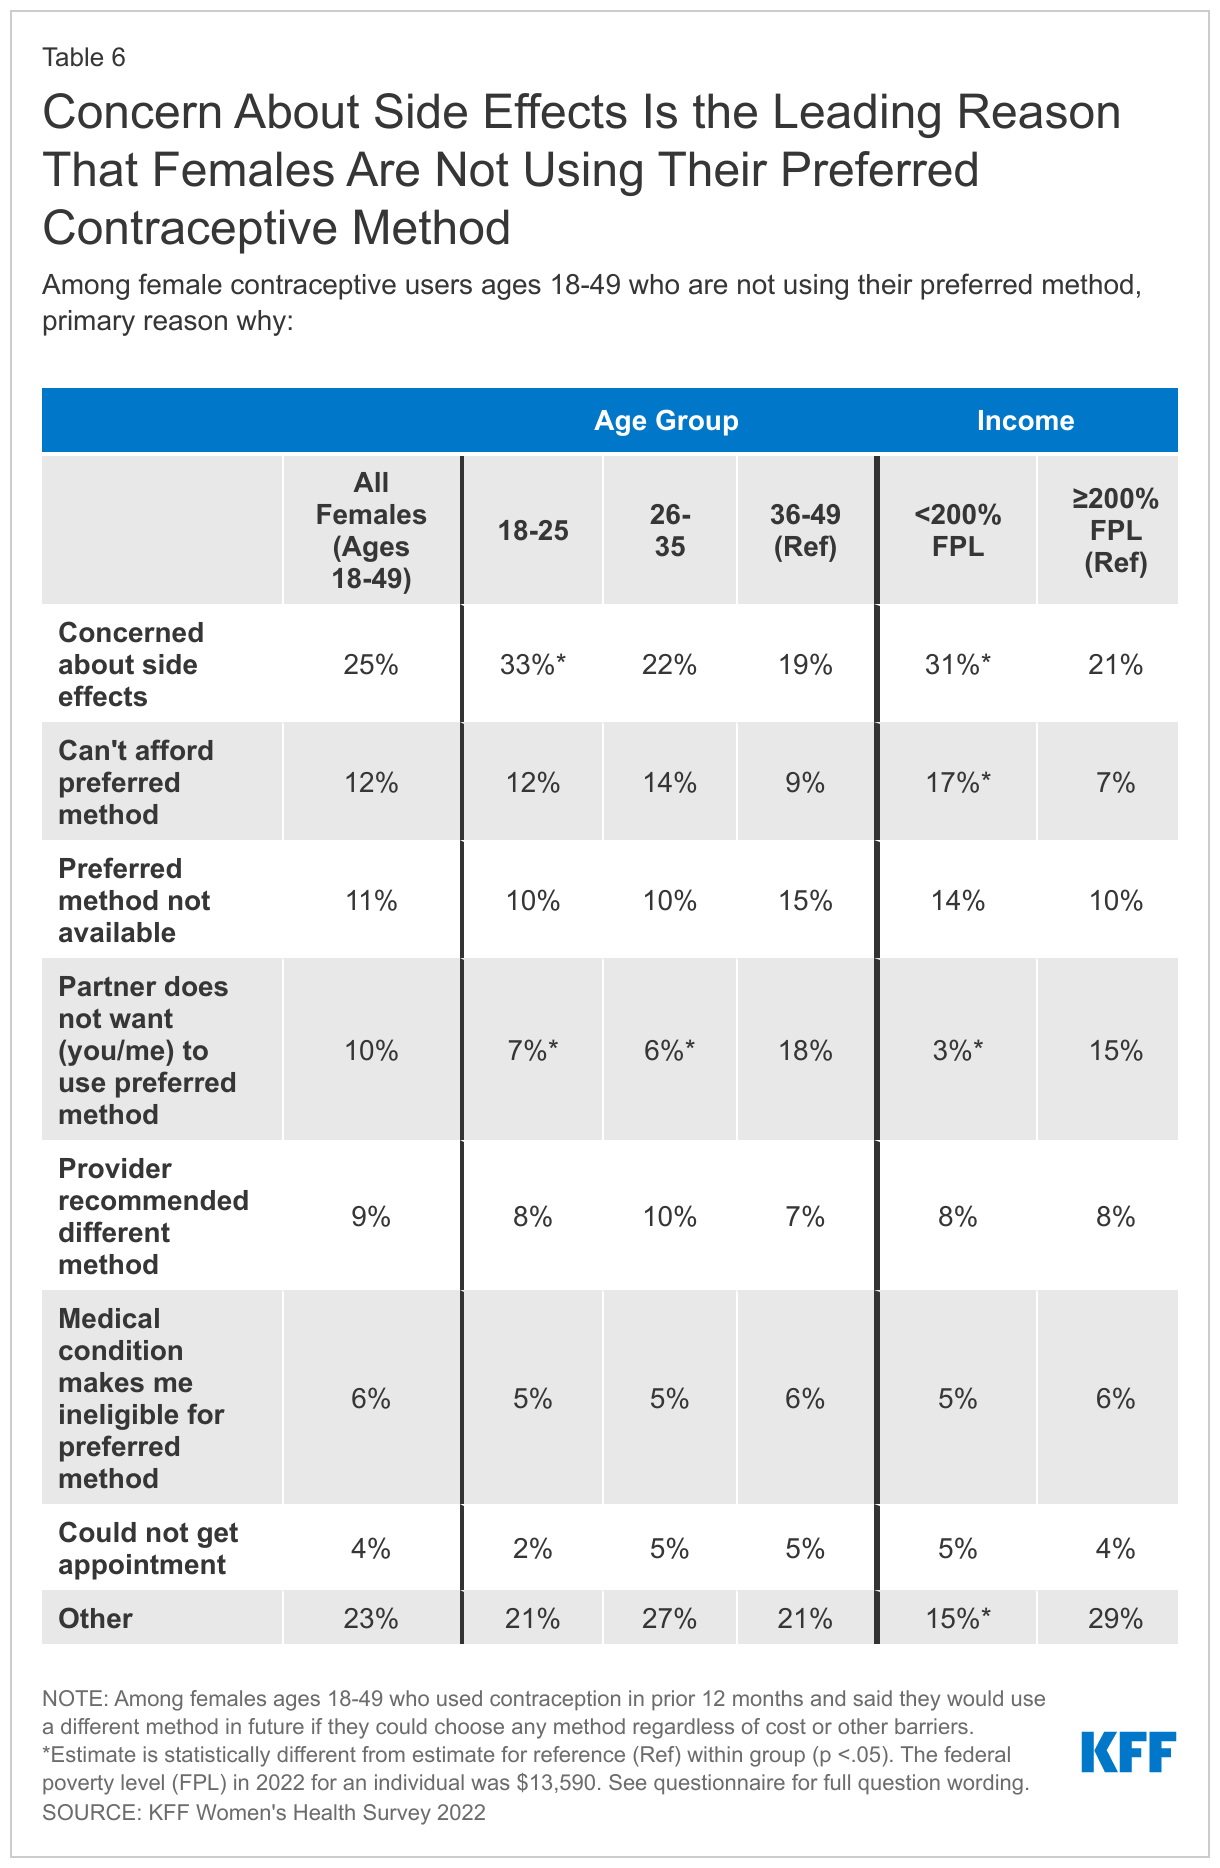
Among females who are not using their preferred contraceptive method, one in four say the primary reason is concern about side effects (25%). About one in ten say they can’t afford their preferred method (12%), their preferred method was not available (11%), their partner does not want them to use their preferred method (10%), or their provider recommended a different method (9%). However, there are some differences by age, race/ethnicity and income level (Table 6). One in three younger females ages 18-25 (33%) cites side effects as the primary reason they aren’t using their preferred method, compared to one in five females ages 36-49 (19%). About one in ten say they can’t afford their preferred method (12%), their preferred method was not available (11%), their partner does not want them to use their preferred method (10%), or their provider recommended a different method (9%). Notably, 17% percent of females with lower incomes say that they aren’t using their preferred method because they can’t afford it compared to 7% of females with higher incomes, and 15% of females with higher incomes say they aren’t using their preferred method because their partner objects to it compared to 3% of females with lower incomes.
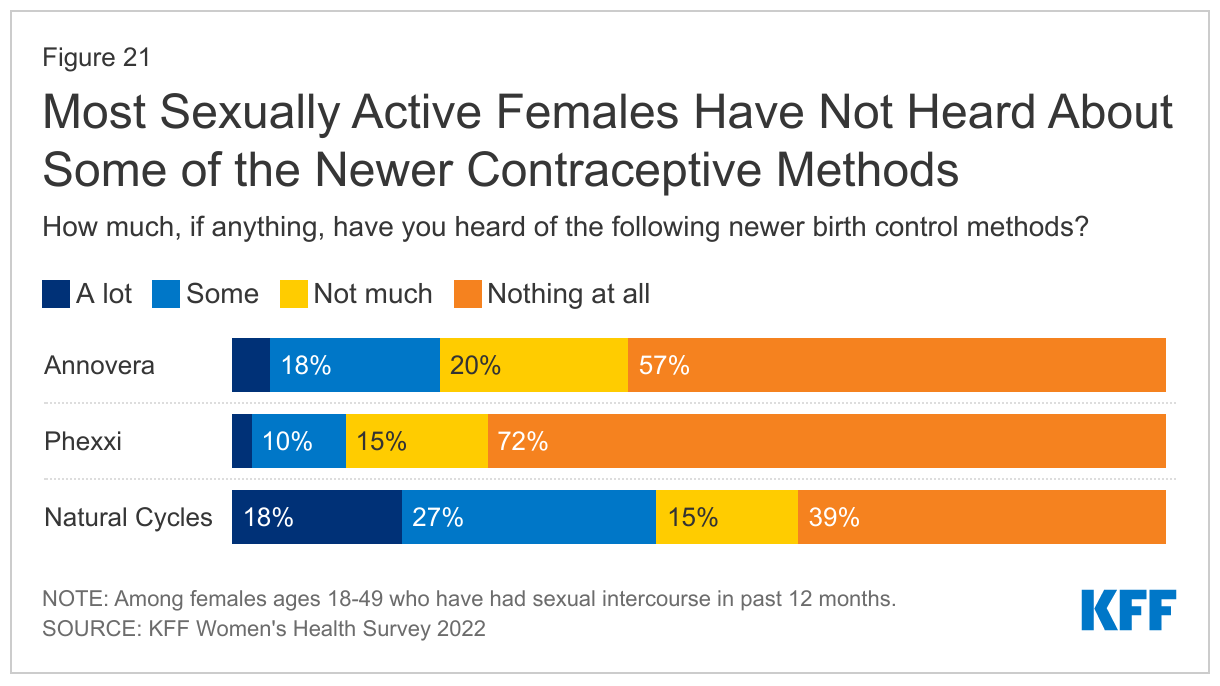
Most sexually active, reproductive age females are not familiar with contraceptive methods that have recently come to the market. In recent years, the FDA has approved some new contraceptive options, some of which are designed to have fewer side effects. However, awareness of these newer methods is low. Just over one in five (22%) sexually active females has heard some or a lot about Annovera, a vaginal ring that is effective for up to one year approved by the FDA in 2018 (Figure 21). Phexxi is a novel contraceptive vaginal gel that received FDA approval in 2020, but just over one in ten (13%) females has ever heard anything about it. A higher share of females (45%) has heard a lot or some about Natural Cycles, an app that can be used to track the menstrual cycle and identify fertile periods and was cleared by the FDA as a medical device in 2018. A higher share of younger females ages 18-35 than those ages 36-49 report having heard at least something about Annovera (24%, 20% respectively) and the Natural Cycles app (51%, 38% respectively) (data not shown).
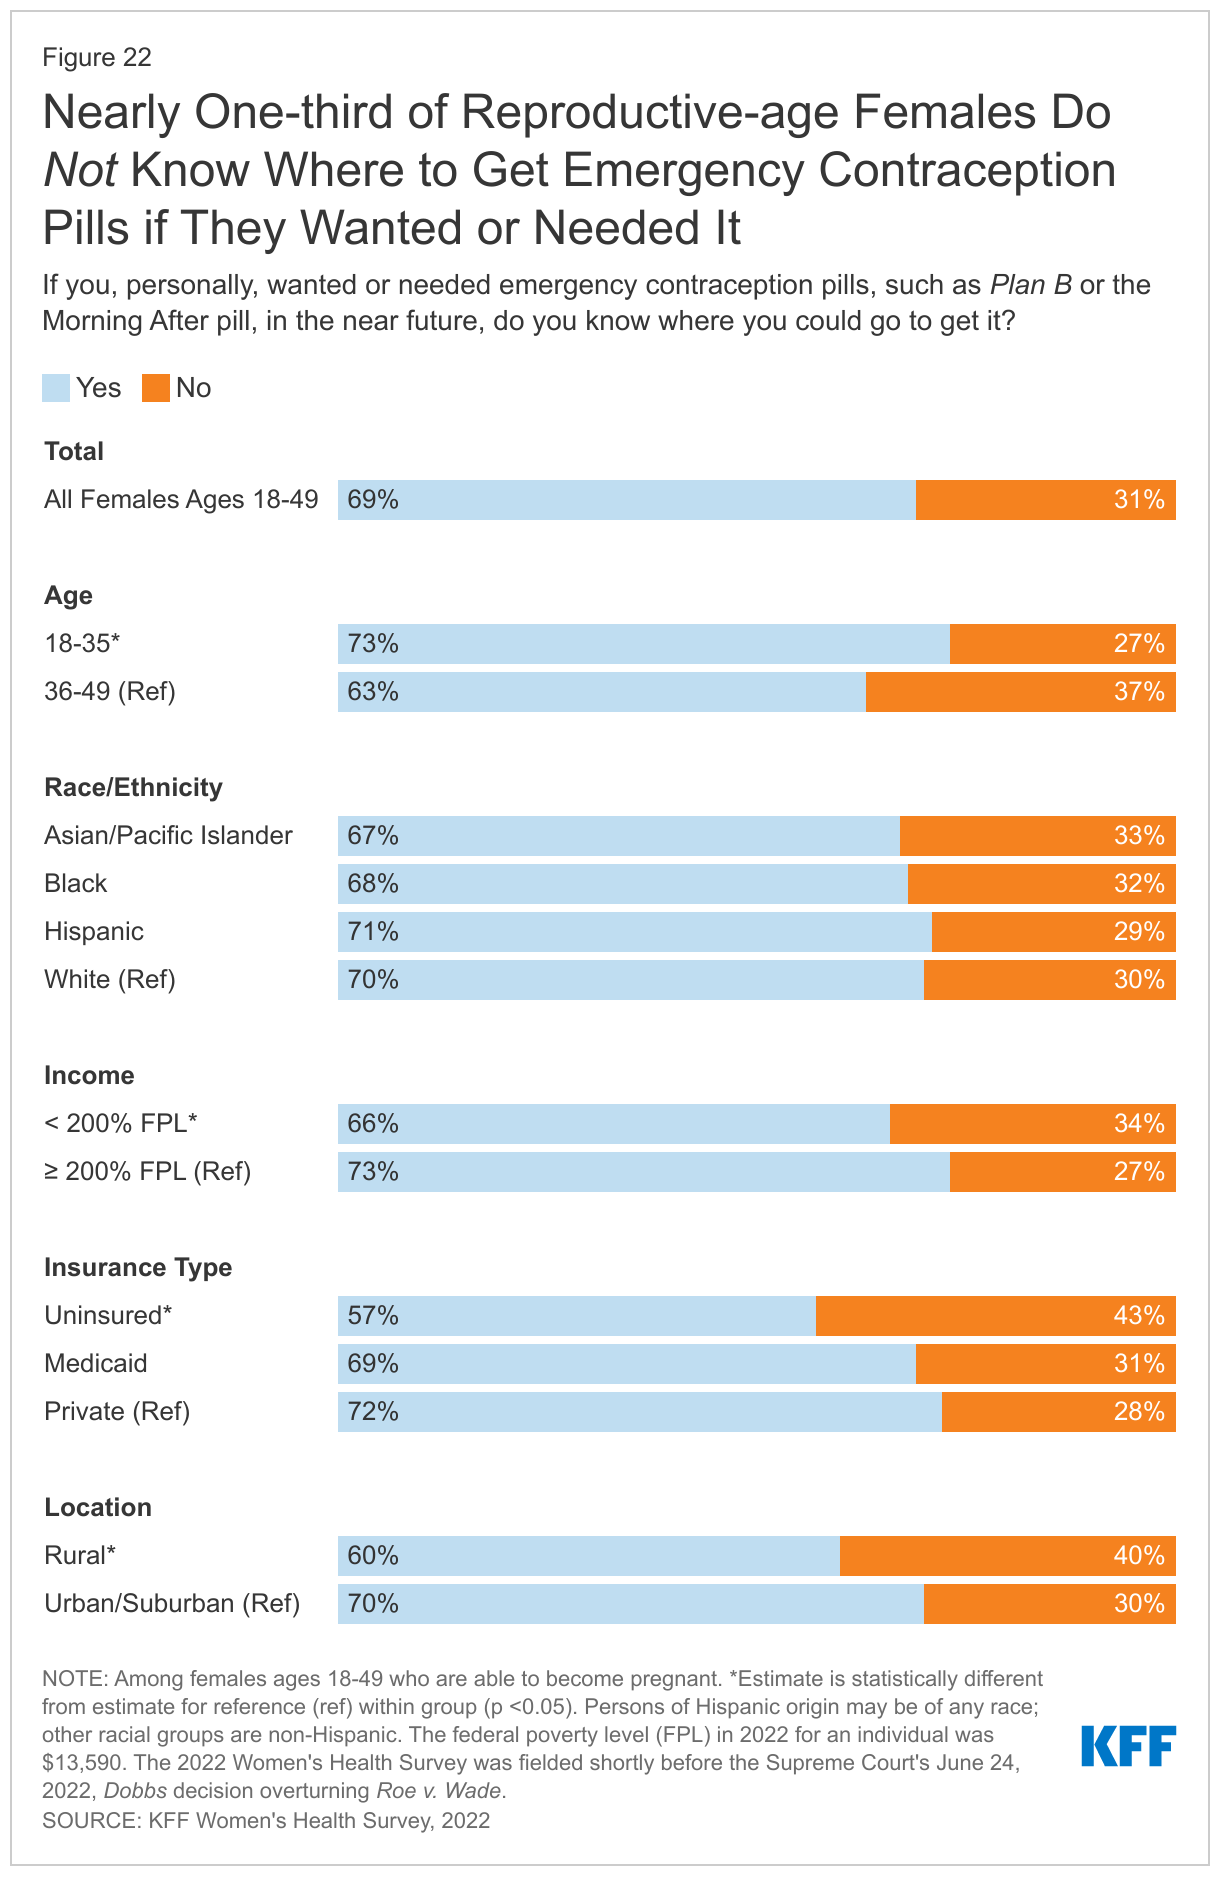
Nearly one-third of reproductive age females (31%) don’t know where to get emergency contraceptive pills (EC), a backup for missed birth control or contraceptive failure. EC pills, also called the morning after pill or Plan B, are a form of backup birth control that can be used within three to five days of unprotected sex or contraceptive failure to prevent pregnancy. Progestin only pills such as Plan B and its generic equivalents have been available over the counter (OTC) for many years, while another EC pill with a different chemical formulation, ella, (ulipristal acetate) requires a prescription and has a longer window of time that it is effective after unprotected sex. EC pills are not the same as medication abortion pills (mifepristone and misoprostol) and do not end a pregnancy nor cause an abortion.
Over one in four females ages 18-35 (27%) and 37% of those ages 36-49 do not know where they could obtain EC pills if they wanted it in the near future (Figure 22). Lack of knowledge about where to get EC pills is higher among females living in rural areas (40%) compared to those who live in urban/suburban areas (30%). While Plan B is an OTC drug, studies have found that access in pharmacies can be limited, particularly in rural communities.
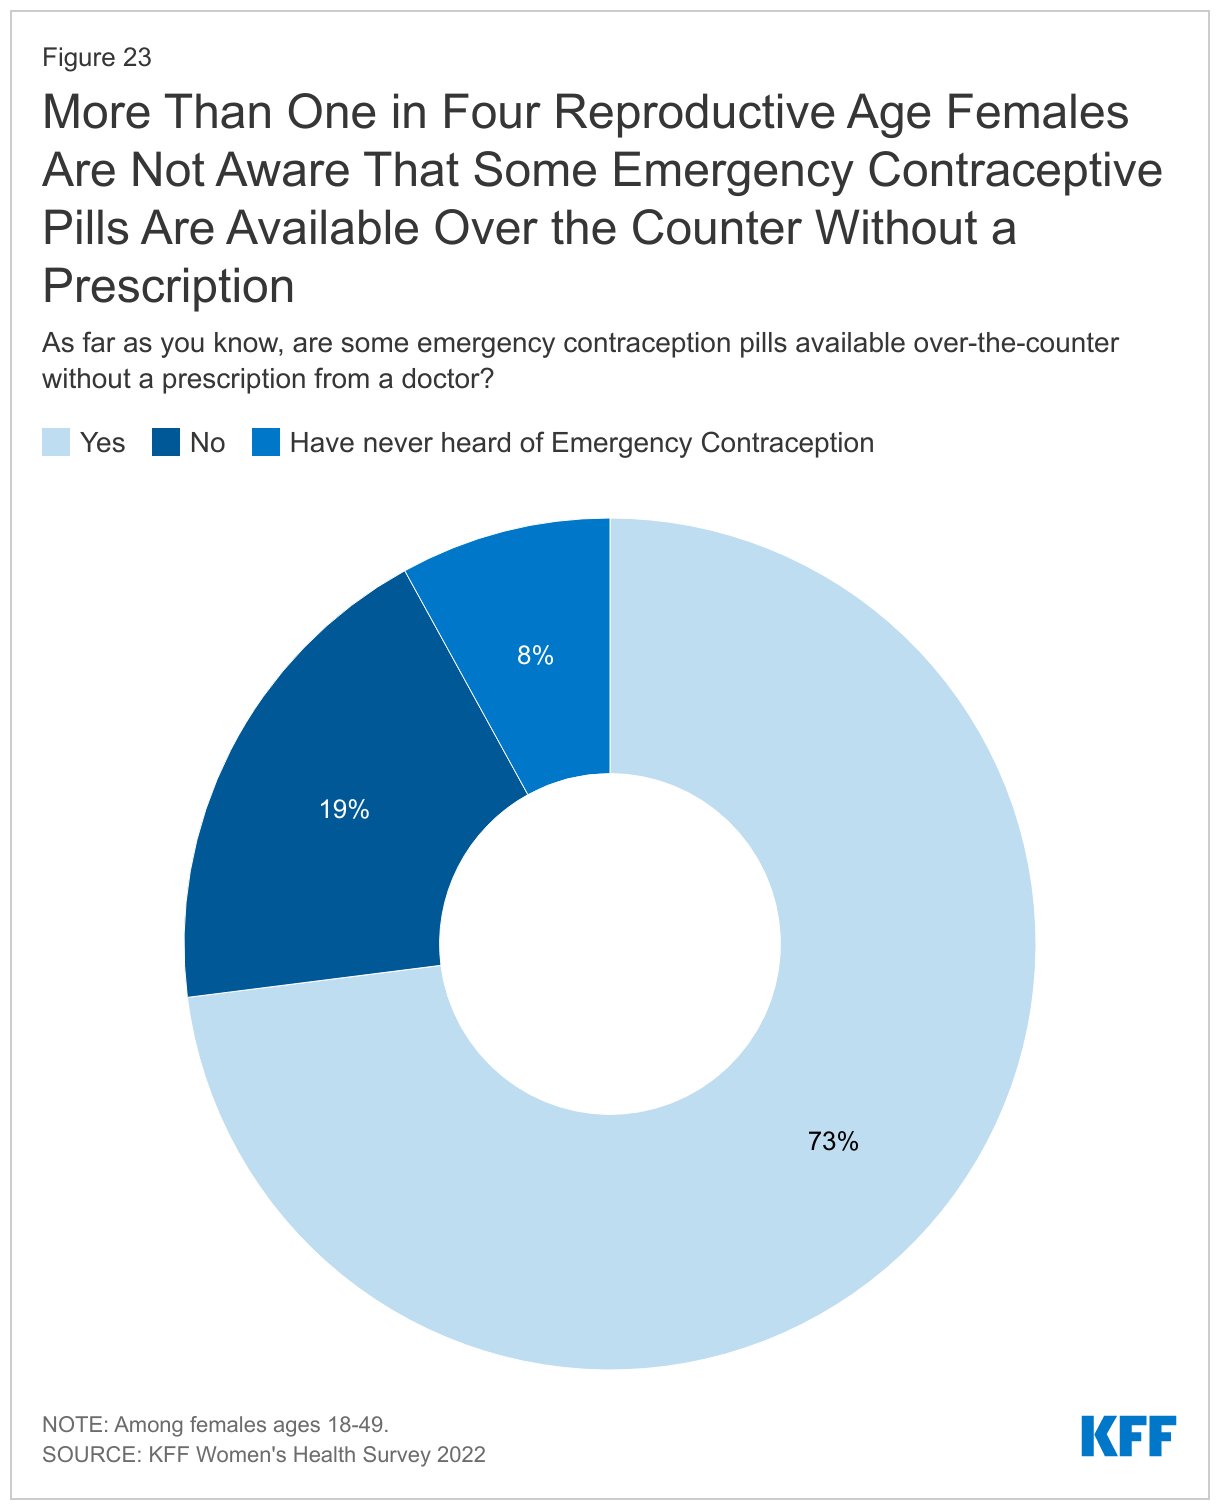
More than one in four reproductive age females are not aware that some EC pills are available over the counter without a prescription. Since EC must be taken soon after sex, over the counter availability can help people obtain it more quickly. Seven in ten (73%) reproductive age females know that some EC pills are available over the counter without a doctor’s prescription, but 19% do not know that and 8% have not heard of EC (Figure 23). This could affect their ability to obtain EC in a timely manner.
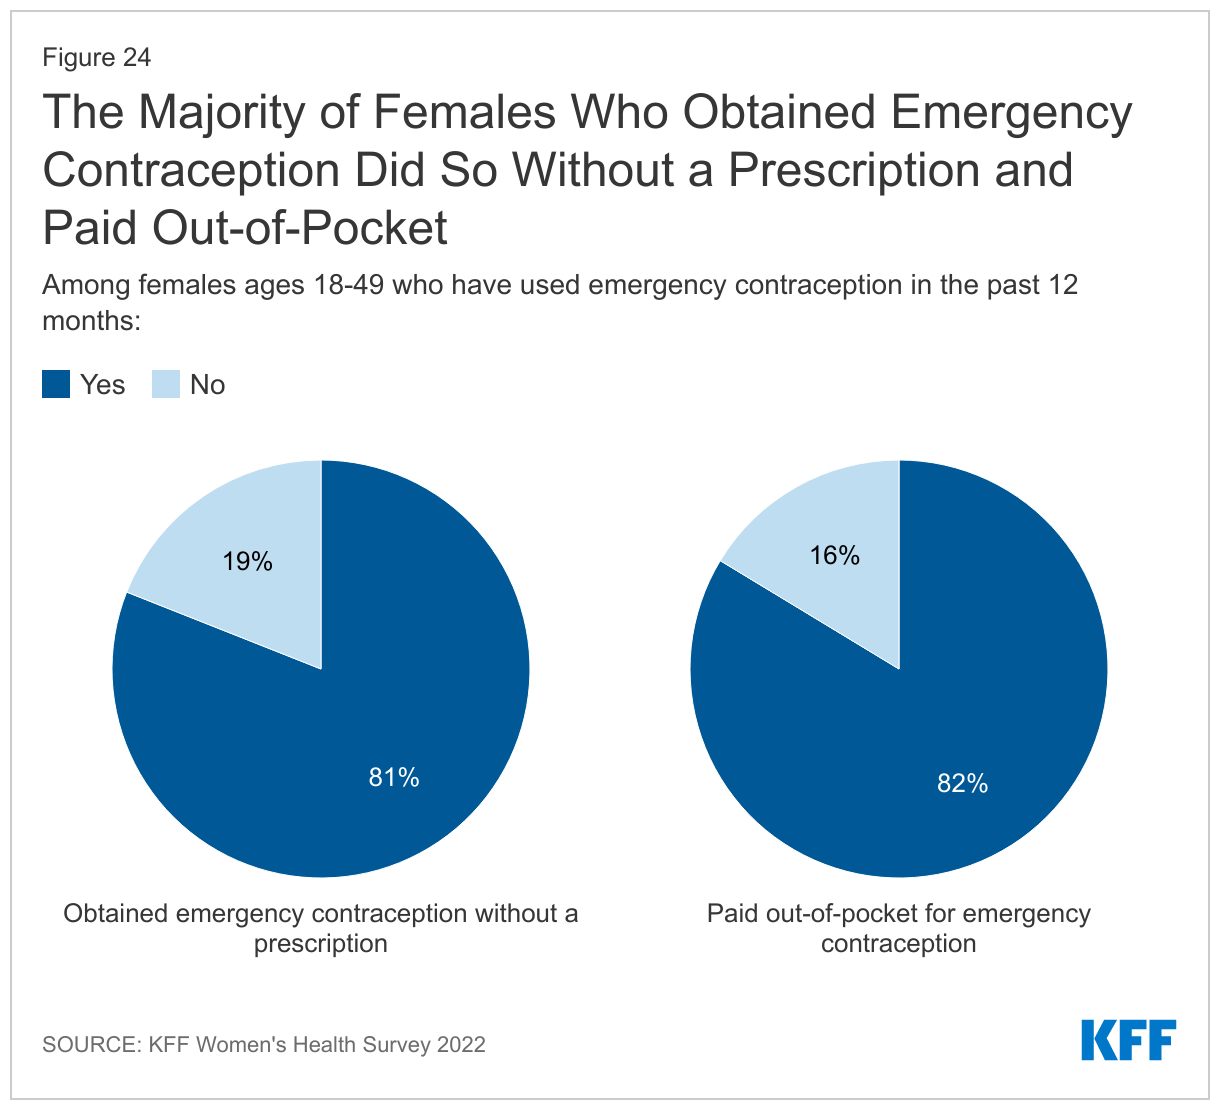
Among those who have used EC recently, most obtained it without a prescription and had to pay for it out of pocket. Among reproductive age females who have used EC in the prior 12 months, more than eight in ten (81%) obtained it without a prescription (Figure 24). Most also reported that they had to pay for it out of pocket (82%). On average, Plan B pills can range from $10-$50 when purchased over the counter, which may be unaffordable for many young people.
Abortion Knowledge Prior to the Dobbs Decision
Access to contraception intersects with abortion policy, especially now in the aftermath of the Supreme Court decision in Dobbs v. Jackson Women’s Health Organization, which eliminated the federal right to an abortion. The decision whether to ban or permit abortion is now largely up to state policymakers and there is increasing evidence that some states may also move to limit access to contraceptives like IUDs and emergency contraception.
This survey finds that approximately one in four (27%) females ages 18-64 say they have had an abortion during their lifetime, similar to findings in other studies. Abortions can be conducted by medical procedures or by medication. Medication abortion, which are pills that can be taken at home, is approved by the FDA for use up to 10 weeks gestation, and now accounts for more than half of abortions nationally.
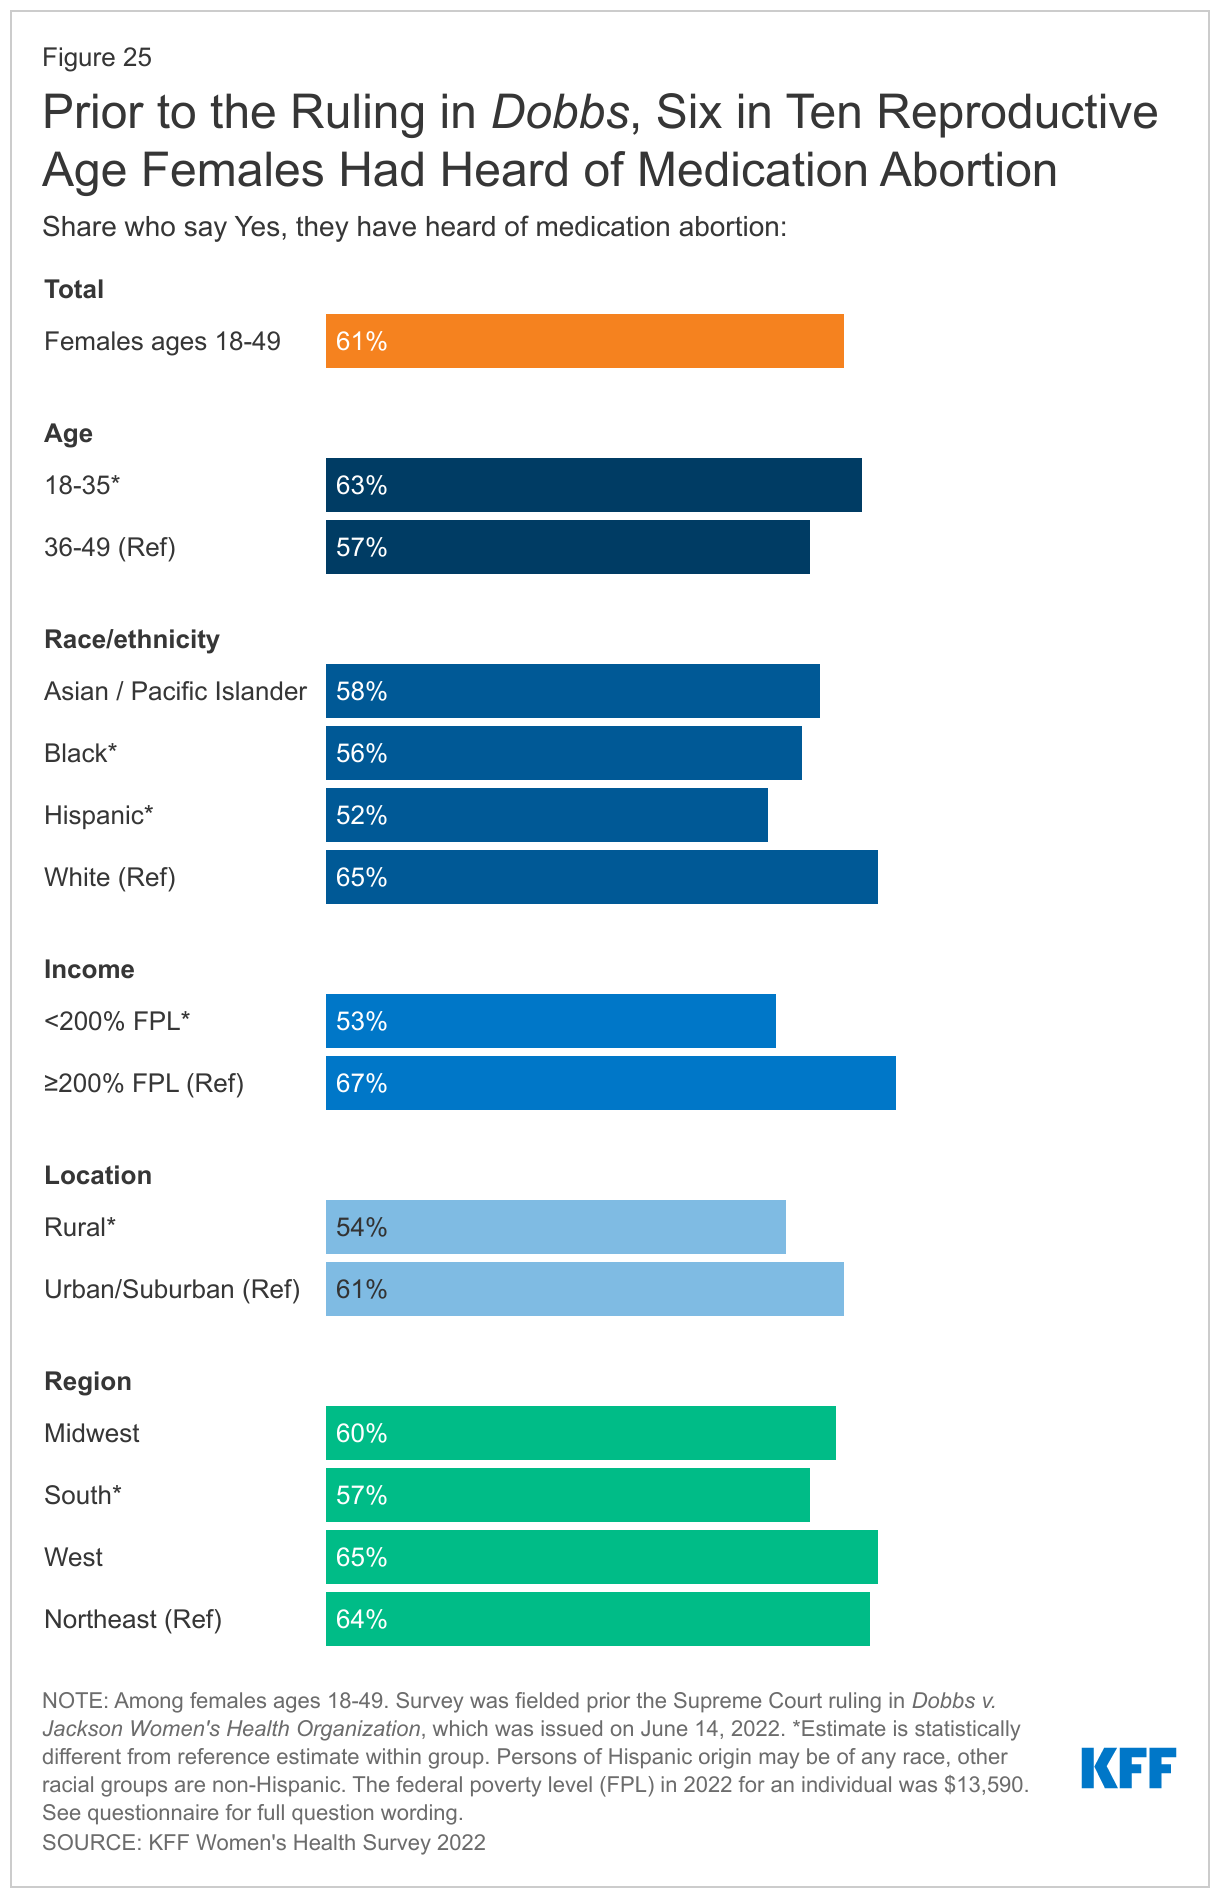
In this survey, which was conducted shortly before the ruling in Dobbs, six in ten reproductive age females (61%) had heard of medication abortion, while 39% had not. Awareness was lower among some groups (Figure 25), including Hispanic females, females with low incomes, those living in rural communities and in the South, where abortion availability is more limited than in other parts of the country.
Prior to the ruling in Dobbs, just one-quarter (26%) of females ages 18-49 said they knew what clinic or health care provider they could go to for an abortion if they wanted or needed one. A relatively small share of reproductive age females knew where they could obtain abortion if they needed one, and while half (51%) said they did not know a specific place where they could get an abortion but knew where they could get the information, that has likely become more difficult since the Dobbs ruling. Abortion is now outlawed in many states and in some states, there is ongoing litigation. Ongoing court rules have created a confusing and shifting patchwork of policies in many states across the country. Just prior to the Dobbs decision, nearly one in four (23%) females did not know where they could go and did not know where to find that information (Figure 26).
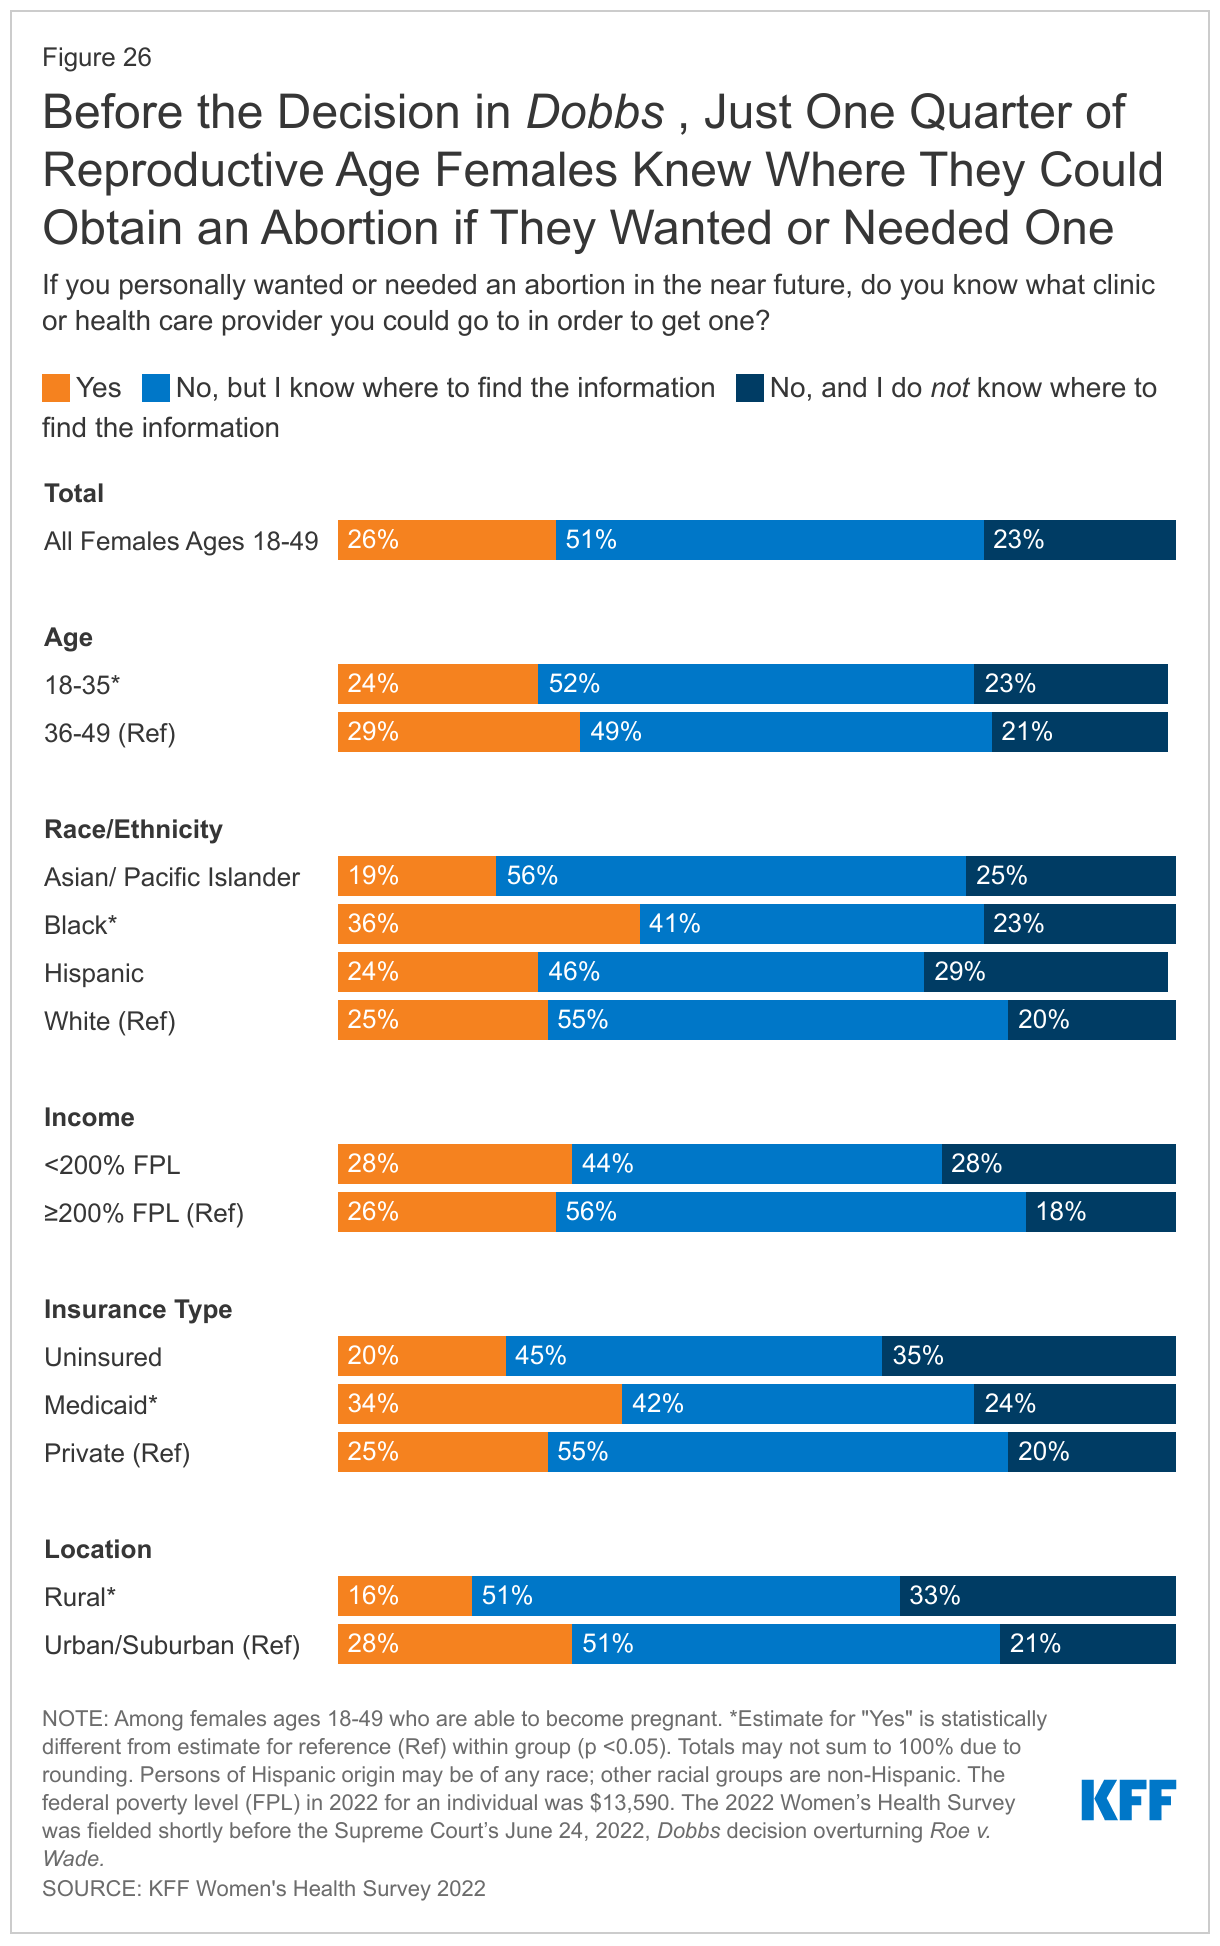
Knowledge about abortion was higher among some groups. Compared to their White counterparts (25%), Black females (36%) were more likely to know what clinic or health care provider they could go to for an abortion if they wanted or needed one before the Dobbs ruling. The abortion rate in the U.S. is highest among Black women. A smaller share of females who live in rural areas (16%) compared to those living in urban/suburban areas (28%) knew where they could obtain an abortion. Rural areas have fewer abortion clinics than more populated areas.
Conclusion
Contraceptive care is a key component of one’s overall reproductive and sexual health care. Several factors go into ensuring people can obtain quality contraceptive care that is aligned with their personal preferences, including timeliness, efficiency, accessibility, affordability, equity, and patient-centeredness. The Affordable Care Act and Medicaid expansion, as well as state policies to ensure people have adequate contraceptive supply, have increased access to affordable and high-quality contraceptive care for many. New avenues for expanding contraceptive access and choices continue to grow through online platforms, as well as new methods and formulations that give people more contraceptive options.
Despite these efforts to improve accessibility and coverage, many of those we surveyed continue to report problems affording and accessing contraceptive care, and a sizeable minority of females are not using the method they prefer. Side effects, problems with insurance, inadequate supply, and other factors still affect whether people are obtaining the contraceptive care that they desire and seek. Health care providers are the most trusted source for information on contraception, and while there has been greater emphasis on patient centered care, many people still report that the quality of care falls short and that they do not have enough information to make an informed decision about their birth control method.
Sexual and reproductive health continues to remain at the center of many polarized policy debates at the state and federal levels. The coverage requirement for contraception and other preventive sexual health services is being challenged yet again in the courts by those who object to these services on religious or moral grounds. Furthermore, the loss of the federal standard protecting the right to abortion and action by many states to ban abortion could lead to limits on access to other sexual and reproductive health services, like effective methods of contraception, particularly emergency contraception and IUDs. The outcomes of these debates, along with state, federal and private sector actions will undoubtedly shape the availability and use of contraceptive care for millions in the years to come.
This work was supported in part by Arnold Ventures. KFF maintains full editorial control over all of its policy analysis, polling, and journalism activities.
Methodology
Overview
The 2022 KFF Women’s Health Survey is a nationally representative survey of 6,442 people ages 18 to 64, including 5,201 females (self-reported sex at birth) and 1,241 males, conducted from May 10, 2022, to June 7, 2022. The objective of the survey is to help better understand respondents’ experiences with contraception, potential barriers to health care access, and other issues related to reproductive health. The survey was designed and analyzed by researchers at KFF (Kaiser Family Foundation) and fielded online and by telephone by SSRS using its Opinion Panel, supplemented with sample from IPSOS’s KnowledgePanel.
This work was supported in part by Arnold Ventures. KFF maintains full editorial control over all of its policy analysis, polling, and journalism activities.
Questionnaire design
KFF developed the survey instrument with SSRS feedback regarding question wording, order, clarity, and other issues pertaining to questionnaire quality. The survey was conducted in English and Spanish. The survey instrument is available upon request.
Sample design
The majority of respondents completed the survey using the SSRS Opinion Panel (n=5,202), a nationally representative probability-based panel where panel members are recruited in one of two ways: (1) through invitations mailed to respondents randomly sampled from an Address-Based Sample (ABS) provided by Marketing Systems Group through the U.S. Postal Service’s Computerized Delivery Sequence. (2) from a dual-framed random digit dial (RDD) sample provided by Marketing Systems Group.
In order to have large enough sample sizes for certain subgroups (females ages 18 to 35, particularly females in the following subgroups: lesbian/gay/bisexual; Asian; Black; Hispanic; Medicaid enrollees; low-income; and rural), an additional 1,240 surveys were conducted using the IPSOS KnowledgePanel, a nationally representative probability-based panel recruited using a stratified ABS design.
Data collection
Web Administration Procedures
The majority of surveys completed using the SSRS Opinion Panel (n=5,056) and all of the surveys completed using the KnowledgePanel (n=1,240) were self-administered web surveys. Panelists were emailed an invitation, which included a unique passcode-embedded link, to complete the survey online. In appreciation for their participation, panelists received a modest incentive in the form of a $5 or $10 electronic gift card. All respondents who did not respond to their first invitation received up to five reminder emails and panelists who had opted into receiving text messages from the SSRS Opinion Panel received text message reminders.
Overall, the median length of the web surveys was 13 minutes.
Phone Administration Procedures
In addition to the self-administered web survey, n=146 surveys were completed by telephone with SSRS Opinion Panelists who are web reluctant. Overall, the median length of the phone surveys was 28 minutes.
Data processing and integration
SSRS implemented several quality assurance procedures in data file preparation and processing. Prior to launching data collection, extensive testing of the survey was completed to ensure it was working as anticipated. After the soft launch, survey data were carefully checked for accuracy, completeness, and non-response to specific questions so that any issues could be identified and resolved prior to the full launch.
The data file programmer implemented a “data cleaning” procedure in which web survey skip patterns were created in order to ensure that all questions had the appropriate numbers of cases. This procedure involved a check of raw data by a program that consisted of instructions derived from the skip patterns designated on the questionnaire. The program confirmed that data were consistent with the definitions of codes and ranges and matched the appropriate bases of all questions. The SSRS team also reviewed preliminary SPSS files and conducted an independent check of all created variables to ensure that all variables were accurately constructed.
As a standard practice, quality checks were incorporated into the survey. Quality control checks for this study included a review of “speeders,” reviewing the internal response rate (number of questions answered divided by the number of questions asked) and open-ended questions. Among all respondents, the vast majority (97%) answered 96% or more of the survey questions they received, with no one completing less than 91% of the administered survey (respondents were informed at the start of the survey that they could skip any question).
Weighting
The data were weighted to represent U.S. adults ages 18 to 64. The data include oversamples of females ages 18 to 35 and females ages 36 to 64. Due to this oversampling, the data were classified into three subgroups: females 18 to 35, females 36 to 64, and males 18 to 64. The weighting consisted of two stages: 1) application of base weights and 2) calibration to population parameters. Each subgroup was calibrated separately, then the groups were put into their proper proportions relative to their size in the population.
Calibration to Population Benchmarks
The sample was balanced to match estimates of each of the three subgroups (females ages 18 to 35, females ages 36 to 64, and males ages 18 to 64) along the following dimensions: age; education (less than a high school graduate, high school graduate, some college, four-year college or more); region (Northeast, Midwest, South, West); and race/ethnicity (White non-Hispanic, Black non-Hispanic, Hispanic-born in U.S., Hispanic-born Outside the U.S., Asian non-Hispanic, Other non-Hispanic). The sample was weighted within race (White, non-Hispanic; Black, non-Hispanic; Hispanic; and Asian) to match population estimates. Benchmark distributions were derived from 2021 Current Population Survey (CPS) data.
Weighting summaries for females ages 18 to 35, females ages 36 to 64, and males ages 18 to 64 are available upon request.
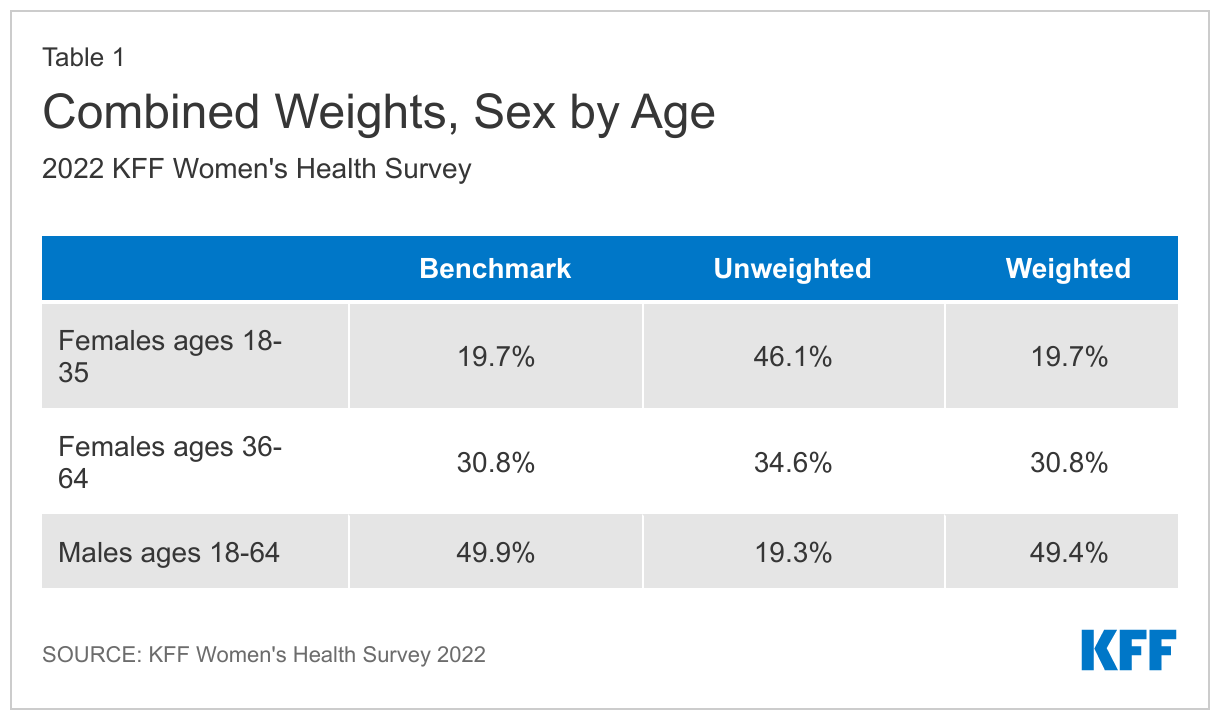
Finally, the three weights were combined, and a final adjustment was made to match the groups to their proper proportions relative to their size in the population (Table 1).
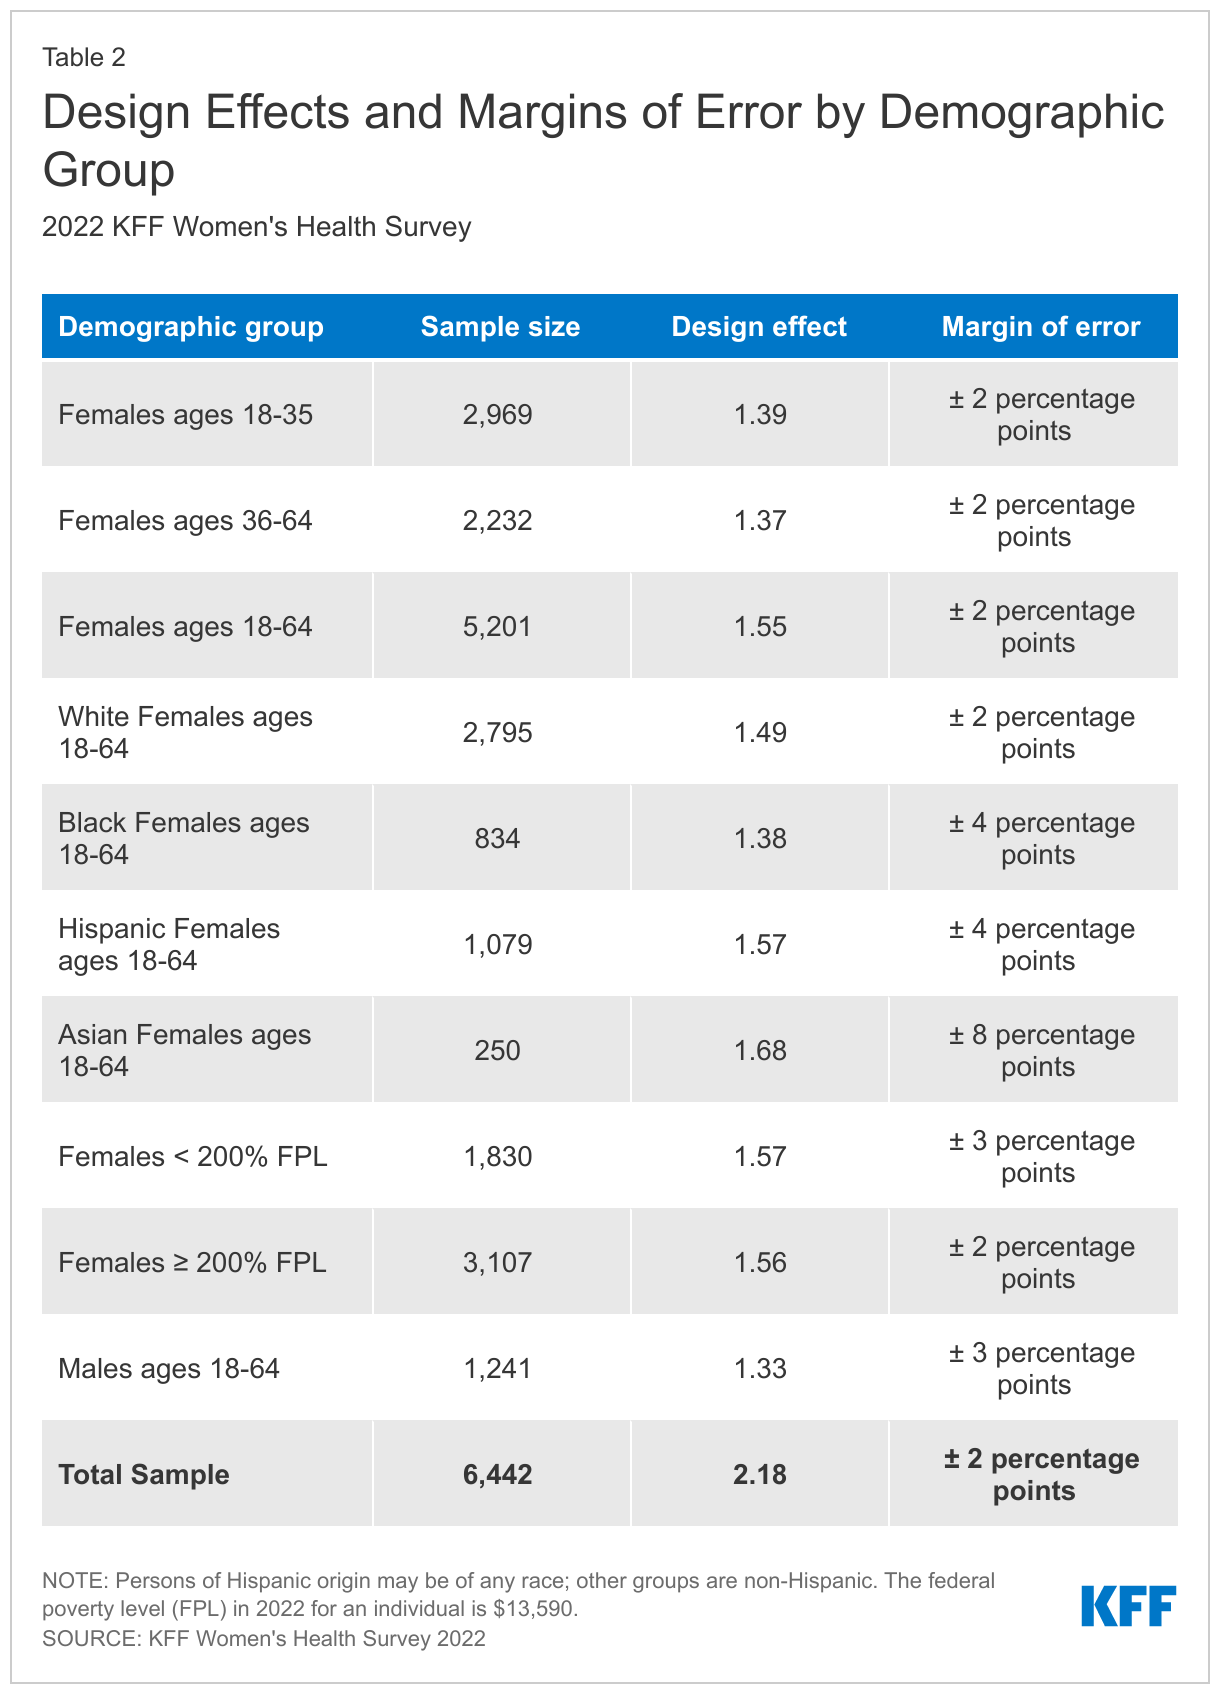
Margin of Sampling Error
The margin of sampling error, including the design effect for subgroups, is presented in Table 2 below. It is important to remember that the sampling fluctuations captured in the margin of error are only one possible source of error in a survey estimate and there may be other unmeasured error in this or any other survey.
KFF Analysis
Researchers at KFF conducted further data analysis using the R survey package, including creating constructed variables, running additional testing for statistical significance, and coding responses to open-ended questions. The survey instrument is available upon request.
Rounding
Some figures in the report do not sum to totals due to rounding. Although overall totals are statistically valid, some breakdowns may not be available due to limited sample sizes or cell sizes. Where the unweighted sample size is less than 100 or where observations are less than 10, figures include the notation “NSD” (Not Sufficient Data).
Statistical significance
All statistical tests are performed at the .05 confidence level. Statistical tests for a given subgroup are tested against the reference group (Ref.) unless otherwise indicated. For example, White is the standard reference for race/ethnicity comparisons and private insurance is the standard reference for types of insurance coverage. Some breakouts by subsets have a large standard error, meaning that sometimes even large differences between estimates are not statistically different.
A note about sex and gender language
Our survey asked respondents which sex they were assigned at birth, on their original birth certificate (male or female). They were then asked what their current gender is (man, woman, transgender, non-binary, or other). Those who identified as transgender men are coded as men and transgender women are coded as women. While we attempted to be as inclusive as possible and recognize the importance of better understanding the health of non-cisgendered people, as is common in many nationally representative surveys, we did not have a sufficient sample size (n >= 100) to report gender breakouts other than men and women with confidence that they reflect the larger non-cisgender population as a whole. The data in our reproductive health reports use the respondent’s sex assigned at birth (inclusive of all genders) to account for reproductive health needs/capacity (e.g., ever been pregnant) while the data in our other survey reports use the respondent’s gender.
