In the Middle of the Coronavirus Pandemic: How have Swing Counties Fared?
Partisan divides have emerged along many dimensions of the coronavirus pandemic. Republicans are about three times more likely than Democrats to say their state is moving too slowly to reopen business and ease restrictions and Democrats are more likely than Republicans to report taking preventative measures like wearing masks in public. These partisan divides in opinions about the pandemic may be due in part to different partisan attitudes toward the public health response, as well as differences in COVID-19 prevalence between parts of the country. Indeed, as others have shown, the pandemic has hit Democratic counties harder than Republican counties.
This raises the question: How are swing counties affected by the pandemic? In this post, we compare coronavirus cases and death rates across counties in the U.S., based on 2012 and 2016 presidential election voting history, with a particular focus on swing counties.
We categorize counties as “Democratic” counties (those that went to Barack Obama in 2012 and Hillary Clinton in 2016), “Republican” counties (those that went to Mitt Romney in 2012 and Donald Trump in 2016), or “swing” counties (those that went to Obama in 2012 and Trump in 2016, or, those that went to Romney in 2012 and Clinton in 2016).
We find that Democratic counties, which tend to be more densely populated, have higher per capita rates of reported coronavirus cases and deaths than Republican counties. Coronavirus rates in swing counties fall in between Democratic and Republican counties, but are more similar to those of Democratic counties in terms of case and slightly more similar to Republican counties in terms of deaths.
Partisan Differences in Coronavirus Cases and Deaths
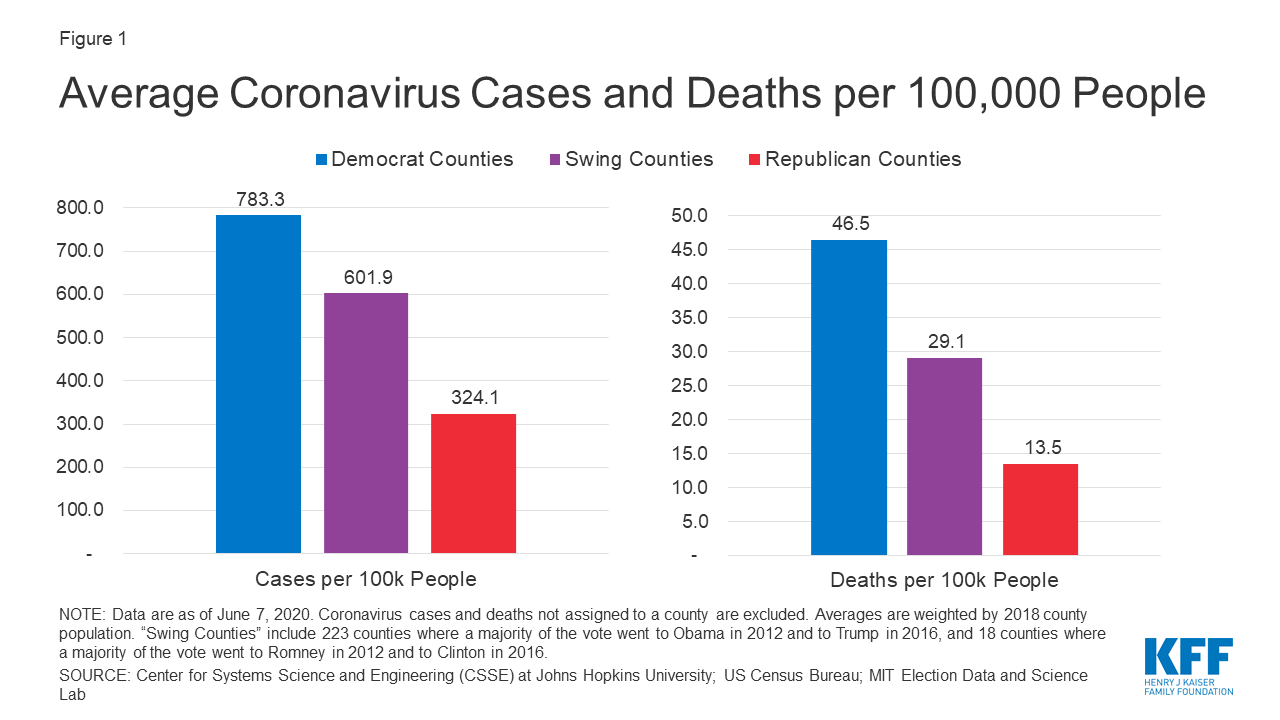
Figure 1: Average Coronavirus Cases and Deaths per 100,000 People
The case fatality rate (the number of reported coronavirus deaths divided by the number of reported cases) is highest in Democratic counties (4.9%) and lowest in Republican counties (3.9%), with swing counties falling in the middle (4.5%).
At the moment, the top ten counties in the U.S. ranked by cumulative coronavirus cases per capita are all Republican counties (Table 1). The top ten counties ranked by cumulative coronavirus deaths per capita are all Democratic counties, with the exception of the second-highest county (Early County, Georgia), which is a swing county.
Several factors may contribute to this pattern. First, because the pandemic spread earlier in urban, Democratic areas (particularly New York City) and deaths lag case counts, these counties currently have higher cumulative death counts. Second, most of the counties with the highest case counts are those that have experienced outbreaks in prisons or meat packing plants, which happen to be Republican counties. Additionally, these concentrated outbreaks have led to widespread testing in these areas, which may be capturing less severe cases. Finally, people who have contracted coronavirus in such settings may be younger on average and therefore less likely to die from COVID-19 than affected populations in other parts of the country.
| Table 1: Top Counties by COVID-19 Cases and Deaths (as of June 7, 2020) | |||
| County | Political Affiliation | Cases per 100k People | Deaths per 100k People |
| Top Ten Counties by Cases per 100k People | |||
| Trousdale County, Tennessee | Republican | 12,659 | 36 |
| Lake County, Tennessee | Republican | 11,267 | 0 |
| Dakota County, Nebraska | Republican | 8,485 | 129 |
| Lincoln County, Arkansas | Republican | 7,360 | 82 |
| Nobles County, Minnesota | Republican | 7,261 | 23 |
| Colfax County, Nebraska | Republican | 5,854 | 37 |
| Buena Vista County, Iowa | Republican | 5,746 | 10 |
| Ford County, Kansas | Republican | 5,368 | 24 |
| Texas County, Oklahoma | Republican | 4,630 | 29 |
| Cass County, Indiana | Republican | 4,197 | 24 |
| Top Ten Counties by Deaths per 100k People | |||
| Hancock County, Georgia | Democratic | 2,384 | 311 |
| Early County, Georgia | Swing | 2,430 | 303 |
| Terrell County, Georgia | Democratic | 2,520 | 302 |
| Randolph County, Georgia | Democratic | 2,678 | 278 |
| Bronx County, New York | Democratic | 3,214 | 252 |
| Queens County, New York | Democratic | 2,730 | 226 |
| Essex County, New Jersey | Democratic | 2,260 | 213 |
| Northampton County, Virginia | Democratic | 2,139 | 213 |
| Rockland County, New York | Democratic | 4,091 | 202 |
| Kings County, New York | Democratic | 2,183 | 201 |
While most swing counties are not in major battleground states, there are a few key swing counties in these states that have been hit particularly hard by COVID-19. For example, Racine and Kenosha counties in the key battleground state of Wisconsin, both of which voted for President Obama in 2012 and for President Trump in 2016, have the highest and fourth-highest number of coronavirus cases per capita of all Wisconsin counties, respectively. Similarly, the swing counties of Northampton and Luzerne counties in Pennsylvania have the fourth- and seventh-highest rates of coronavirus cases in Pennsylvania, respectively.
In terms of coronavirus deaths, the key swing county of Macomb in Michigan appears near the top of the list; Macomb County, Michigan has the 10th highest number of coronavirus deaths among swing counties nationally and the 98nd highest overall.
In part, differences in coronavirus rates by political affiliation reflect higher coronavirus rates in urban areas, since several large Democratic cities, including New York City, have been hard hit by the pandemic. Nearly 97% of the population in Democratic counties live in metropolitan counties, compared with 83% of people in swing counties and 72% in Republican counties. Even so, the general pattern of coronavirus cases and deaths in swing counties falling between those of Democratic and Republican counties holds true even when separating counties by metro and non-metro areas.
It’s unclear how much longer swing counties will be stuck in the middle. On one hand, there is concern among some public health experts that large gatherings at protests – the largest of which are happening in major Democratic cities – may lead to another spike in coronavirus cases. On the other hand, social distancing measures have been eased more quickly in more conservative areas, and the current data show that both cases and deaths are growing at a slightly faster rate in Republican counties (including rural areas) than in Democratic and swing counties.