COVID-19 Deaths Among Older Adults During the Delta Surge Were Higher in States with Lower Vaccination Rates
Older adults continue to be one of the populations hardest hit by the coronavirus pandemic. Since the start of the pandemic, people 65 and older have been at greatest risk of hospitalization and death due to COVID-19 compared to other age groups, and represent nearly 80% of all COVID-19 deaths as of September 29, 2021, similar to the rate observed in a July 2020 KFF analysis. At the same time, older adults, among the first groups prioritized to receive the COVID-19 vaccine, have the highest vaccination rate among all age groups, with 83.3% of the 65 and older population fully vaccinated as of September 29, 2021. Vaccination rates for adults 65 and older range from 71.3% in West Virginia to 95.3% in Vermont.
Although cases, hospitalizations and deaths among older adults declined after widespread vaccination efforts began, deaths due to COVID-19 for older adults have recently been on the rise in the U.S. amid the Delta variant outbreak, though not reaching the numbers seen in earlier stages of the pandemic. Recent CDC data show that vaccines remain effective at preventing hospitalizations and deaths. We examined the relationship between vaccination rates as of September 29, 2021 and death rates among adults ages 65 and older during the Delta surge (covering July 1, 2021 through September 25, 2021), by state, based on CDC data for 38 states. This analysis does not include all states due to CDC’s data suppression conventions. (See Methods for additional information.)
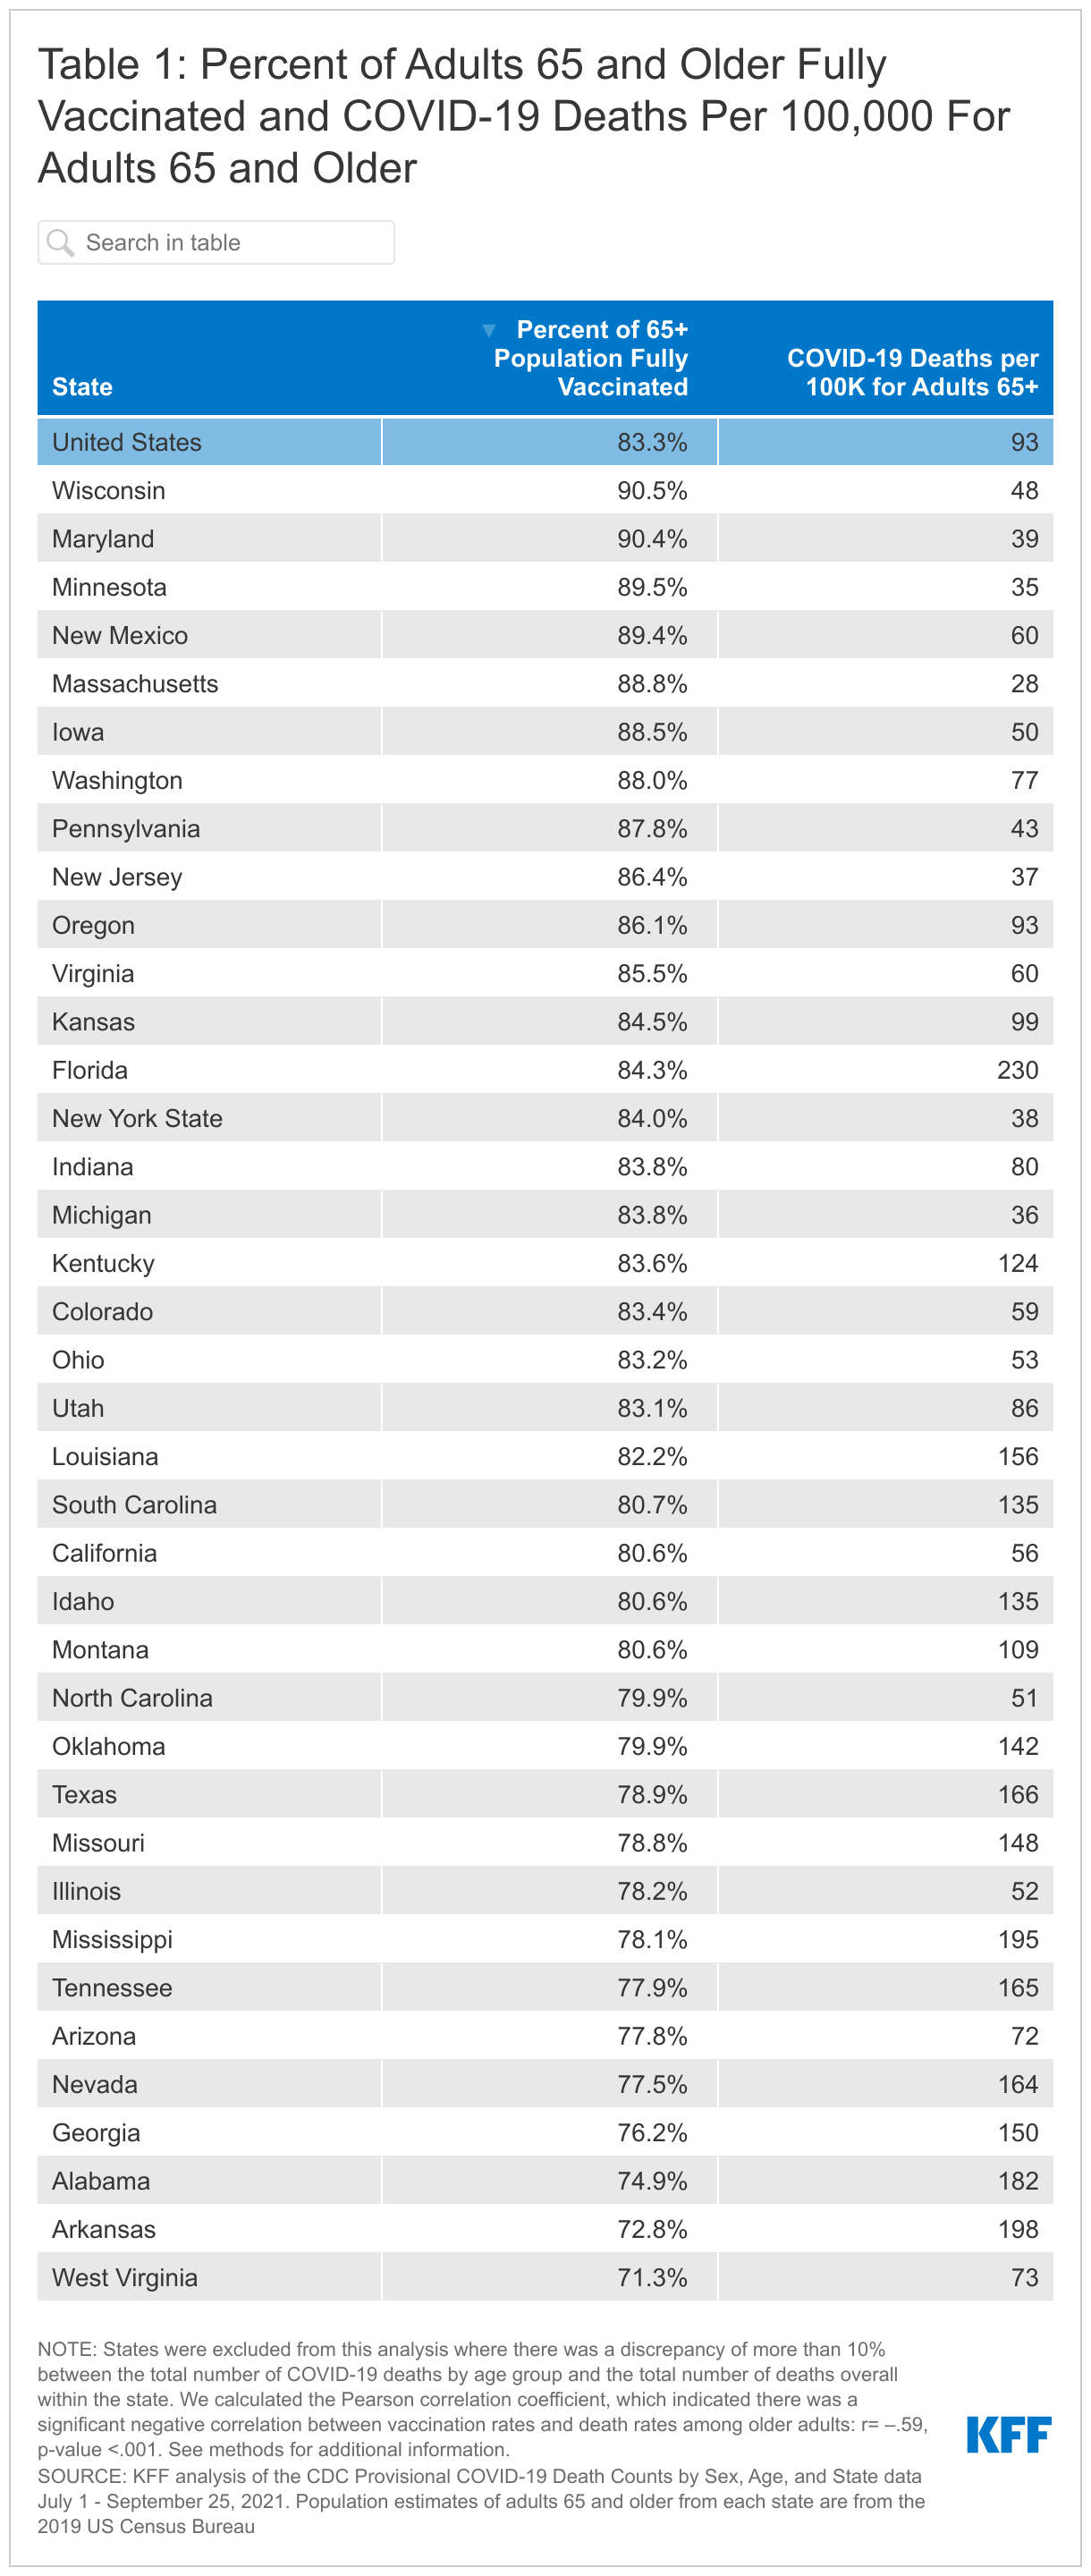
Our analysis shows a significant negative correlation between vaccination rates and death rates among older adults during the Delta variant outbreak, with states having lower vaccination rates among adults ages 65 and older experiencing higher death rates among older adults (Figure 1, Table 1).

In the U.S. overall, the death rate was 93 per 100,000 people 65 and older during the study period. In four of the five states with the lowest vaccination rate for older adults – Arkansas, Alabama, Georgia and Nevada – death rates were higher than the national average. For example, in Arkansas, which has a vaccination rate of 72.8%, there were 198 deaths per 100,000 residents 65 and older during the study period. Death rates were similarly high in Alabama (182), Georgia (150), and Nevada (164), where vaccination rates are well below the national average for older adults. The death rate in those four states combined was nearly 2 times the national average. In West Virginia, which has the lowest vaccination rate for people 65 and older (71.3%), the death rate was below the national average at 73 deaths per 100,000 residents.
Conversely, states with the highest vaccination rates for older adults – Wisconsin, Maryland, Minnesota, New Mexico, and Massachusetts – experienced comparatively low death rates among older adults during the Delta surge. For example, in Massachusetts, where 88.8% of older adults have been vaccinated, the death rate was 28 per 100,000 adults 65 and older, a rate about 7 times lower than that of Arkansas during the study period. Other states with comparatively high vaccination rates for older adults and low death rates during the Delta surge include Minnesota (35), Maryland (39) and Wisconsin (48). New Mexico also has one of the highest vaccination rates (89.4%), but there were slightly more deaths among older adults compared to other states during this time period (60 deaths per 100,000). Among the 38 states in this analysis, vaccination rates for people 65 and older range from 71.3% in West Virginia to 90.5% in Wisconsin (Table 1).
Had the death rate in the 10 least vaccinated states been the same as the death rate in the 10 most vaccinated states, there would have been 7,623 fewer deaths among older adults during this period in these 10 states, a 61.7% reduction from the actual number of deaths (12,363). Or, put differently, there were 2.6 times more deaths per 100,000 older adults in the 10 states with lowest vaccination rates than in the 10 states with the highest vaccination rates.
Vaccination rates are a key factor in the number of cases, hospitalizations, and deaths due to COVID-19 occurring during the Delta surge. Other factors could include decreasing vaccine effectiveness over time, which could be a particular concern for older adults during the Delta variant outbreak because much of this group was vaccinated in early 2021, as well as variations in state and local mitigation strategies put in place to address surging rates of infection. Some states implemented mask mandates in certain settings and/or vaccination and testing requirements, while others rejected mandates. For example, Florida – where there has been significant controversy over mask mandates and other restrictions – had the highest death rate for adults 65 and older among all states during this period (230 per 100,000), despite having a higher vaccination rate for adults 65 and older than other states with high death rates.
Substantial variation in vaccination rates and other mitigation strategies at the state level suggests that older adults in some states may face greater risk of death than others in the midst of the ongoing and evolving COVID-19 pandemic. While much of the focus has been on rising cases among children since Delta took hold, cases, hospitalizations, and deaths have been on the rise among older adults. There are signs that cases may be starting to decline in some areas of the country, but death is a lagging indicator, and some areas with recent surges may still see an increase in deaths. With the rollout of boosters for adults 65 and older, we will soon learn whether and when we will see a reversal of these troubling trends for older adults.
Methods
This analysis uses vaccination rates for fully vaccinated adults 65 and older for each state. When we use the term “vaccinated” in the document, it refers to the fully vaccinated population. These data are from the Centers for Disease Control and Prevention (CDC) as of September 29, 2021 and cover the entire time period in which vaccinations began. https://covid.cdc.gov/covid-data-tracker/#vaccinations_vacc-people-fully-percent-pop65
To calculate deaths among adults 65 and older, data are from the CDC, “Provisional COVID-19 Death Counts by Sex, Age, and State,” as of September 29, 2021, for the period from July 1, 2021 to September 25, 2021. https://data.cdc.gov/NCHS/Provisional-COVID-19-Death-Counts-by-Sex-Age-and-S/9bhg-hcku. The CDC uses incoming data from death certificates to produce provisional COVID-19 death counts. The number of deaths reported in this dataset are the total number of deaths received and coded as of the date of analysis, and do not represent all deaths that occurred in that period. Data during this period are incomplete because of the lag in time between when the death occurred and when the death certificate is completed, submitted to the National Center for Health Statistics (NCHS) and processed for reporting purposes. This delay can range from 1 week to 8 weeks or more. Death counts that are fewer than 10 by age group were suppressed in accordance with NCHS confidentiality standards.
We excluded 12 states and the District of Columbia from this analysis where there was a discrepancy of more than 10% between the total number of COVID-19 deaths by age group and the total number of deaths overall within the state (Alaska, Connecticut, Delaware, District of Columbia, Hawaii, Maine, Nebraska, New Hampshire, North Dakota, Rhode Island, South Dakota, Vermont, and Wyoming). This discrepancy is likely due to the suppression of data within age cohorts that falls below the NCHS reporting standard.
We calculated the Pearson correlation coefficient, which indicated there was a significant negative correlation between vaccination rates and death rates among older adults: r= –.59, p-value <.001.
Population estimates of adults 65 and older from each state are from the 2019 US Census Bureau.