A Closer Look at the Five Largest Publicly Traded Companies Operating Medicaid Managed Care Plans

Published: Jul 6, 2023

Note: For the latest data on the experiences of the five largest publicly traded companies, view our 2025 brief

Total Medicaid and CHIP enrollment is now over 90 million. The latest national Medicaid managed care enrollment data (from 2020) show 72% of Medicaid beneficiaries were enrolled in comprehensive managed care organizations (MCOs). In FY 2021, payments to comprehensive Medicaid MCOs accounted for 52% of total Medicaid spending (or more than $376 billion). Medicaid is a major source of revenue and profits for multi-state insurance companies. KFF analysis of National Association of Insurance Commissioners (NAIC) data show gross margins per enrollee in the Medicaid managed care market were higher in 2021 than they were pre-pandemic. Medicaid MCOs have played a key role in responding to the COVID-19 pandemic and are expected to work with states in conducting outreach and providing support to enrollees during the “unwinding” of the continuous enrollment requirement. Beginning April 1, 2023, states were able to restart disenrollments (which had been paused since February 2020) after conducting a full review of eligibility. Many people will likely be found to be no longer eligible for Medicaid, while others could face administrative barriers and lose coverage despite remaining eligible. Medicaid MCOs have a financial interest in maintaining enrollment, which could also prevent disruptions in care for enrollees. This brief takes a closer look at the five largest publicly traded companies (also referred to as “parent” firms) operating Medicaid MCOs which account for half of Medicaid MCO enrollment nationally. Information and data reported in this brief come from quarterly company earnings reports, financial filings, and other company materials as well as from national administrative data.

Medicaid enrollment in the five largest publicly traded companies operating Medicaid MCOs

Five for-profit, publicly traded companies – Centene, Elevance (formerly Anthem), UnitedHealth Group, Molina, and CVS Health – account for 50% of Medicaid MCO enrollment nationally (Figure 1). All five are ranked in the Fortune 500, and four are ranked in the top 100, with total revenues that ranged from $32 billion (Molina) to $324 billion (UnitedHealth Group) for 2022. Each company operates Medicaid MCOs in 12 or more states (Figure 2). All five firms also operate in the commercial and Medicare markets (Figure 3); however, the distribution of membership across markets varies across firms. Two firms – Molina and Centene– have historically focused predominantly on the Medicaid market. Medicaid members accounted for over 90% of Molina’s overall medical membership and nearly 70% of Centene’s medical membership as of March 2023 (Figure 3).

Five For-Profit, Publicly Traded Companies Have Half of the Medicaid MCO Market.
Five Firms Have a Wide Geographic Reach in Medicaid, Each With MCOs in 12 or More of the 40 MCO States.
The Distribution of Medical Membership Across Markets Varies Across the Five Largest Publicly Traded Companies Operating Medicaid MCOs.

Combined Medicaid enrollment across the five firms increased by 13.5 million or 44.1% from March 2020 to March 2023 (Figure 4). Medicaid enrollment overall grew by more than 20 million (or about 31%) during the continuous enrollment period (February 2020 to January 2023), resulting in growth in MCO enrollment as well. Enrollment growth has been primarily attributed to the Families First Coronavirus Response Act (FFCRA) provision that required states to ensure continuous enrollment for Medicaid enrollees in exchange for a temporary increase in the Medicaid match rate. Growth in parent firm Medicaid enrollment may also reflect other activity including firm acquisitions and/or new contracts. For the firms that report this information, Medicaid revenue growth 2022 over 2021 ranged from 11% (Centene) to 18% (UnitedHealth) to 21% (Molina). These same firms reported Medicaid revenue growth ranging from 13% (Centene) to 16% (UnitedHealth) to 43% (Molina) year-over-year 2021 over 2020. Molina reported the medical margin earned by the Medicaid segment was $3.0 billion in 2022 and $2.3 billion in 2021 (medical margin = premium revenue – medical costs).

Medicaid Enrollment Across the Five Firms Increased During the Pandemic Continuous Enrollment Period from 30.7 Million to 44.2 Million or 44%.

Implications of “unwinding” for the five largest publicly traded companies operating Medicaid MCOs

All five firms expect Medicaid enrollment losses following the end of the continuous enrollment requirement (over 2023 and 2024); however, firms expect to retain some members who lose Medicaid coverage in their Marketplace and other products (Appendix Table). The Consolidated Appropriations Act, 2023 ended the continuous enrollment provision and allowed states to resume disenrollments starting April 1, 2023. While the number of Medicaid enrollees who may be disenrolled during the unwinding period is highly uncertain, it is estimated that millions will lose coverage. KFF estimates 17 million people could lose Medicaid coverage – including some who are no longer eligible and others who are still eligible but face administrative barriers to renewal. Rates of Medicaid coverage loss will vary across states depending on how states approach unwinding. CMS has issued specific guidance allowing states to permit MCOs to update enrollee contact information and conduct outreach about the eligibility renewal process to facilitate continued enrollment as well as Marketplace transitions, where appropriate. In June 2023, CMS released new guidance highlighting several new strategies available to states to prevent procedural terminations including permitting managed care plans to assist enrollees in completing certain parts of renewal forms.

In first quarter 2023 investor earnings calls, executives of the publicly traded companies operating Medicaid MCOs expressed the aim of maximizing continuity of coverage for members through supporting continued enrollment in Medicaid and transitions to the Marketplace (and other products), where appropriate. The firms report conducting direct and indirect outreach, including text messages, live calls, and community-based provider campaigns, to educate members about Medicaid redeterminations and the renewal process as well as about their Marketplace options if they are no longer eligible for Medicaid (Appendix Table).

All five firms offer a Qualified Health Plan (QHP) in the ACA marketplace in many states where they operate a Medicaid MCO, however there may not be plan alignment if plans operate regionally. Current enrollees who are determined to no longer be eligible for Medicaid may be eligible for ACA marketplace (which has higher income eligibility thresholds than Medicaid) or other coverage (e.g., CHIP coverage or employer sponsored insurance (ESI)). Individuals eligible for coverage in the Marketplace may qualify for plans with zero premiums; however, individuals transitioning to Marketplace coverage may face higher cost-sharing and different provider networks. Prior analyses suggest that individuals face barriers moving from Medicaid to other coverage programs and many may experience gaps in coverage. CMS guidance outlines states may encourage MCOs that also offer a QHP to share information with their own enrollees who have been determined ineligible for Medicaid to assist in the transfer of individuals to Marketplace coverage (as long as state-specific laws and/or contract requirements do not prohibit this activity). To avoid gaps in coverage, managed care plans may reach out to individuals before they lose coverage to allow them to apply for Marketplace coverage in advance.

Looking Ahead

Medicaid managed care plans have a financial interest in maintaining enrollment, which could also prevent disruptions in care for enrollees. The five publicly traded firms that are the subject of this analysis account for half of all Medicaid MCO enrollment nationally. As states unwind the continuous enrollment provision, many people will likely be found to be no longer eligible for Medicaid. Others could face administrative barriers and lose coverage despite remaining eligible. Medicaid managed care plans can assist state Medicaid agencies in communicating with enrollees, conducting outreach and assistance, and ultimately, in improving coverage retention – including facilitating transitions to the Marketplace.

Appendix

Expected Medicaid Redetermination Impacts, Including Enrollment Shift to Other Products

Mental Health Care Needs and Experiences Among LGBT+ People

Published: Jun 30, 2023

Issue Brief

Key Findings

There has been rising attention to the scope of mental health challenges in the United States, including a desire to better understand the experiences and needs of those who may be most heavily impacted. The LGBT+ community is one such group, having faced lifelong mental health challenges beginning in adolescence and persisting through adulthood. While in some cases, LGBT+ people are accessing mental health care more frequently than non-LGBT+ people, their need for services is greater, and gaps remain. Today, policies seeking to curtail access and rights of LGBT+ people threaten to worsen these disparities, and continuing to monitor the wellbeing of the community will be important.

With this report, we examine LGBT+ people’s needs for and experiences accessing mental health care by analyzing data from a nationally representative 2022 KFF survey with a large sample of LGBT+ adults. Key findings include:

  • Two-thirds of LGBT+ people (67%) reported needing a mental health service over the past two years, a considerably higher share than for non-LGBT+ people (39%).
  • Yet, only about half of LGBT+ people with a reported need sought and received mental health services (similar to the share among non-LGBT+ people).
  • Barriers to care can include:
    • Wait times: Four-in-ten LGBT+ people reported having to wait at least a month for services.
    • Insurance: One-quarter of privately insured LGBT+ people who received mental health services said their provider did not take their insurance.

Introduction

There has been rising attention to the depth and breadth of mental health challenges in the United States, including a desire to better understand the experiences and needs of those most heavily impacted. A recent KFF/CNN poll found that nearly all (90%) Americans believe there is a mental health crisis today and that LGBT+ adults consistently reported poorer mental health outcomes on almost all measures throughout the survey.

Indeed, the LGBT+ community has faced lifelong mental health challenges beginning in adolescence and persisting through adulthood at higher rates compared to non-LGBT+ people. Additionally, while in some cases, LGBT+ people are accessing mental health care more frequently than non-LGBT+ people, their need for services is greater and gaps remain. Addressing systemic factors that drive stigma and discrimination within the community could play a key role in mitigating these challenges alongside improving access more generally.

With this report, we provide an update on LGBT+ people’s needs for and experiences of accessing mental health care by analyzing data from a nationally-representative 2022 KFF survey of 6,442 adults ages 18 to 64, including 958 LGBT+ people, conducted primarily online from May 10, 2022, to June 7, 2022. For this survey, LGBT+ people include those who identified their sexual orientation as lesbian, gay, bisexual, or “something else,” and those who identified their gender as transgender, non-binary, “other,” or whose reported gender does not correspond to their reported sex assigned at birth. (See the Methodology for additional detail.) Beyond issues related to mental health and access to care, the survey collected data on a range of demographic characteristics and issues from general well-being to experiences engaging in the health system, use of preventive services including HIV and STI testing, and reproductive health. A separate companion issue brief, LGBT+ People’s Health Status and Experiences Accessing to Care, provides these additional findings.

Findings

Experiences with Mental Health Problems

Surveys regularly find that LGBT+ people face greater mental health challenges than non-LGBT+ people, including for common conditions like depression and anxiety, as found in a recent KFF/CNN poll.

Here we find that two-thirds of LGBT+ people (67%) reported needing a mental health service over the past two years, a considerably higher share than the one-in-four non-LGBT+ people (39%). Self-reported need for mental health care was highest among younger LGBT+ people under age 35 (77%) and for women, nearly three-quarters of whom (73%) reported the need for mental health care (Figure 1).

Two-Thirds of LGBT+ People Reported Needing Mental Health Care in the Past Two Years

Accessing Mental Health Care

The higher rates of stigma, discrimination, and violence experienced by LGBT+ populations can translate into mental health and substance use challenges. For many who are part of this community, these challenges highlight the need for behavioral health care.

While reported need for mental health services was high among LGBT+ people, not all of those with a need for services sought or received them. Notably, a higher share of LGBT+ people have both a need for mental health service than non-LGBT+ people, and higher shares sought and received mental health services than their non-LGBT+ counterparts. Yet, unmet need persisted for many in both groups.

Two-thirds (65%) of LGBT+ people who reported needing a mental health service sought one, compared to 58% of non-LGBT+ people, still leaving many without desired services (Figure 2). There were no statistical differences in the share that sought services by age, race/ethnicity, or insurance status among LGBT+ people. Limited uptake could be due to being a lower-income group, having lower rates of private coverage, or experience of stigma, discrimination shame and trauma, including within medical settings. See the issue brief LGBT+ People’s Health Status and Experiences Accessing to Care for more details.

Among Those Who Needed Care, Three-Quarters of LGBT+ People With Medicaid Sought Mental Health Care

Only about half of LGBT+ people (55%) and non-LGBT+ people (49%) who reported a need for mental health services over the past two years received care, pointing to substantial unmet need in this area regardless of gender identity or sexual orientation. One-in-ten (10%) LGBT+ who reported a need for these services said they tried to get but did not receive care, also similar to non-LGBT+ people. One-third (35%) with a need did not try to get mental health care (Figure 3). A smaller share of LGBT+ individuals with a need did not try to get mental health care compared to non-LGBT+ individuals (35% vs. 42%).

Among LGBT+ Individuals Who Thought They Needed Mental Health Care in the Past Two Years, Just Over Half Were Able to Get an Appointment for Care

Since the COVID-19 pandemic, telehealth has emerged as an important avenue for people to access health care, including mental health services. Almost two-thirds of LGBT+ people (63%) reported having had a telehealth visit in the last year and mental health services was the leading reason for their most recent telehealth visit – 28% received mental health services, followed by an annual check-up or well-visit (21%). Telehealth can increase access to mental health services, including for those who might not otherwise get or want in-person care (data not shown in figure).

Barriers to Mental Health Care

Among LGBT+ people who were able to get a mental health appointment, about six-in-ten (58%) were able to get one in less than a month, but four-in-ten (42%) had to wait one month or more, with 16% waiting more than two months. These were similar to the shares among non-LGBT+ people. Such delays can be a barrier to getting people into care, particularly when those who have to wait may end up not seeking care at all if that wait is for a substantial period. These delays can prolong suffering and lead to worsening of symptoms (Figure 4).

Four-in-Ten LGBT+ Individuals Who Got a Mental Health Appointment Had to Wait a Month or More

Seven-in-ten (69%) privately insured LGBT+ people reported their mental health provider accepted their insurance plan, but 27% said they did not, and 4% didn’t know, shares similar to privately insured non-LGBT+ people (Figure 5).

One-Quarter of Privately-Insured LGBT+ People Who Received Mental Health Services Said the Provider Did Not Accept Their Insurance

Conclusion

LGBT+ people experience significantly higher rates of mental health challenges and need for mental health services than non-LGBT+ people, as well as higher rates of health care discrimination. While they also reported accessing mental health care at slightly higher rates than non-LGBT+ people, nearly half who said they could benefit from such services went without. The findings presented here suggest that in addition to inability to secure appointments, wait times may also be a barrier to care. A facilitator to mental health care appears to be telehealth, with more than one-quarter of LGBT+ people accessing telehealth care doing so for mental health services.

The reasons that LGBT+ people are more likely to face mental health challenges are complex and may relate, in part, to widespread experiences of stigma and discrimination. Current attempts to institute anti-LGBTQ policies in many states and communities may contribute to poor mental health outcomes and increase the need for care. Targeted and culturally appropriate policy solutions aimed at improving the well-being of the LGBT+ community and addressing their access challenges to mental health care could help to meet their mental health care needs, as would efforts to address systemic factors that drive stigma and discrimination within the community.

Methods

Methods

Data for this issue brief come from the 2022 KFF Women’s Health Survey, a nationally representative survey of 6,442 people of all genders ages 18 to 64, including 958 LGBT+ people, conducted from May 10, 2022, to June 7, 2022. The objective of the survey is to help better understand respondents’ experiences with contraception, potential barriers to health care access, and other issues related to reproductive health. The survey was designed and analyzed by researchers at KFF (Kaiser Family Foundation) and fielded online and by telephone by SSRS using its Opinion Panel, supplemented with sample from IPSOS’s KnowledgePanel.

The survey asked respondents which sex they were assigned at birth, on their original birth certificate (male or female). They were then asked what their current gender is (man, woman, transgender, non-binary, or other). Those who identified as transgender men are coded as men and transgender women are coded as women. While we attempted to be as inclusive as possible and recognize the importance of better understanding the health of non-cisgendered people, as is common in many nationally representative surveys, we did not have a sufficient sample size (n >= 100) to report gender breakouts other than men and women with confidence that they reflect the larger non-cisgender population as a whole. The data in our reproductive health analyses use the respondent’s sex assigned at birth (inclusive of all genders) to account for reproductive health needs/capacity (e.g., ever been pregnant) while other analyses use the respondent’s gender (inclusive of males and females).

For this survey, LGBT+ people include those who identified their sexual orientation as lesbian, gay, bisexual, or “something else,” and those who identified their gender as transgender, non-binary, “other,” or whose reported gender does not correspond to their reported sex assigned at birth.

Questionnaire design

KFF developed the survey instrument with SSRS feedback regarding question wording, order, clarity, and other issues pertaining to questionnaire quality. The survey was conducted in English and Spanish. The survey instrument is available upon request.

Sample design

The majority of respondents completed the survey using the SSRS Opinion Panel (n=5,202), a nationally representative probability-based panel where panel members are recruited in one of two ways: (1) through invitations mailed to respondents randomly sampled from an Address-Based Sample (ABS) provided by Marketing Systems Group through the U.S. Postal Service’s Computerized Delivery Sequence. (2) from a dual-framed random digit dial (RDD) sample provided by Marketing Systems Group.

In order to have large enough sample sizes for certain subgroups (females ages 18 to 35, particularly females in the following subgroups: lesbian/gay/bisexual; Asian; Black; Hispanic; Medicaid enrollees; low-income; and rural), an additional 1,240 surveys were conducted using the IPSOS KnowledgePanel, a nationally representative probability-based panel recruited using a stratified ABS design. (Note that due to small sample sizes, data for LGBT+ people who are Asian or Pacific Islanders are not presented in this report.)

Data collection

The majority of surveys completed using the SSRS Opinion Panel (n=5,056) and all of the surveys completed using the KnowledgePanel (n=1,240) were self-administered web surveys. Panelists were emailed an invitation, which included a unique passcode-embedded link, to complete the survey online. In appreciation for their participation, panelists received a modest incentive in the form of a $5 or $10 electronic gift card. In addition to the self-administered web survey, n=146 surveys were completed by telephone with SSRS Opinion Panelists who are web reluctant.

Weighting

The data are weighted to represent U.S. adults ages 18 to 64. The data include oversamples of females ages 18 to 35 and females ages 36 to 64. Due to this oversampling, the data were classified into three subgroups: females 18 to 35, females 36 to 64, and males 18 to 64. The weighting consisted of two stages: 1) application of base weights and 2) calibration to population parameters. Each subgroup was calibrated separately, then the groups were put into their proper proportions relative to their size in the population.

Calibration to Population Benchmarks

The total sample for the Women’s Health Survey was balanced to match estimates of each of the three subgroups (females ages 18 to 35, females ages 36 to 64, and males ages 18 to 64) along the following dimensions: age; education (less than a high school graduate, high school graduate, some college, four-year college or more); region (Northeast, Midwest, South, West); and race/ethnicity (White non-Hispanic, Black non-Hispanic, Hispanic-born in U.S., Hispanic-born Outside the U.S., Asian non-Hispanic, Other non-Hispanic). The sample was weighted within race (White, non-Hispanic; Black, non-Hispanic; Hispanic; and Asian) to match population estimates. Benchmark distributions were derived from 2021 Current Population Survey (CPS) data. Although the LGBT+ sample in this survey is not weighted separately to match population benchmarks, the full sample is. Comparisons to the available demographic data for the LGBT population from the 2021 Behavioral Risk Factor Surveillance System (BRFSS) found the demographics from our sample closely align with the federal data source.

Margin of Sampling Error

The margin of sampling error, including the design effect for subgroups, is presented in Table 1 below. It is important to remember that the sampling fluctuations captured in the margin of error are only one possible source of error in a survey estimate and there may be other unmeasured error in this or any other survey.

The KFF Women’s Health Survey sample includes people of all genders; however, our sample design is more heavily focused on women. While our survey weights take this gender imbalance into account and we use additional data control measures to ensure the data we present are as reliable and as representative of the population as possible, some data points for certain subgroups with larger margins of error may be more heavily weighted by women than men. Caution should be exercised in interpreting findings among LGBT+ subpopulations due to smaller sample sizes and larger margins of error. Our issue briefs do not present data for subgroups where data limitations precluded us from developing reliable estimates.

Sample Sizes, Design Effects, and Margins of Error, by Demographic Groups
STATISTICAL SIGNIFICANCE

All statistical tests are performed at the .05 confidence level. Statistical tests for a given subgroup are tested against the reference group (Ref.) unless otherwise indicated. For example, White is the standard reference for race/ethnicity comparisons and private insurance is the standard reference for types of insurance coverage. Some breakouts by subsets have a large standard error, meaning that sometimes even large differences between estimates are not statistically different.

See the full 2022 KFF Women’s Health Survey methodology for more details. The full survey instrument is available upon request.

LGBT+ People’s Health Status and Access to Care

Published: Jun 30, 2023

Key Findings

Key Findings

The share of people in the United States who identify as LGBT+ has increased substantially in recent years, yet health disparities and health access-related challenges persist across multiple dimensions. While in some areas, the health experiences of LGBT+ people mirror those of their non-LGBT+ counterparts, studies have found that this population experiences certain challenges at higher rates. Understanding the health care needs and experiences of LGBT+ people, and where they differ from those who are not LGBT+, is therefore important for addressing barriers and facilitating access to care and coverage. This report, based on a nationally representative 2022 KFF survey, provides an analysis of the health experiences of self-identified LGBT+ adults in the U.S. compared to their non-LGBT+ counterparts. Key findings include:

Demographics, Coverage and Health Status

  • The demographics of the LGBT+ adult population were similar to non-LGBT+ adults with respect to gender, race/ethnicity, urbanicity, and working status, but a significantly greater share were younger.1 
  • Despite being a younger population, LGBT+ individuals were more likely to report being in fair or poor health and were managing chronic conditions and living with disabilities at higher rates than non-LGBT+ people.
  • LGBT+ people were less likely be privately insured and more likely to have Medicaid coverage than their non-LGBT+ counterparts, with similar shares uninsured.

Access to and Use of Care

  • LGBT+ people reported lower rates of having a usual source of care than their non-LGBT+ counterparts but reported wider use of telehealth visits.
  • The large majority of LGBT+ people saw a health care provider in the past two years, but a smaller share had a recent check-up or well-woman visit. The share in both cases is similar to those among non-LGBT+ people. Those who were uninsured were less likely than those with coverage to have seen a provider or had a check-up.
  • Uptake of health services differs by LGBT+ status in some cases. For example, LGBT+ people reported higher testing rates for sexually transmitted infections (STIs) and HIV, but lower uptake of pap smears. In addition, larger shares of LGBT+ people reported regularly taking prescription medications than non-LGBT+ people, despite being a younger population overall.
  • LGBT+ people reported needing mental health services over the past two years at much higher rates than non-LGBT+ people. Moreover, not all those who said they needed mental health services received them.
  • LGBT+ people, like non-LGBT+ people, commonly reported problems with health care costs impacting their ability to pay for basic necessities such as food, heat, and housing, among other challenges.
  • The majority of LGBT+ people assigned female at birth have used contraception at some point in their lifetime (70%) and over half do so for a reason other than preventing pregnancy. They were less likely than non-LGBT+ people to say they have ever been pregnant (40% compared to 70%).

Provider Interactions

  • LGBT+ people reported higher rates of discrimination during a health care visit compared to non-LGBT+ people.
  • LGBT+ people were also more likely to report a range of recent negative provider experiences, including having had a provider who did not believe they were telling the truth or suggested they were to blame for a health problem, among others. These experiences were most common among LGBT+ people who were women, younger, had low incomes, and/or reported a disability or chronic disease.


Issue Brief

Background

The share of people in the United States who identifies as LGBT+ has increased substantially in recent years, particularly among younger generations, yet health disparities and health access-related challenges persist across multiple dimensions. Understanding the health care needs and experiences of the more than 7% of LGBT+-identified people in the United States, including the one-in-five younger adults from Generation Z, is important for addressing barriers and facilitating access to care and coverage.

While in some areas, the health experiences of LGBT+ people mirror those of their non-LGBT+ counterparts, studies have found that this population experiences certain challenges at higher rates than those who identify as heterosexual and cisgender, challenges which intersect with factors beyond sexual orientation and gender identity to include race/ethnicity, class, nationality, and age, among other aspects of identity. Recognizing this, the National Institutes of Health (NIH) identified sexual and gender minorities as a “health disparity population” to encourage and support research in this area. Further, the Biden administration has taken multiple steps to address equity in the LGBTQ community, including with respect to data collection and health care, including issuing multiple executive orders in this area, announcing that the HHS Office for Civil Rights (OCR) would include gender identity and sexual orientation as it interprets and enforces the ACA’s prohibition against sex discrimination (Section 1557), opposing state actions aimed at limiting access to gender-affirming care for transgender and gender non-conforming people, adopting protections for LGBTQ+ youth and working to provide protections for health care workers delivering gender affirming care, and issuing a Federal Evidence Agenda on LGBTQI+ Equity, a “roadmap for federal agencies” regarding “data-driven and measurable [sexual orientation and gender identity] SOGI Data.”

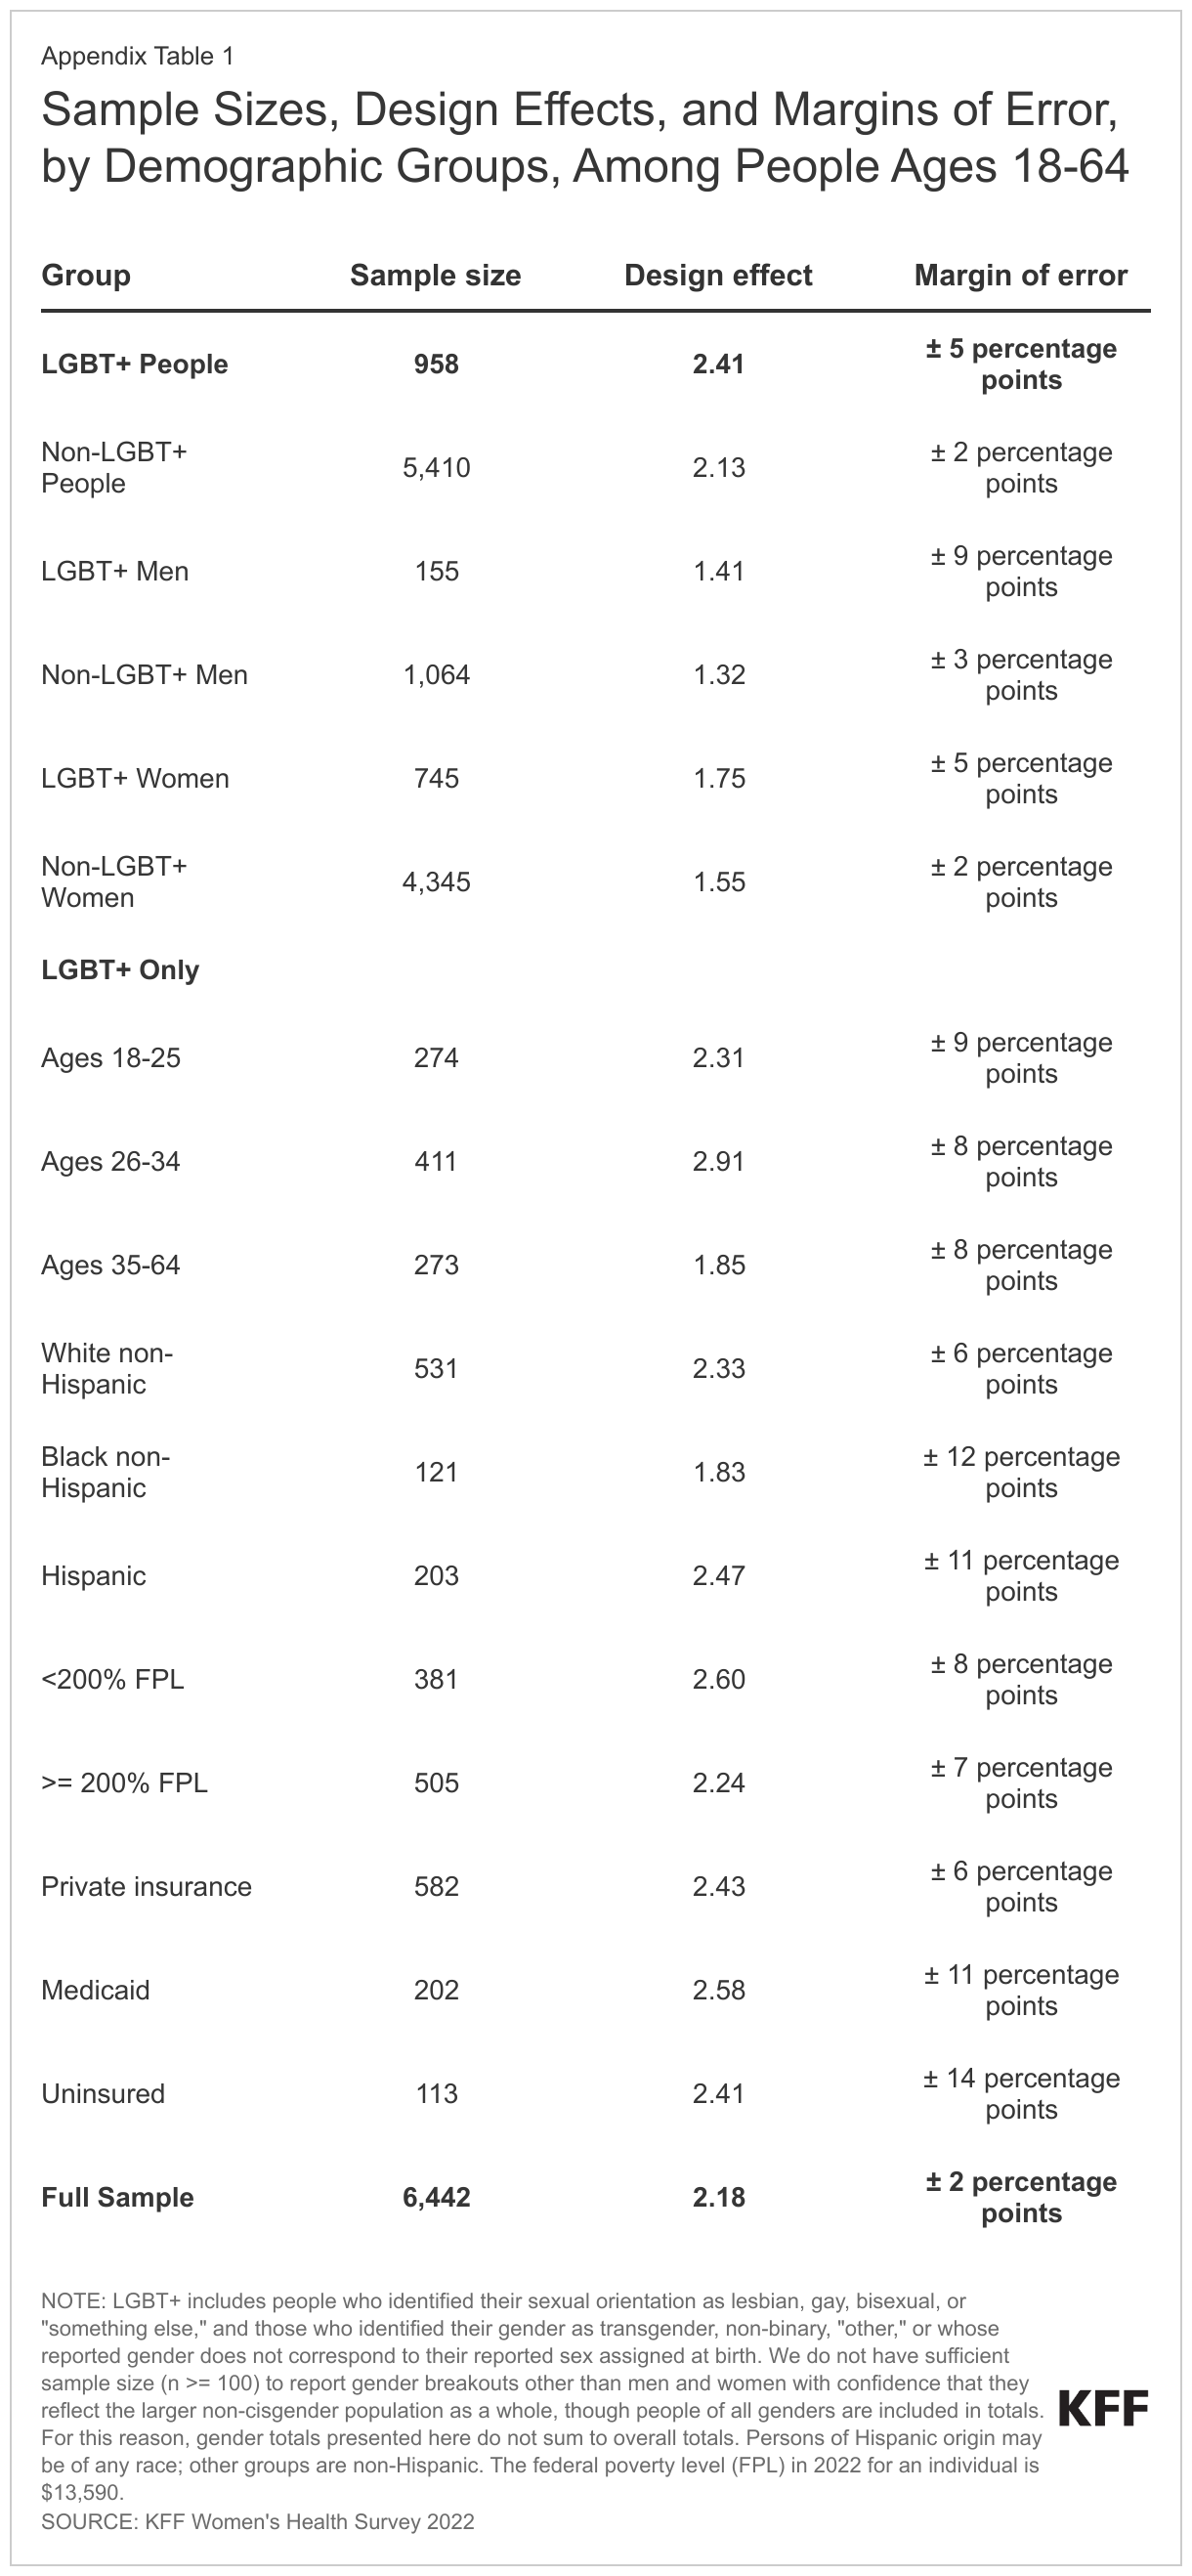
Despite progress in researching these issues over the past decade and increased federal commitment, much population-based research still does not include measures of sexual orientation and gender identity, limiting the ability of policymakers, policy implementers, and researchers to assess national trends and disparities, and identify needed interventions. With this report, we add to the knowledge base in this area by analyzing nationally representative data from a 2022 KFF survey of 6,442 adults ages 18 to 64, including 958 LGBT+ people, conducted primarily online from May 10, 2022, to June 7, 2022. For this survey, LGBT+ people include those who identified their sexual orientation as lesbian, gay, bisexual, or “something else,” and those who identified their gender as transgender, non-binary, “other,” or whose reported gender does not correspond to their reported sex assigned at birth. See the Methodology for additional detail.

The survey collected data on a range of demographic characteristics and issues from general well-being to experiences engaging in the health system, use of preventive services including HIV and STI testing, reproductive health, and mental health. (See also our issue brief Mental Health Care Needs and Experiences Among LGBT+ People).

Demographics

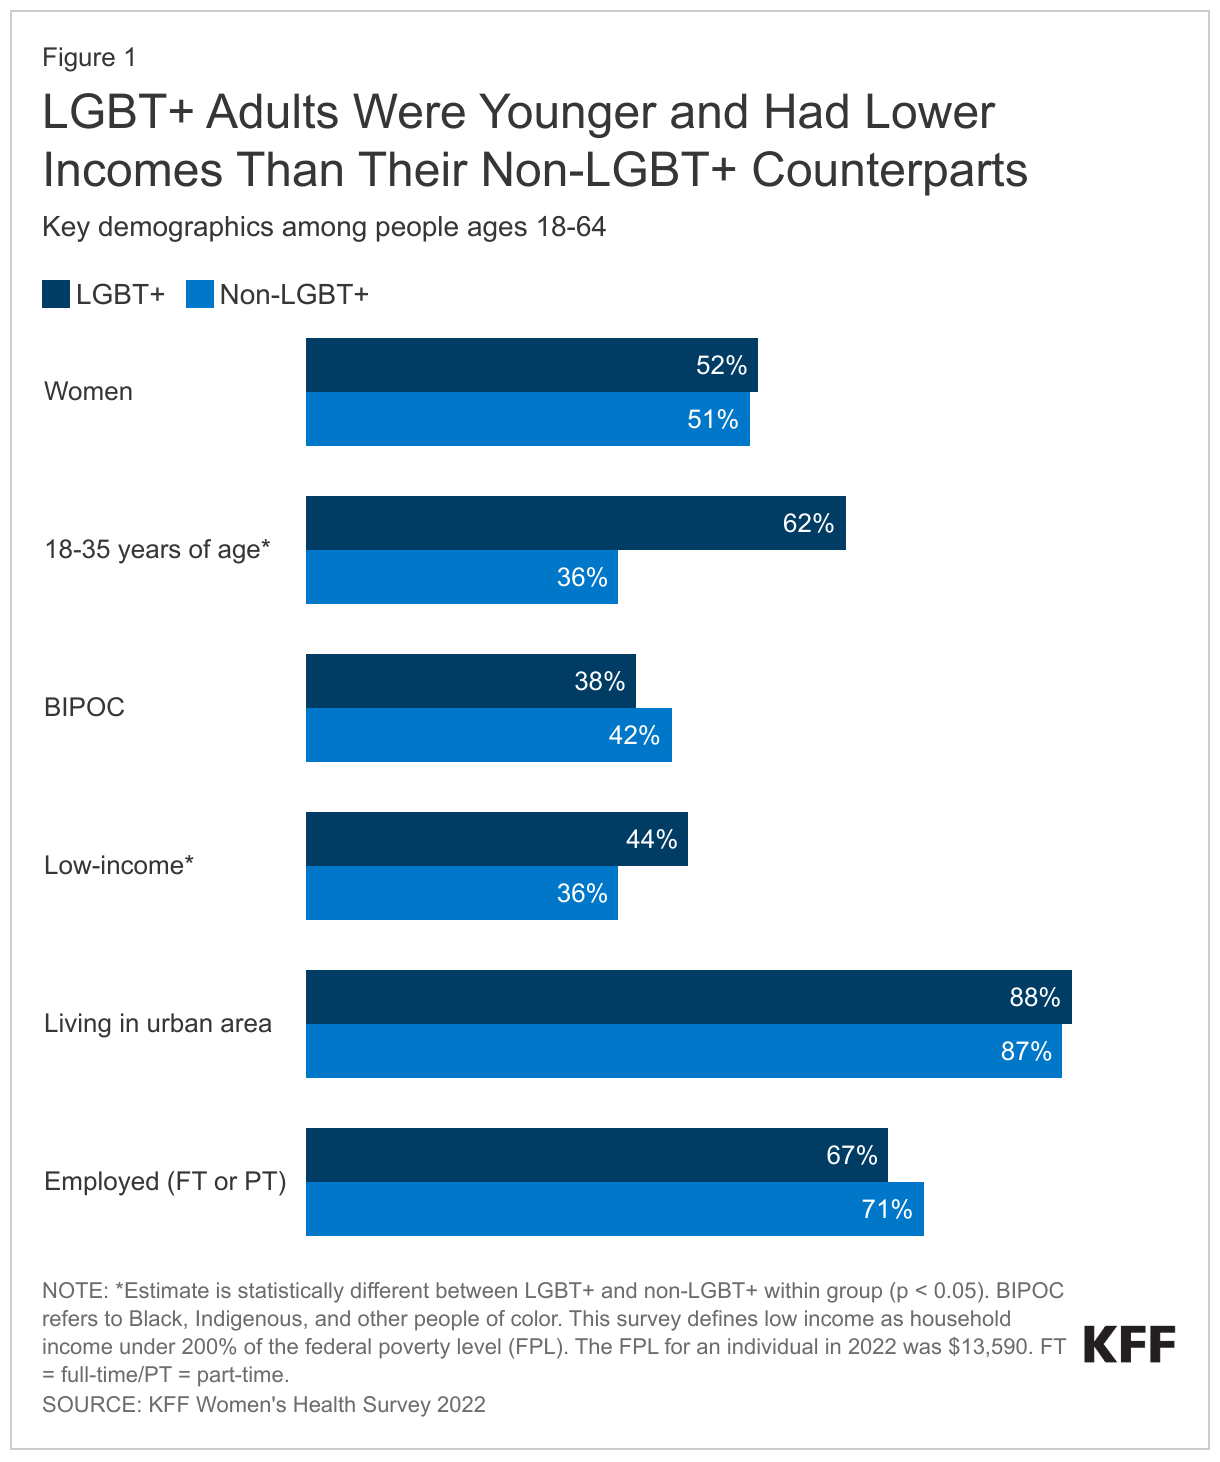
The demographics of LGBT+ adults generally mirror those of non-LGBT+ adults in many ways, with age and income being notable exceptions (Figure 1).

  • LGBT+ adult demographics look similar to non-LGBT+ adults with respect to gender, race/ethnicity, urbanicity, and working status.
  • Yet LGBT+ adults are significantly younger, with almost two-thirds (62%) between the ages of 18 and 35 compared to 36% of non-LGBT+ adults.
  • LGBT+ people are also more likely than non-LGBT+ people to have lower incomes, with 44% of LGBT+ people earning less than 200% of the federal poverty level ($13,590 per year in 2022 for an individual) compared to 36% of non-LGBT+ people.
LGBT+ Adults Were Younger and Had Lower Incomes Than Their Non-LGBT+ Counterparts

Health Status

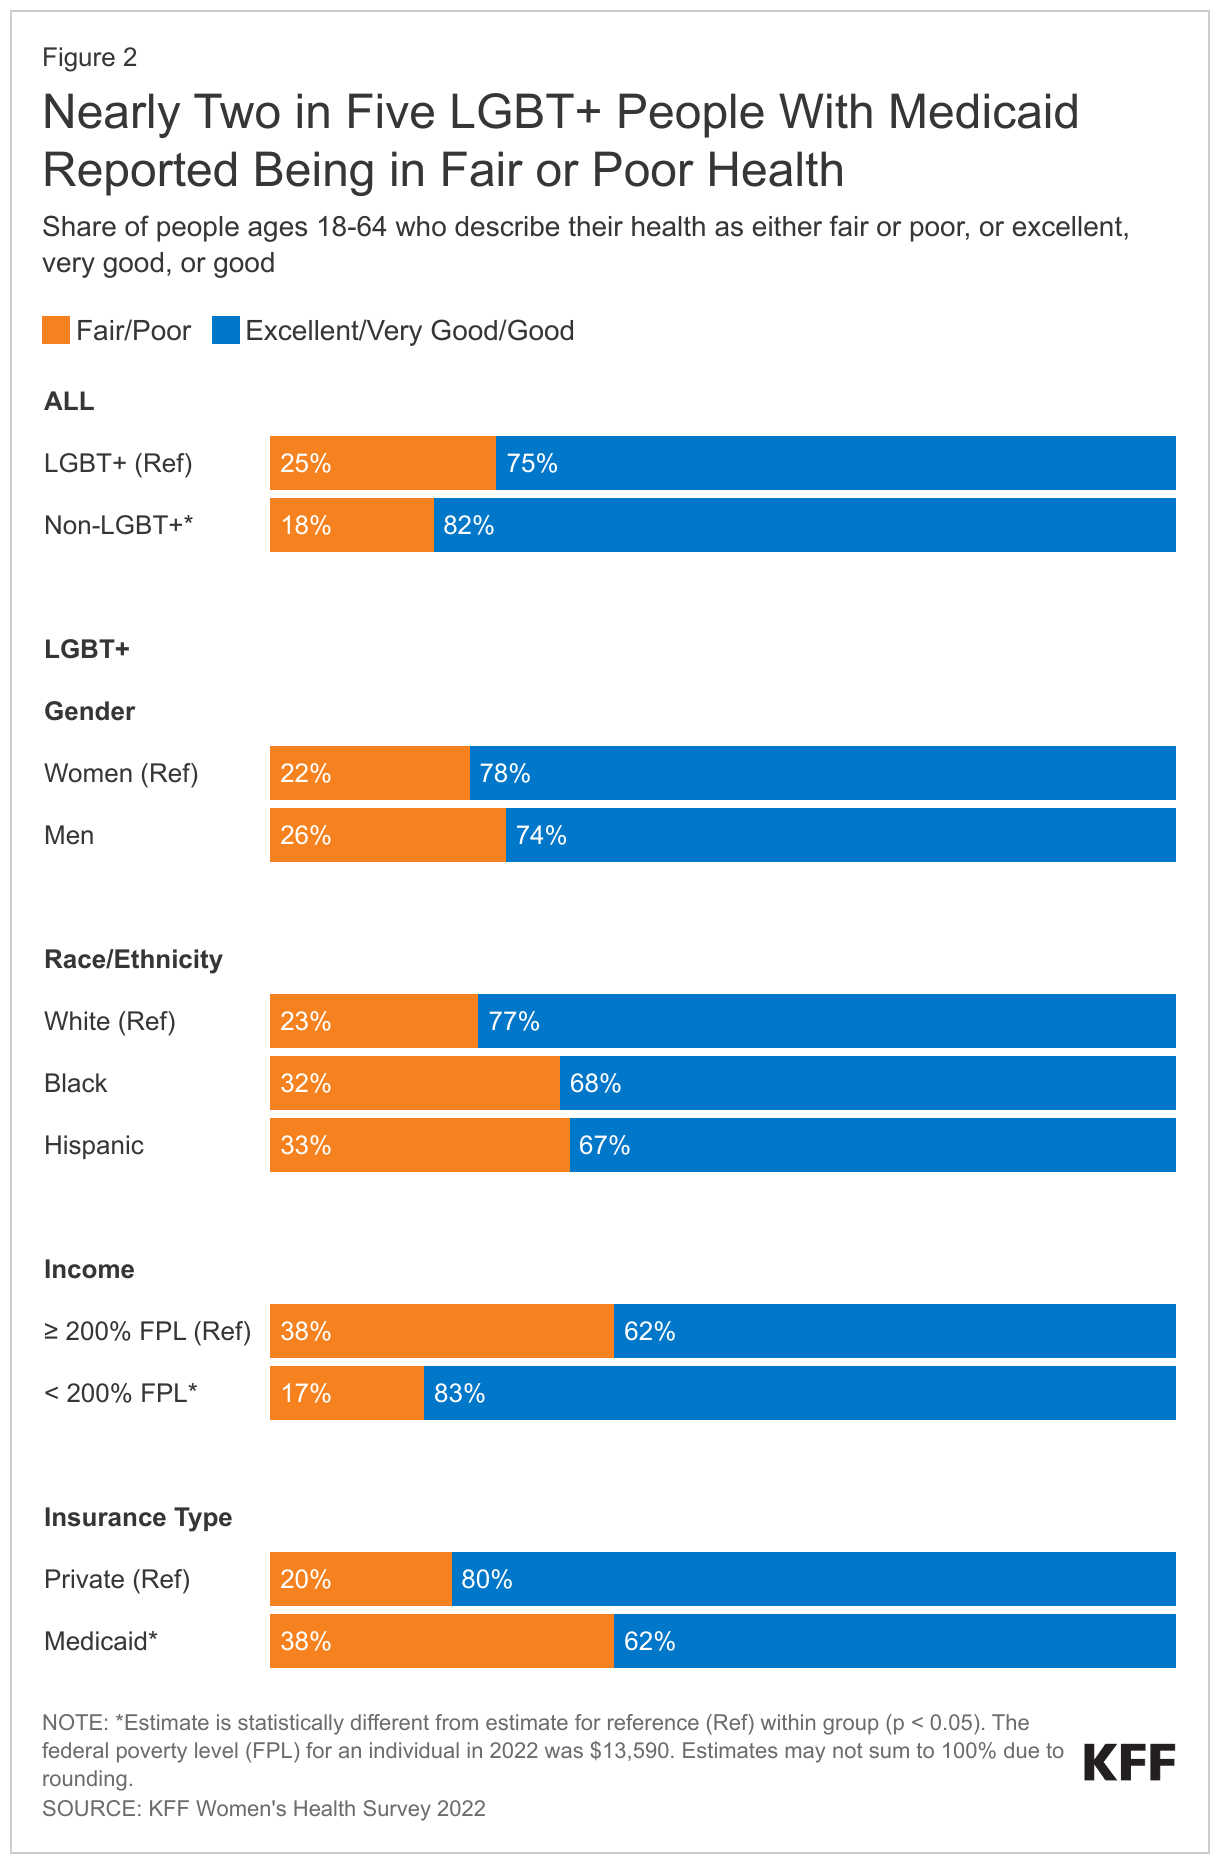
LGBT+ people were more likely to be in fair or poor health than non-LGBT+ people despite being a younger population overall (Figure 2).

  • One-quarter (25%) of LGBT+ people reported being in fair or poor health compared to 18% of non-LGBT+ people. This was especially common among LGBT+ people with low incomes2  and those covered by Medicaid.
  • There were no statistically significant differences by race/ethnicity or gender.
Nearly Two in Five LGBT+ People With Medicaid Reported Being in Fair or Poor Health

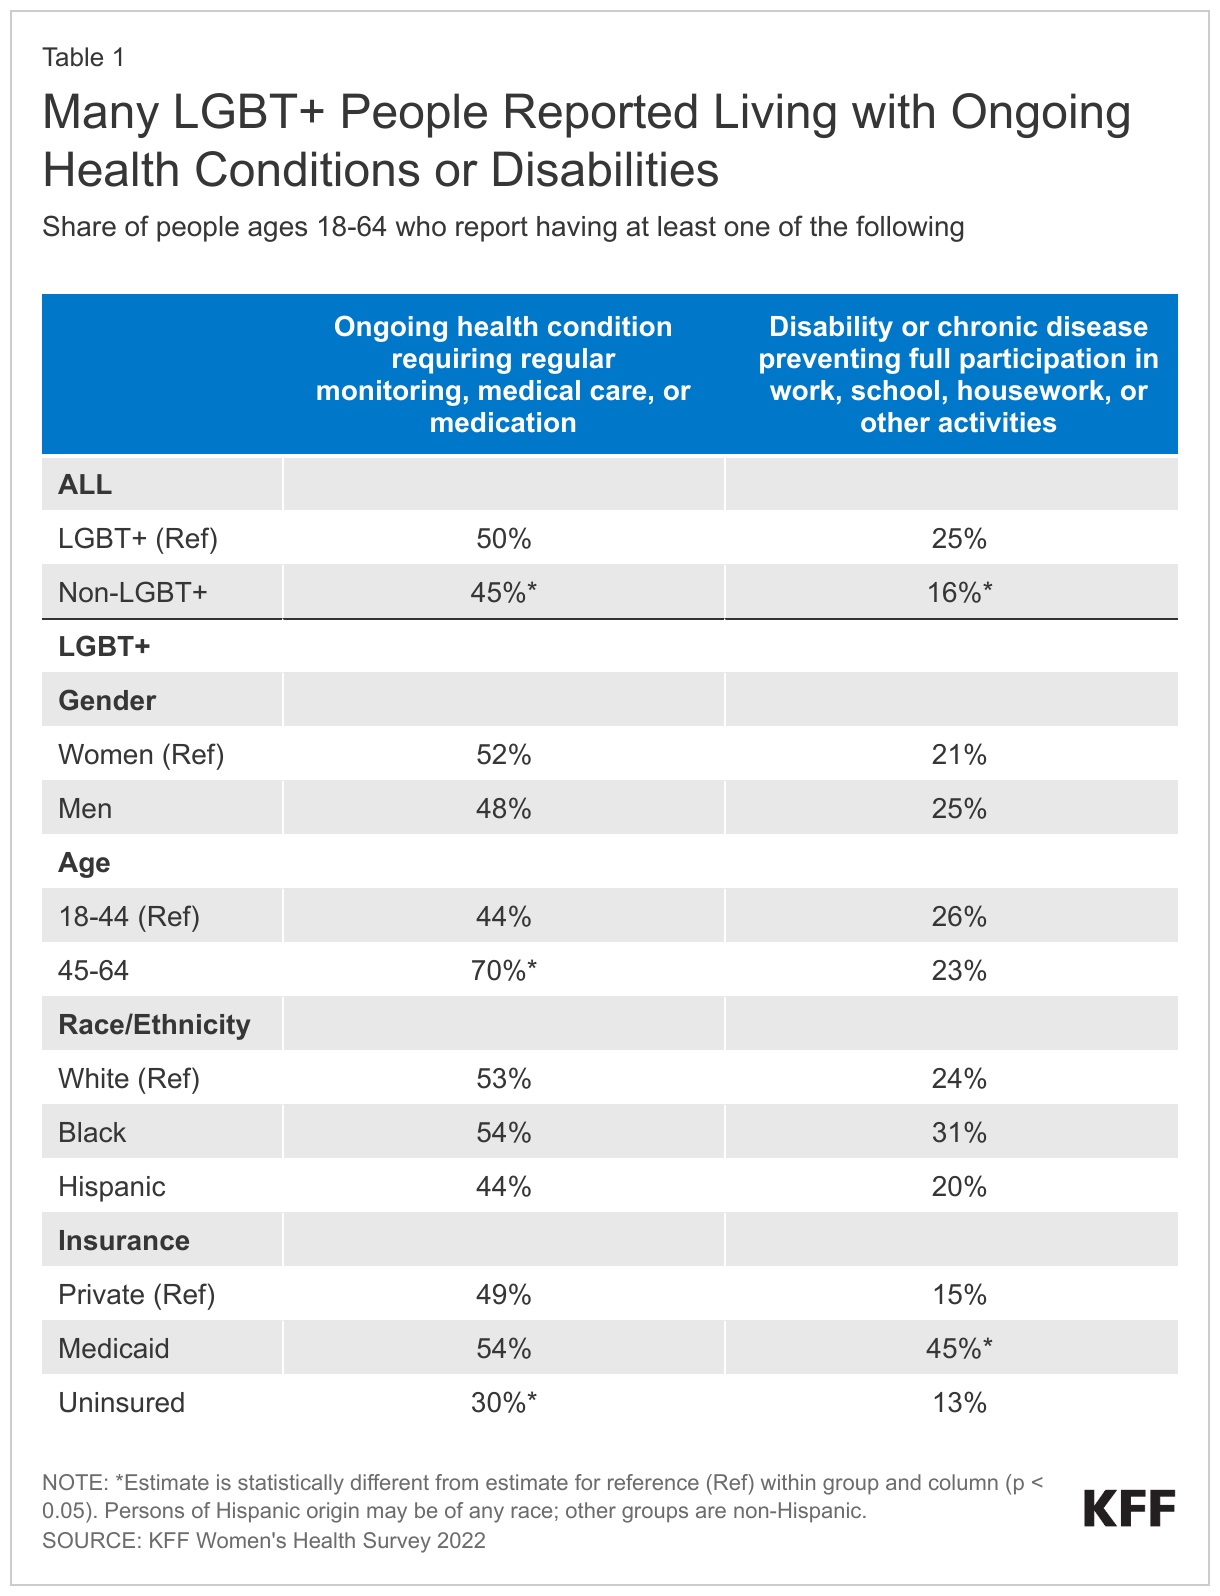
LGBT+ people were managing chronic conditions and living with disabilities that impact daily life at higher rates than non-LGBT+ people (Table 1).

  • Half (50%) of LGBT+ people reported that they had an ongoing health condition that requires regular monitoring, medical care, or medication, a higher share than non-LGBT+ people (45%).
  • Additionally, a larger share of LGBT+ people reported having a disability or chronic disease that keeps them from participating fully in work, school, housework, or other activities than non-LGBT+ people (25% v. 16%). There were also notable differences within the LGBT+ community.
    • LGBT+ adults between the ages of 45-64 reported markedly higher rates of ongoing conditions requiring care or medication than younger LGBT+ adults ages 18-44 (44% v. 70%).
    • A larger share of LGBT+ people ages 18-44 reported having a disability or chronic disease (26%) than non-LGBT+ people in this age range (12%) (data not shown in table).
    • LGBT+ people with Medicaid faced especially high rates of disability, which is one of the eligibility pathways into the program, compared to LGBT+ people with private insurance coverage (45% v. 15%).
Many LGBT+ People Reported Living with Ongoing Health Conditions or Disabilities

Insurance Coverage and Access to Care

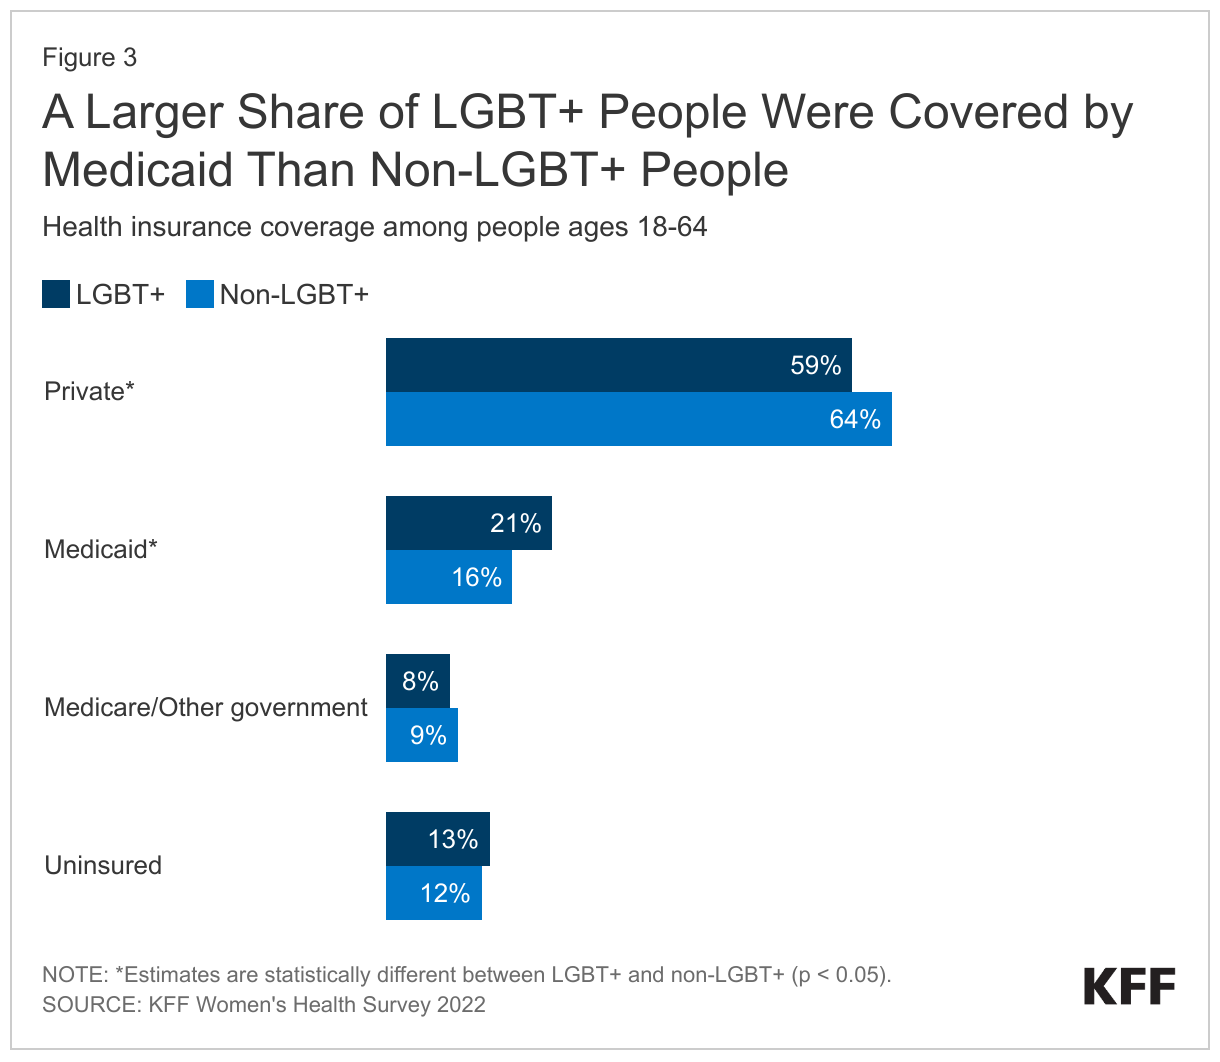
A smaller share of LGBT+ people had private insurance (59%) and more had Medicaid coverage (21%) than their non-LGBT+ counterparts (64% and 16%, respectively), reflecting their lower incomes which were driven, at least in part, by being a younger population (Figure 3). Similar shares were uninsured.

A Larger Share of LGBT+ People Were Covered by Medicaid Than Non-LGBT+ People

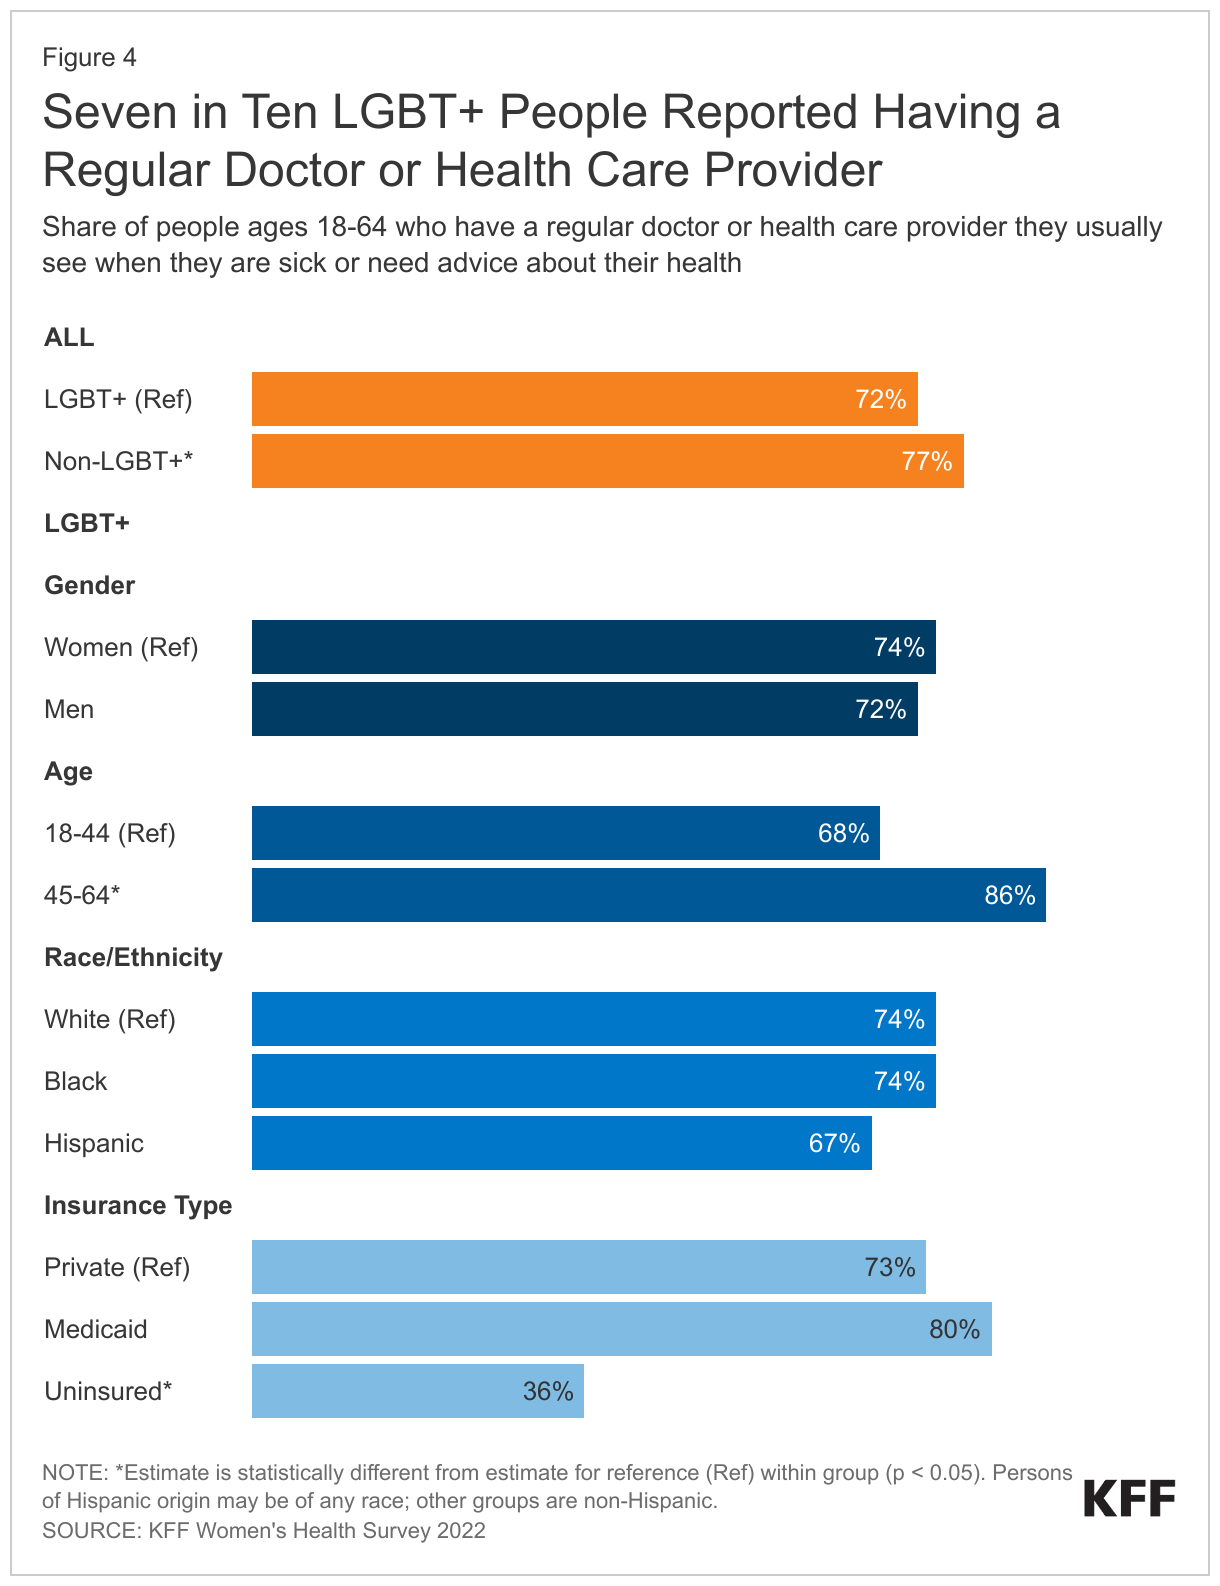
Most LGBT+ people reported having a regular doctor or health care provider, though they were less likely to have one than non-LGBT+ people.

  • LGBT+ people reported lower rates of having a regular doctor or provider than their non-LGBT+ counterparts (72% v. 77%) (Figure 4). Research has found that having a usual source of care is associated with increased use of preventive care and better health outcomes.
  • Among LGBT+ people, rates were significantly lower for those ages 18-44 than those ages 45-64 (68% v. 86%) and among those who were uninsured (36%).
Seven in Ten LGBT+ People Reported Having a Regular Doctor or Health Care Provider

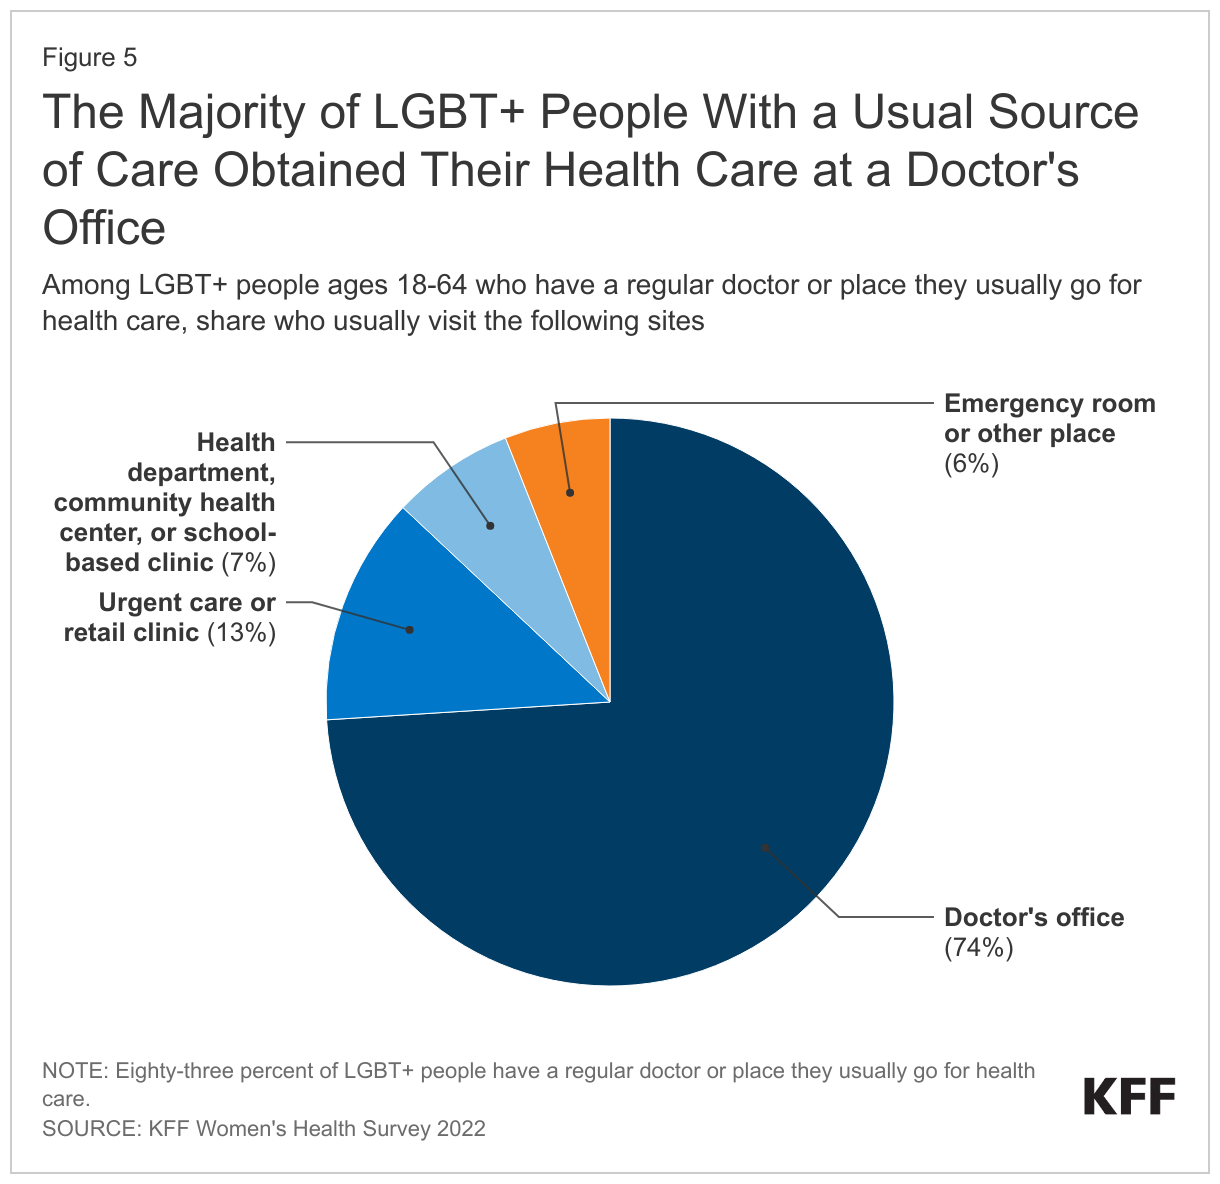
Nearly three-quarters (74%) of LGBT+ people with a usual source of care got that care at a doctor’s office, though one in five (20%) obtained their routine care at a clinic, such as a health department, health center, school clinic, urgent care center, or clinic inside a store or pharmacy. Smaller shares went to an emergency room or some other place (6%) (Figure 5). The type of location where care was received was similar among LGBT+ and non-LGBT+ people (data not shown in figure).

The Majority of LGBT+ People With a Usual Source of Care Obtained Their Health Care at a Doctor's Office

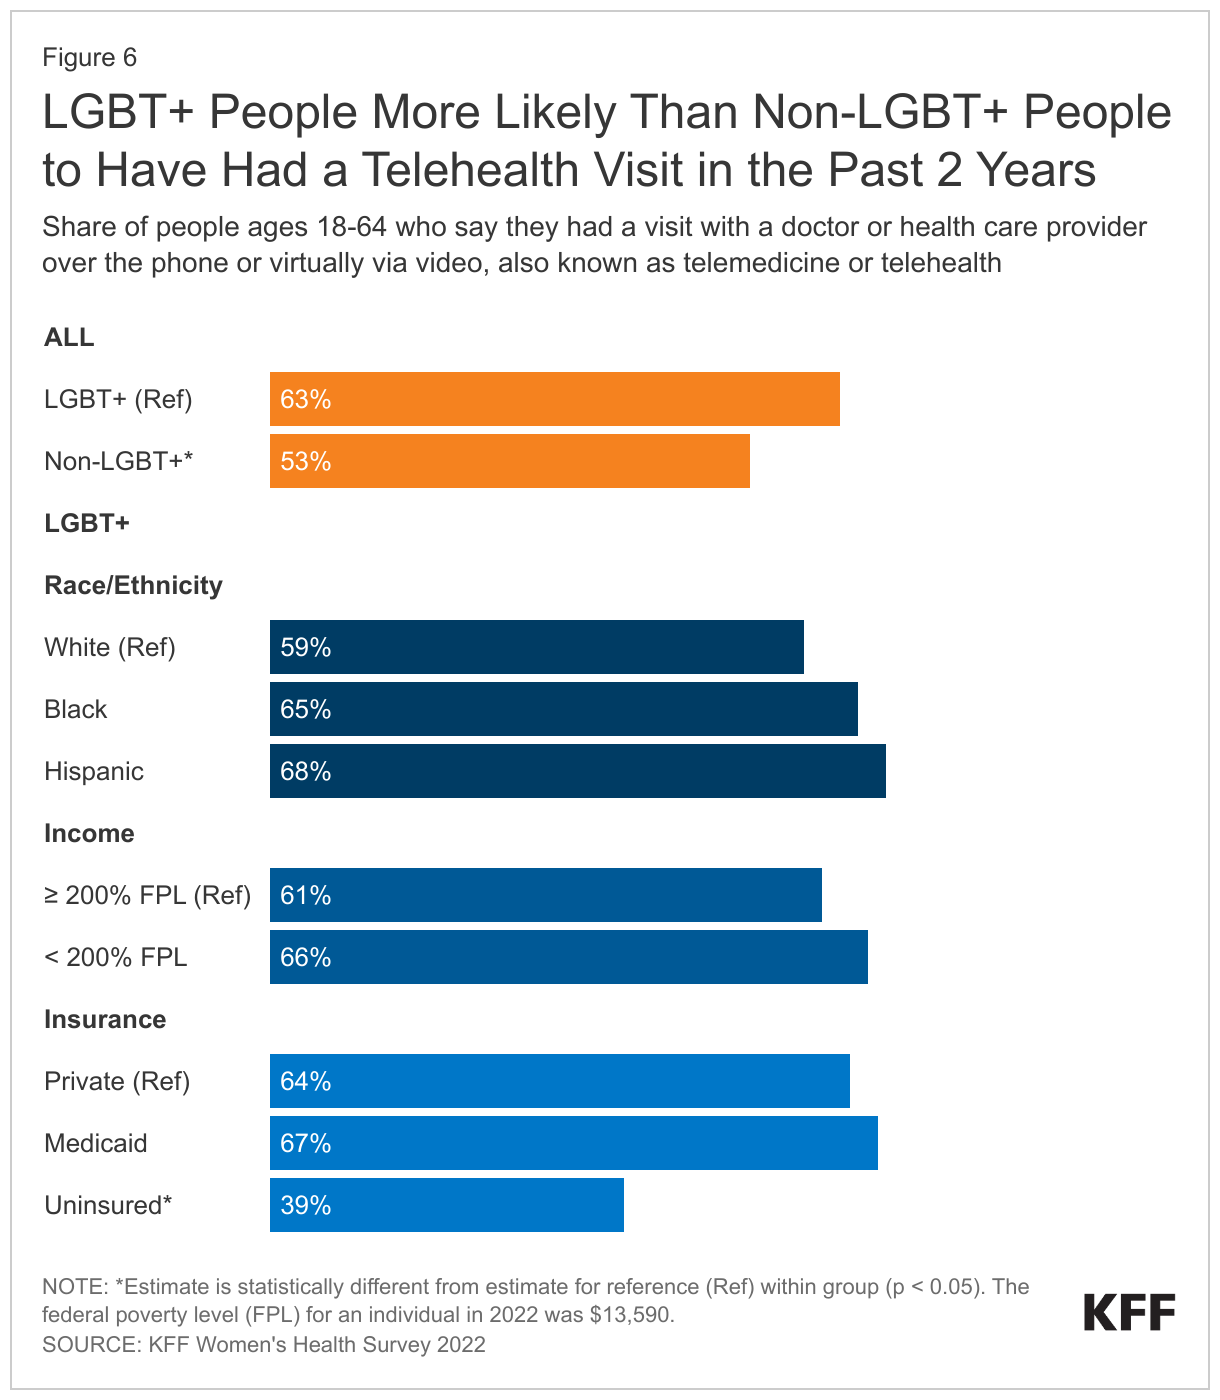
Telehealth has become an increasingly common way to access care, including among LGBT+ people, who reported higher use of telehealth visits over the past two years than did non-LGBT+ people (63% v. 53%) (Figure 6).

  • There were no statistically significant demographic differences among LGBT+ people who used telehealth in the past two years except for those who were uninsured, who reported lower rates of telehealth use (39%) than those with Medicaid (67%) or private insurance (64%). Similarly, non-LGBT+ people without insurance reported lower rates of telehealth use than those with Medicaid and private insurance (data not shown in figure).
  • About one in ten (9%) LGBT+ people reported using an online prescribing platform or app, such as Nurx, The Pill Club, Roman, or hims/hers to receive a prescription or health care service, similar to the share among non-LGBT+ people (6%) (data not shown in figure).
LGBT+ People More Likely Than Non-LGBT+ People to Have Had a Telehealth Visit in the Past 2 Years

Use of Health Care Services

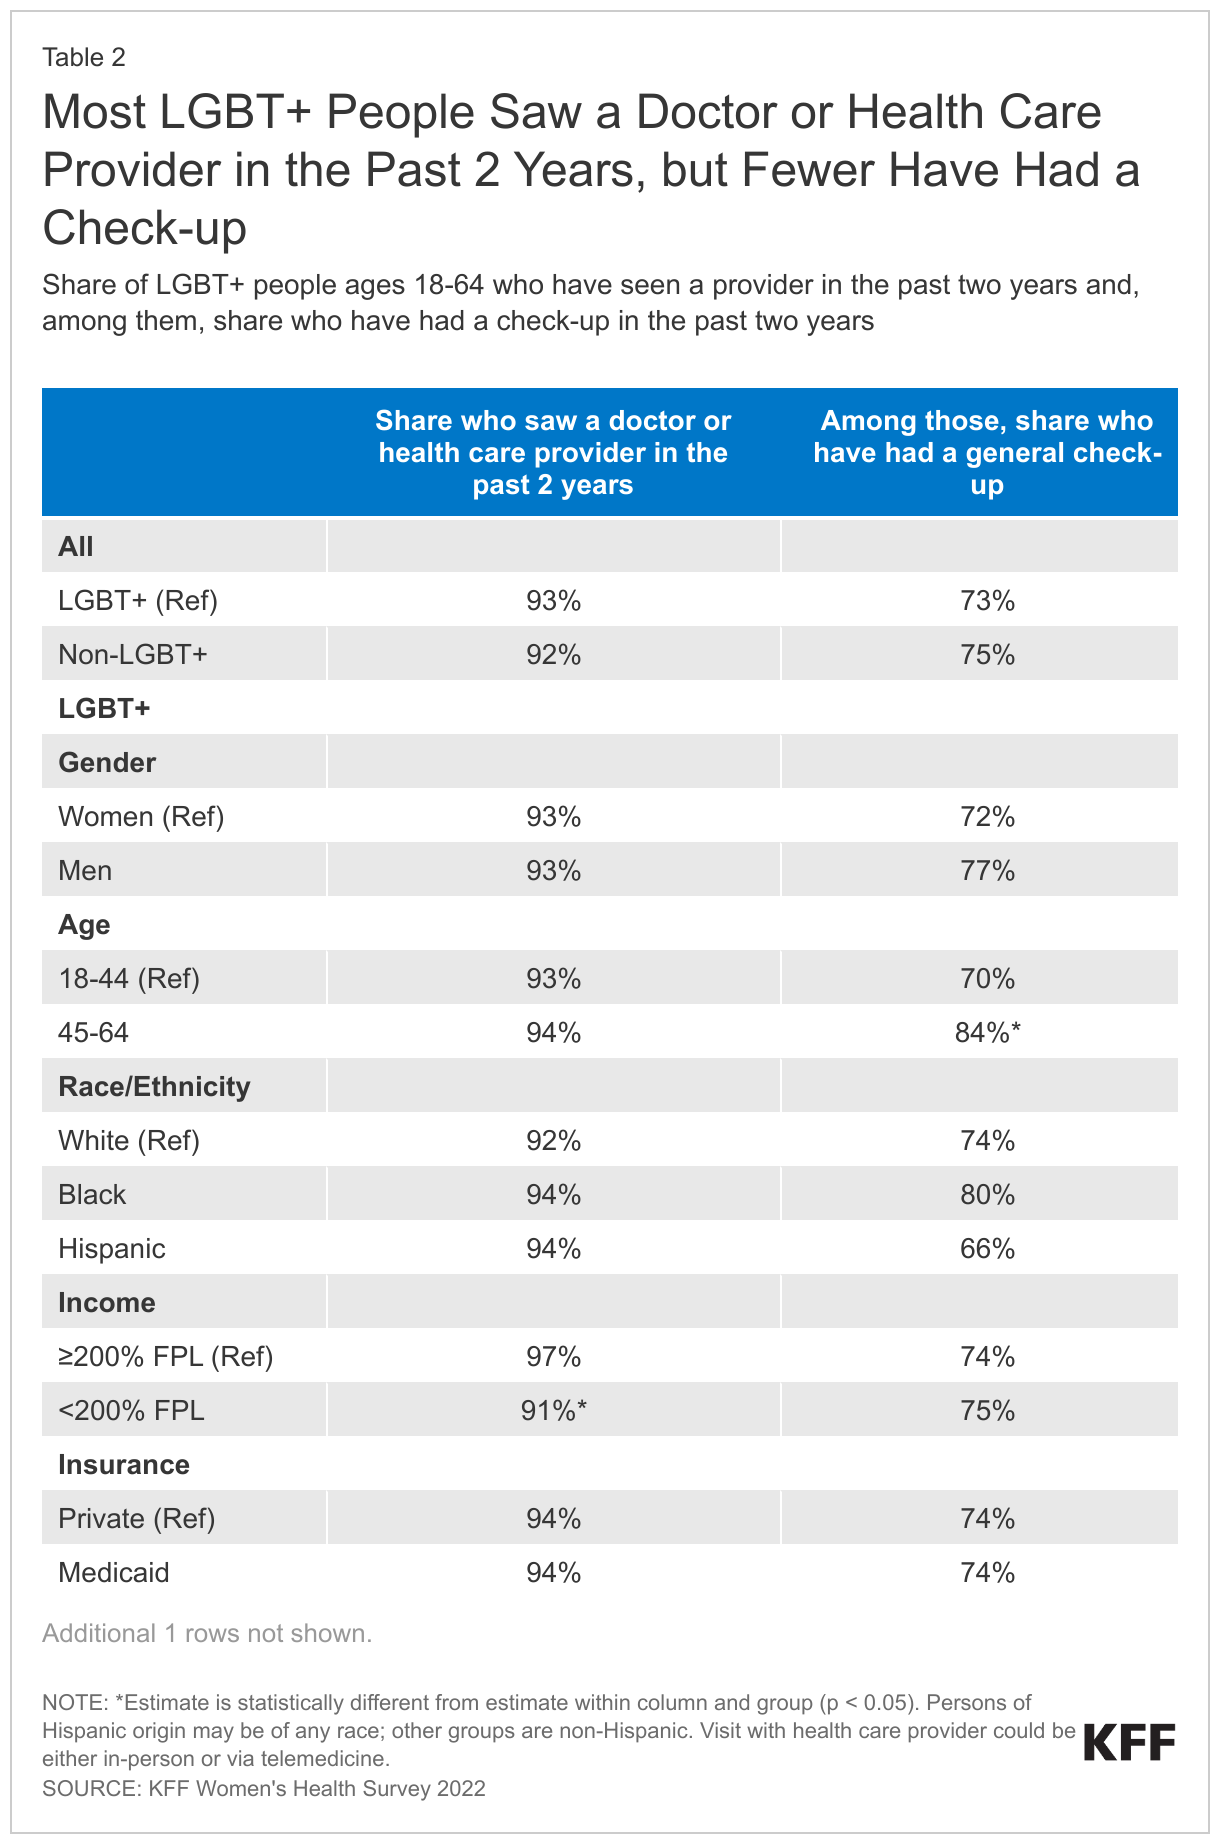
More than nine in ten (93%) LGBT+ people saw a doctor or health care provider in the past two years but fewer than three-quarters (73%) of this group had a general check-up or well-woman visit3  in that period. Both findings were similar to the share among non-LGBT+ people (Table 2).

  • LGBT+ people who were uninsured were significantly less likely than those with health coverage (either Medicaid or private insurance) to have seen a provider (80% v. 94%) or had a wellness check-up in the past two years (57% v. 74%).
Most LGBT+ People Saw a Doctor or Health Care Provider in the Past 2 Years, but Fewer Have Had a Check-up

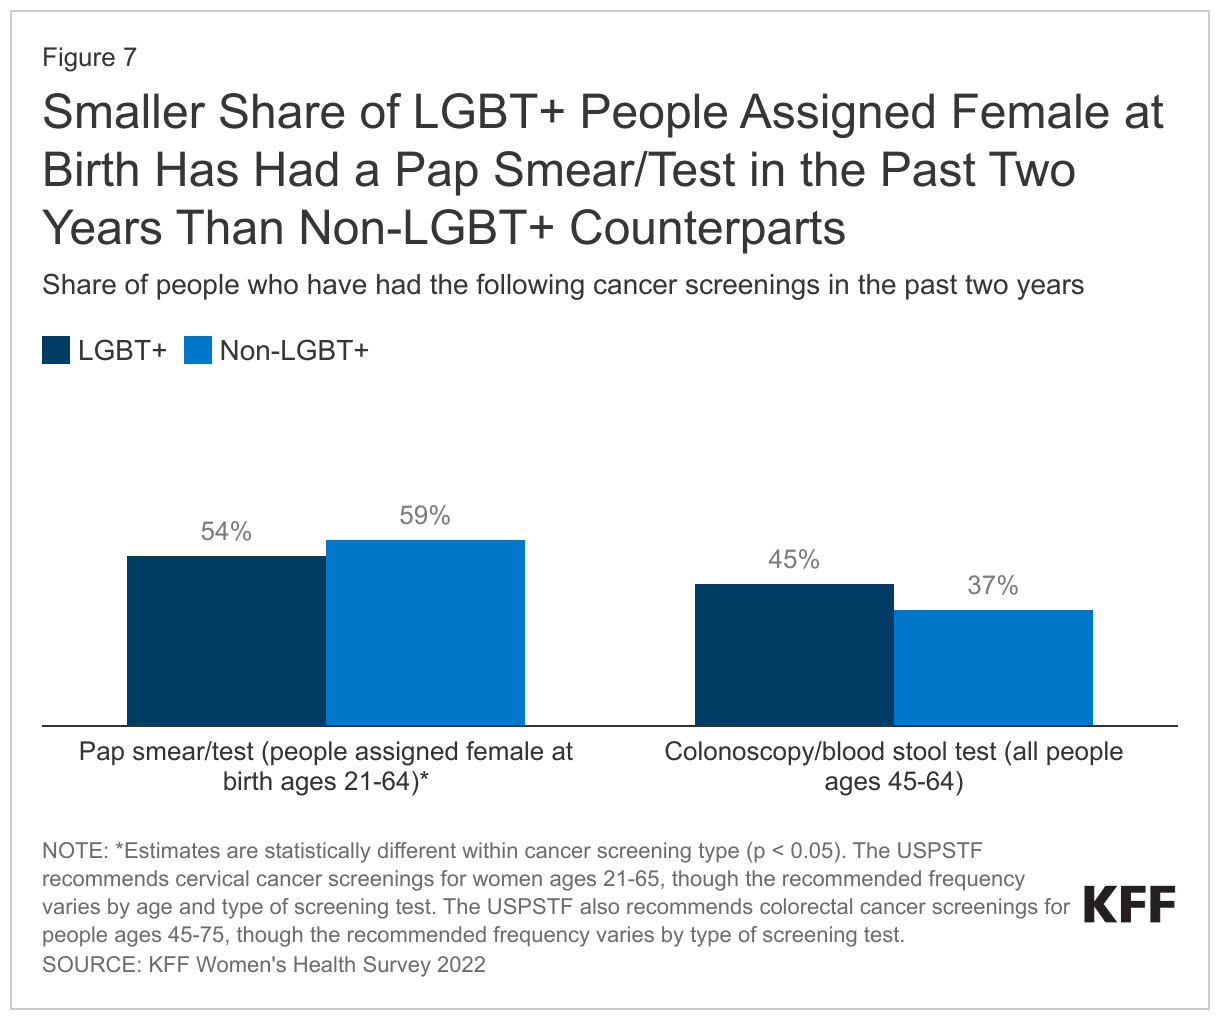
Use of preventive cancer screenings can lead to early identification of conditions when they are more responsive to medical interventions and potentially avert serious complications. While uptake of colonoscopies among LGBT+ people was similar to that of non-LGBT+, slightly higher shares of non-LGBT+ people reported having had a pap smear in the past two years than LGBT+ people (Figure 7).

  • Slightly smaller shares of LGBT+ people assigned female at birth4  ages 21-64 reported having had a pap smear in the past two years than their non-LGBT+ counterparts (54% v. 59%).
  • Forty-five percent of LGBT+ people ages 45-64 reported having had a colon cancer screening in the past two years, similar to non-LGBT+ people (37%).
Smaller Share of LGBT+ People Assigned Female at Birth Has Had a Pap Smear/Test in the Past Two Years Than Non-LGBT+ Counterparts

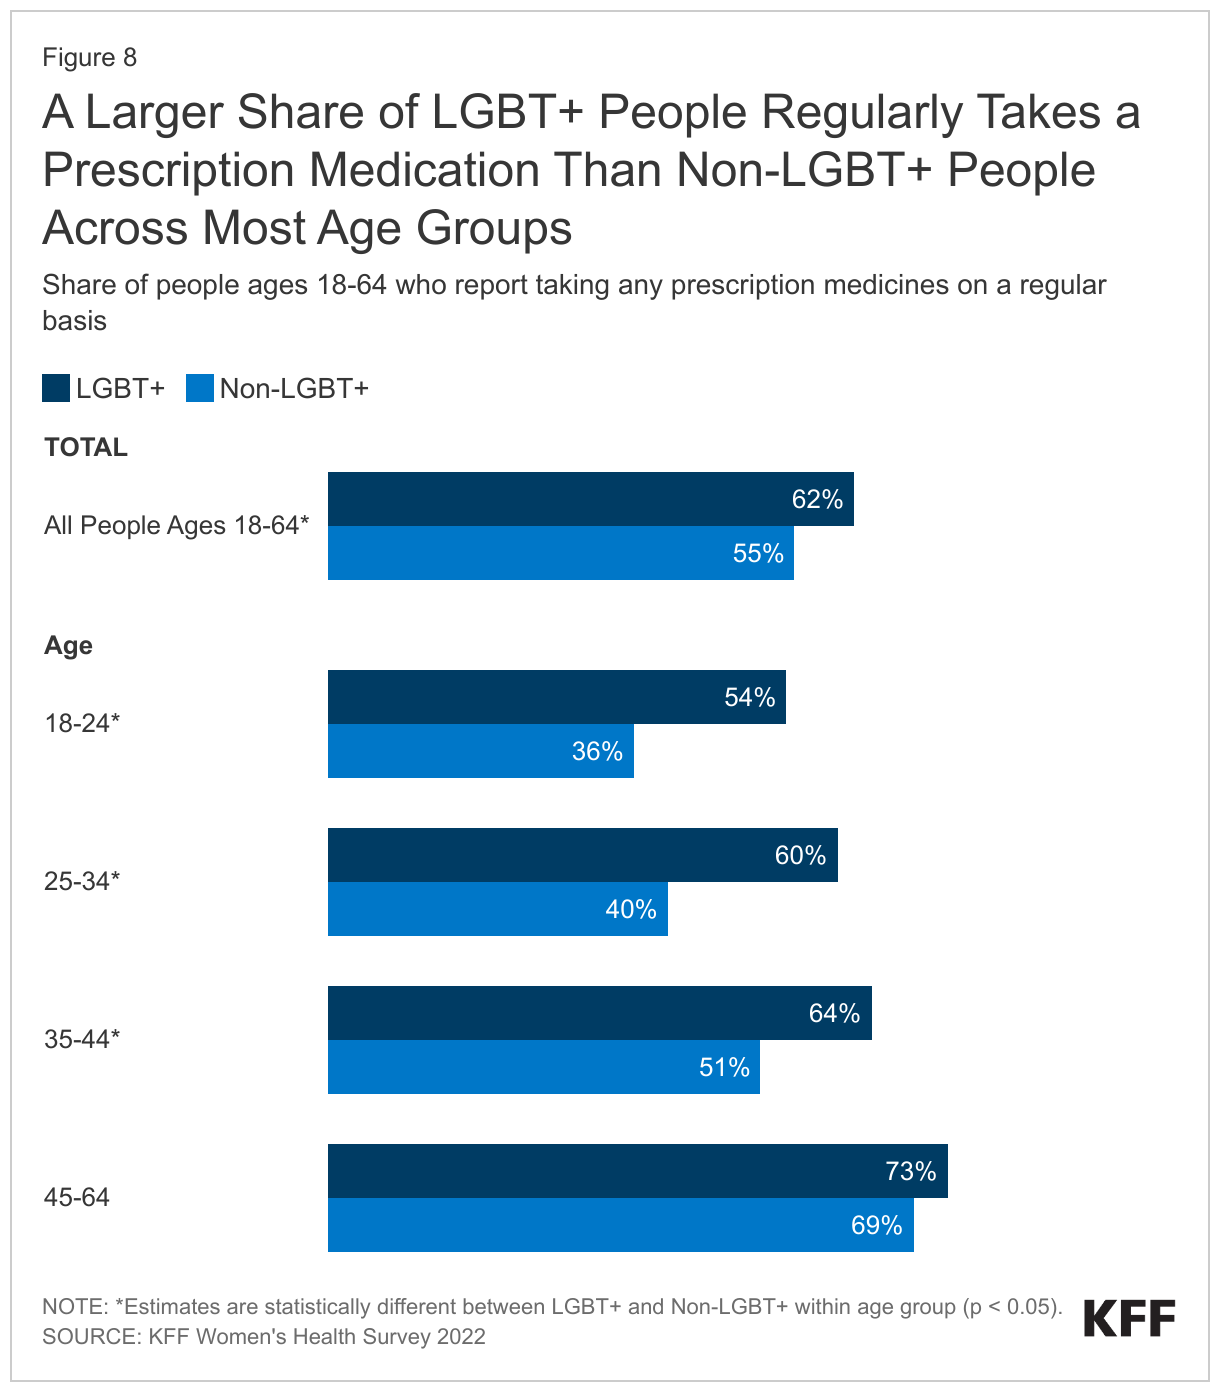
A higher share of LGBT+ people reported taking at least one prescription medication on a regular basis than non-LGBT+ people, despite being a younger population overall (62% v. 55%) (Figure 8).

  • As with non-LGBT+ people, prescription use among LGBT+ people increased with age.
    • However, the share of LGBT+ taking a prescription was higher across each age group, except those ages 45 to 64, when compared to non-LGBT+ people.
  • Looking at the youngest group, more than half (54%) of LGBT+ people ages 18 to 24 reported regularly taking a prescription compared to just over one-third (36%) of non-LGBT+ people in the same age group.
A Larger Share of LGBT+ People Regularly Takes a Prescription Medication Than Non-LGBT+ People Across Most Age Groups

Sexual and Reproductive Health

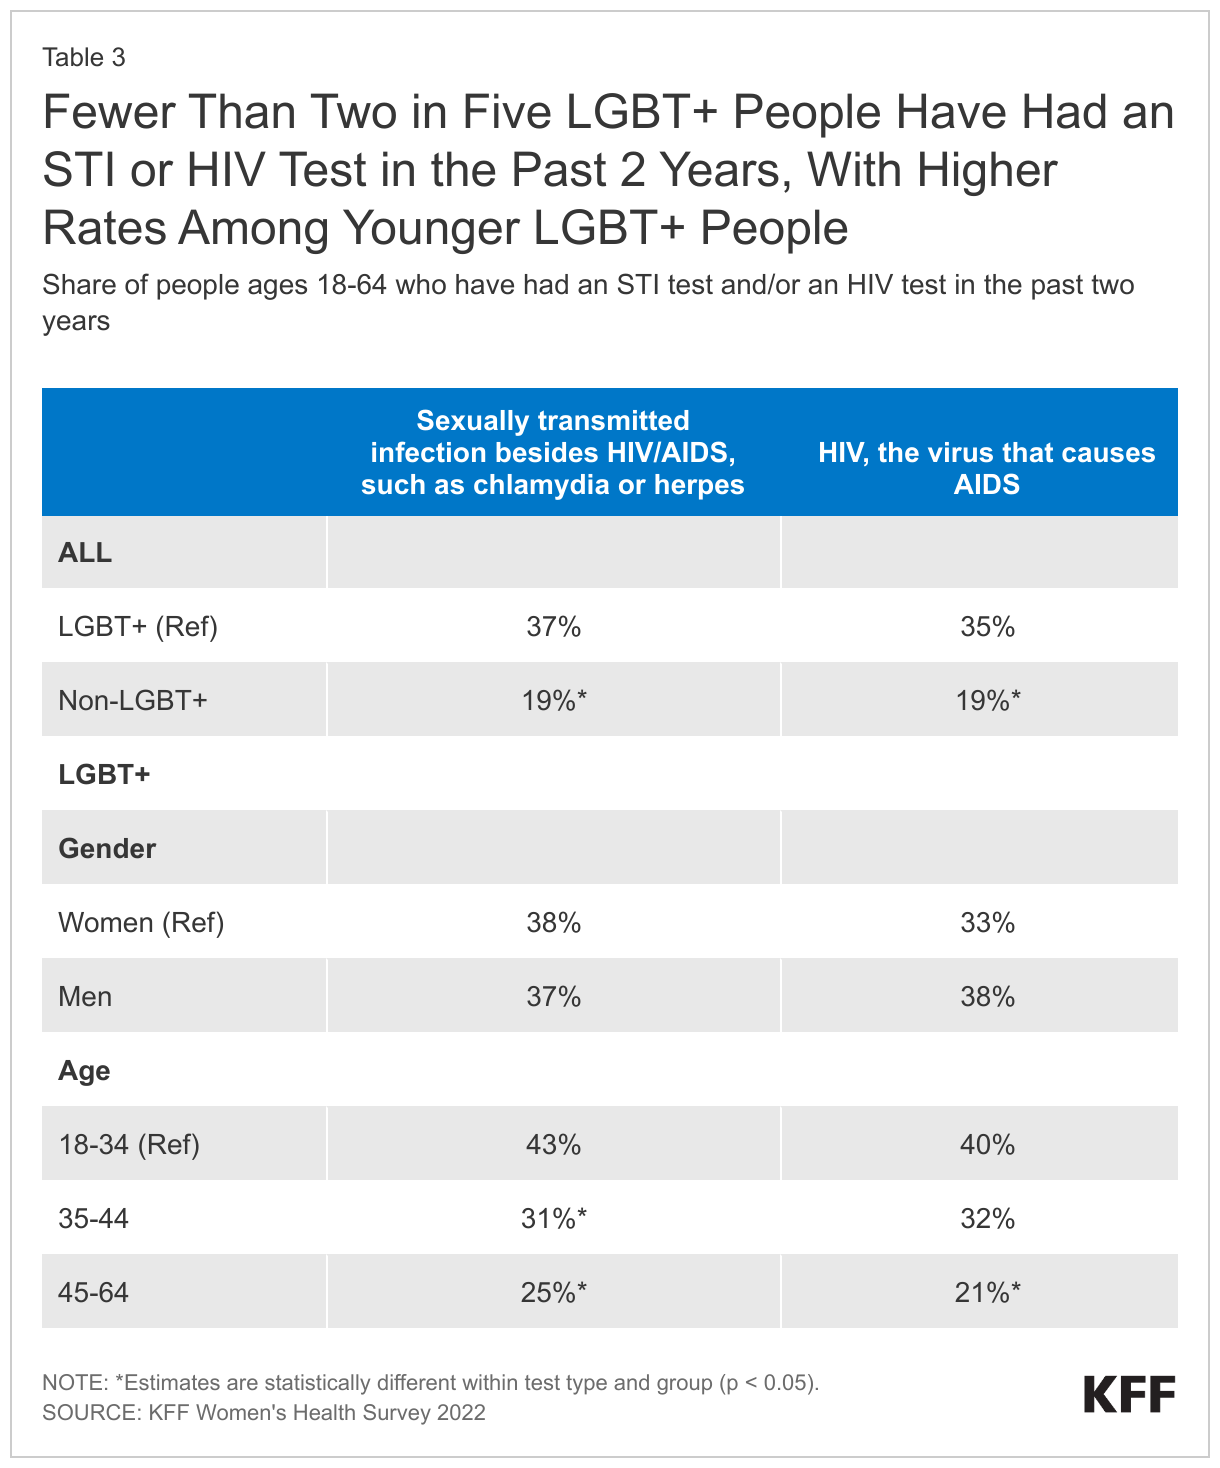
LGBT+ people reported higher rates of receiving testing for sexually transmitted infections (STIs) and for HIV than their non-LGBT+ counterparts, services that are recommended for early detection, treatment, and preventing transmission (Table 3).

  • However, uptake is still relatively low. Thirty-five percent (35%) of LGBT+ people ages 18-64 have been tested for HIV in the past two years, higher than the share of non-LGBT+ people (19%).
    • Among LGBT+ people, testing rates were highest among those ages18-44.
  • Nearly four in ten (37%) LGBT+ people ages 18-64 have been tested for an STI (other than HIV) such as chlamydia or herpes in the past two years, higher than the share of non-LGBT+ people (19%).
    • Among LGTB+ people, STI testing rates were also higher among those who were younger (43%).
Fewer Than Two in Five LGBT+ People Have Had an STI or HIV Test in the Past 2 Years, With Higher Rates Among Black LGBT+ People

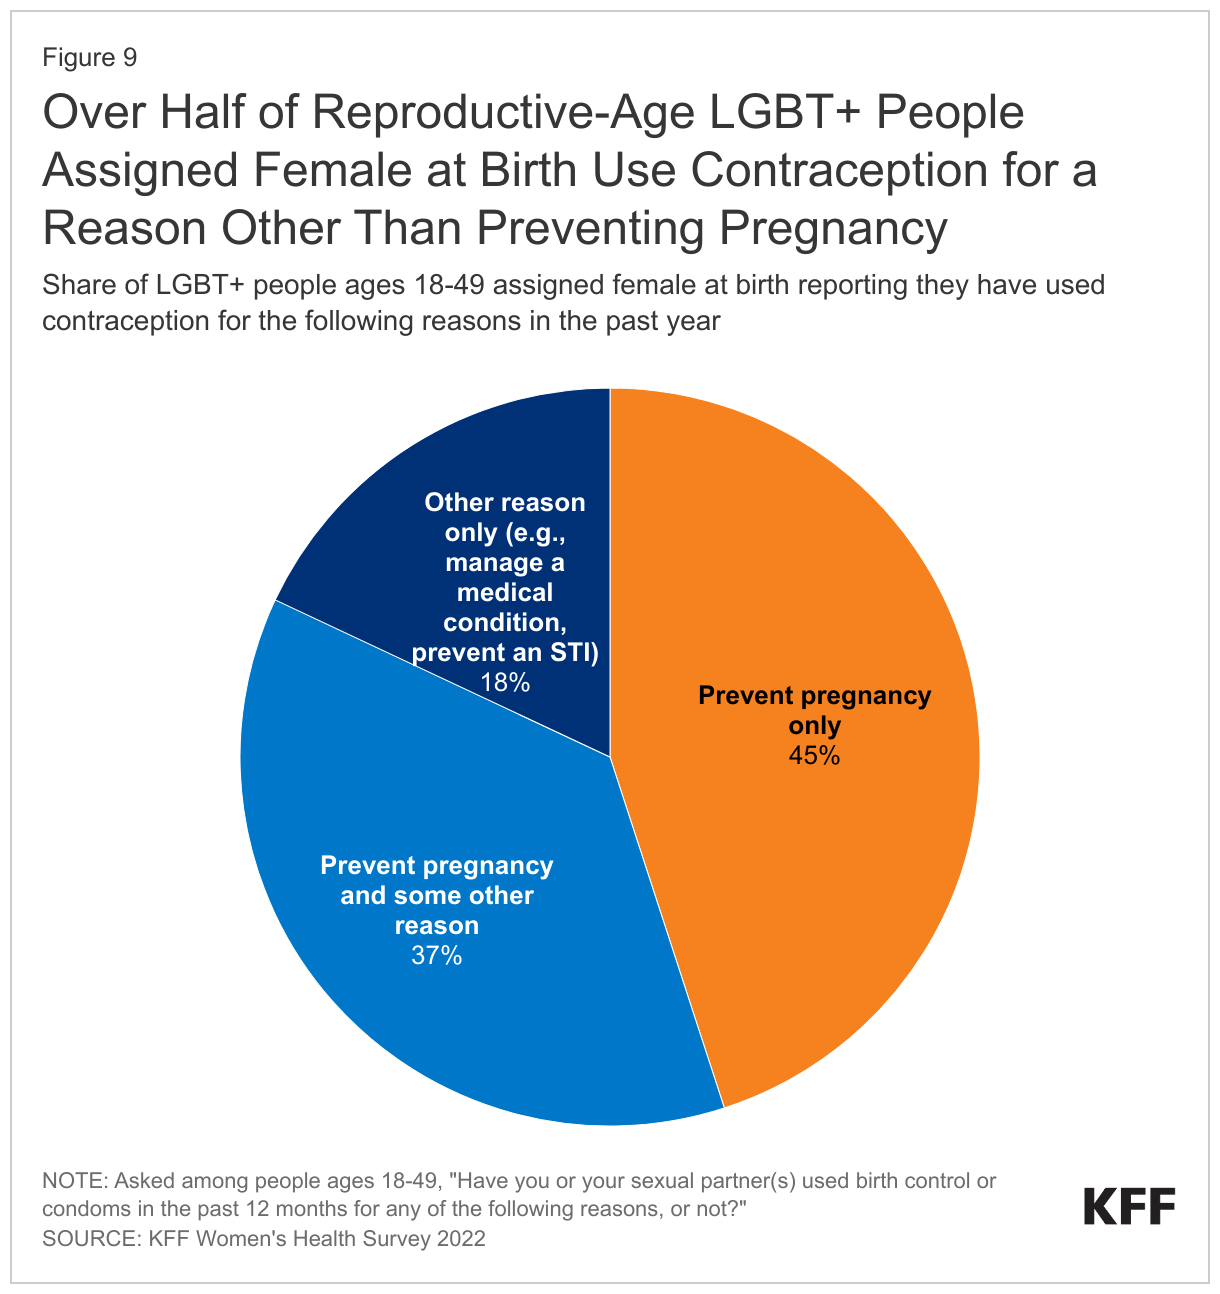
The majority (70%) of LGBT+ people assigned female at birth5  have used contraception in their lifetime, compared to 77% of their non-LGBT+ counterparts, and most used more than one type of contraception across their lifetime (70%). Three in four (75%) sexually active reproductive-age (18-49) LGBT+ people assigned female at birth who were not pregnant reported using contraception in the past year. The share of LGBT+ people using contraceptives is largely driven by bisexual women.

  • Over half (55%) of LGBT+ reproductive-age people assigned female at birth who used contraception in the past year did so for a reason other than preventing pregnancy compared to 35% of their non-LGBT+ counterparts. This share includes the nearly one in five (18%) LGBT+ people who used contraception solely for a reason other than preventing pregnancy, like managing a medical condition or preventing an STI (Figure 9).
Over Half of Reproductive-Age LGBT+ People Assigned Female at Birth Use Contraception for a Reason Other Than Preventing Pregnancy

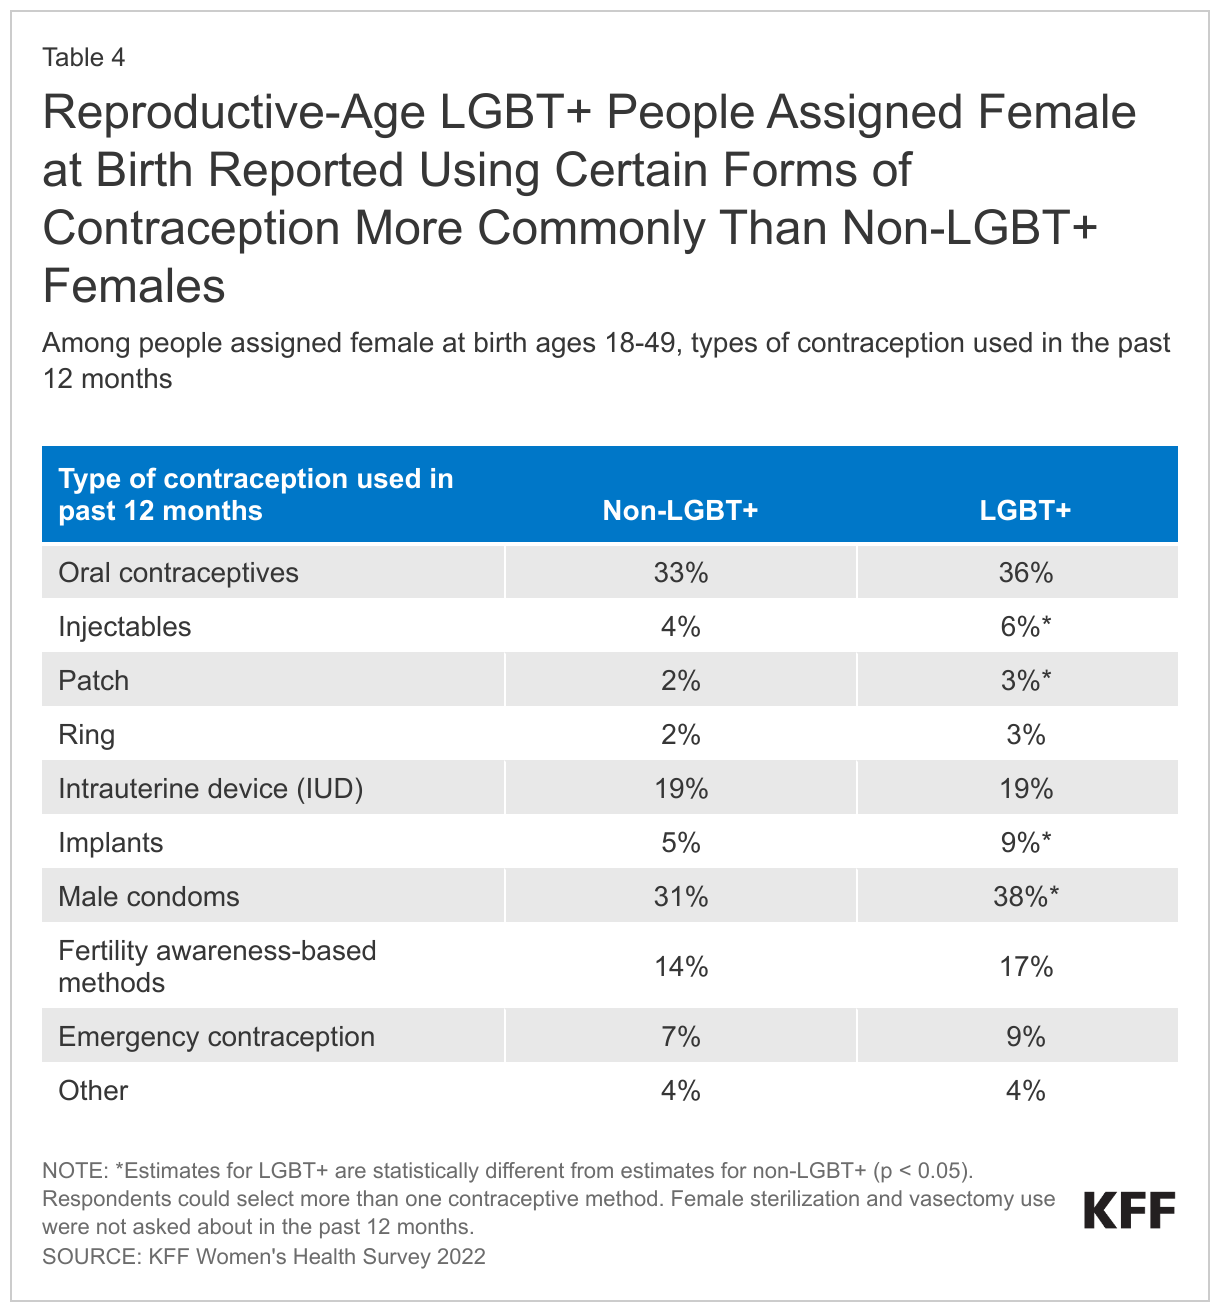
The share of LGBT+ reproductive-age people assigned female at birth had similar contraceptive method use patterns to non-LGBT+ females (Table 4).

  • However, larger shares of LGBT+ people said they used injectable contraception, contraceptive patches, contraceptive implants, and male condoms compared to non-LGBT+ females.
Reproductive-Age LGBT+ People Assigned Female at Birth Reported Using Certain Forms of Contraception More Commonly Than Non-LGBT+ Females

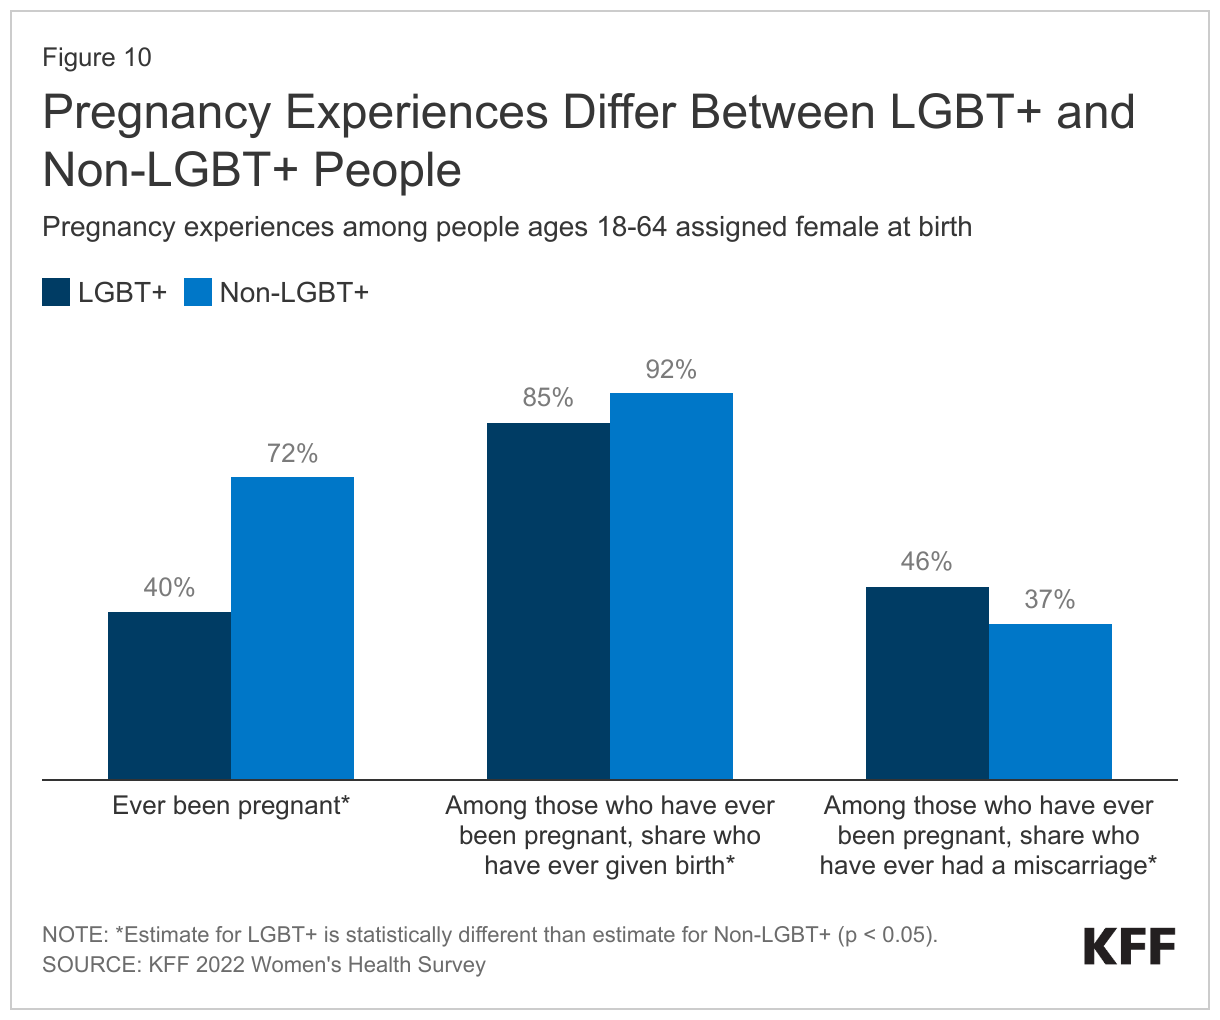
Across the lifespan, four in ten LGBT+ people ages 18-64 assigned female at birth have ever been pregnant compared to seven in ten non-LGBT+ females (Figure 10).

  • Lower shares of LGBT+ people said their pregnancies resulted in a birth, while higher shares said they have experienced a miscarriage compared to their non-LGBT+ counterparts.
Pregnancy Experiences Differ Between LGBT+ and Non-LGBT+ People

Mental Health

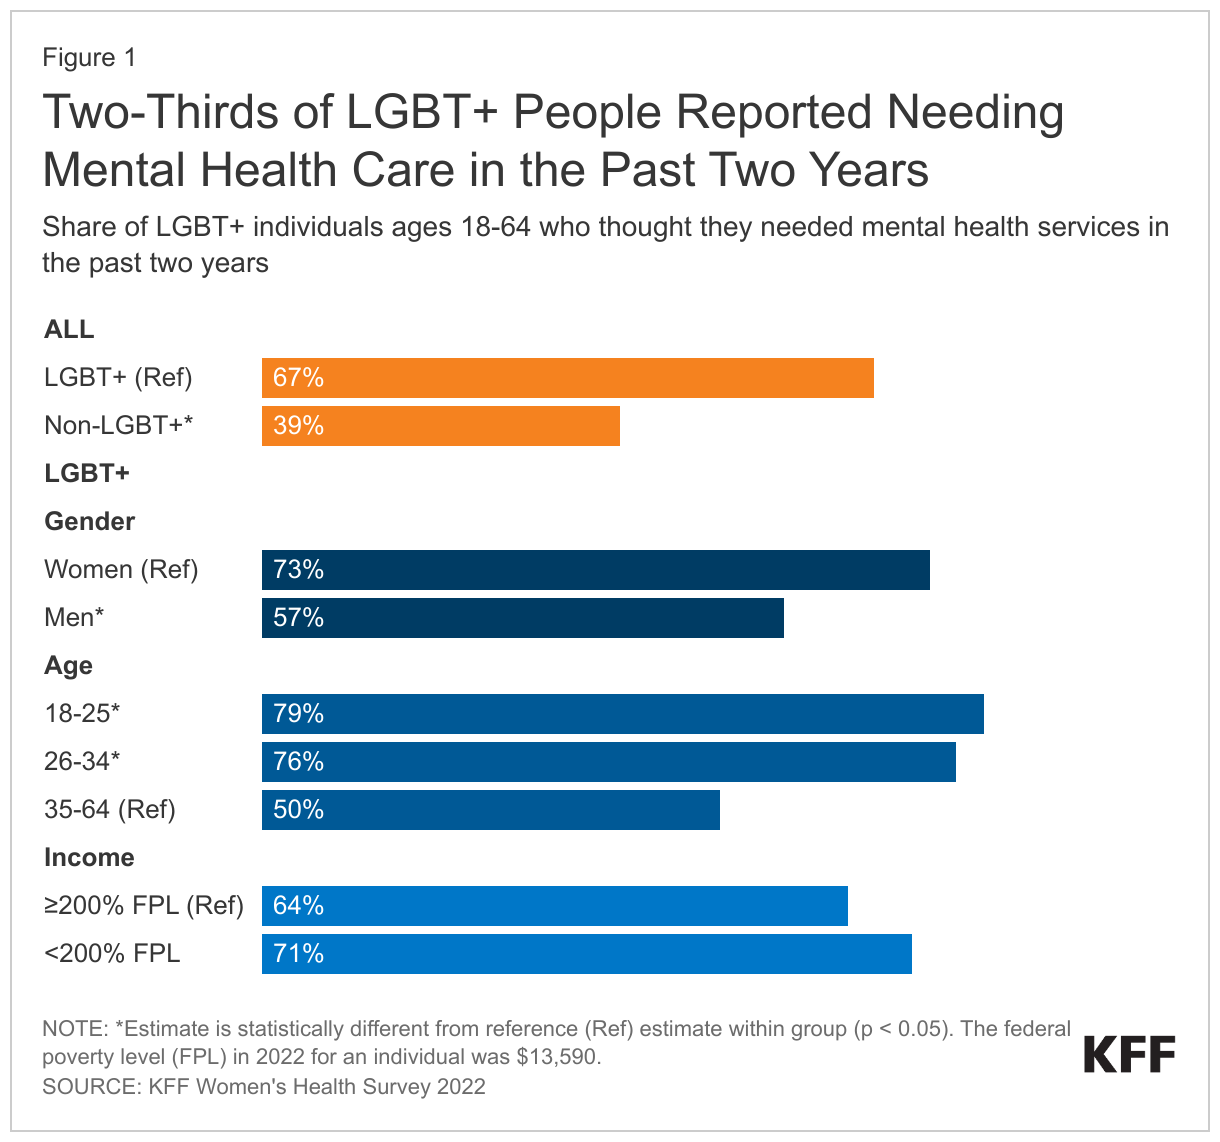
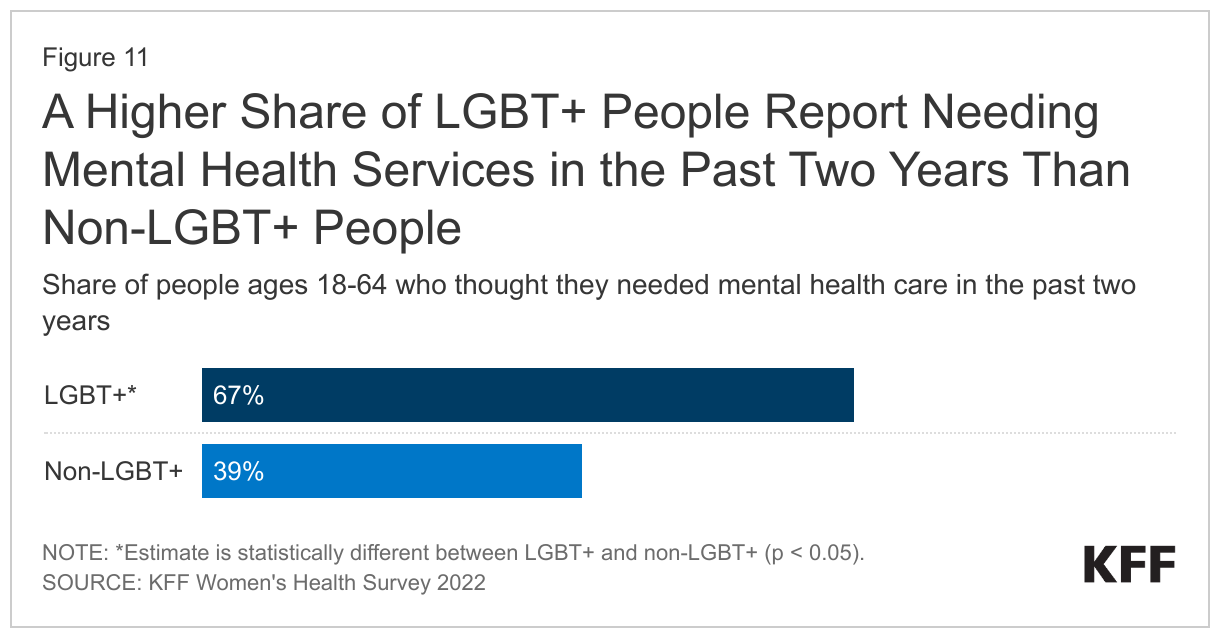
Two-thirds (67%) of LGBT+ people reported needing a mental health service over the past two years, compared to four in ten (39%) non-LGBT+ people (Figure 11). Surveys regularly find that LGBT+ people are more likely than non-LGBT+ people to experience mental health conditions such as depression and anxiety, which can result from ongoing experiences of discrimination, stigma, and violence.

  • Among LGBT+ people, self-reported need for mental health care was higher for those who were younger (ages 18-34) compared to those ages 35-64 and for those with Medicaid compared to those with private insurance (data not shown in figure but available in Mental Health Care Needs and Experiences Among LGBT+ People).
A Higher Share of LGBT+ People Report Needing Mental Health Services in the Past Two Years Than Non-LGBT+ People

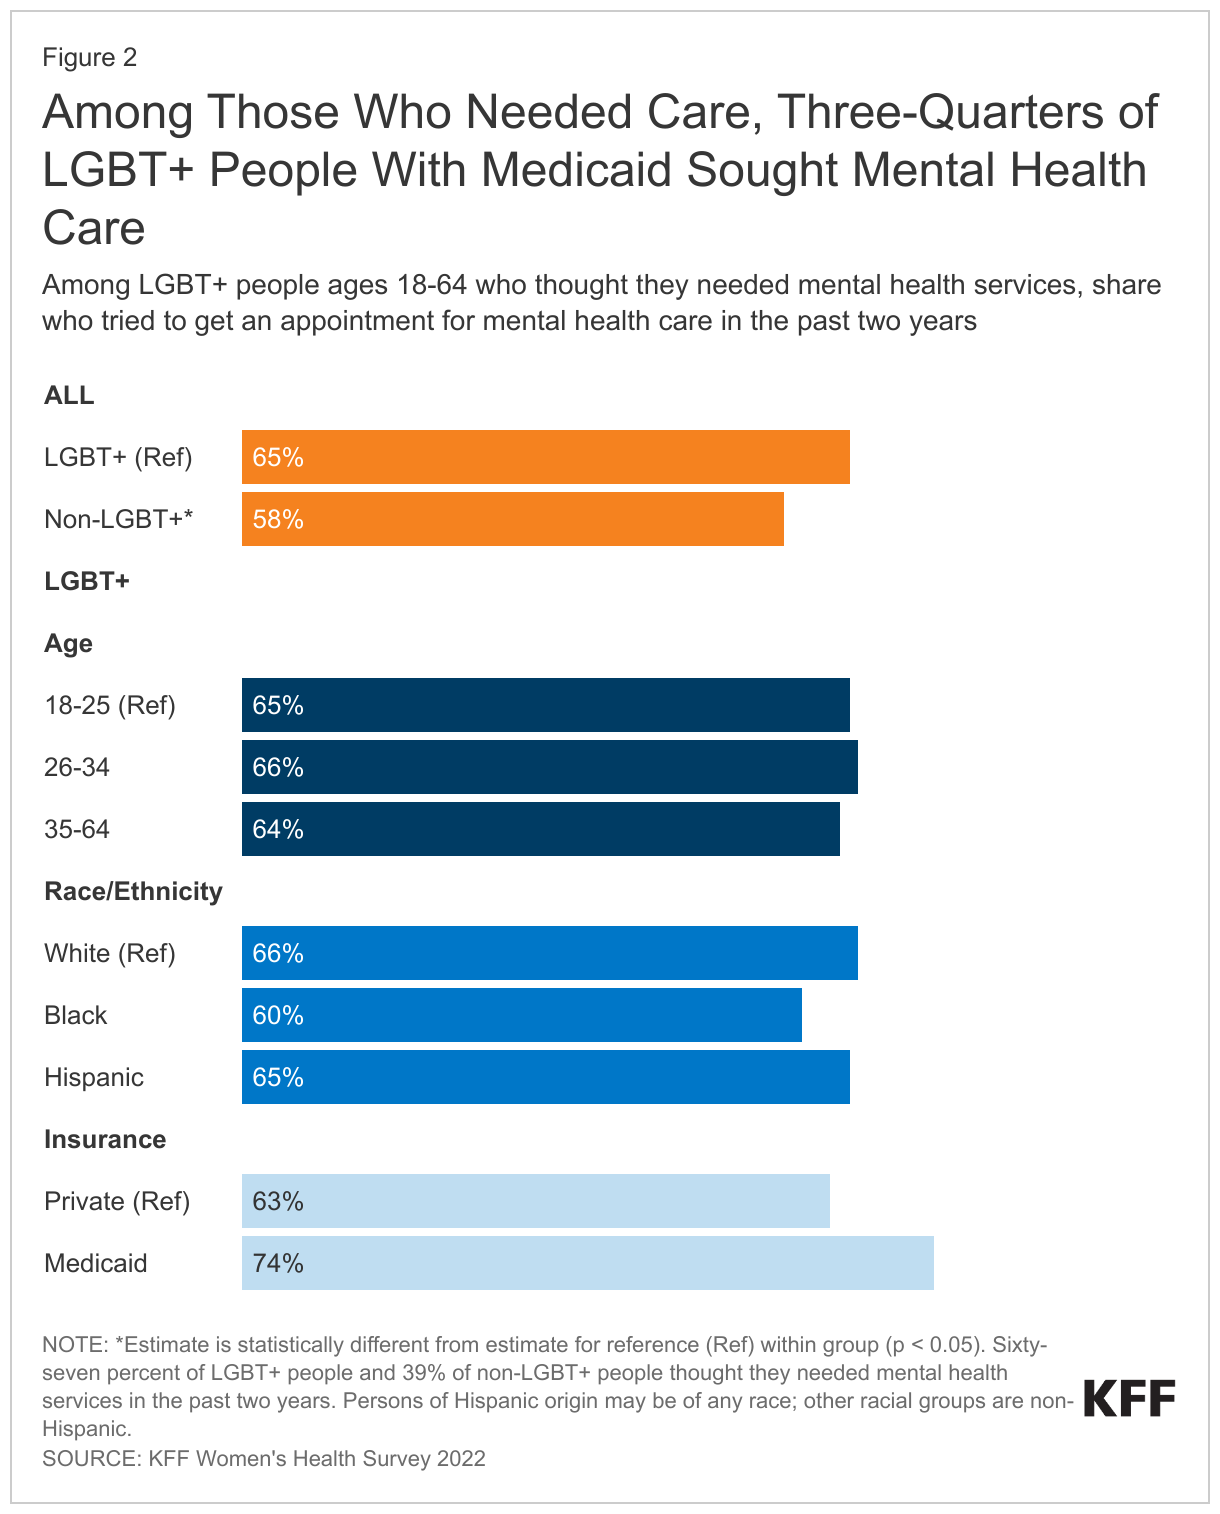
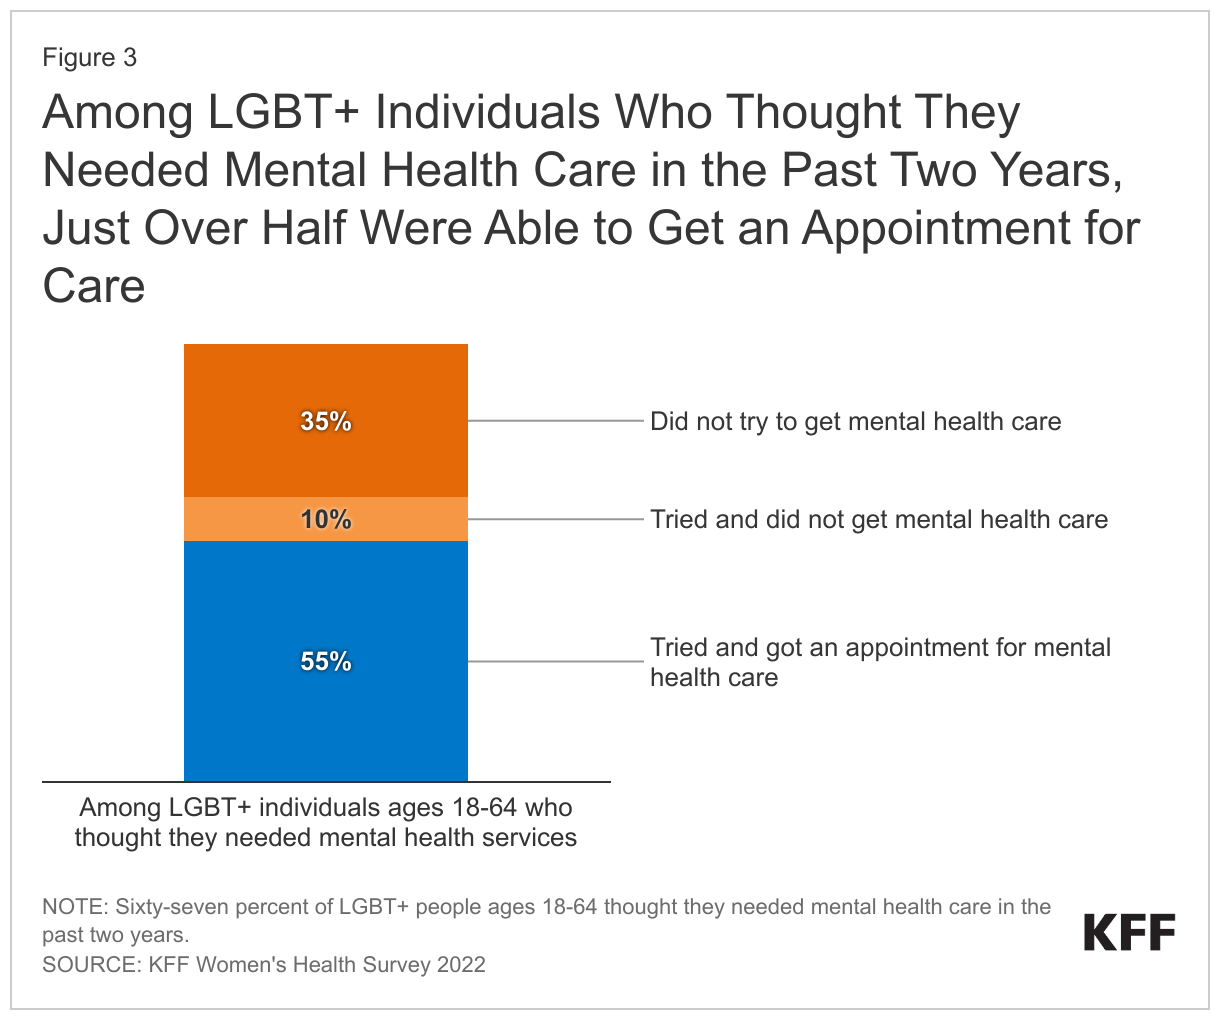
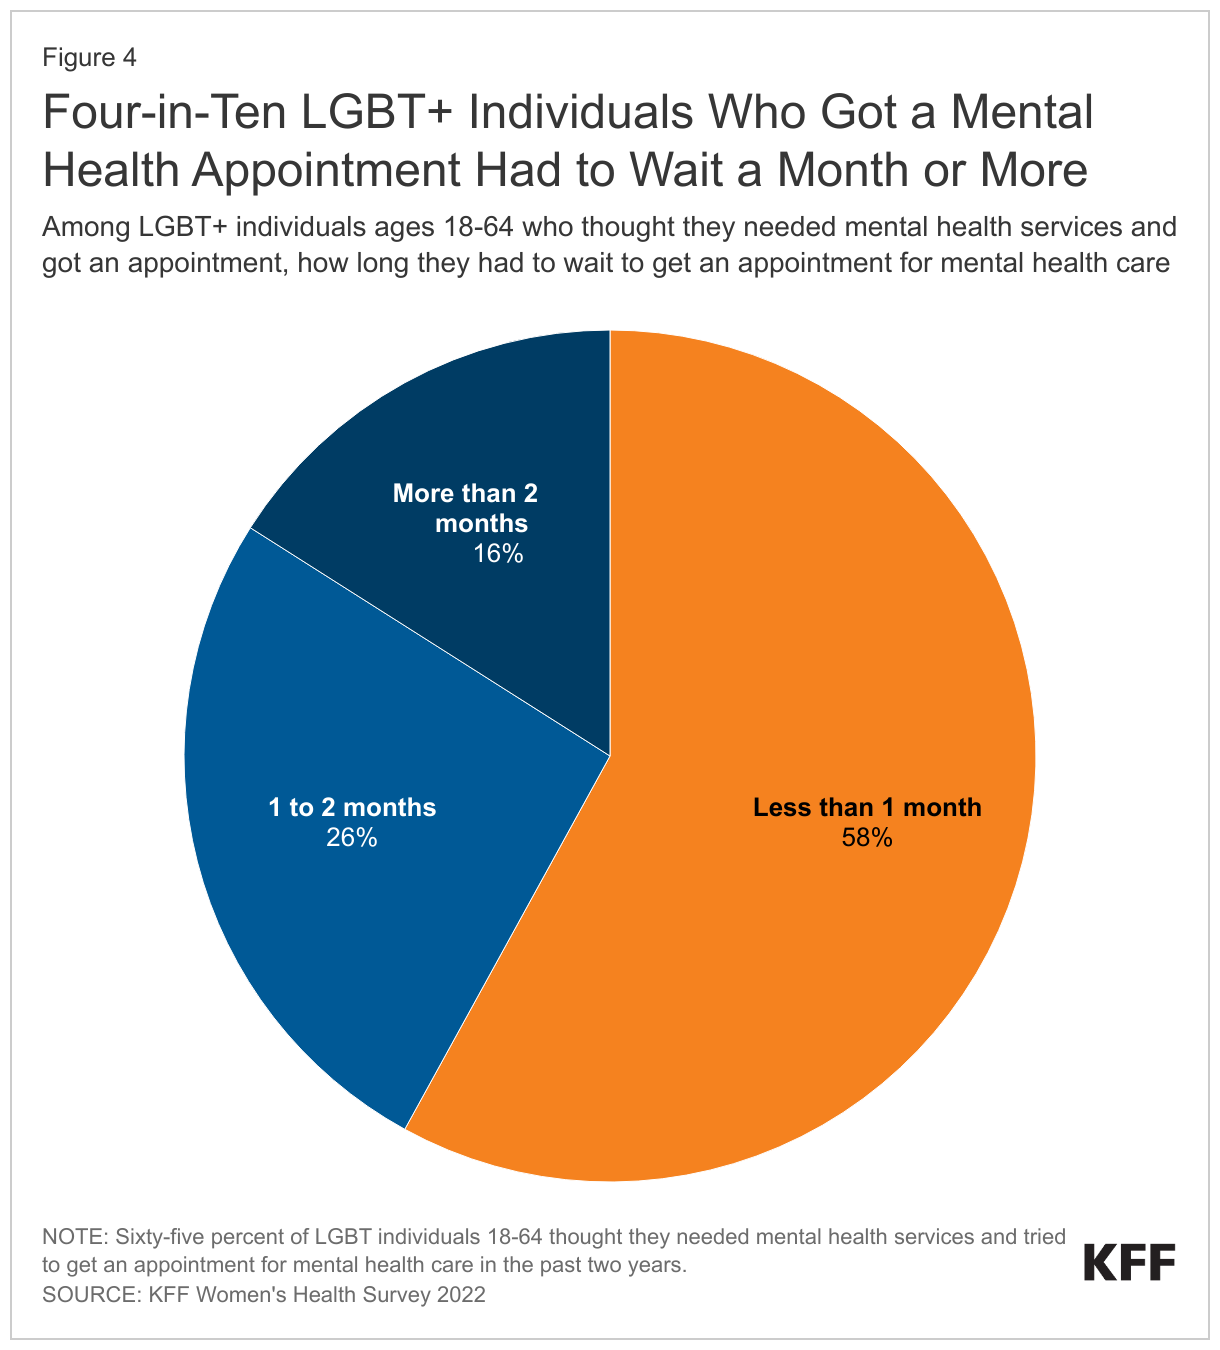
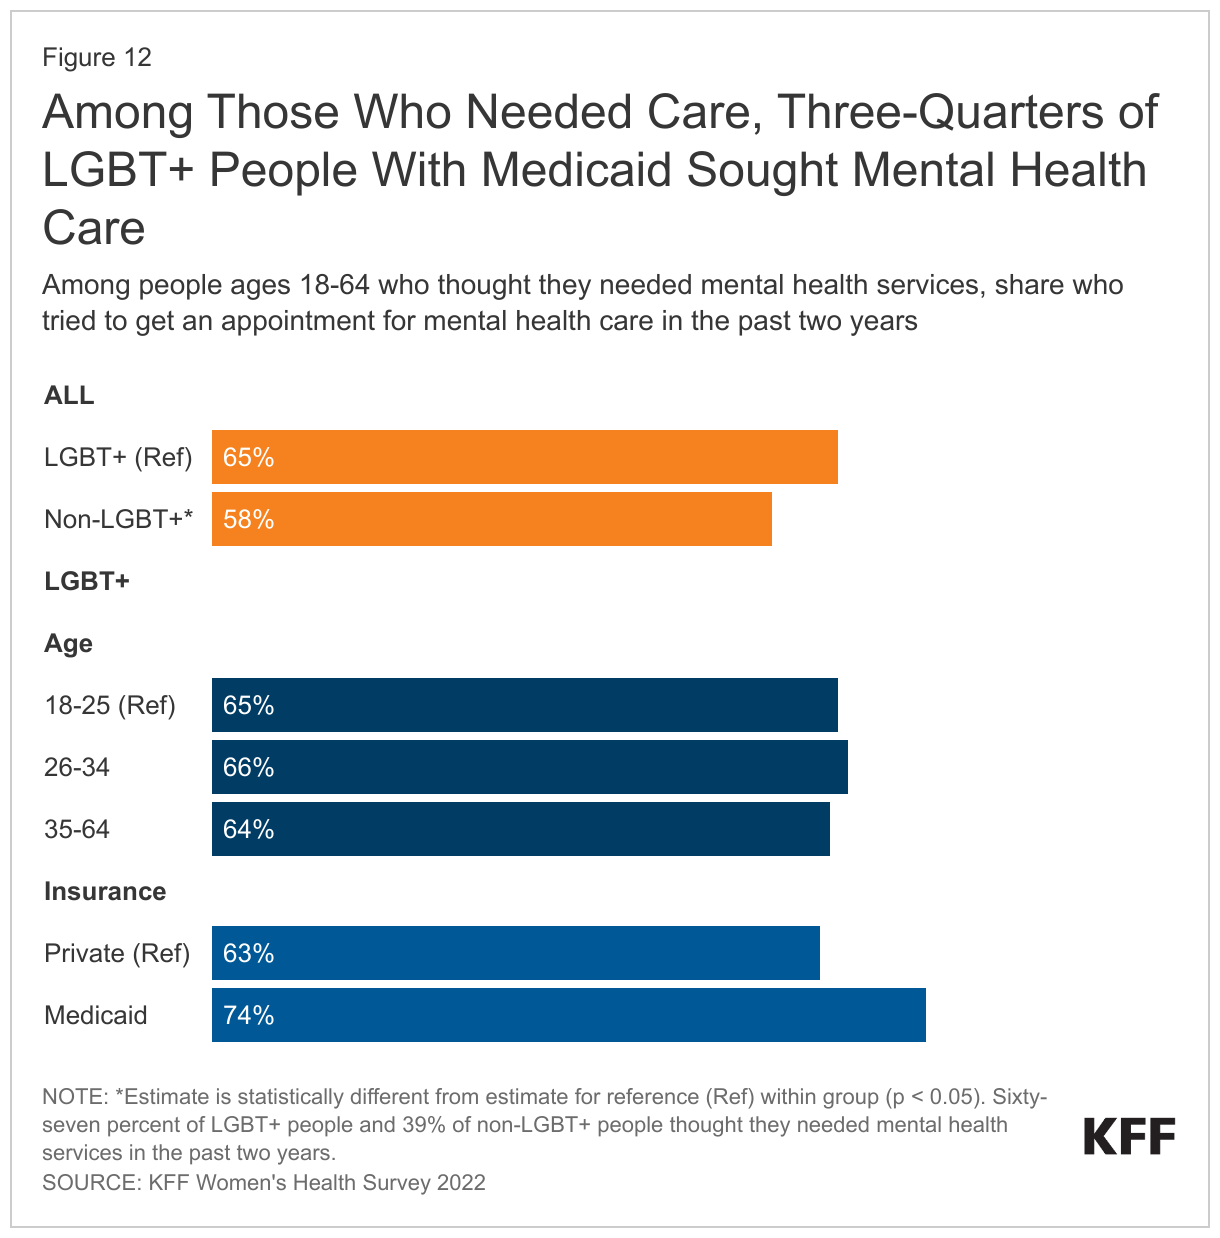
While the reported need for mental health services was high among LGBT+ people, not all of those with a need for services sought or received them.

  • Sixty-five percent (65%) of LGBT+ people who reported needing a mental health service sought one, a higher share than among non-LGBT+ people (58%), but more than one-third (35%) did not (Figure 12).
Among Those Who Needed Care, Three-Quarters of LGBT+ People With Medicaid Sought Mental Health Care

For additional detail on mental health and LGBT+ people see our companion issue brief on this topic, Mental Health Care Needs and Experiences Among LGBT+ People.

Provider Interactions

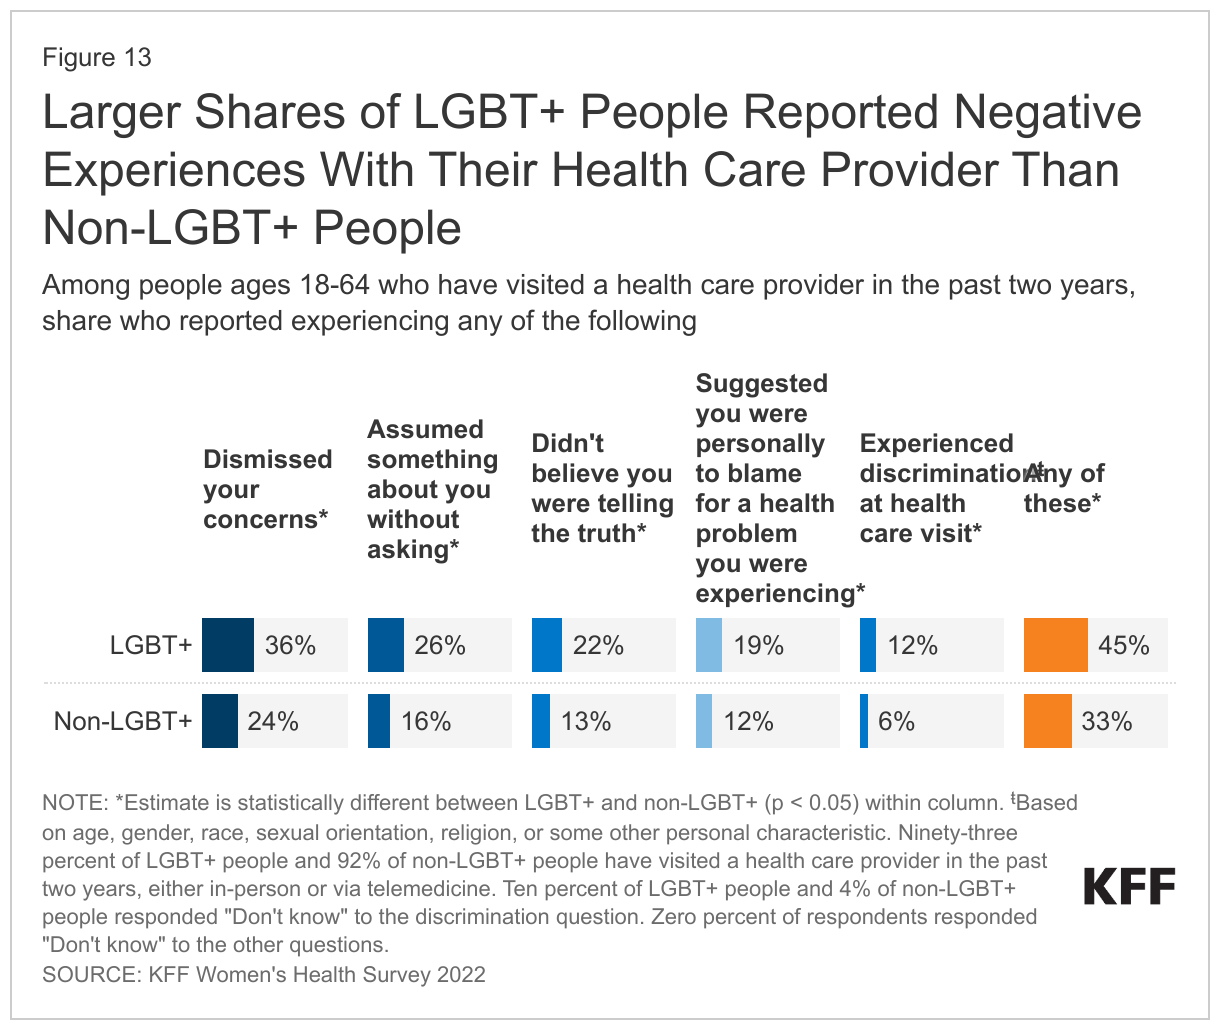
LGBT+ people were more likely to report a range of negative provider experiences in the past two years compared to non-LGBT+ people. This may limit their willingness to seek care, which could be especially problematic for this group which has higher rates of certain health conditions compared to non-LGBT+ people. Negative interactions included having a provider not believe they were telling the truth, suggesting they were personally to blame for a health problem, assuming something about them without asking, or dismissing their concerns. LGBT+ people were more likely to report experiencing discrimination based on their age, gender, race, sexual orientation, religion, or some other personal characteristic during a health care visit (Figure 13).

  • Altogether, nearly half (45%) of LGBT+ people who had visited a health care provider in the past two years reported at least one of these negative experiences with a provider or during a health care visit, compared to one-third (33%) of non-LGBT+ people. LGBT+ people were twice as likely as non-LGBT+ people to report that they had been discriminated against during a health care visit over the past two years (12% v. 6%).
Larger Shares of LGBT+ People Reported Negative Experiences With Their Health Care Provider Than Non-LGBT+ People

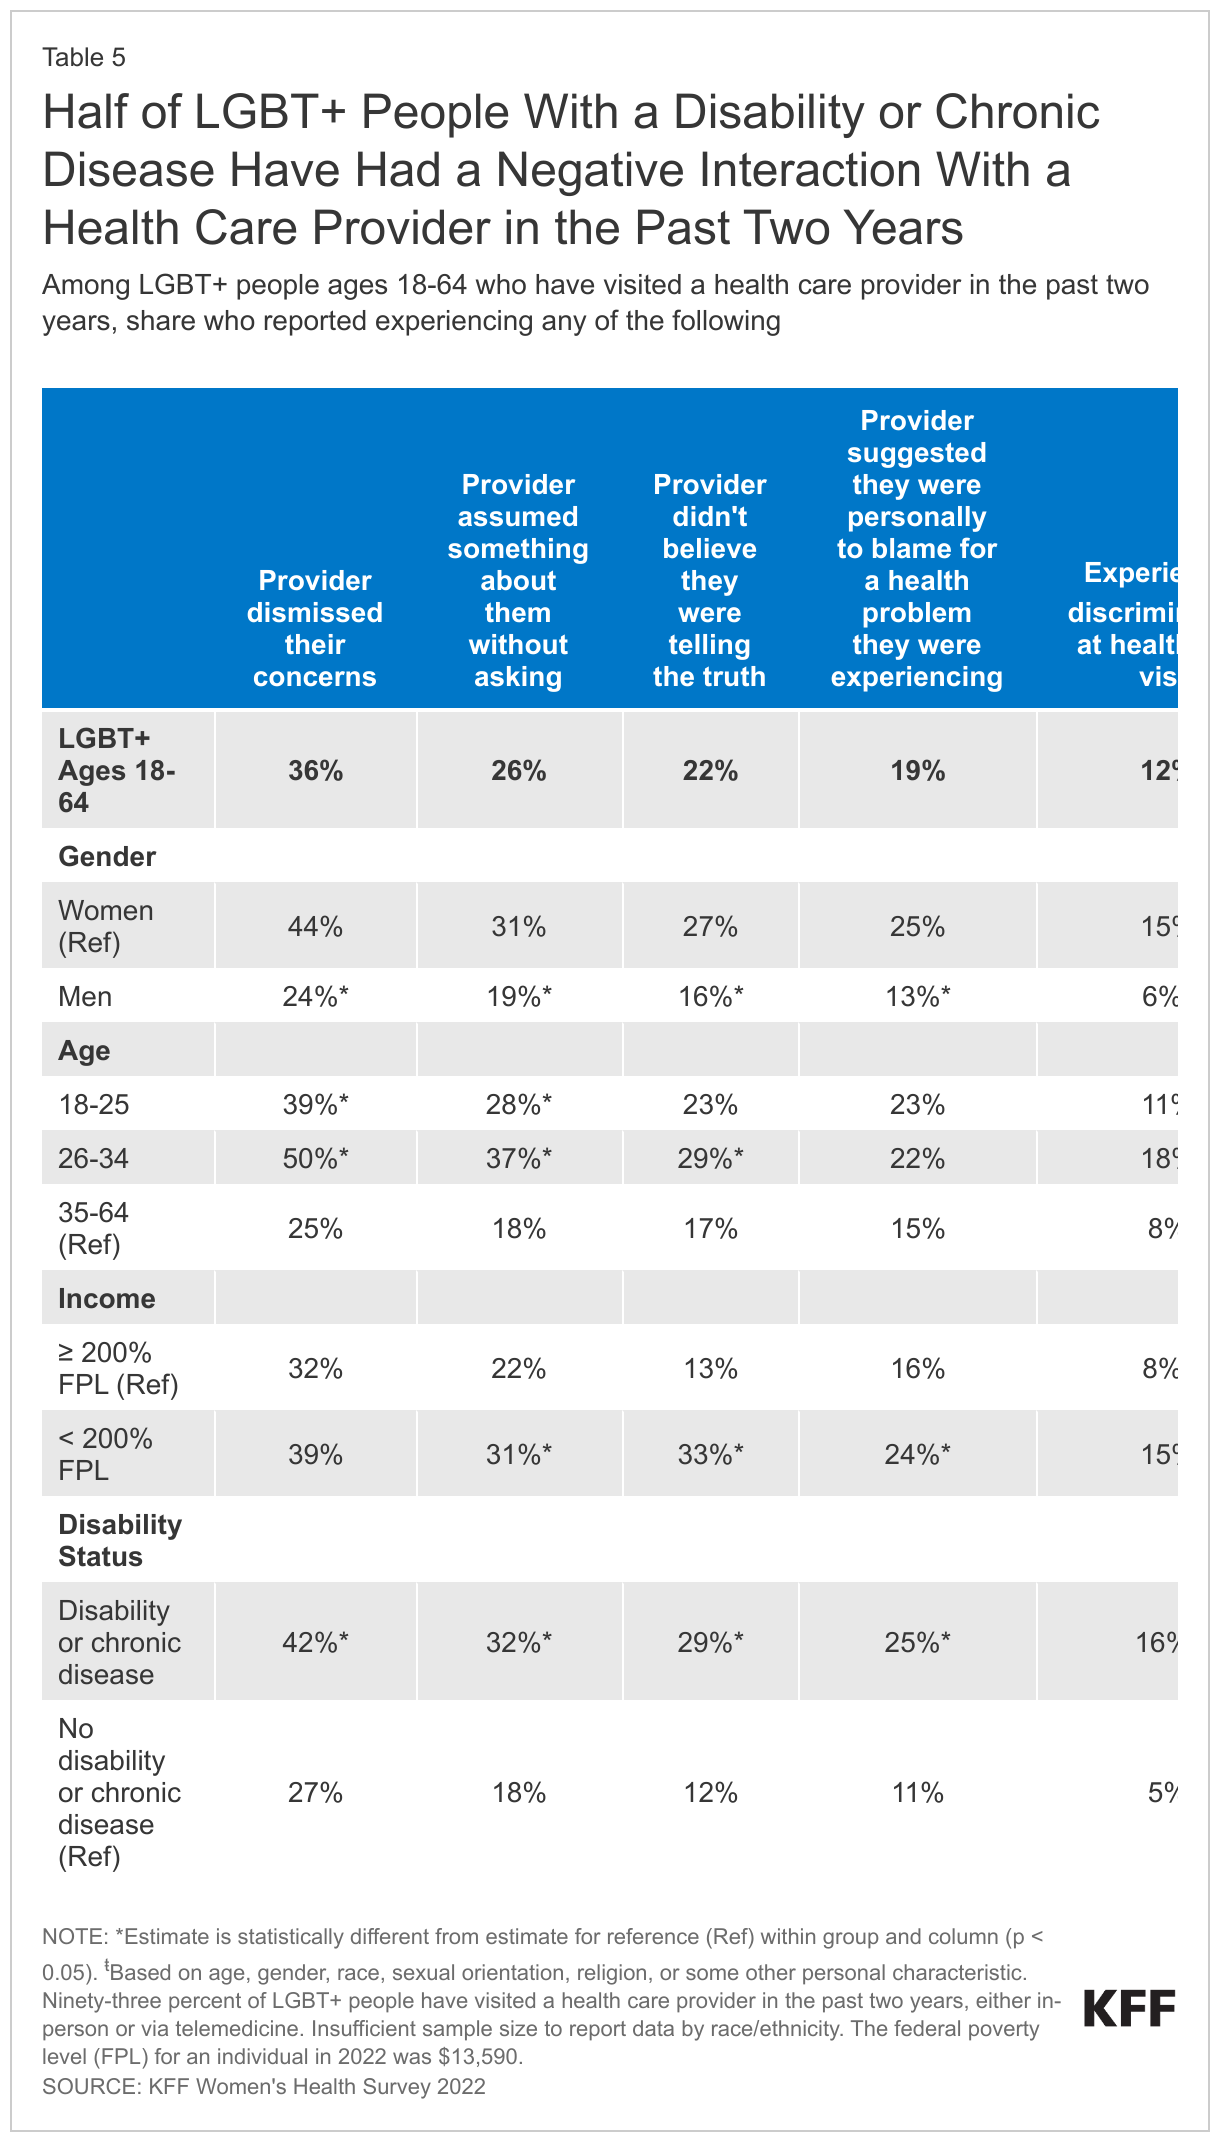
Among LGBT+ people, these negative provider experiences were more commonly reported by women, younger groups, those with low incomes, and those with a disability or chronic disease. Large shares, in most cases more than half, of LGBT+ people in these groups reported having at least one of these negative provider experiences in the past two years (Table 5).

Half of LGBT+ People With a Disability or Chronic Disease Have Had a Negative Interaction With a Health Care Provider in the Past Two Years

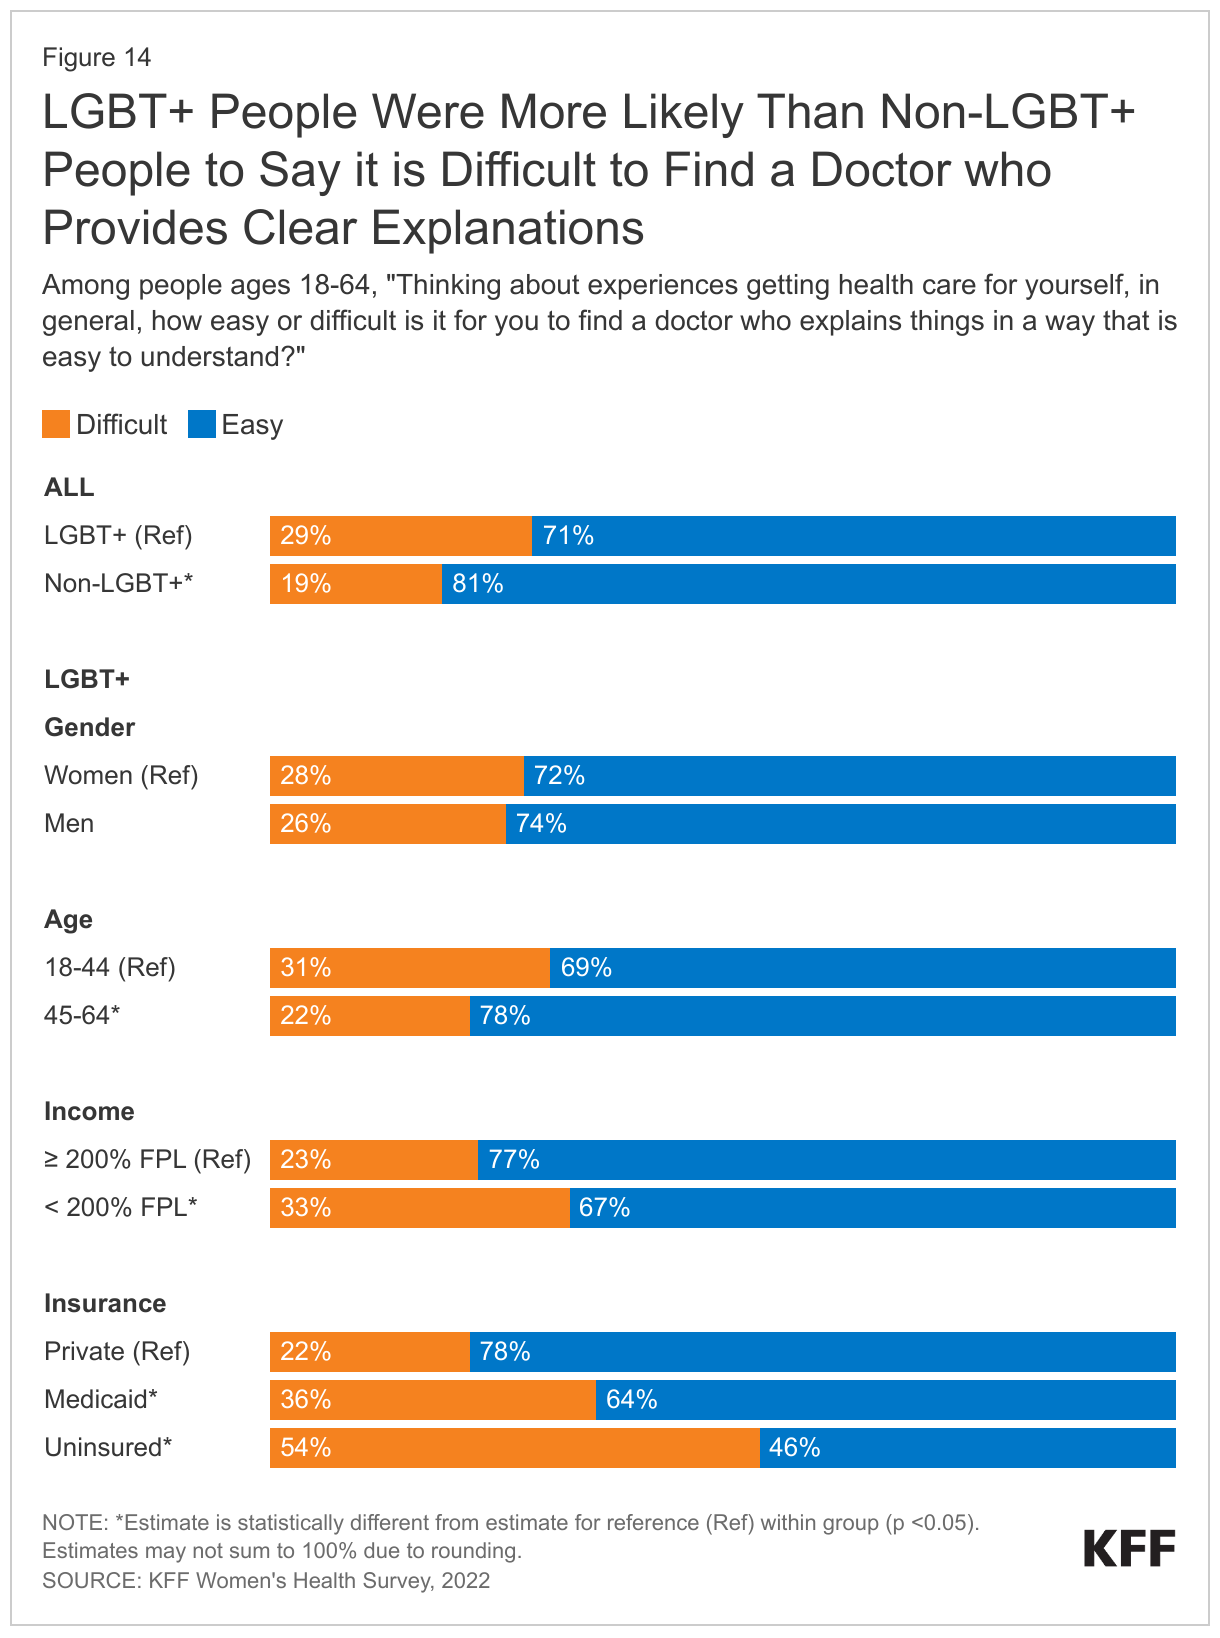
Communication is an important component of health care quality but three in ten (29%) LGBT+ people said it is difficult to find a doctor who explains things in a way that is easy to understand, higher than the share of non-LGBT+ people (19%) (Figure 14).

  • LGBT+ people who were younger, low-income, and had Medicaid coverage or were uninsured had more difficulty finding a doctor who provides clear explanations than those who were older, higher income, or had private insurance.
LGBT+ People Were More Likely Than Non-LGBT+ People to Say it is Difficult to Find a Doctor who Provides Clear Explanations

Health Care Costs

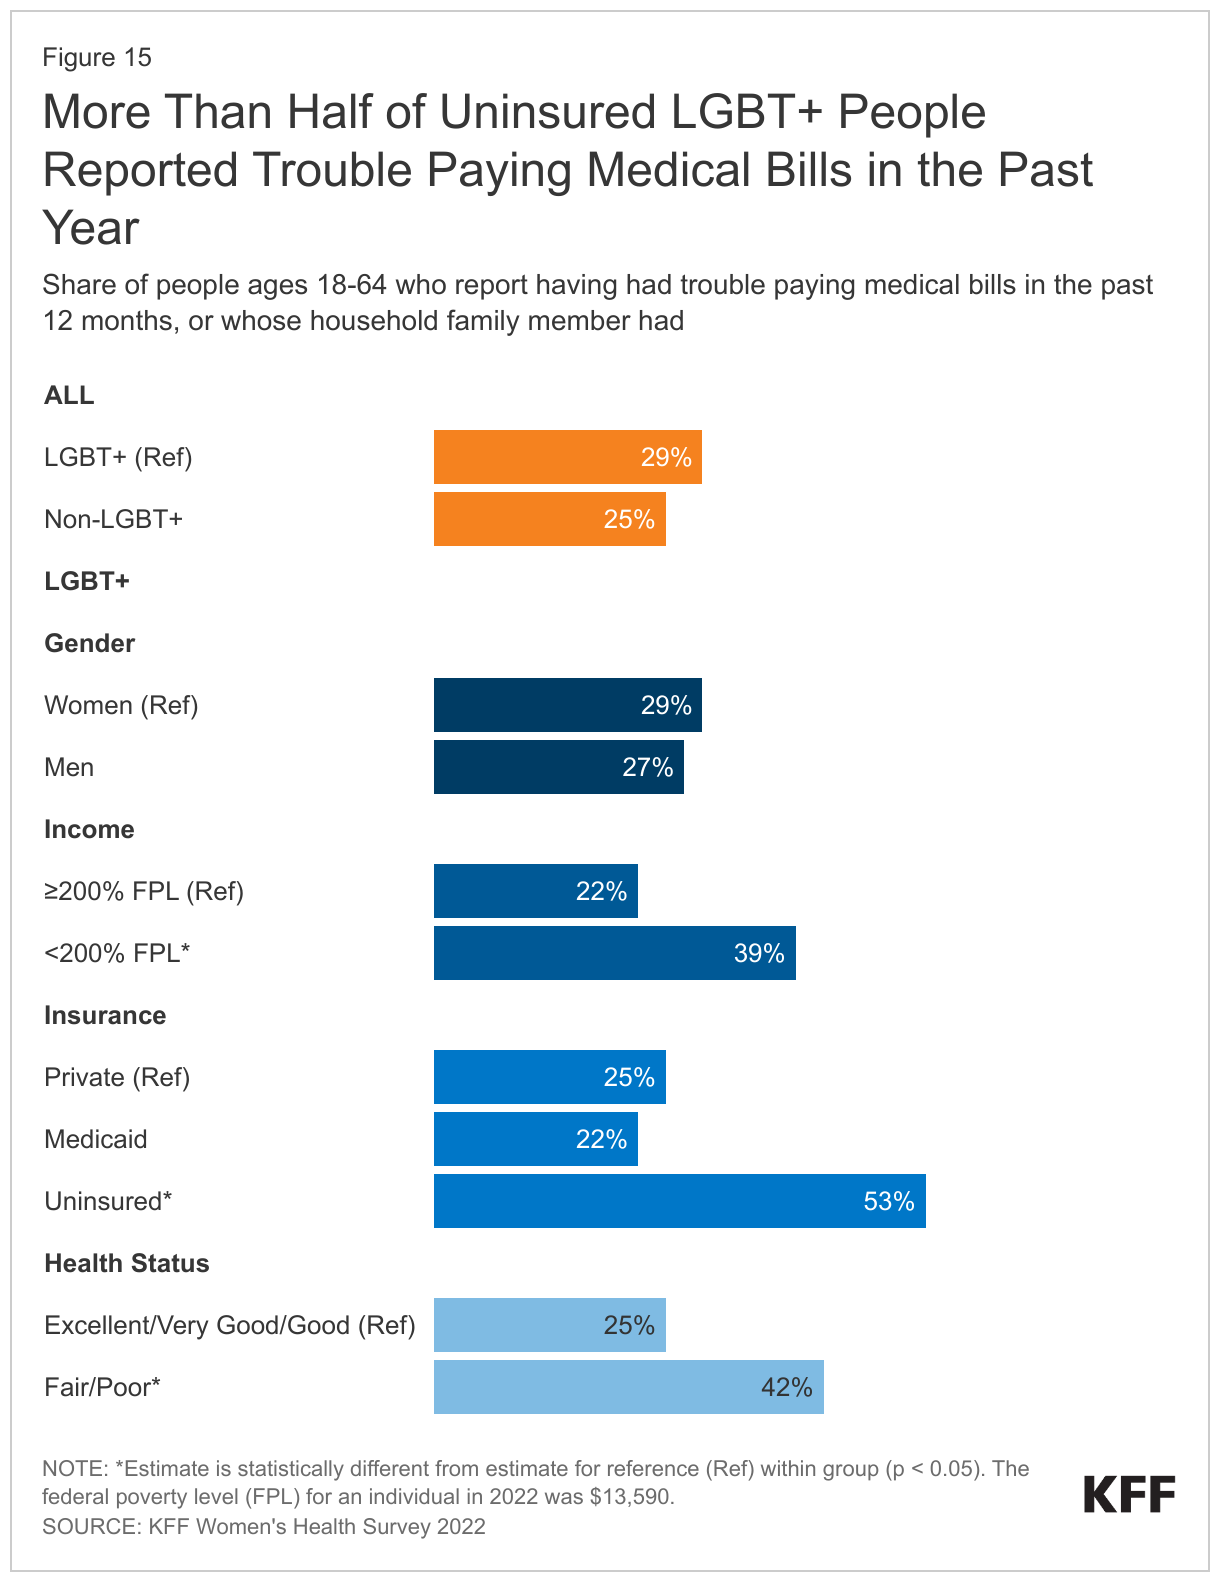
LGBT+ people reported having problems with health care costs at similar rates as non-LGBT+ people, with nearly one-third (29%) of LGBT+ people and one-quarter (25%) of non-LGBT+ people reporting they or a household member had problems paying medical bills in the past 12 months (Figure 15). Given that LGBT+ people tend to be younger, have lower incomes, and have greater health needs, costs could be an outsized barrier to care for this group.

  • Among LGBT+ people, this challenge was especially acute for those who reported being in fair or poor health, with 42% saying they have had problems paying medical bills.
  • Not surprisingly, those with low incomes, the uninsured, and those in fair or poor health reported these challenges at higher rates than their counterparts but there were no statistically significant differences by gender.
More Than Half of Uninsured LGBT+ People Reported Trouble Paying Medical Bills in the Past Year

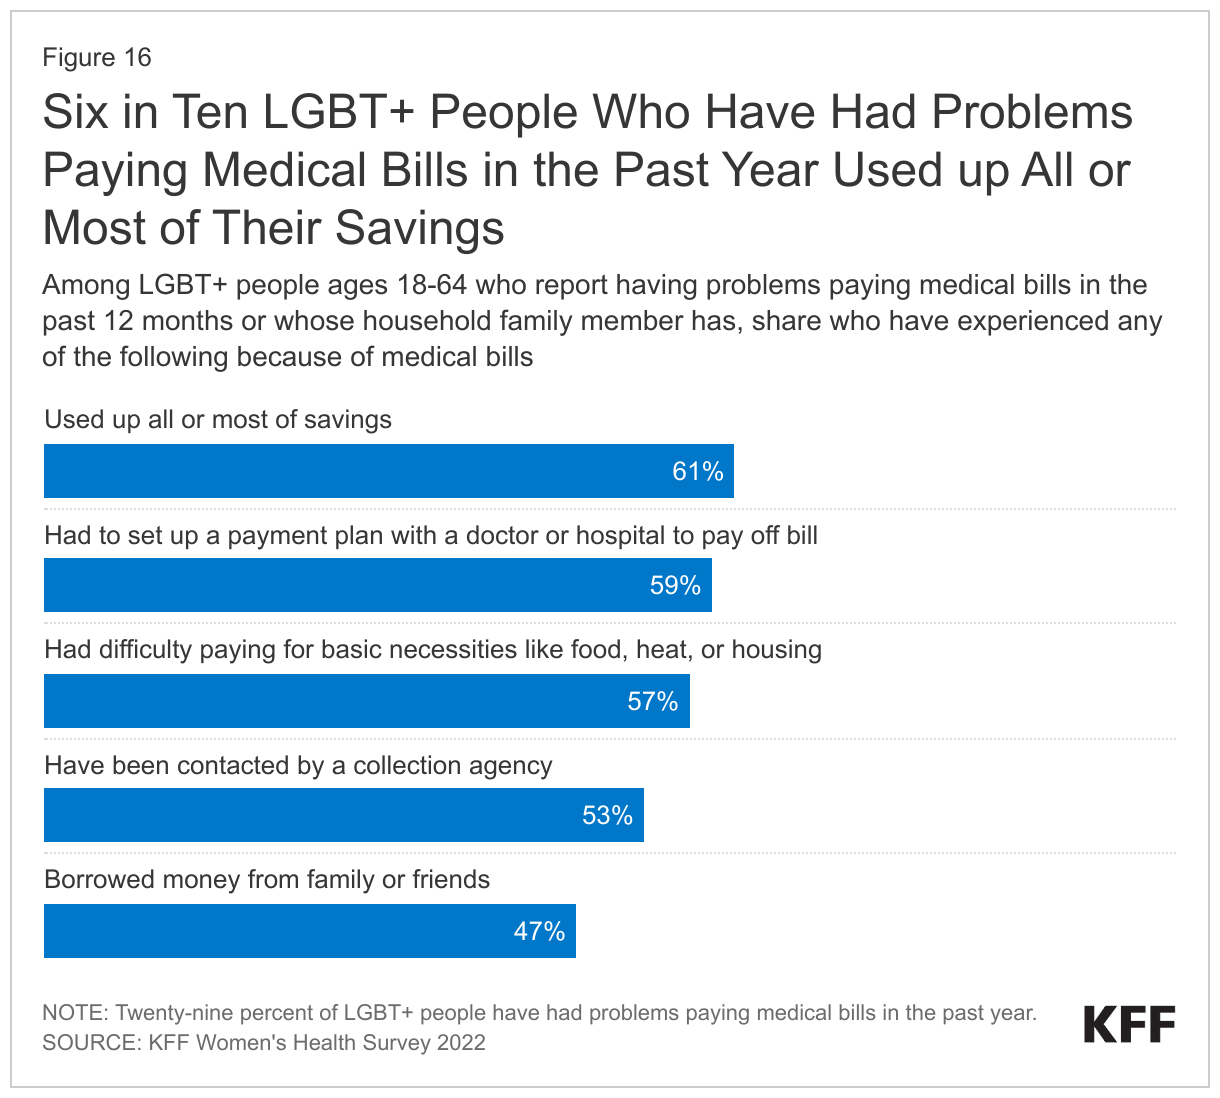
Medical bills have consequences on LGBT+ people’s financial well-being, including their ability to afford basic necessities.

  • Among the 29% LGBT+ people who reported having trouble paying medical bills in the past 12 months, six in ten (61%) said they used up all or most of their savings (Figure 16). About the same share said they had to set up a payment plan with a doctor or hospital (59%) or had difficulty paying for basic necessities (57%), and over half (53%) said they have been contacted by a collection agency, while 47% said they borrowed money from family or friends as a result of these bills. Non-LGBT+ people experience these consequences at similar rates.
Six in Ten LGBT+ People Who Have Had Problems Paying Medical Bills in the Past Year Used up All or Most of Their Savings

Conclusion

While in many cases LGBT+ people have similar health and health care experiences to non-LGBT+ people, we find some notable differences. For example, LGBT+ people’s self-reported health status was poorer than non-LGBT+ people, despite being a younger population. They also reported wider prescription usage, and younger LGBT+ people reported higher rates of disability than younger non-LGBT+ people. Additionally, LGBT+ people reported a higher need for mental health services, which could relate to ongoing experiences of stigma and discrimination. Indeed, LGBT+ people reported higher rates of discrimination during a health care visit and were more likely to report a range of recent negative provider experiences, most commonly among LGBT+ women, those who were younger, had low incomes, and reported a disability or chronic disease. These experiences suggest a gap in clinical attention and/or competency for reaching LGBT+ people, especially those with intersecting marginalized identities.

More broadly, while data collection on LGBT+ people is improving, particularly at the federal level, it is still not standard, and as such, knowledge gaps remain, including with respect to health status, health needs, and health care access. Lack of research in this area limits the ability of those in both policy and health care sectors to address health needs and disparities within the LGBT+ population. As efforts aimed at limiting LGBT+ people’s access to social institutions, including health care, increase, continuing to monitor the community’s well-being and responding to discrimination and health challenges is especially timely.

Methods

Methods

Data for this issue brief come from the 2022 KFF Women’s Health Survey, a nationally representative survey of 6,442 people of all genders ages 18 to 64, including 958 LGBT+ people, conducted from May 10, 2022, to June 7, 2022. The objective of the survey is to help better understand respondents’ experiences with contraception, potential barriers to health care access, and other issues related to reproductive health. The survey was designed and analyzed by researchers at KFF (Kaiser Family Foundation) and fielded online and by telephone by SSRS using its Opinion Panel, supplemented with sample from IPSOS’s KnowledgePanel.

The survey asked respondents which sex they were assigned at birth, on their original birth certificate (male or female). They were then asked what their current gender is (man, woman, transgender, non-binary, or other). Those who identified as transgender men are coded as men and transgender women are coded as women. While we attempted to be as inclusive as possible and recognize the importance of better understanding the health of non-cisgendered people, as is common in many nationally representative surveys, we did not have a sufficient sample size (n >= 100) to report gender breakouts other than men and women with confidence that they reflect the larger non-cisgender population as a whole. The data in our reproductive health analyses use the respondent’s sex assigned at birth (inclusive of all genders) to account for reproductive health needs/capacity (e.g., ever been pregnant) while other analyses use the respondent’s gender (inclusive of males and females).

For this survey, LGBT+ people include those who identified their sexual orientation as lesbian, gay, bisexual, or “something else,” and those who identified their gender as transgender, non-binary, “other,” or whose reported gender does not correspond to their reported sex assigned at birth.

Sample design

The majority of respondents completed the survey using the SSRS Opinion Panel (n=5,202), a nationally representative probability-based panel where panel members are recruited in one of two ways: (1) through invitations mailed to respondents randomly sampled from an Address-Based Sample (ABS) provided by Marketing Systems Group through the U.S. Postal Service’s Computerized Delivery Sequence. (2) from a dual-framed random digit dial (RDD) sample provided by Marketing Systems Group.

In order to have large enough sample sizes for certain subgroups (females ages 18 to 35, particularly females in the following subgroups: lesbian/gay/bisexual; Asian; Black; Hispanic; Medicaid enrollees; low-income; and rural), an additional 1,240 surveys were conducted using the IPSOS KnowledgePanel, a nationally representative probability-based panel recruited using a stratified ABS design. (Note that due to small sample sizes, data for LGBT+ people who are Asian or Pacific Islanders are not presented in this report.)

Data collection

The majority of surveys completed using the SSRS Opinion Panel (n=5,056) and all of the surveys completed using the KnowledgePanel (n=1,240) were self-administered web surveys. Panelists were emailed an invitation, which included a unique passcode-embedded link, to complete the survey online. In appreciation for their participation, panelists received a modest incentive in the form of a $5 or $10 electronic gift card. In addition to the self-administered web survey, n=146 surveys were completed by telephone with SSRS Opinion Panelists who are web reluctant.

Weighting

The data are weighted to represent U.S. adults ages 18 to 64. The data include oversamples of females ages 18 to 35 and females ages 36 to 64. Due to this oversampling, the data were classified into three subgroups: females 18 to 35, females 36 to 64, and males 18 to 64. The weighting consisted of two stages: 1) application of base weights and 2) calibration to population parameters. Each subgroup was calibrated separately, then the groups were put into their proper proportions relative to their size in the population.

Calibration to Population Benchmarks

The total sample for the Women’s Health Survey was balanced to match estimates of each of the three subgroups (females ages 18 to 35, females ages 36 to 64, and males ages 18 to 64) along the following dimensions: age; education (less than a high school graduate, high school graduate, some college, four-year college or more); region (Northeast, Midwest, South, West); and race/ethnicity (White non-Hispanic, Black non-Hispanic, Hispanic-born in U.S., Hispanic-born Outside the U.S., Asian non-Hispanic, Other non-Hispanic). The sample was weighted within race (White, non-Hispanic; Black, non-Hispanic; Hispanic; and Asian) to match population estimates. Benchmark distributions were derived from 2021 Current Population Survey (CPS) data. Although the LGBT+ sample in this survey is not weighted separately to match population benchmarks, the full sample is. Comparisons to the available demographic data for the LGBT population from the 2021 Behavioral Risk Factor Surveillance System (BRFSS) found the demographics from our sample closely align with the federal data source.

Margin of Sampling Error

The margin of sampling error, including the design effect for subgroups, is presented in Table 1 below. It is important to remember that the sampling fluctuations captured in the margin of error are only one possible source of error in a survey estimate and there may be other unmeasured error in this or any other survey.

The KFF Women’s Health Survey sample includes people of all genders; however, our sample design is more heavily focused on women. While our survey weights take this gender imbalance into account and we use additional data control measures to ensure the data we present are as reliable and as representative of the population as possible, some data points for certain subgroups with larger margins of error may be more heavily weighted by women than men. Caution should be exercised in interpreting findings among LGBT+ subpopulations due to smaller sample sizes and larger margins of error. Our issue briefs do not present data for subgroups where data limitations precluded us from developing reliable estimates.

Sample Sizes, Design Effects, and Margins of Error, by Demographic Groups
STATISTICAL SIGNIFICANCE

All statistical tests are performed at the .05 confidence level. Statistical tests for a given subgroup are tested against the reference group (Ref.) unless otherwise indicated. For example, White is the standard reference for race/ethnicity comparisons and private insurance is the standard reference for types of insurance coverage. Some breakouts by subsets have a large standard error, meaning that sometimes even large differences between estimates are not statistically different.

See the full 2022 KFF Women’s Health Survey methodology for more details. The full survey instrument is available upon request.

Endnotes

  1. The LGBT+ sample from the 2022 KFF Womenu2019s Health Survey includes 60% of whom are ages 18-34, which is younger than the non-LGBT+ sample but closely matches the U.S. Census Bureauu2019s Household Pulse survey data. ↩︎
  2. This survey defines low income as household income under 200% of the federal poverty level (FPL); higher income is 200% or more of the FPL. The federal poverty level (FPL) for an individual in 2022 was $13,590. ↩︎
  3. Survey respondents who reported being assigned female at birth were asked if they had either a general check-up or a well-woman visit. All others were asked if they had had a general check-up. ↩︎
  4. Questions related to reproductive capacity (e.g., ever been pregnant) are based on the respondentu2019s sex assigned at birth (inclusive of all genders) while other analyses use the respondentu2019s gender (inclusive of males and females). ↩︎
  5. Questions related to reproductive capacity (e.g., ever been pregnant) are based on the respondentu2019s sex assigned at birth (inclusive of all genders) while other analyses use the respondentu2019s gender (inclusive of males and females). ↩︎
News Release

Medicaid Expansion Has Had Beneficial Effects on Some Sexual and Reproductive Health Outcomes 

Published: Jun 29, 2023

A new KFF review of more than three dozen studies published between April 2021 and June 2023 finds that Medicaid expansion under the Affordable Care Act is associated with beneficial effects on a range of sexual and reproductive health outcomes.

The studies, which echo findings of previous research, find that Medicaid expansion is associated with increased health insurance coverage prior to and after pregnancy, as well as increased access to, and utilization of, both prenatal and postpartum care. Medicaid expansion is also associated with increased use of the most effective contraceptive methods, and improved HIV care and prevention.

In contrast, some studies find no impact of Medicaid expansion on certain pregnancy or postpartum health outcomes or on overall contraception use for certain populations.This research provides context for ongoing debates about whether to expand Medicaid in states that have not done so already. Medicaid is the largest source of public funding for family planning services, which are a mandatory benefit within the program. Medicaid finances four -in-10 births in the U.S., and provides prenatal and postpartum coverage—but coverage options, particularly outside of pregnancy, are more limited in non-expansion states.The new analysis is part of an ongoing effort by KFF to track research findings about the effects of ACA Medicaid expansion.

Related resources:

What Does the Recent Literature Say About Medicaid Expansion?: Economic Impacts on Providers

Building on the Evidence Base: Studies on the Effects of Medicaid Expansion, February 2020 to March 2021

The Effects of Medicaid Expansion under the ACA: Studies from January 2014 to January 2020

What Does the Recent Literature Say About Medicaid Expansion?: Impacts on Sexual and Reproductive Health

Authors: Madeline Guth and Karen Diep
Published: Jun 29, 2023

Issue Brief

A substantial body of research has investigated effects of the Affordable Care Act (ACA) Medicaid expansion, adopted by all but 10 states as of June 2023. Prior KFF reports published in 2020 and 2021 reviewed more than 600 studies and concluded that expansion is linked to gains in coverage, improvement in access and health, and economic benefits for states and providers; these generally positive findings persist even as more recent research considers increasingly complex and specific outcomes. This research provides context for ongoing debates about whether to expand Medicaid in states that have not done so already, where coverage options for many low-income adults are limited and nearly two million individuals fall into a coverage gap.

Medicaid is the largest source of public funding for family planning services—which are a mandatory benefit within the program—and finances 4 in 10 births in the United States, as well as provides prenatal and postpartum coverage. Federal law requires all states, including those that have not expanded Medicaid, to provide Medicaid coverage to pregnant individuals with incomes up to at least 138% of the federal poverty level (FPL). However, coverage options for the pre-pregnancy and postpartum periods vary across states and are more limited in non-expansion states. Nationwide, nearly 900,000 women fall into the coverage gap in non-expansion states.1 

This brief updates prior KFF literature reviews by summarizing 40 studies published between April 2021 and June 2023 on the impacts of Medicaid expansion on a range of sexual and reproductive health outcomes, including:

  • health insurance coverage before, during, and after pregnancy;
  • maternal and infant health access, utilization, and outcomes;
  • family planning; and
  • HIV care and prevention.

Consistent with prior research, recent studies identify positive effects of Medicaid expansion on coverage rates before, during, and after pregnancy; access to prenatal and postpartum care; birth and postpartum outcomes; use of the most effective contraceptive methods; and HIV screening and outcomes.

Our methodology is consistent with that of prior analyses. We conducted keyword searches of PubMed and other academic/health policy search engines to collect credible studies (published by a journal or by a nonpartisan research organization) on the impacts of the ACA Medicaid expansion. We then reviewed study abstracts to identify relevancy to sexual and reproductive health. Included study findings fall into four topic areas (Figure 1). Within each topic area, we first briefly summarize findings from earlier research (published between January 2014 and March 2021) and then highlight key findings from recent research that add to this body of evidence. For more information about earlier studies, see the 2021 and 2020 literature reviews. For citations from April 2021 through June 2023, see the Bibliography.

40 Recent Studies Consider the Effects of Medicaid Expansion on Sexual & Reproductive Health.

Insurance Coverage Before, During, and After Pregnancy

Prior studies overwhelmingly found that expansion increased postpartum coverage rates, as well as coverage prior to and during pregnancy. Although the American Rescue Plan Act of 2021 created a new option to expand postpartum coverage to 12 months via a State Plan Amendment, current federal statute requires that pregnancy-related Medicaid coverage continue through just 60 days. Earlier research indicates that ACA Medicaid expansion has decreased coverage loss after this 60-day period ends: all prior studies that consider rates of insurance coverage after pregnancy find that expansion significantly increased postpartum coverage. Studies also suggest an association between expansion and increased coverage prior to and during pregnancy.

Most recent studies continue to find that expansion is associated with coverage gains in the pre-pregnancy, pregnancy, and postpartum periods. All recent studies that consider the impact of expansion on insurance coverage prior to conception and at birth find coverage gains.2 ,3 ,4 ,5  Also, four studies find increases in coverage during the postpartum period, including one that also found that racial disparities in such coverage decreased.6 ,7 ,8 ,9  One study considered Medicaid coverage post-abortion in Oregon and found a significant increase, as well as significant declines in lapses in enrollment.10  In contrast, two studies had mixed findings and found that postpartum coverage gains were not significant.11 ,12 

Maternal and Infant Health: Access, Utilization, and Outcomes

Prior studies found that expansion increased access to health care for pregnant and postpartum women, and some suggested improvements in certain adverse pregnancy outcomes. Studies find that expansion increased access to and utilization of prenatal services—such as medications to treat opioid use disorder (MOUD) during pregnancy—as well as postpartum care. Additionally, all prior studies that consider impacts on maternal mortality or morbidity find significant declines, though findings on the impact of expansion on other health outcomes during pregnancy are mixed. Studies generally suggest an association between expansion and improvements in infant birth outcomes such as low birthweight, but most find no impact on infant mortality or find that improvements in infant mortality were concentrated among non-White infants.

Consistent with previous research, recent studies find that expansion is associated with increased access to and utilization of prenatal and postpartum care. Most studies in this area find that expansion resulted in increased utilization of at least one prenatal or postpartum service.13 ,14 ,15 ,16 ,17 ,18 ,19 ,20  These findings include increased use of services during pregnancy or childbirth, such as receipt of adequate prenatal care (both prior to and during the COVID-19 pandemic) and of MOUD, as well as of services during the postpartum period, such as breast pump claims and treatment for postpartum depression. Additionally, two studies find that Medicaid expansion may have promoted access to obstetrician-gynecologist (OB-GYN) care: by increasing the likelihood that OB-GYN practices have onsite resources to address psychosocial needs, and by facilitating access to intrapartum care for White and Hispanic women living in rural counties with obstetric unit closures.21 ,22  A smaller number of studies find no impact of expansion on utilization of certain prenatal/postpartum services (such as early prenatal care), nor on access to providers (such as hospital-based obstetric units).23 ,24 ,25 ,26 ,27 ,28 

Recent studies on the impact of expansion on adverse outcomes during pregnancy, birth, or postpartum are mixed. Several studies identify that expansion is associated with improvements in at least one health outcome.29 ,30 ,31 ,32 ,33  These findings include decreased incidence of adverse outcomes prior to pregnancy and at birth:

  • Improved pre-pregnancy health outcomes: One study found that expansion was associated with significant declines in self-reported pre-pregnancy depression.34 
  • Improved maternal outcomes at childbirth: Consistent with prior research, one recent study considering maternal morbidity in New York found a significant decrease in incidence, and that this decrease was significantly greater for low- versus high-income women.35 
  • Improved infant outcomes at childbirth: Two studies found that expansion was associated with lower rates of infant mortality (one of which identified a particular impact among Hispanic infants, similar to earlier research).36 ,37  One study found that expansion decreased the rate of low birth weight among infants born to mothers with hypertension in pregnancy.38  Finally, one study found that expansion reduced racial/ethnic disparities in infant health following rural obstetric unit closures.39 

However, a similar number of studies find no impact of expansion on certain pregnancy or postpartum health outcomes, including incidences of gestational hypertension/diabetes and of postpartum depressive symptoms.40 ,41 ,42 ,43 ,44 ,45 ,46 

Family Planning

Prior literature reviews indicated that expansion increased utilization of the most effective contraception methods but had little or no effect on overall contraception use. Medicaid is the primary funding source for family planning services for low-income people, with state programs required to cover all prescription contraceptives. Although the literature generally indicates that expansion has had little effect on contraception use overall, numerous studies identify an increased use of the most effective, long-acting reversible contraception (LARC), which includes IUDs and implants.

Recent studies find that expansion increased rates of LARC utilization and may have increased overall contraception use among some populations. Recent studies identify increases in utilization of LARC, short-acting contraception, and overall contraception for certain populations.47 ,48 ,49 ,50 ,51 ,52 

  • Increased LARC utilization: Three studies find increased use of LARC: among all Medicaid enrollees, among postpartum individuals, and among sexually active high school students.53 ,54 ,55 
  • Increased short-acting contraception utilization: One study found that physicians in Medicaid expansion states provided significantly more enrollees with short-acting hormonal birth control methods compared to physicians in non-expansion states.56 
  • Increased contraception utilization overall (short- and long-acting): One study found a significant increase in the use of any postpartum contraception method, driven by a shift from short-acting and non-prescription contraceptive methods to higher-cost, more effective forms of contraception.57  Two studies pointed to increased use of contraceptive services and counseling among Medicaid-enrolled women of reproductive age in Oregon.58 ,59 

Finally, consistent with earlier research, two studies found no significant impact of expansion on overall contraception use for certain populations (students and postpartum individuals).60 ,61  Another study found that physicians in expansion and non-expansion states provided similar numbers of enrollees with LARC methods in 2016.62 

A couple of recent studies suggest that increased access to family planning care after expansion may have decreased birth rates and short interpregnancy intervals, but others find no effect on these outcomes. One study found that expansion resulted in an overall decrease in live births among low-income women of reproductive age, particularly among subgroups with historically higher rates of unintended pregnancy (including unmarried, Hispanic, and American Indian and Alaskan Native women).63  Another study found that expansion resulted in a decreased risk of short interpregnancy intervals (less than 12 months between births), which the authors note have a known association with poor maternal and infant health outcomes.64  In contrast, three other studies find no impact of expansion on these or similar outcomes, including one study that found no impact on overall rates of early postpartum pregnancies but that such pregnancies did significantly decrease among Black patients.65 ,66 ,67 

HIV Care and Prevention Outcomes

Prior studies suggest that expansion increased rates of HIV screening as well as health outcomes for those diagnosed with HIV. Prior to the ACA, many people with HIV faced limited access to insurance coverage. Research finds that expansion increased insurance coverage rates among people with or at risk of HIV. Prior studies also indicate that expansion led to increases in HIV test and diagnosis rates despite no change in actual HIV incidence. Finally, studies find that expansion is associated with increased utilization of Pre-Exposure Prophylaxis (PrEP) to prevent HIV and improved quality of care for patients with HIV.

Most recent studies continue to find positive effects of expansion on HIV screening rates and outcomes.68  Consistent with prior research, recent studies find an association between expansion and increased rates of HIV testing.69 ,70  Also, a study found significant coverage gains among women with or at risk of contracting HIV.71  Two studies on Medicaid expansion and PrEP both found positive impacts. The first found a small but significant increase in the likelihood that men (and transgender or nonbinary individuals) who have sex with men (MSM) were taking PrEP to prevent HIV.72  The second found that Medicaid expansion was associated with a higher share of Google searches for PrEP keywords, potentially indicating an higher awareness of and interest in PrEP due to increased access.73  Finally, a study that following expansion, people with HIV experienced a significant increase in linkages to care after diagnosis, but no change in viral suppression of HIV (which the authors note could be in part because of state variation in Medicaid coverage policies for people with HIV).74 

Emerging Research

A small number of additional emerging studies include findings on:

Abortion: The Hyde Amendment blocks states from using federal funds to pay for abortion services under Medicaid in most instances.75  However, 17 states (all of which have expanded Medicaid) use state-only Medicaid funds to cover all or most medically accessible abortions. A recent study found no impact of Medicaid expansion on the abortion rate nationwide, though the authors note that this analysis was exploratory and that future research on expansion’s impact on abortions is necessary.76  Research in this area may continue particularly as abortion access across states continues to evolve following the Dobbs v. Jackson Women’s Health Organization decision.

LGBTQ+ individuals: Earlier research found gains in Medicaid coverage among lesbian, gay, and bisexual individuals following expansion. Similarly, one recent study found that following Medicaid expansion, overall insurance coverage rates increased for low-income individuals in same-sex couples, with larger gains for women versus men. The study also noted no significant impact on the likelihood of being employed for either low-income men or women in same-sex couples.77  Another study found that Medicaid expansion was associated with higher odds of having health coverage among transgender adults.78 

Taken together, the 40 new studies summarized in this brief add to the body of prior research finding positive effects of expansion on sexual and reproductive health. This research provides context for ongoing debates about whether to expand Medicaid in states that have not done so already. As states unwind the pandemic-era continuous enrollment provision in 2023, many individuals who qualified for Medicaid through the pregnancy pathway during the pandemic are at risk of losing Medicaid coverage. These individuals will have more coverage options in states that have expanded Medicaid. Looking ahead, future research may consider the impacts of expansion against the backdrop of evolving national and state landscapes around Medicaid eligibility as well as access to reproductive health care.

The authors thank Meghana Ammula (formerly of KFF) for her assistance reviewing recently published studies included in this brief.

Bibliography

Bibliography, April 2021 to June 2023

Bibliography (.pdf)

Endnotes

  1. KFF analysis of 2021 American Community Survey (ACS). ↩︎
  2. Erica Eliason, Jamie Daw, and Heidi Allen, “Association of Medicaid vs Marketplace Eligibility With Maternal Coverage and Access to Prenatal and Postpartum Care,” JAMA Network Open 4 no. 12 (December 2021), https://doi.org/10.1001/jamanetworkopen.2021.37383 ↩︎
  3. Jean Guglielminotti, Ruth Landau, and Guohua Li, “The 2014 New York State Medicaid Expansion and Severe Maternal Morbidity During Delivery Hospitalizations,” Anesthesia & Analgesia 133 no. 2 (August 2021): 340-348, https://doi.org/10.1213/ANE.0000000000005371 ↩︎
  4. Claire E. Margerison, Katlyn Hettinger, Robert Kaestner, Sidra Goldman-Mellor, and Danielle Gartner, “Medicaid Expansion Associated with Some Improvements in Perinatal Mental Health,” Health Affairs 40 no. 10 (October 2021), https://doi.org/10.1377/hlthaff.2021.00776 ↩︎
  5. Bradley Corallo and Brittni Frederiksen, How Does the ACA Expansion Affect Medicaid Coverage Before and During Pregnancy? (Washington, DC: KFF, October 2022), https://modern.kff.org/medicaid/issue-brief/how-does-the-aca-expansion-affect-medicaid-coverage-before-and-during-pregnancy/ ↩︎
  6. Lindsey Rose Bullinger, Kosali Simon, and Brownsyne Tucker Edmonds, “Coverage Effects of the ACA’s Medicaid Expansion on Adult Reproductive-Aged Women, Postpartum Mothers, and Mothers with Older Children,” Maternal and Child Health Journal 26 (March 2022): 1104-1114, https://doi.org/10.1007/s10995-022-03384-8 ↩︎
  7. Maria Steenland, Ira Wilson, and Kristen Matteson, “Association of Medicaid Expansion in Arkansas With Postpartum Coverage, Outpatient Care, and Racial Disparities,” JAMA Health Forum 2 no. 12 (December 2021), https://doi.org/10.1001/jamahealthforum.2021.4167 ↩︎
  8. Erica Eliason, Jamie Daw, and Heidi Allen, “Association of Medicaid vs Marketplace Eligibility With Maternal Coverage and Access to Prenatal and Postpartum Care,” JAMA Network Open 4 no. 12 (December 2021), https://doi.org/10.1001/jamanetworkopen.2021.37383 ↩︎
  9. Bradley Corallo, Jennifer Tolbert, Heather Saunders, and Brittni Frederiksen, Medicaid Enrollment Patterns During the Postpartum Year (Washington, DC: KFF, July 2022), https://modern.kff.org/medicaid/issue-brief/medicaid-enrollment-patterns-during-the-postpartum-year/ ↩︎
  10. Susannah E. Gibbs and S. Marie Harvey, “Postabortion Medicaid Enrollment and the Affordable Care Act Medicaid Expansion in Oregon,” Journal of Women’s Health 31 no. 1 (January 2022): 55-62, https://doi.org/10.1089/jwh.2020.8941 ↩︎
  11. Claire E. Margerison, Katlyn Hettinger, Robert Kaestner, Sidra Goldman-Mellor, and Danielle Gartner, “Medicaid Expansion Associated with Some Improvements in Perinatal Mental Health,” Health Affairs 40 no. 10 (October 2021), https://doi.org/10.1377/hlthaff.2021.00776 ↩︎
  12. Erica Eliason, Jamie Daw, and Heidi Allen, “Association of Medicaid vs Marketplace Eligibility With Maternal Coverage and Access to Prenatal and Postpartum Care,” JAMA Network Open 4 no. 12 (December 2021), https://doi.org/10.1001/jamanetworkopen.2021.37383 ↩︎
  13. Summer Hawkins, Krisztina Horvath, Alice Noble, and Christopher Baum, “ACA and Medicaid Expansion Increased Breast Pump Claims and Breastfeeding for Women with Public and Private Insurance,” Women’s Health Issues 32 no. 2 (March 2022): 114-121, https://www.whijournal.com/article/S1049-3867(21)00158-4/fulltext ↩︎
  14. Ian Everitt et al., “Association of State Medicaid Expansion Status With Hypertensive Disorders of Pregnancy in a Singleton First Live Birth,” Circulation: Cardiovasucular Quality and Outcomes 15 no. 1 (January 2022), https://doi.org/10.1161/CIRCOUTCOMES.121.008249 ↩︎
  15. Erica Eliason, Jamie Daw, and Heidi Allen, “Association of Medicaid vs Marketplace Eligibility With Maternal Coverage and Access to Prenatal and Postpartum Care,” JAMA Network Open 4 no. 12 (December 2021), https://doi.org/10.1001/jamanetworkopen.2021.37383 ↩︎
  16. Maria Steenland, Ira Wilson, and Kristen Matteson, “Association of Medicaid Expansion in Arkansas With Postpartum Coverage, Outpatient Care, and Racial Disparities,” JAMA Health Forum 2 no. 12 (December 2021), https://doi.org/10.1001/jamahealthforum.2021.4167 ↩︎
  17. Sugy Choi et al., “Estimating The Impact on Initiating Medications for Opioid Use Disorder of State Policies Expanding Medicaid and Prohibiting Substance Use During Pregnancy,” Drug and Alcohol Dependence 129 pt. A (December 2021), https://www.sciencedirect.com/science/article/abs/pii/S0376871621006578 ↩︎
  18. Maria Steenland and Amal Trivedi, “Association of Medicaid Expansion With Postpartum Depression Treatment in Arkansas,” JAMA Health Forum 4 no. 2 (February 2023), https://doi.org/10.1001/jamahealthforum.2022.5603 ↩︎
  19. Pinka Chatterji, Hanna Glenn, Sara Markowitz, and Jennifer Karas Montez, ACA Medicaid Expansions and Maternal Morbidity (National Bureau of Economic Research, Working Paper No. 30770, December 2022), https://www.nber.org/papers/w30770 ↩︎
  20. Hyunjung Lee and Gopal Singh, “The Differential Impact of the COVID-19 Pandemic on Prenatal Care Utilization Among US Women by Medicaid Expansion and Race and Ethnicity,” Journal of Public Health Management and Practice Epub ahead of print (December 2022), https://doi.org/10.1097/PHH.0000000000001698 ↩︎
  21. Gabriela Weigel, Brittni Frederiksen, Usha Ranji, and Alina Salganicoff, “Screening and Intervention for Psychosocial Needs by U.S. Obstetrician-Gynecologists,” Journal of Women’s Health 31 no. 6 (June 2022): 887-894, https://doi.org/10.1089/jwh.2021.0236 However, this study found no significant impact of expansion on the likelihood that OB-GYN practices report actually screening all patients for these needs. ↩︎
  22. Pinka Chatterji, Chun-Yu Ho, and Xue Wu, Obstetric Unit Closures and Racial/Ethnic Disparity in Health (National Bureau of Economic Research, Working Paper No. 30986, February 2023), https://www.nber.org/papers/w30986 ↩︎
  23. Erica Eliason, Jamie Daw, and Heidi Allen, “Association of Medicaid vs Marketplace Eligibility With Maternal Coverage and Access to Prenatal and Postpartum Care,” JAMA Network Open 4 no. 12 (December 2021), https://doi.org/10.1001/jamanetworkopen.2021.37383 ↩︎
  24. Claire Margerison, Robert Kaestner, Jiajia Chen, and Colleen MacCallum-Bridgers, “Impacts of Medicaid Expansion Before Conception on Prepregnancy Health, Pregnancy Health, and Outcomes,” American Journal of Epidemiology 190 no. 8 (August 2021): 1488-1498, https://doi.org/10.1093/aje/kwaa289 ↩︎
  25. Maria Steenland, Ira Wilson, and Kristen Matteson, “Association of Medicaid Expansion in Arkansas With Postpartum Coverage, Outpatient Care, and Racial Disparities,” JAMA Health Forum 2 no. 12 (December 2021), https://doi.org/10.1001/jamahealthforum.2021.4167 ↩︎
  26. Erica Eliason, Jamie Daw, and Heidi Allen, “Association of Medicaid vs Marketplace Eligibility With Maternal Coverage and Access to Prenatal and Postpartum Care,” JAMA Network Open 4 no. 12 (December 2021), https://doi.org/10.1001/jamanetworkopen.2021.37383 ↩︎
  27. Gabriela Weigel, Brittni Frederiksen, Usha Ranji, and Alina Salganicoff, “Screening and Intervention for Psychosocial Needs by U.S. Obstetrician-Gynecologists,” Journal of Women’s Health 31 no. 6 (June 2022): 887-894, https://doi.org/10.1089/jwh.2021.0236 ↩︎
  28. Caitlin Carroll, Julia Interrante, Jamie Daw, and Katy Backes Kozhimannil, “Association Between Medicaid Expansion and Closure of Hospital-Based Obstetric Services,” Health Affairs 41 no. 4 (April 2022), https://doi.org/10.1377/hlthaff.2021.01478 ↩︎
  29. Jean Guglielminotti, Ruth Landau, and Guohua Li, “The 2014 New York State Medicaid Expansion and Severe Maternal Morbidity During Delivery Hospitalizations,” Anesthesia & Analgesia 133 no. 2 (August 2021): 340-348, https://doi.org/10.1213/ANE.0000000000005371 ↩︎
  30. Joanne Constantin and George Wehby, “Effects of Recent Medicaid Expansions on Infant Mortality by Race and Ethnicity,” American Journal of Preventive Medicine 64 no. 3 (March 2023): 377-384, https://www.ajpmonline.org/article/S0749-3797(22)00498-6/fulltext ↩︎
  31. Claire E. Margerison, Katlyn Hettinger, Robert Kaestner, Sidra Goldman-Mellor, and Danielle Gartner, “Medicaid Expansion Associated with Some Improvements in Perinatal Mental Health,” Health Affairs 40 no. 10 (October 2021), https://doi.org/10.1377/hlthaff.2021.00776 ↩︎
  32. Ian Everitt et al., “Association of State Medicaid Expansion Status With Hypertensive Disorders of Pregnancy in a Singleton First Live Birth,” Circulation: Cardiovasucular Quality and Outcomes 15 no. 1 (January 2022), https://doi.org/10.1161/CIRCOUTCOMES.121.008249 ↩︎
  33. Maria Steenland and Laura Wherry, “Medicaid Expansion Led To Reductions In Postpartum Hospitalizations,” Health Affairs 42 no. 1 (January 2023): 18-25, https://doi.org/10.1377/hlthaff.2022.00819 ↩︎
  34. Claire E. Margerison, Katlyn Hettinger, Robert Kaestner, Sidra Goldman-Mellor, and Danielle Gartner, “Medicaid Expansion Associated with Some Improvements in Perinatal Mental Health,” Health Affairs 40 no. 10 (October 2021), https://doi.org/10.1377/hlthaff.2021.00776 ↩︎
  35. Jean Guglielminotti, Ruth Landau, and Guohua Li, “The 2014 New York State Medicaid Expansion and Severe Maternal Morbidity During Delivery Hospitalizations,” Anesthesia & Analgesia 133 no. 2 (August 2021): 340-348, https://doi.org/10.1213/ANE.0000000000005371 In contrast, a national study (Chatterji et al. 2022), cited below, found no significant impact on severe maternal morbidity, but did not limit this analysis by income. ↩︎
  36. Joanne Constantin and George Wehby, “Effects of Recent Medicaid Expansions on Infant Mortality by Race and Ethnicity,” American Journal of Preventive Medicine 64 no. 3 (March 2023): 377-384, https://www.ajpmonline.org/article/S0749-3797(22)00498-6/fulltext ↩︎
  37. Jessian Munoz, “Preterm Birth and Foetal-Neonatal Death Rates Associated With the Affordable Care Act Medicaid Expansion (2014–19),” Journal of Public Health 45 no. 1 (March 2023): 99–101, https://doi.org/10.1093/pubmed/fdab377 ↩︎
  38. Ian Everitt et al., “Association of State Medicaid Expansion Status With Hypertensive Disorders of Pregnancy in a Singleton First Live Birth,” Circulation: Cardiovasucular Quality and Outcomes 15 no. 1 (January 2022), https://doi.org/10.1161/CIRCOUTCOMES.121.008249 ↩︎
  39. Pinka Chatterji, Chun-Yu Ho, and Xue Wu, Obstetric Unit Closures and Racial/Ethnic Disparity in Health (National Bureau of Economic Research, Working Paper No. 30986, February 2023), https://www.nber.org/papers/w30986 ↩︎
  40. Joanne Constantin and George Wehby, “Effects of Recent Medicaid Expansions on Infant Mortality by Race and Ethnicity,” American Journal of Preventive Medicine 64 no. 3 (March 2023): 377-384, https://www.ajpmonline.org/article/S0749-3797(22)00498-6/fulltext ↩︎
  41. Claire E. Margerison, Katlyn Hettinger, Robert Kaestner, Sidra Goldman-Mellor, and Danielle Gartner, “Medicaid Expansion Associated with Some Improvements in Perinatal Mental Health,” Health Affairs 40 no. 10 (October 2021), https://doi.org/10.1377/hlthaff.2021.00776 ↩︎
  42. Ian Everitt et al., “Association of State Medicaid Expansion Status With Hypertensive Disorders of Pregnancy in a Singleton First Live Birth,” Circulation: Cardiovasucular Quality and Outcomes 15 no. 1 (January 2022), https://doi.org/10.1161/CIRCOUTCOMES.121.008249 ↩︎
  43. Claire Margerison, Robert Kaestner, Jiajia Chen, and Colleen MacCallum-Bridgers, “Impacts of Medicaid Expansion Before Conception on Prepregnancy Health, Pregnancy Health, and Outcomes,” American Journal of Epidemiology 190 no. 8 (August 2021): 1488-1498, https://doi.org/10.1093/aje/kwaa289 ↩︎
  44. Anna Austin, Rebeccah Sokol, and Caroline Rowland, “Medicaid Expansion and Postpartum Depressive Symptoms: Evidence From the 2009-2018 Pregnancy Risk Assessment Monitoring System Survey,” Annals of Epidemiology 68 (April 2022): 9-15, https://www.sciencedirect.com/science/article/abs/pii/S1047279721003537 ↩︎
  45. Maria Steenland and Laura Wherry, “Medicaid Expansion Led To Reductions In Postpartum Hospitalizations,” Health Affairs 42 no. 1 (January 2023): 18-25, https://doi.org/10.1377/hlthaff.2022.00819 ↩︎
  46. Pinka Chatterji, Hanna Glenn, Sara Markowitz, and Jennifer Karas Montez, ACA Medicaid Expansions and Maternal Morbidity (National Bureau of Economic Research, Working Paper No. 30770, December 2022), https://www.nber.org/papers/w30770 ↩︎
  47. Lydia Pace, Indrani Saran, and Summer Sherburne Hawkins, “Impact of Medicaid Eligibility Changes on Long-acting Reversible Contraception Use in Massachusetts and Maine,” Medical Care 60 no. 2 (February 2022): 119-124, https://doi.org/10.1097/MLR.0000000000001666 ↩︎
  48. Erica L. Eliason, Amanda Spishak-Thomas, and Maria W. Steenland, “Association of the Affordable Care Act Medicaid Expansions with Postpartum Contraceptive Use and Early Postpartum Pregnancy,” Contraception 113 (September 2022): 42-48, https://www.contraceptionjournal.org/article/S0010-7824(22)00060-9/fulltext ↩︎
  49. Greta Kilmer et al., “Medicaid Expansion and Contraceptive Use Among Female High-School Students,” American Journal of Preventive Medicine 63 no. 4 (October 2022): 592-602, https://www.ajpmonline.org/article/S0749-3797(22)00244-6/fulltext ↩︎
  50. Mandar Bodas et al., “Association of Primary Care Physicians’ Individual- and Community-Level Characteristics With Contraceptive Service Provision to Medicaid Beneficiaries,” JAMA Health Forum 4 no. 3 (March 2023), https://doi.org/10.1001/jamahealthforum.2023.0106 ↩︎
  51. Susannah E. Gibbs, S. Marie Harvey, Annie Larson, Jangho Yoon, and Jeff Luck, “Contraceptive Services After Medicaid Expansion in a State with a Medicaid Family Planning Waiver Program,” Journal of Women’s Health 30 no. 5 (May 2021): 750-757, https://doi.org/10.1089/jwh.2020.8351 ↩︎
  52. Mandana Masoumirad, S. Marie Harvey, Linh N. Bui, and Jangho Yoon, “Use of Sexual and Reproductive Health Services Among Women Living in Rural and Urban Oregon: Impact of the Affordable Care Act Medicaid Expansion,” Journal of Women’s Health 32 no. 3 (March 2023): 300-310, https://doi.org/10.1089/jwh.2022.0308 ↩︎
  53. Lydia Pace, Indrani Saran, and Summer Sherburne Hawkins, “Impact of Medicaid Eligibility Changes on Long-acting Reversible Contraception Use in Massachusetts and Maine,” Medical Care 60 no. 2 (February 2022): 119-124, https://doi.org/10.1097/MLR.0000000000001666 ↩︎
  54. Erica L. Eliason, Amanda Spishak-Thomas, and Maria W. Steenland, “Association of the Affordable Care Act Medicaid Expansions with Postpartum Contraceptive Use and Early Postpartum Pregnancy,” Contraception 113 (September 2022): 42-48, https://www.contraceptionjournal.org/article/S0010-7824(22)00060-9/fulltext ↩︎
  55. Greta Kilmer et al., “Medicaid Expansion and Contraceptive Use Among Female High-School Students,” American Journal of Preventive Medicine 63 no. 4 (October 2022): 592-602, https://www.ajpmonline.org/article/S0749-3797(22)00244-6/fulltext ↩︎
  56. Mandar Bodas et al., “Association of Primary Care Physicians’ Individual- and Community-Level Characteristics With Contraceptive Service Provision to Medicaid Beneficiaries,” JAMA Health Forum 4 no. 3 (March 2023), https://doi.org/10.1001/jamahealthforum.2023.0106 ↩︎
  57. Erica L. Eliason, Amanda Spishak-Thomas, and Maria W. Steenland, “Association of the Affordable Care Act Medicaid Expansions with Postpartum Contraceptive Use and Early Postpartum Pregnancy,” Contraception 113 (September 2022): 42-48, https://www.contraceptionjournal.org/article/S0010-7824(22)00060-9/fulltext ↩︎
  58. Susannah E. Gibbs, S. Marie Harvey, Annie Larson, Jangho Yoon, and Jeff Luck, “Contraceptive Services After Medicaid Expansion in a State with a Medicaid Family Planning Waiver Program,” Journal of Women’s Health 30 no. 5 (May 2021): 750-757, https://doi.org/10.1089/jwh.2020.8351 ↩︎
  59. Mandana Masoumirad, S. Marie Harvey, Linh N. Bui, and Jangho Yoon, “Use of Sexual and Reproductive Health Services Among Women Living in Rural and Urban Oregon: Impact of the Affordable Care Act Medicaid Expansion,” Journal of Women’s Health 32 no. 3 (March 2023): 300-310, https://doi.org/10.1089/jwh.2022.0308 ↩︎
  60. Greta Kilmer et al., “Medicaid Expansion and Contraceptive Use Among Female High-School Students,” American Journal of Preventive Medicine 63 no. 4 (October 2022): 592-602, https://www.ajpmonline.org/article/S0749-3797(22)00244-6/fulltext ↩︎
  61. Erica Eliason, Jamie Daw, and Heidi Allen, “Association of Medicaid vs Marketplace Eligibility With Maternal Coverage and Access to Prenatal and Postpartum Care,” JAMA Network Open 4 no. 12 (December 2021), https://doi.org/10.1001/jamanetworkopen.2021.37383 ↩︎
  62. Mandar Bodas et al., “Association of Primary Care Physicians’ Individual- and Community-Level Characteristics With Contraceptive Service Provision to Medicaid Beneficiaries,” JAMA Health Forum 4 no. 3 (March 2023), https://doi.org/10.1001/jamahealthforum.2023.0106 ↩︎
  63. Erica L. Eliason, Jamie R. Daw, and Heidi L. Allen, “Association of Affordable Care Act Medicaid Expansions with Births Among Low-Income Women of Reproductive Age,” Journal of Women’s Health 31 no. 7 (July 2022): 949-956, https://doi.org/10.1089/jwh.2021.0451 ↩︎
  64. Kriya S. Patel, Juliana Bakk, Meredith Pensak, Emily DeFranco, “Influence of Medicaid Expansion on Short Interpregnancy Interval Rates in the United States,” American Journal of Obstetrics & Gynecology Maternal-Fetal Medicine 3 no. 6 (November 2021), https://www.ajogmfm.org/article/S2589-9333(21)00179-8/fulltext ↩︎
  65. Erica L. Eliason, Amanda Spishak-Thomas, and Maria W. Steenland, “Association of the Affordable Care Act Medicaid Expansions with Postpartum Contraceptive Use and Early Postpartum Pregnancy,” Contraception 113 (September 2022): 42-48, https://www.contraceptionjournal.org/article/S0010-7824(22)00060-9/fulltext ↩︎
  66. Danielle Gartner, Robert Kaestner, and Claire Margerison, “Impacts of the Affordable Care Act’s Medicaid Expansion on Live Births,” Epidemiology 33 no. 3 (May 2022): 406-414, https://doi.org/10.1097/EDE.0000000000001462 ↩︎
  67. Can Liu et al., “Impact of Medicaid Expansion on Interpregnancy Interval,” Womens Health Issues 32 no. 3 (May 2022): 226-234, https://www.whijournal.com/article/S1049-3867(21)00190-0/fulltext ↩︎
  68. Consistent with prior analysis, note that study findings on screening and outcomes related to HPV, as well as gynecological cancer generally, are included in our discussion of research on the impact of expansion on cancer-related outcomes. ↩︎
  69. Suhang Song and James Kucik, “Trends in the Impact of Medicaid Expansion on the Use of Clinical Preventive Services,” American Journal of Preventive Medicine 62 no. 5 (May 2022): 752-762, https://www.ajpmonline.org/article/S0749-3797(21)00595-X/fulltext ↩︎
  70. Toni Romero and Branco Ponomariov, “The Effect of Medicaid Expansion on Access to Healthcare, Health Behaviors and Health Outcomes Between Expansion and Non-Expansion States,” Evaluation and Program Planning Epub ahead of print (May 2023), https://doi.org/10.1016/j.evalprogplan.2023.102304 ↩︎
  71. Andrew Edmonds et al., “Impacts of Medicaid Expansion on Health Insurance and Coverage Transitions among Women with or at Risk for HIV in the United States,” Womens Health Issues 32 no. 5 (September-October 2022): 450-460, https://www.whijournal.com/article/S1049-3867(22)00027-5/fulltext ↩︎
  72. Pedro Botti Carneiro et al., “Demographic, Clinical Guideline Criteria, Medicaid Expansion and State of Residency: a Multilevel Analysis of PrEP Use on a Large US Sample,” BMJ Open 12 no. 2 (February 2022), https://bmjopen.bmj.com/content/12/2/e055487.info ↩︎
  73. Bita Fayaz Farkhad, Mohammadreza Nazari, Man-pui Sally Chan, and Dolores AlbarracĂ­n, “State Health Policies and Interest in PrEP: Evidence from Google Trends,” AIDS Care 34 no. 3 (2022): 331-339, https://doi.org/10.1080/09540121.2021.1934381 ↩︎
  74. J. Logan et al., “HIV Care Outcomes in Relation to Racial Redlining and Structural Factors Affecting Medical Care Access Among Black and White Persons with Diagnosed HIV—United States, 2017,” AIDS and Behavior 26 (March 2022): 2941–2953, https://doi.org/10.1007/s10461-022-03641-5 ↩︎
  75. The Hyde amendment includes exceptions for pregnancies that are the result of rape, incest, or if the pregnant person’s life is in danger. ↩︎
  76. In particular, the abortion analysis was not restricted to women with Medicaid-eligible incomes and was not limited to only states that cover abortions in Medicaid. Erica L. Eliason, Jamie R. Daw, and Heidi L. Allen, “Association of Affordable Care Act Medicaid Expansions with Births Among Low-Income Women of Reproductive Age,” Journal of Women’s Health 31 no. 7 (July 2022): 949-956, https://doi.org/10.1089/jwh.2021.0451 ↩︎
  77. Samuel Mann et al., “Effects of the Affordable Care Act’s Medicaid Expansion on Health Insurance Coverage for Individuals in Same-sex Couples,” Health Services Research 58 no. 3 (June 2023): 612-621, https://doi.org/10.1111/1475-6773.14128 ↩︎
  78. Nguyen Tran, Kellan Baker, Elle Lett, and Ayden Scheim, “State-Level Heterogeneity in Associations Between Structural Stigma and Individual Health Care Access: A Multilevel Analysis of Transgender Adults in the United States,” Journal of Health Services Research & Policy 28 no. 2 (April 2023): 109-118, https://doi.org/10.1177/13558196221123413 ↩︎

Climate-Related Health Risks Among Workers: Who is at Increased Risk?

Published: Jun 26, 2023

Introduction

Over the past few years, a plethora of research has linked climate change to adverse health outcomes around the world. People may be exposed to climate-related health risks through a variety of pathways, including through their work. The Centers for Disease Control and Prevention (CDC) and Environmental Protection Agency (EPA) note that disproportionate exposure to adverse climate change-related conditions can exacerbate existing health and safety issues among certain workers and could potentially cause new and unanticipated harms. Risk of climate-related health impacts varies across occupations, with many of the same underlying drivers of disparities in climate vulnerability overall reflected in the occupational sector.

This analysis identifies occupations that are at increased risk of climate-related health impacts, examines the characteristics of workers in these jobs, and discusses the implications of these findings. It is based on KFF analysis of the 2022 Current Population Survey Annual Social and Economic Supplement (CPS ASEC) for nonelderly adult workers ages 19-64. Differences in demographic and socioeconomic characteristics described in the text are statistically significant at p<0.05. In sum, this analysis finds:

  • We estimate there are over 65 million nonelderly adult workers in occupations at increased risk for climate-related health risks, accounting for over four in ten of nonelderly workers. These include jobs with increased exposure to heat, decreased air quality, extreme weather, vector-borne and infectious diseases, and environmental contaminants. Some examples of at-risk jobs include agricultural and construction workers and emergency responders.
  • Among nonelderly adult workers, many people of color, noncitizen immigrants, and workers with lower educational attainment and income levels are disproportionately likely to be employed in jobs with increased climate-related risks. Nonelderly Hispanic (58%), Black (51%), and Native Hawaiian or Pacific Islander (NHOPI) (52%) workers are more likely than White workers (39%) to work in at-risk occupations. Similarly, around six in ten nonelderly noncitizen immigrant workers who work in at-risk occupations compared to about four in ten U.S.-born citizens. Nonelderly workers with lower educational attainment and incomes are more likely to work in at-risk occupations compared to their counterparts with higher educational attainment and incomes.
  • Nonelderly workers in at-risk occupations are about twice as likely as their counterparts in less at-risk occupations to lack health insurance (16% vs. 7%), These higher uninsured rates reflect lower rates of private coverage among these workers (70% vs. 85%), which is likely the result of more limited availability of employer-sponsored insurance in these types of jobs. Medicaid helps fill some of this gap in private coverage for workers in at-risk occupations, covering 14% of workers in at-risk jobs vs. 8% of those in less at-risk jobs, but does not fully offset the gap in private coverage.

These findings show that job-related climate-related health risks compound challenges and disparities faced by many historically marginalized and underserved groups. Adults of color, noncitizens, and adults with lower educational attainment and incomes are disproportionately employed in occupations with increased climate-related health risks. Moreover, workers in occupations with increased climate-related health risks are more likely to be uninsured, contributing to challenges accessing health care. Many of these same groups face other job-based challenges, including higher risk of injury and differential treatment, particularly migrant or immigrant workers, who often lack labor protections. These groups also are at increased risk for other climate related health risks and broader disparities in health and health care due to underlying structural inequities. Without mitigation strategies, health risks are expected to increase due to climate change. These data highlight the importance of addressing underlying social and economic inequities that drive disparate occupational exposures to climate-related health risks and to protect workers from these increasing risks.

Climate can negatively impact worker health through multiple pathways including extreme heat, decreased air quality, extreme weather, vector-borne and infectious diseases, and environmental contaminants. The Centers for Disease Control and Prevention (CDC) notes that the disproportionate exposure to adverse climate change-related conditions can exacerbate existing health and safety issues among certain workers and could potentially cause new and unanticipated harms. These exposures could lead to heat stress and other heat-related illnesses, occupational injuries and deaths, infections and disease, and health conditions caused by exposure to biological hazards as well as negatively impact mental health. They also may limit worker productivity and contribute to added costs associated with worker illness or injury.

Some occupations pose more climate-related health risks for workers than others. For example, outdoor workers and indoor workers who engage in heavy physical labor and are exposed to high temperatures are disproportionately likely to suffer from heat-related illnesses and deaths. Some research studies have found that agriculture, forestry, fishing, hunting, and construction workers experience the highest rates of heat-related mortality. In responding to the growing number of wildfires associated with climate change, firefighters, health care workers, and other emergency responders are disproportionately exposed to air pollutants, which are connected to allergies, respiratory illnesses, heart diseases, and other chronic and acute illnesses. Extreme weather events pose health and safety risks to rescue and recovery workers and may increase exposure to environmental contaminants and water-borne and food-borne diseases. People who work outdoors, in water and sanitation-related occupations, agriculture, with animals, or in the natural environment are particularly susceptible to the infection, transmission of, and spread of vector-borne diseases, such as Lyme disease. Agricultural workers are particularly susceptible to exposure and absorption of toxic chemicals, including pesticides, which have been associated with adverse health outcomes, including death.

To better understand who is at increased risk of climate-related health impacts through their job, we identified workers in occupation groups at increased risk and as less at-risk using data from the 2022 Current Population Survey Annual Social and Economic Supplement (CPS-ASEC). We identified occupations with increased climate-related risks based on a range of resources, including CDC’s Occupational Safety and Health and Climate Resource, EPA’s Climate Change and Health of Occupational Groups report, and George Washington University’s Hazard Zone: The Impact of Climate Change on Occupational Health (Figure 1). The classifications used in this analysis are subject to some limitations due to the breadth of occupation categories in CPS-ASEC. Each of the occupation categories in CPS includes many jobs, which may vary in terms of at-risk or less at-risk classifications and by geographic location. For this analysis, we classified an occupation category as at- or less at-risk if the majority of jobs included in it aligned with the CDC’s and other organizations’ definitions of climate vulnerable occupations.

Occupation Groups by Climate-Related Health Risks

Based on the classification of occupation groups above, we find a total of 65.7 million nonelderly adult workers in occupations that are at increased risk for climate related health risks, accounting for 44% of nonelderly workers. The remaining 56% or 84.7 million nonelderly adult workers are in occupations identified as less at-risk for climate-related health risks.

Overall, among nonelderly adult workers, many people of color and noncitizen immigrants are more likely than their White and citizen counterparts to be in jobs with increased climate-related health risks (Figure 1). Over half of Hispanic (58%), Black (51%), and Native Hawaiian or Pacific Islander (NHOPI) (52%) nonelderly workers are in occupations at increased risk for climate-related health risks compared with 39% of White workers. Asian nonelderly workers (33%) are less likely than their White counterparts (39%) to be in occupations that are at increased risk. Moreover, around six in ten of noncitizen immigrant workers, including 62% of those who have been in the U.S. for five or more years and 59% of those who have been in the U.S. for less than five years, are employed in at-risk occupations compared with 41% of U.S.-born citizen workers. Naturalized citizen workers are (47%) also more likely than U.S.-born citizen workers to work in at-risk occupations, although the difference is smaller. Noncitizen Black, Hispanic, and NHOPI workers had particularly high rates of employment in at-risk occupations, with nearly eight in ten (77%) Hispanic noncitizen workers, two-thirds of Black noncitizen workers, and 80% of NHOPI noncitizen workers employed in at-risk professions.

Share of Nonelderly Workers in Occupations at Increased Risk for Climate-Related Health Impacts by Race, Ethnicity, and Citizenship Status

Nonelderly workers with lower educational attainment and income levels are more likely than workers with higher levels of education and income to work in at-risk occupations (Figure 2). Nearly eight in ten (79%) nonelderly workers with less than a high school education and six in ten (61%) nonelderly workers with a high school degree work in at-risk occupations compared with less than half (48%) of nonelderly workers with some college education and just one in four (25%) of nonelderly workers with a bachelor’s degree or higher. Similar patterns are seen by income. Over six in ten low-income nonelderly workers (with incomes below 200% of the federal poverty level (FPL)) are employed in at-risk occupations, nearly twice the share of higher income workers (income at 400% FPL or higher) employed in these jobs (34%).

Share of Nonelderly Workers in Occupations at Increased Risk for Climate-Related Health Impacts by Educational Attainment and Income

Nonelderly workers in at-risk occupations are about twice as likely as their counterparts in less at-risk occupations to be uninsured (Figure 3). Among nonelderly workers, 16% of those in occupations with increased climate related health risks are uninsured, nearly twice the rate of workers in less at-risk occupations (7%). These higher uninsured rates reflect lower rates of private coverage among these workers (70% vs. 85%). Medicaid helps fill some of this gap in private coverage, covering 14% of workers in at-risk jobs vs. 8% of those in less at-risk jobs, but does not fully offset the gap in private coverage. These differences in health insurance coverage likely reflect that many of the occupations with increased risk offer lower wages and are in industries that are less likely to offer employer-sponsored coverage. Additionally, workers in at-risk occupations are significantly more likely to be noncitizen immigrants, who are subject to eligibility restrictions for federally-funded coverage, including prohibitions on undocumented immigrants enrolling in Medicaid or purchasing coverage through the Affordable Care Act (ACA) Marketplace.

Health Coverage of Nonelderly Workers by Occupational Climate-Related Health Risks

Implications

Job-related climate-related health risks compound challenges and disparities faced by many historically marginalized and underserved groups. This analysis shows that adults of color, noncitizens, and adults with lower educational attainment and incomes are disproportionately employed in occupations with increased climate-related health risks. Moreover, workers in occupations with increased climate-related health risks are more likely to be uninsured, contributing to challenges accessing health care. Many of these same groups may face other job-based challenges, including higher risk of injury and differential treatment. Of particular note are migrant or immigrant workers who are disproportionately exposed to environmental hazards and have a greater risk of developing adverse outcomes due to their potential lack of job training, labor protections, and worker authorization/contracts, as well as their inability to access government-sponsored support. Moreover, these groups also are at increased risk for other climate related health risks and broader disparities in health and health care due to underlying structural inequities, including residential segregation and other social and economic challenges.

Occupational climate-related health risks are expected to increase due to climate change. Without any mitigation strategies, the threats associated with exposure to extreme heat, air pollutants, extreme weather, vector borne diseases, and toxic environmental chemicals and other contaminants are expected to increase due to climate change. As such, climate change will likely contribute to increases in negative health impacts among workers, including heat related illnesses and occupational injuries and illnesses. If unchecked, researchers estimate a nearly fourfold increase in extreme heat-related occupational injuries. Research has shown that, if unaddressed, the impact of climate change on workers’ health will increase loss of productivity hours and may cost the U.S. economy, in the long run. As climate change continues and the number of new vector-borne diseases is expected to increase, researchers expect that many carriers of these diseases could expand their geographical range putting more people, including outdoor workers, at risk of disease infection and transmission. Recent analysis has also found that, if unaddressed, climate change associated damages, including lost labor productivity due to heat stress, increased morbidity and mortality, and agricultural loss could cost the U.S. economy approximately $14.5 trillion over the next fifty years.

In recent years, there has been increased recognition of climate change and its impacts on health equity, including among workers, but continued action will be important for mitigating risks. The federal government has taken some steps to prioritize efforts to address climate change and its health risks for workers. In addition to Executive Orders that emphasize the need for a government-wide approach to addressing climate change and advancing environmental justice, in 2022, the Occupational Safety and Health Administration (OSHA) launched the National Emphasis Program for Outdoor and Indoor Heat-Related Hazards, an enforcement program that seeks to identify and eliminate or reduce worker exposures to occupational heat-related illnesses and injuries. This program is an expansion of the agency’s heat-related illness prevention initiative. The EPA revoked the use of certain dangerous chemicals, including the use of chlorpyrifos as a pesticide for food, reducing risks for farmworkers and their children in 2022. Some states have also taken steps to protect workers from extreme heat. Minnesota, Washington, Oregon, California, and Colorado have implemented heat standards that seek to prevent heat-related illnesses and deaths among workers. Going forward continued actions to mitigate climate-related health risks for workers as well as to address underlying social and economic inequities that drive disparate occupational exposures to climate-related health risks will be of growing importance as these risks are expected to grow due to climate change.

Privately Insured People with Depression and Anxiety Face High Out-of-Pocket Costs

Authors: Hope Schwartz, Nirmita Panchal, Gary Claxton, and Cynthia Cox
Published: Jun 23, 2023

Millions of people in the United States live with mental health diagnoses, with about one third of adults reporting symptoms of depression and/or anxiety. Among these adults, over 20% report an unmet need for counseling or therapy.

This analysis finds that privately insured adults who were treated for depression and/or anxiety in 2021 spent almost twice as much on annual out-of-pocket costs compared to enrollees who were not treated for a mental health diagnosis ($1,501 versus $863). Out-of-pocket spending and service utilization increased with depression severity.

The findings only include services that enrollees claim under their employer coverage. As a result, they likely underestimate utilization of, and spending on, mental health services.

The analysis is available through the Peterson-KFF Health System Tracker, an online information hub that monitors and assesses the performance of the U.S. health system.

News Release

What Do We Know About People with HIV Who Are Not Engaged in Regular HIV Care?  

One-in-five Adults with Diagnosed HIV were not Receiving Regular HIV Care Between 2018 and 2020

Published: Jun 22, 2023

A new KFF analysis finds that between 2018 and 2020, one-in-five (21%) adults diagnosed with HIV were out of care. Compared to adults who were receiving regular HIV care, adults who were out of care were more likely to be Black and to report challenges in their interactions with the health system, multiple and complex barriers to accessing health care services, and unmet needs for ancillary care.

Adults who were out of care were not virally suppressed and had not received recommended lab tests. 

Additional findings include: 

  • Adults with HIV who were out of care were more likely to be young and to report poorer health status than those in care. They were also more likely to be uninsured and were less likely to have a regular provider or to receive support from the Ryan White HIV/AIDS Program, the nation’s HIV safety-net program that provides outpatient HIV care, treatment, and support services to people with HIV who are underinsured and uninsured. 
  • Adults who were out of care were more likely to report barriers to receiving care because of their finances, mental health, and difficulty getting to a doctor’s office, as well as more dissatisfaction with care than those in care. They were also more likely to report unmet needs for social and support services such as food and housing insecurity.

• A fifth of adults who were out of care were not on antiretrovirals (HIV medication) compared to virtually all of adults in care. Among adults on treatment, those who were out-of-care were more likely to report missing doses.

Identifying people with HIV who are out of care, and better understanding the barriers they face, are first steps towards engaging or reengaging them in care, addressing their unmet needs, and improving their health status. Doing so effectively would improve both individual health outcomes as well as public health, aligning with the goals in the national HIV/AIDS Strategy and the federal Ending the HIV initiative.

Read “What Do We Know About People with HIV Who Are Not Engaged in Regular HIV Care?” to learn more about people with HIV who are not engaged in regular HIV care and the barriers they face.

Additionally, learn more about KFF’s Greater Than HIV, a public information initiative focused on reaching those populations most affected by HIV in the United States with the latest on testing, prevention, and treatment. A current Greater than HIV effort provides free HIV testing and counseling as part of the largest National HIV Testing Day event in the nation on June 27th.

What Do We Know About People with HIV Who Are Not Engaged In Regular HIV Care?

Published: Jun 22, 2023

Key Findings

An ongoing challenge to ending the HIV epidemic in the U.S. is reaching people with HIV who are not receiving regular HIV care and are not virally suppressed. Being engaged in HIV care, including being on antiretroviral therapy, promotes optimal individual health outcomes and viral suppression, which in turn prevents transmission of HIV to others. To date, however, robust and representative data on people with HIV who are not receiving regular HIV care have been limited, making it difficult to understand who they are and what barriers they face. This analysis aims to help fill this gap, using nationally representative data to assess the characteristics and experiences of people with HIV who are out of regular HIV care, defined as those who had less than two CD41 . or viral load tests at least 3 months apart within a 12-month period and were not virally suppressed.

Overall, we find that one-in-five (21%) adults with diagnosed HIV were out-of-care and, compared to their in-care counterparts, they were more likely to report challenges in their interactions with the health system, multiple and complex barriers to access, and unmet needs for ancillary care; they are also more likely to be members of population groups already facing longstanding health disparities. Specifically, we find that:

  • People with HIV who were out-of-care were more likely to be Black, young, and to report poorer health status than those in-care. They were also more likely to be uninsured, experience changes in their usual source of care related to insurance changes, and were less likely to have a regular provider or to receive support from the Ryan White Program. There were no statistically significant differences based on state Medicaid expansion status or census region.
  • Those out-of-care were more likely to report barriers to care engagement, including in the areas of finances, mental health, and getting to a doctor’s office, as well as more dissatisfaction with care than those in-care. They were also more likely to report unmet needs for ancillary social and support services in three domains: clinical, non-HIV medical/behavioral, and subsistence services, with more than half reporting at least one unmet need.
  • Whereas virtually all people with HIV in-care were on antiretroviral therapy, a fifth of those out-of- care were not on ARVs, and among those who were, they were more likely to report missing treatment doses. In addition, smaller shares reported being familiar with the concept of treatment as prevention (TasP) than those in-care, though there were substantial knowledge gaps for both groups.
  • Identifying people with HIV who are out-of-care, and better understanding the barriers they face, are first steps towards engaging or reengaging them in-care, addressing their unmet needs, and improving their health status. Doing so could play a role in advancing the goals in the national HIV/AIDS Strategy and the federal Ending the HIV initiative.

Introduction

An ongoing challenge to ending the HIV epidemic in the U.S. is reaching people living with HIV who are out of regular HIV care and not virally suppressed. Being engaged in HIV care, including being on antiretroviral therapy, promotes optimal individual health outcomes and viral suppression, which also prevents transmission of HIV. Indeed, an estimated 43% of HIV transmissions are estimated to result from people who were aware of their HIV status but not engaged in care. To date, however, robust and representative data on people with HIV who are not engaged in regular HIV care and the barriers they face have been limited. One exception is a nationally representative analysis that assessed barriers to care faced by people with HIV who felt they had not received enough care. The current analysis aims to add to this knowledge base, using nationally representative data from the Centers for Disease Control and Prevention’s Medical Monitoring Project (MMP). The MMP is a cross-sectional, nationally representative survey of adults with diagnosed HIV in the United States and includes data drawn from both in-depth interviews and medical record abstraction.

For this analysis, we defined people with HIV as not being in care if they (1) had less than two CD4 or viral load tests at least 3 months apart within a 12-month period and (2) did not have sustained viral suppression (see box). This definition differs from the one used by the Centers for Disease Control and Prevention which only focuses on lab testing frequency regardless of viral suppression status.2 Â  By taking this approach, we aimed to identify the most vulnerable individuals within this group, including those who may have the greatest need for targeted engagement efforts. The analysis is limited to adults and is based on data collected between 2018 and 2020 (see Methodology for details).

Table 1: Key Terms
TermDefinition
Out-of-careReceived fewer than two CD4 or viral load tests at least 3 months apart within a 12-month period AND had any viral load test where they were virally unsuppressed in the preceding 12 months.
In-careReceived two or more CD4 or viral load tests at least 3 months apart within a 12-month period OR was virally suppressed at all tests in the preceding 12 months (regardless of lab test frequency).
Sustained viral suppressionNo unsuppressed viral load test results in the preceding 12 months

Findings

Population

Based on the definition described above, 21% of adults with diagnosed HIV were out-of-care during the 2018 to 2020 period. This group was not virally suppressed and had a suboptimal number of recommended lab tests. The remaining 79%, who serve as our comparison group (i.e. those “in-care”), include all those virally suppressed, regardless of the number of lab tests they have received, and others with regular CD4 or viral load labs.

Demographics

People with HIV who were out-of-care differed demographically from those in-care. They were more likely to be Black, younger, and to report poorer self-rated physical health, among other differences (see Figure 1).

  • People with HIV who were out-of-care were more likely to be Black (50% of those out of care v. 39% of those in care) and less likely to be Hispanic/Latino (16% v. 24%) or White (26% v. 30%) than those in-care.
  • They were also younger than their in-care counterparts, with greater shares between the ages of 18-29 (12% v. 8%) and 30-39 (20% v. 16%). This finding echoes other data demonstrating lower levels of care engagement among younger people in across certain measures.
  • In addition, they were more likely to report “fair or poor” health (35% v. 27%) and less likely to report “excellent or very good” health (28% v. 37%) than those in-care.
  • Finally, compared to those in-care, they were somewhat less likely to identify as gay or lesbian (37% v. 42%), have incomes above 400% FPL (9% v. 12%), or be male (72% v. 75%), but there were no other differences in other sexual orientation, poverty, or gender categories.
  • There were no statistically significant differences based on state Medicaid expansion status or census region.
Adults with HIV Out-of-Care and In-Care, by Race/Ethnicity 

Health Coverage and Ryan White Support

People with HIV who were out-of-care were more likely to be uninsured and less likely to have private insurance than those in-care, but also less likely to receive Ryan White support (see Figure 2).

  • People with HIV who were out-of-care were more likely to be uninsured (14% v. 10%) or have Medicaid (45% v. 40%) than those in-care, and less likely to have private coverage (29% v. 35%).
  • While both groups were similarly likely to report changes to their insurance coverage over the past 12-month period (14% v. 13%), those out-of-care were twice as likely to say this led to a change in their usual source of HIV care (40% v. 19%).
  • Finally, compared to their in-care counterparts, those who were out-of-care had significantly lower levels of support from the Ryan White HIV/AIDS Program (39% v. 50%), the nation’s HIV safety-net program that provides outpatient HIV care, treatment, and support services to people with HIV who were underinsured and uninsured.
Health Insurance Coverage Among Adults with HIV, Those Out-of-Care and In-Care

Accessing care

People with HIV who were out-of-care care were less likely to have a regular provider,  more likely to be dissatisfied with recent care that they had received, and more likely to have missed appointments, than those in-care.

  • While similar shares reported they were not offered assistance in finding HIV care within 30 days of diagnosis by a professional (23% v. 18%), those who were out-of-care were about four times as likely to report not having a regular HIV provider (16% v. 4%).
  • In addition, about one-third (34%) of those out-of-care reported missing one or more HIV care appointments in the 12 months prior to the interview compared to one-in-five of those in care (22%).
  • They were also more likely to report being “very or somewhat” dissatisfied with the HIV care they received over the preceding 12 months (8% v. 3%).
Linkage to and Experiences with HIV Care Among People with HIV who are Out-of-Care and In-Care

People with HIV who were out-of-care were also more likely to report certain barriers to care engagement, including in the areas of finances, mental health, and getting to a doctor’s office than those in-care.

  • Over one-quarter of those reported that problems with money or insurance were barriers to HIV care, compared to just over one-in-ten of those in-care (27% v. 12%). Those out-of-care were also more likely to report facing problems paying medical bills (data not shown).
  • In addition, they were twice as likely to report that depression or other mental health problems made it difficult to get HIV care (24% v. 12%), and were more likely to say that personal issues, such as family or work, were barriers to care (28% v 16%).
  • About one-in-five (18%) reported that difficulty getting to a doctor’s office was a barrier to HIV care, more than double the share of those in care (8%).
  • While those out-of-care generally reported more barriers to access, they were also more likely to say they delayed care because they felt well, compared to their in-care counterparts (20% v. 7%).
Barriers to HIV Care in the Preceding 12 Months Among Adults with HIV, Those Out-of-Care and In-Care

People with HIV who were out-of-care were less likely to report being on antiretroviral therapy, despite the recommendation that such treatment be started as soon as possible after diagnosis, and were more likely to report missing ARV treatment doses.

  • One-in-five (21%) of those out-of-care reported they were not currently taking ARVs compared to just 2% of those in-care.
  • In addition, of those who did report taking ARVs, 19% reported missing three or more doses in the past 30 days, compared to 13% of those in-care.
  • While 66% of those who were out-of-care were familiar with the concept of treatment as prevention (i.e. that when someone is virally suppressed due to consistent ARV use, they cannot transmit HIV), one-third were not. In contrast, nearly three-quarters (72%) of those in-care were familiar with the concept.
Experiences with Antiretrovirals (ARVs) Among Adults with HIV, Those Out-of-Care and In-care 

Reasons for missing ARV doses were generally similar between those in and out of care, although there were some exceptions, particularly with respect to mental health challenges.

  • For those who were out-of-care, the most common reported reason for missing an ARV dose was forgetting it (63%), followed by a change in daily routine or being out of town (42%), and being asleep (35%). Additionally, about one-in-five reported they had a problem getting a prescription or a refill (21%). Others reported that use of alcohol or drugs (11%) or being too sick or in the hospital (7%) got in the way of taking ARVs. In each case, these were similar to reports from those in-care.
  • However, those who were out-of-care were more likely to report the following reasons for not taking ARVs than those in-care: feeling depressed or overwhelmed (23% v. 16%), not feeling like taking the medications (17% v. 12%), , experiencing side effects (13% v. 10%), and having problems paying for the medication (9% v. 5%).
Reasons Adults with HIV Reporting Missing an ARV Dose in the Past 30 Days, Among Those Out-of-Care and In-Care

Unmet needs for HIV ancillary services

More than half (56%) of people with HIV who were out-of- care had at least one unmet ancillary care need, across three domains, compared to 43% of the in-care population. Unmet need was higher overall as well as in each domain:

  • Clinical support services, including case management, adherence counseling, medication through ADAP, peer group, patient navigation services (24% v. 14%)
  • Non-HIV medical/behavioral services, including dental care, mental health services, drug/alcohol counseling/treatment, and domestic violence services (35% v. 27%)
  • Subsistence services, including SNAP, WIC, meal or food services, transportation assistance, or shelter/housing services (34% v. 22%).
Unmet Ancillary Care Service Needs Among Adults with HIV, Those In-Care and Out-of-Care
  • Specifically, people with HIV who were out-of-care had higher levels of unstable housing or homelessness (32% v. 18%) and hunger/food insecurity (27% v. 18%) over the preceding 12 months.3 
Experiences of Unstable Housing and Food Insecurity in Prior 12 months Among Adults with HIV, Those In-Care and Out-of-Care

Discussion

Identifying people with HIV who are not in HIV care is a first step towards engaging or reengaging them and addressing their unmet needs. While relevant demographic details may help to better design programs for and reach these individuals, there has been limited data available on this population. This analysis provides nationally representative data on people with HIV who are out-of-care, defined as those who were not virally suppressed and did not receive a minimum number of laboratory tests within the prior year, to better understand their demographics and experiences.  We find that in the 2018 to 2020 period, this population was disproportionally younger, uninsured, lower income, and Black. They were also much less likely to be on antiretroviral therapy and many faced overlapping and intersectional structural barriers that can further challenge HIV care engagement and prioritization, including unmet needs for basic, subsistence services such as food, housing, and financial security. That fact that those who were out-of-care were also less likely to be receiving services from the Ryan White Program is notable because the program is a potential resource for reaching this very population with engagement and retention services and in addressing at least some unmet ancillary care needs, though the program is constrained by financial limitations. Additionally, there were substantial knowledge gaps with respect to treatment as prevention, information that may help encourage care engagement when individuals learn they are able to prevent transmission of HIV to sexual partners.

Unless large shares of people with HIV are engaged in care and treatment, it will not be possible to meet most of the goals in the national HIV/AIDS Strategy and the Ending the HIV initiative (e.g. preventing new infections, reducing disparities, etc.). Progress on these efforts has been somewhat stalled in the U.S., which lags behind peer countries in terms of the national viral suppression level. Reaching and engaging people with HIV who are not engaged in care and not yet virally suppressed, will involve addressing the complex, systemic barriers they face, and which have impeded not only their health and wellbeing but the HIV response in the U.S. more broadly.

Methodology

Data on people with HIV are based on 2018 and 2019 data cycles (which cover data through part of 2020) from the Medical Monitoring Project (MMP), a Centers for Disease Control and Prevention (CDC) surveillance system which produces national and state-level representative estimates of behavioral and clinical characteristics of adults with diagnosed HIV in the United States.

MMP employs a two-stage, complex sampling design. First, jurisdictions are selected from all U.S. states, the District of Columbia, and Puerto Rico using a probability proportional to size sampling strategy based on AIDS prevalence at the end of 2002, such that areas with higher prevalence had a higher probability of selection. Next, adults (aged 18 years and older) with diagnosed HIV were sampled from selected jurisdictions from the National HIV Surveillance System (NHSS), a census of U.S. persons with diagnosed HIV. During the 2018 and 2019 MMP data cycles, data came from: California (including the separately funded jurisdictions of Los Angeles County and San Francisco), Delaware, Florida, Georgia, Illinois (including the separately funded jurisdiction of Chicago), Indiana, Michigan, Mississippi, New Jersey, New York (including the separately funded jurisdiction of New York City), North Carolina, Oregon, Pennsylvania (including the separately funded jurisdiction of Philadelphia), Puerto Rico, Texas (including the separately funded jurisdiction of Houston), Virginia, and Washington.

Data used in this analysis were collected via telephone or face-to-face interviews and medical record abstractions during the following periods:

  • 2018 data was collected between June 1, 2018–May 31, 2019
  • 2019 data was collected between June 1, 2019–May 31, 2020

The response rate was 100% at the first stage, and was 45% for each of the 2 cycles included in this analysis. Data were weighted based on known probabilities of selection at state or territory and patient levels. In addition, data were weighted to adjust for non-response using predictors of person-level response, and post-stratified to NHSS population totals by age, race/ethnicity, and sex at birth. This analysis includes information on 7,642 adults with HIV.

Of the 7,642 adults sampled, 1,215 were identified as being out-of-care (having fewer than two CD4 or viral load tests at least 3 months apart within a 12-month period) and also being virally unsuppressed (having a viral load of equal to or more than 200 copies of HIV per milliliter of blood).

Because respondents in MMP may indicate more than one type of coverage, we relied on a hierarchy to group people into mutually exclusive coverage categories as follows:

  • Private coverage overall (with breakouts for employer coverage and marketplace coverage)
  • Medicaid coverage, including those dually eligible for Medicare
  • Medicare coverage only
  • Other public coverage, including Tricare/CHAMPUS, Veteran’s Administration, or city/county coverage
  • Uninsured

Differences between groups were assessed using prevalence ratios with predicted marginal means.

It is important to note that insurance coverage data were self-reported by respondents and not verified, as was receipt of Ryan White support. In addition, by relying on a hierarchy to group individuals into coverage categories, it is possible individuals were grouped into a coverage category that was not their dominant payer over the course of a year.

Acknowledgments

The authors wish to thank Dr. Sharoda Dasgupta, Stacy Crim, Tamara Carree, and Dr. Linda Beer of the Centers for Disease Control and Prevention (CDC), who were instrumental in this work in providing access to data, guidance, and conducting statistical analysis.

  1. A CD4 test is a laboratory test that measures the number of CD4 cells (also known as T cells) in a blood sample. CD4 count is a key laboratory indicator of immune function and indicates HIV stage progression as well as response to HIV treatment. ↩︎
  2. For example, see: Centers for Disease Control and Prevention. Monitoring selected national HIV prevention and care objectives by using HIV surveillance data—United States and 6 dependent areas, 2020. HIV Surveillance Supplemental Report 2022;27(No. 3). https://www.cdc.gov/hiv/library/reports/hiv-surveillance/vol-27-no-3/index.html ↩︎
  3. People were considered to have experienced unstable housing if they reported any of the following during the preceding 12 months: moving in with others due to financial issues, moving 2 or more times, or being evicted. People were considered to have experienced homelessness if they experienced any of the following during the preceding 12 months: living on the street, in a shelter, in a single-room–occupancy hotel, or in a car. People were considered to be food insecure if they reported being hungry and not eating because they did not have enough money for food during the past 12 months  Centers for Disease Control and Prevention. Data Tables: Quality of Life and HIV Stigma— Indicators for the National HIV/AIDS Strategy, 2022–2025, CDC Medical Monitoring Project, 2017–2020 Cycles. HIV Surveillance Special Report 30. Published September 2022. https://www.cdc.gov/hiv/pdf/library/reports/surveillance/cdc-hiv-surveillance-special-report-number-30.pdf. ↩︎

A Year After Dobbs: Policies Restricting Access to Abortion in States Even Where It’s Not Banned

Authors: Mabel Felix and Laurie Sobel
Published: Jun 22, 2023

Almost one year after the Supreme Court overturned Roe v. Wade and Planned Parenthood v. Casey, abortion laws and access to abortion are uneven across the country. With both Casey and Roe no longer the legal standard, many states have banned abortion. However, the legality of abortion in a state does not tell the whole story. Many states without bans still have abortion regulations that create significant barriers to access. State abortion regulations such as gestational limits early in pregnancy, mandatory waiting periods and ultrasounds, bans on telehealth for abortion care, parental consent requirement for minors, and restricting the pool of providers to licensed physicians serve to limit access to abortions in states that have not instituted outright bans.

Most States Without Active Abortion Bans Have at Least One Abortion Restriction

Gestational Limits

Five states have gestational limits early in pregnancy. In Georgia, abortion is banned after 6 weeks from the last menstrual period (LMP), before most people know they are pregnant. A 12-week LMP ban recently passed and went into effect in Nebraska, and North Carolina has a 12-week ban slated to go in effect on July 1st, 2023. Florida and Arizona ban abortion after 15 weeks LMP. Florida’s Governor has also signed a 6 -week LMP ban which may go in effect after the Florida Supreme Court rules on whether the 15-week ban is permissible under the state constitution. Although most abortions happen before 10 weeks of pregnancy, states with gestational limits earlier in pregnancy also have other restrictions in place that constrain access to abortion by delaying it. For instance, in states where telemedicine for abortion is banned and there are waiting periods in place, a pregnant patient may no longer meet the gestational limit by the time they are able to get an appointment to get their abortion.

Seven more states have gestational limits later in pregnancy, but before viability, a point that varies from person to person and also by the medical resources that are offered in their community, but is generally estimated to be at around 24 weeks LMP. States with these gestational limits are Utah, which bans abortions after 18 weeks LMP and Indiana, Iowa, Kansas, North Carolina, Ohio, and South Carolina, which currently ban abortion after 22 weeks LMP.

Waiting Periods and Ultrasound Requirements

Seven states – Arizona, Florida, Georgia, Indiana, Iowa, Kansas, and North Carolina, all of which have pre-viability gestational limits – also require clinicians to perform ultrasounds before providing abortion care. These laws often require that the ultrasound be performed by the same clinician that will be providing the abortion care, even though there is no medical rationale for this requirement. Thirteen states have mandatory waiting periods between the initial required counseling session (at which an ultrasound may also be required) and the appointment where the pregnancy will be terminated. These waiting periods range from 24 to 72 hours in duration. All states that have ultrasound requirements also have mandatory waiting periods. In conjunction, these requirements often result in the pregnant person having to attend two separate in-person appointments with their abortion provider. In states with early gestational limits, such as Florida, which currently bans abortions after 15 weeks LMP, these requirements may push abortion care out of reach for pregnant people.

Medication Abortion Restrictions

Restrictions on Telehealth for AbortionNine states that do not ban abortions generally have laws that effectively outlaw telehealth for medication abortion. Several states have laws that explicitly ban telehealth for abortion. Others have restrictions requiring medication abortions to take place in clinics or for the prescribing clinician to be present when the pregnant person takes the first medication in the regimen, despite the elimination of the FDA in-person requirement for medication abortion. States that require an ultrasound effectively block telehealth for abortion, since the pregnant patient must have at least one in-person visit to get the ultrasound. Regardless of the mechanisms these laws employ, their results are the same: they prevent people from accessing abortion care via telehealth. This can be especially burdensome for people who live in rural areas far from an abortion clinic, people who need to arrange child care and/or need to take time off from work for appointments, and people traveling to other states to receive abortion care.

Physician-Only RequirementsMany states only authorize physicians to provide abortion care, while others allow advanced practice clinicians (such as physician assistants and some nurses) to provide abortion care that is within their scope of practice. Laws requiring licensed physicians to provide abortion care restrict the number of providers available, despite research demonstrating that medication abortion (and aspiration abortions) are just as safe when provided by an advanced practice clinician. Currently, 15 states only authorize physicians to provide medication abortions, of these, 11 have pre-viability gestational bans. This restriction limits the credentialing of the providers that are permitted to offer abortion, and ultimately impacts access for people seeking abortions within the limited gestational period abortions are not banned.

Restrictions on Minors’ Ability to Access Abortion Care

In 15 states where abortion is not completely banned, minors must obtain the consent of their parents or legal guardian to receive abortion care. Six other states require that the parents or legal guardian of the minor be notified before the minor receives abortion care. Most states with these requirements contain provisions that allow a judge to waive the consent or notification requirement. In states with consent requirements, this leaves the determination of whether or not the minor can receive an abortion up to a judge. Judges use different criteria for judicial bypass of the consent requirement, often to the detriment of the minor. For instance, judges have prevented minors from receiving an abortion, deeming them not mature enough to make such a medical decision for themselves, despite their assertions that they do not wish to continue their pregnancies.

Even in cases where a minor is able to receive judicial bypass, the process is time-consuming and can result in delays in the timing of the abortion, even when the minor is ultimately permitted to obtain an abortion. Additionally, these restrictions have their own waiting periods, for example, requiring that notice or consent be given 24-48 hours prior to the minor receiving an abortion. Even when the minor’s parents or legal guardian grant consent, these waiting periods can delay care.

New State Law that May not Have Been Permitted Under Casey

Some states have turned to restrictions that ban certain types of abortions without directly banning abortion care. For instance, after having their abortion ban blocked in court, the Utah legislature passed a law that would have banned all abortions not provided in a hospital, effectively banning all clinic-based abortions. This ban was temporarily blocked by a state court in May 2023. Similarly, after having an abortion ban blocked in court, the Wyoming legislature passed a ban on medication abortion, which is slated to go in effect July 1st, 2023. And in Montana – where the state Supreme Court recognized in a 1999 opinion that their constitution protects the right to abortion – the legislature enacted a law banning D&E procedures (the most common abortion method after 15 weeks LMP). Enforcement of this ban has also been blocked by a state court.

Conclusion

The accessibility of abortion in any given state does not rest entirely on whether or not it is banned. In many states where abortion is not fully banned, state laws nevertheless restrict access to it. These restrictions typically sharply curtail access to abortion, and in states with several restrictions in place, they can push access to abortion effectively out of reach.

States with Abortion Restrictions