What’s at Stake for Access to Medication Abortion and the FDA in the Supreme Court Case FDA v. the Alliance for Hippocratic Medicine?

Authors: Laurie Sobel, Alina Salganicoff, and Mabel Felix
Published: Mar 21, 2024

On June 13, 2024, the Supreme Court of the United States ruled in Alliance for Hippocratic Medicine (AHM) v. FDA that the AHM does not have standing to sue the FDA for injury. However, three state Attorneys’ Generals have intervened in this case in district court, and it is unclear how this action will shape the case when it goes back to the 5th Circuit Court of Appeals and then back to the originating federal district court.

On March 26, 2024, the Supreme Court is scheduled to hear oral arguments in Food and Drug Administration (FDA) v. Alliance for Hippocratic Medicine (AHM), and Danco Laboratories LLC v. AHM. While the Supreme Court stated in the Dobbs decision that it “returns the issue of abortion to the people’s elected representatives,” the outcome of this case could limit access to medication abortion throughout the country, including in states where abortion is legal and protected. The interest in this case expands far beyond the issue of access to mifepristone and abortion; many people are watching whether the Court will block the FDA’s independence in determining the conditions required to assure a drug’s safe use— something the Court has never done before.

What Is the Case?

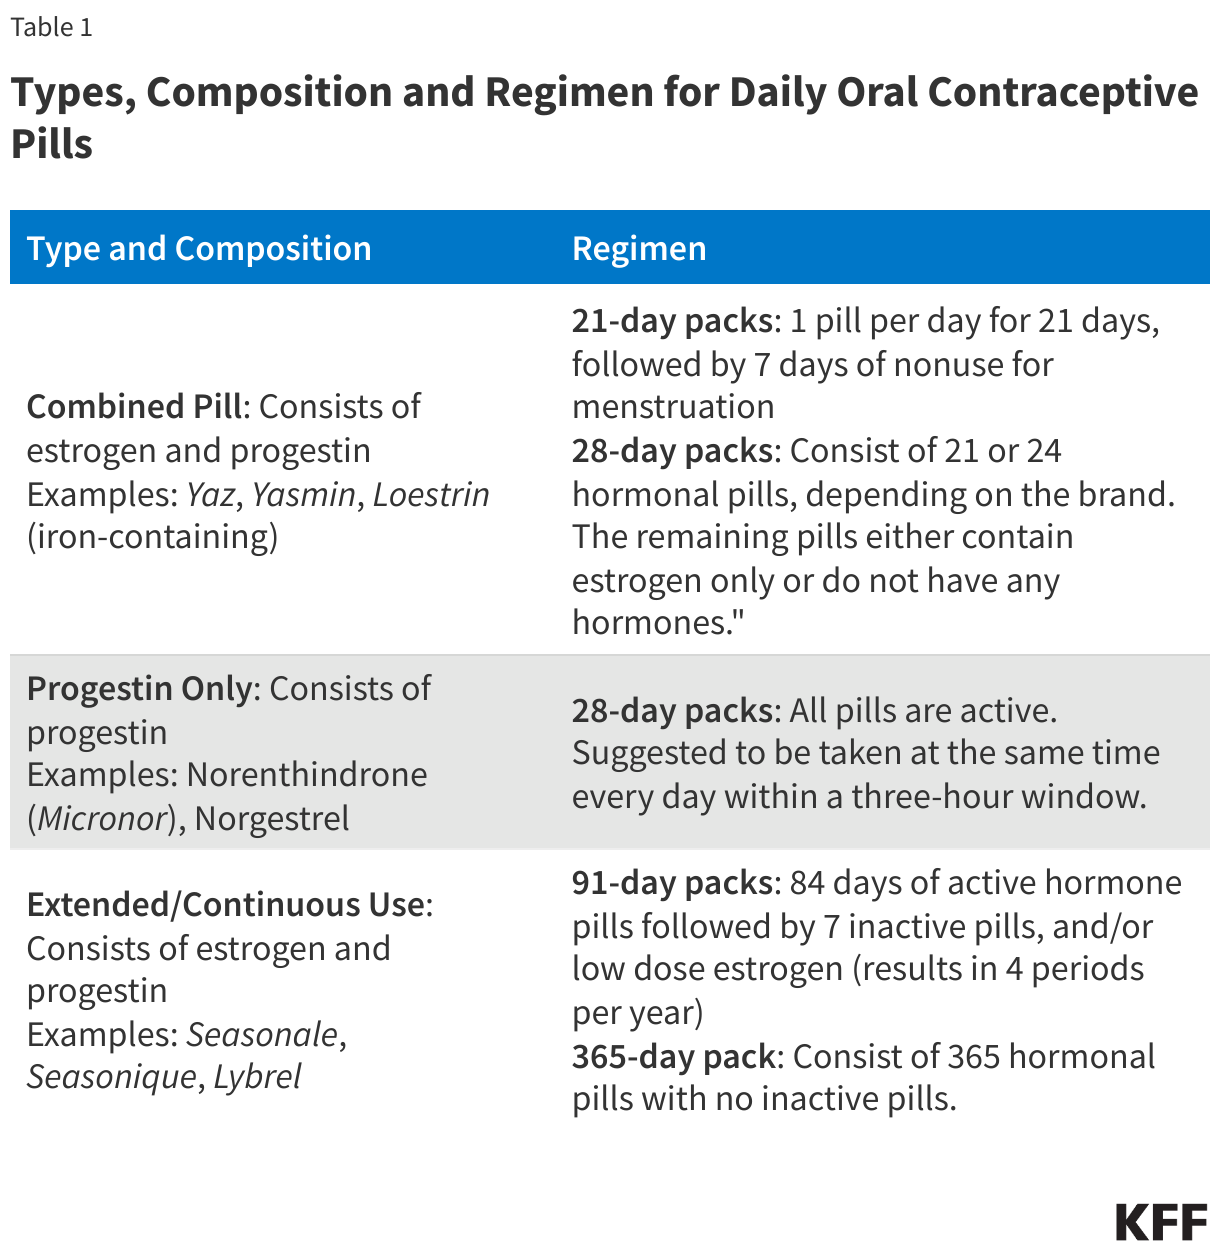
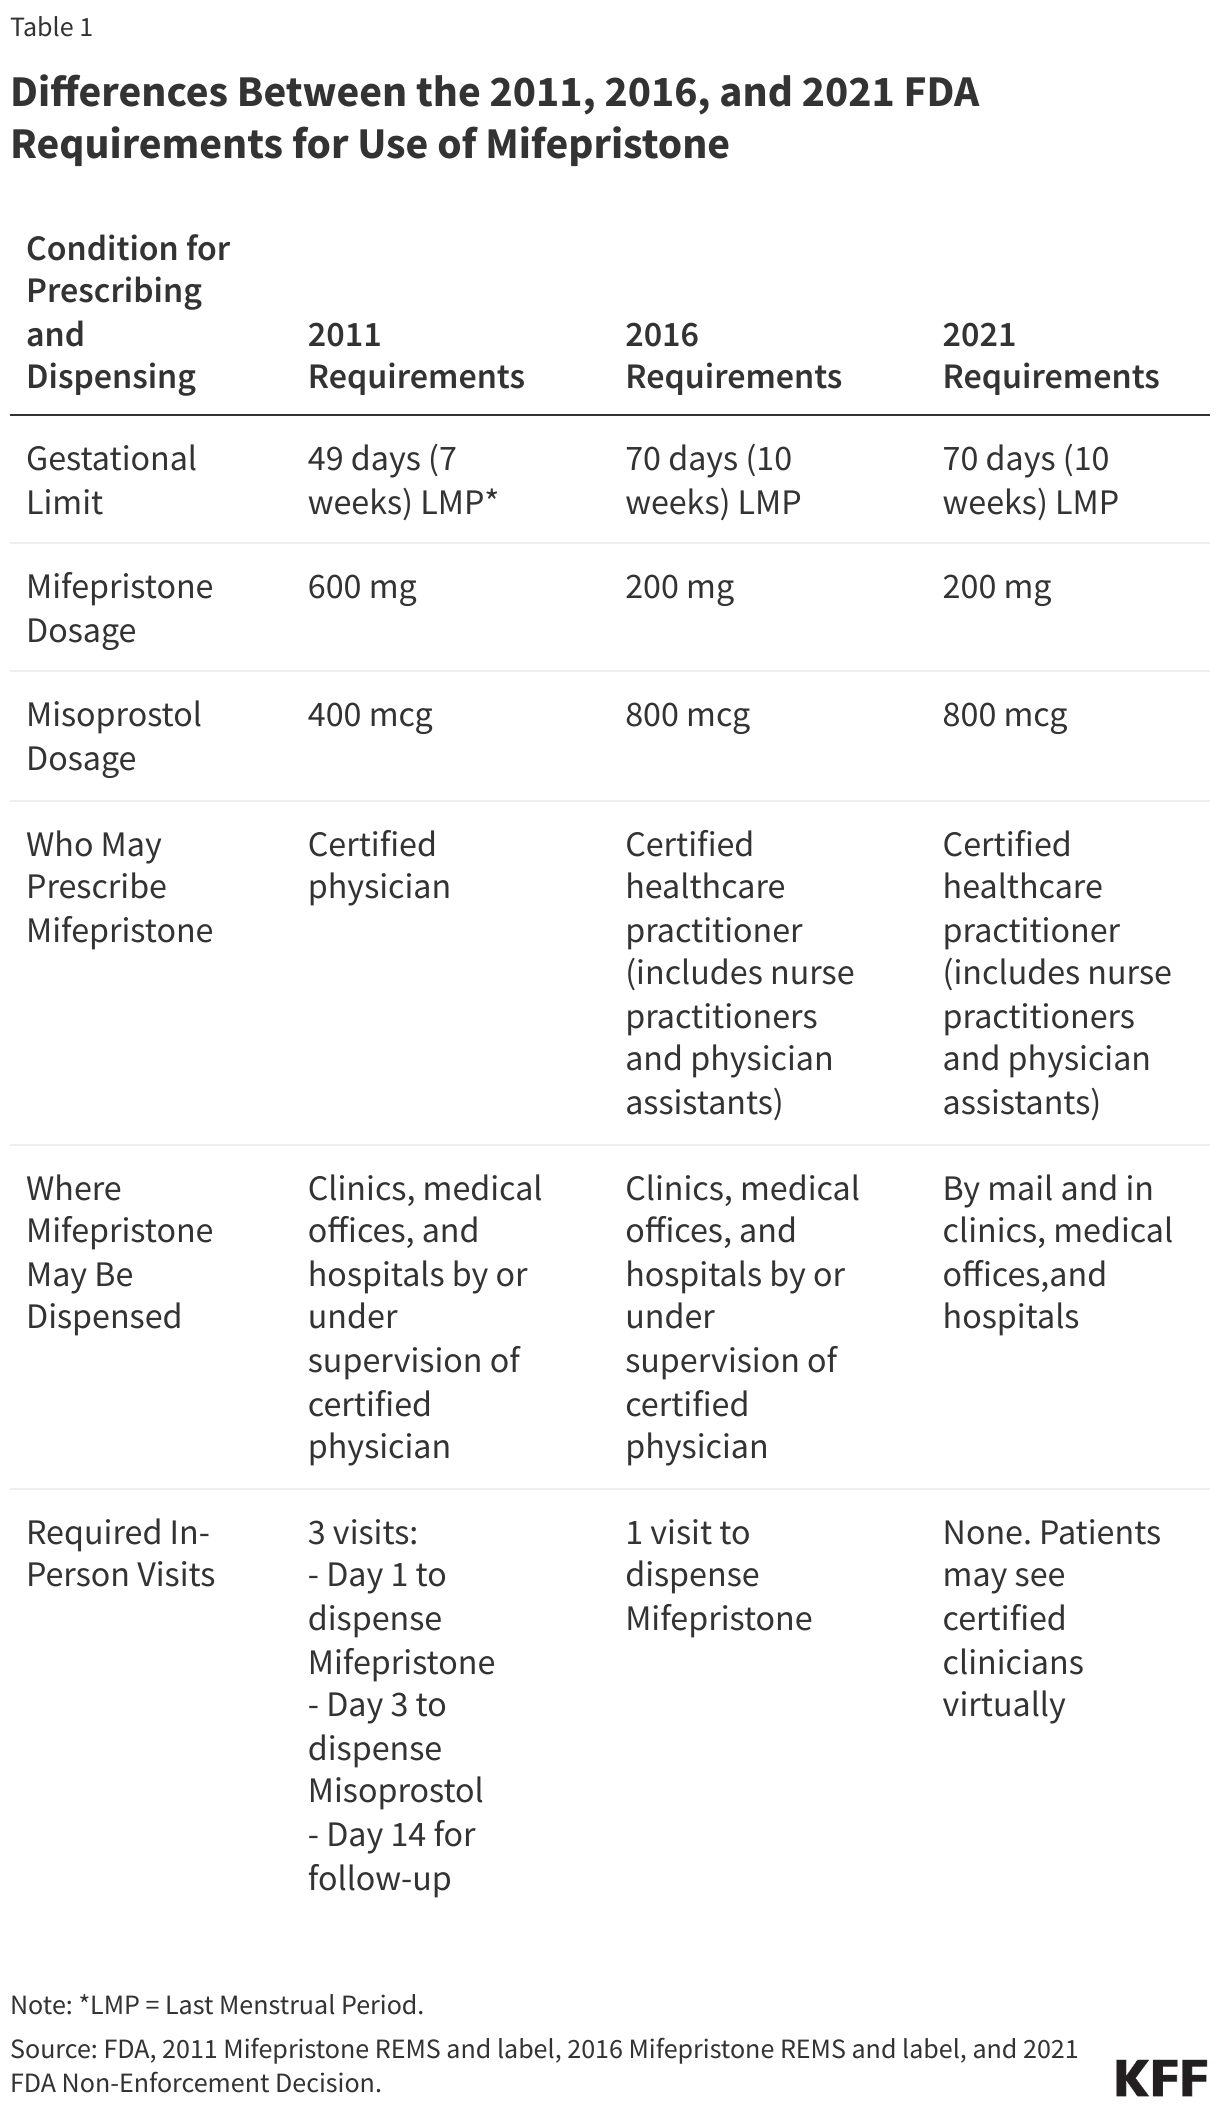
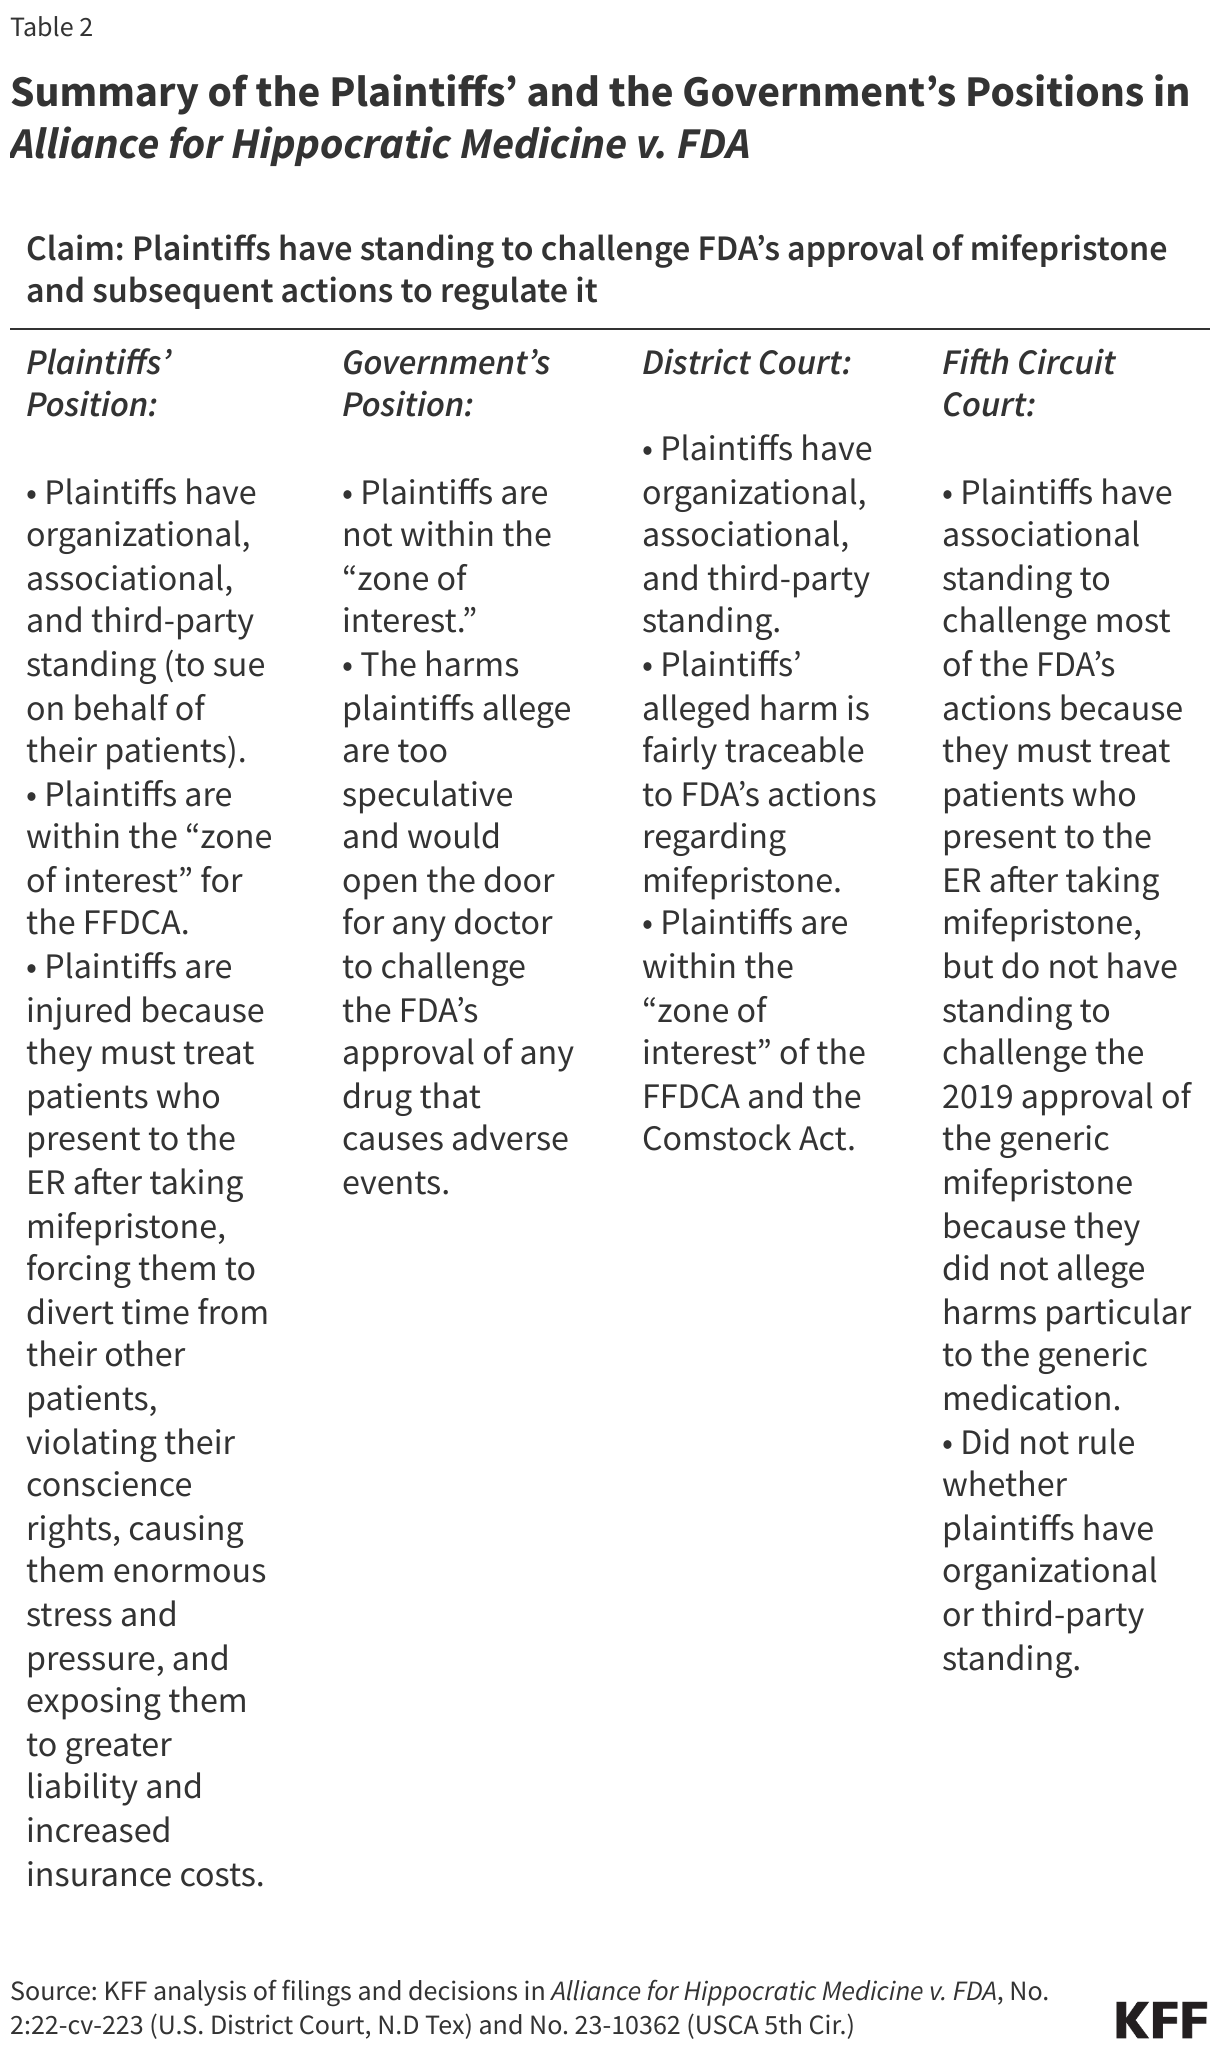
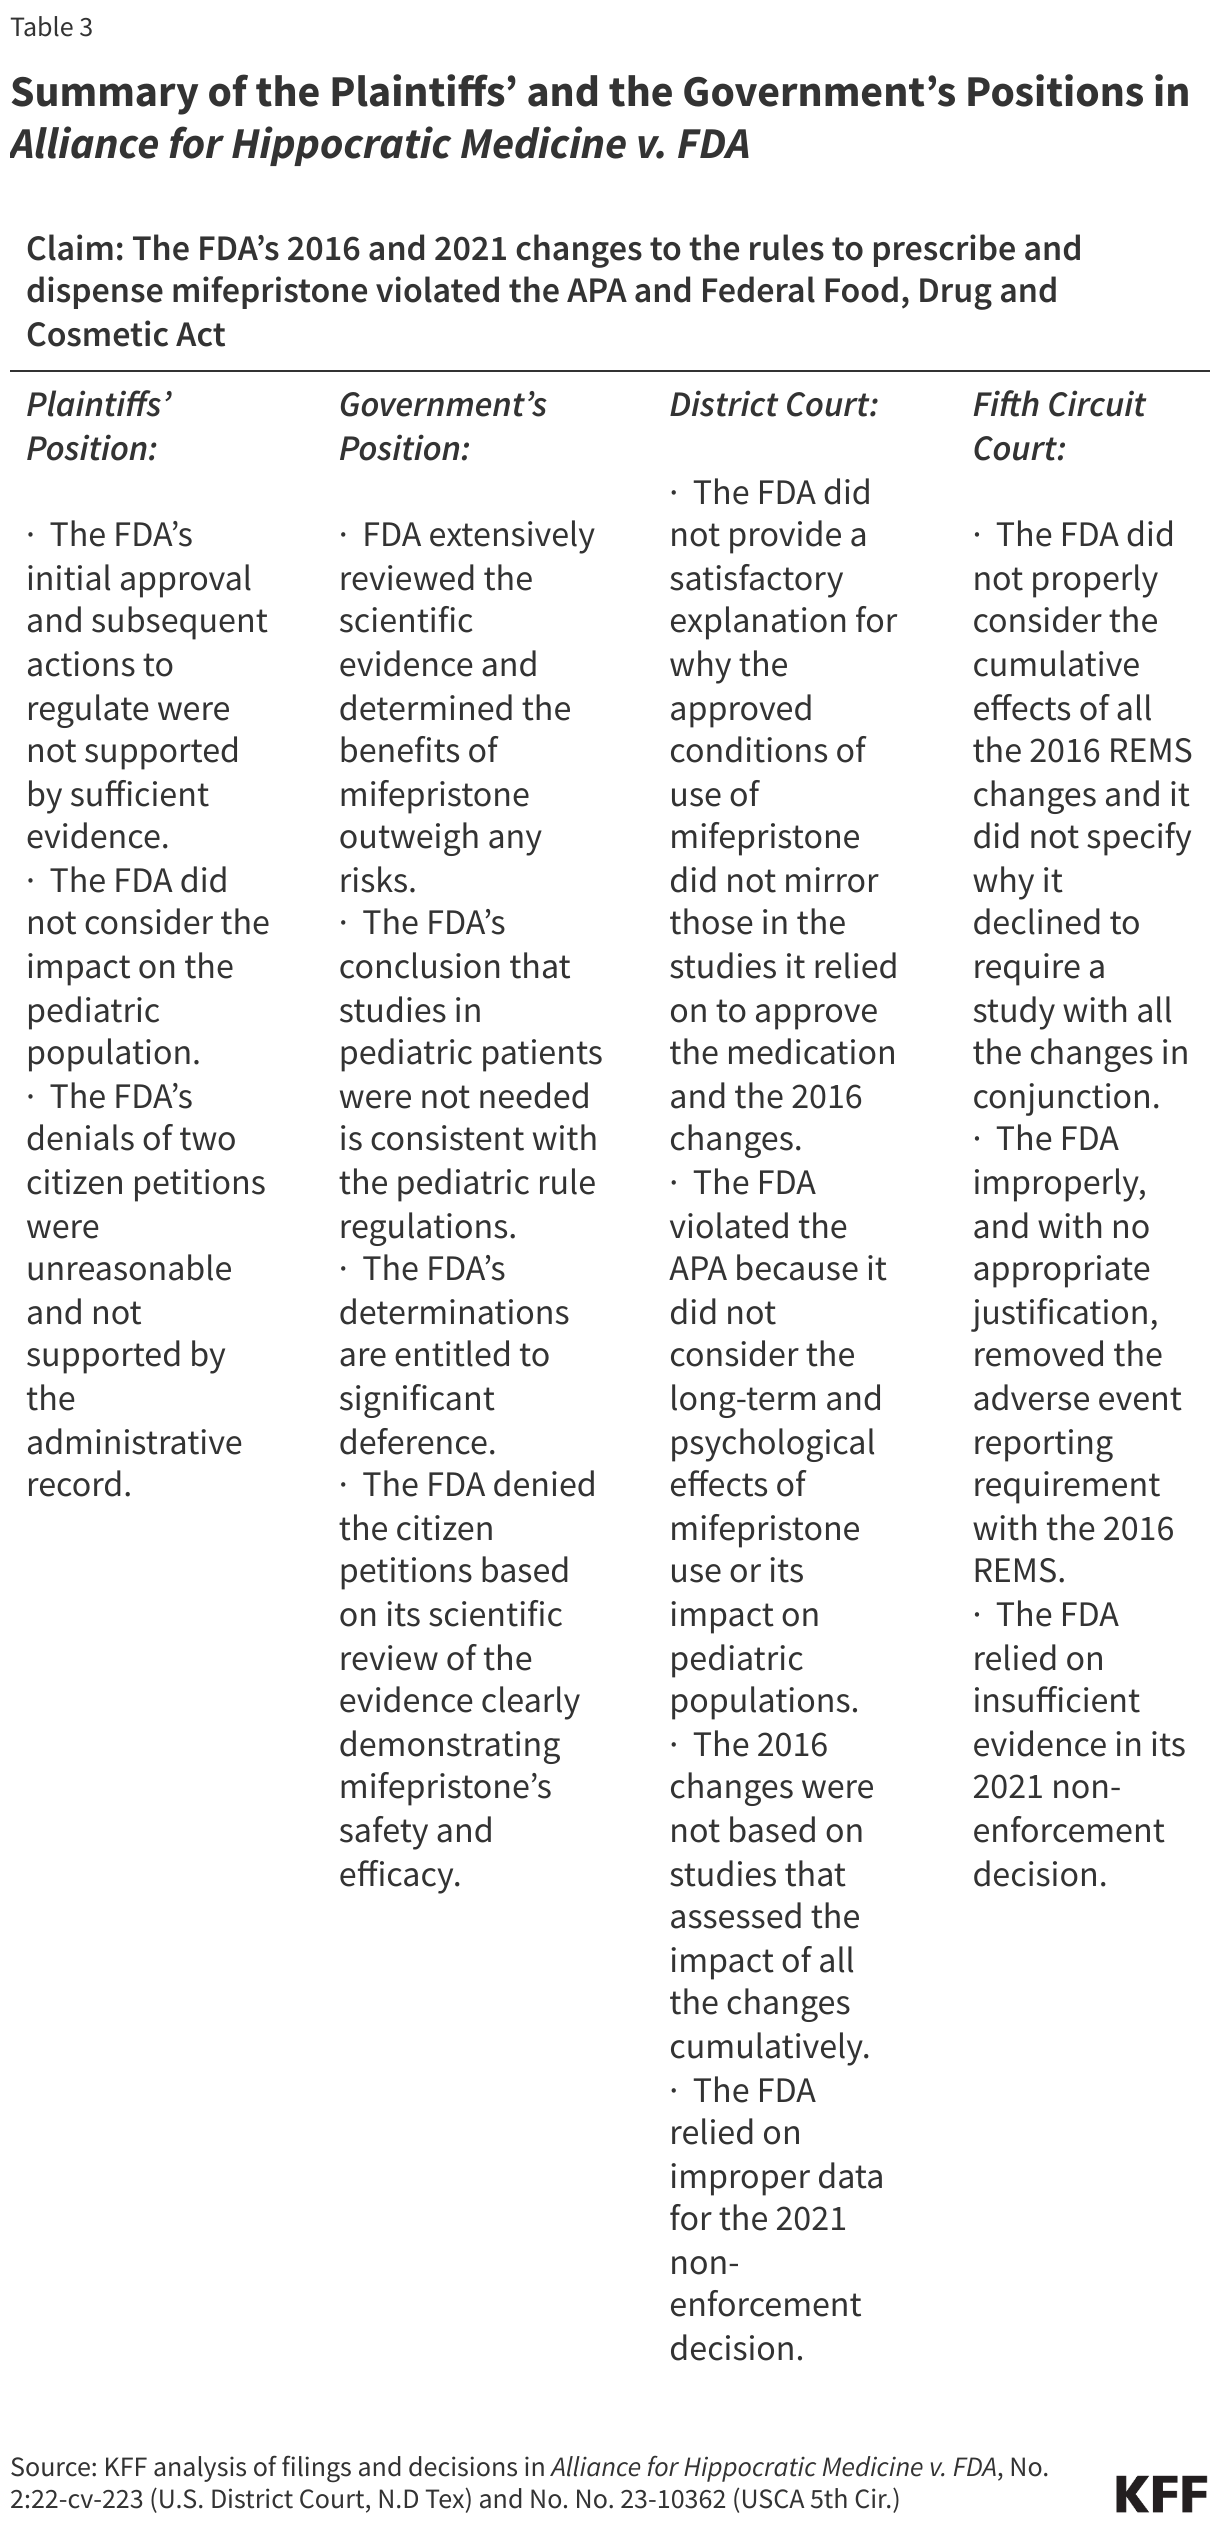
In the case, AHM v. FDA, the plaintiffs contend the FDA did not act within its authority when it approved mifepristone (one of the two drugs used in the medication abortion regimen) and also when it revised the protocol for prescribing and dispensing the medication in 2016 and 2021 (See Table 1). The plaintiffs also claim that the approval violated an 1873 anti-obscenity law, the Comstock Act, which prohibits the mailing of any medication used for abortion. The plaintiffs claim they have legal standing, arguing they are injured because they must treat patients who present to the emergency room after taking mifepristone, forcing them to divert time from their other patients and violating their conscience rights.

Danco, the manufacturer of Mifeprex, the brand name of mifepristone, has intervened in this case and is a defendant along with the FDA. The FDA and Danco claim the FDA approved changes in the Risk Evaluation and Mitigation Strategies (REMS) (special conditions FDA applies to some drugs) and other conditions for mifepristone use in 2016 after extensively reviewing the scientific evidence and 15 years of data reflecting the drug’s safety profile. Based on numerous studies, the FDA concluded mifepristone was safe to use up to 70 days gestation, misoprostol was effective and safe to use at home, and the efficacy and safety was the same with physicians and non-physician providers. The FDA also determined that the continued reporting of non-fatal adverse events by prescribers under the REMS was not warranted because of mifepristone’s safety record. During the COVID-19 public health emergency, the in-person dispensing requirement for mifepristone was enjoined by a court order for 6 months from July 2020 to January 2021. Based on the research and data collected during this period, the FDA found no indication that modification of the in-person dispensing requirement had increased adverse events. In April 2021, the FDA notified the American College of Obstetricians and Gynecologists (ACOG) that the agency would exercise enforcement discretion of the in-person dispensing requirement. In January 2023, the FDA formally amended the REMS, to permanently remove the in-person dispensing requirement, and adding a requirement that certified pharmacies can dispense mifepristone.

Differences Between the 2011, 2016, and 2021 FDA Requirements for Use of Mifepristone

Lower Court Rulings

On April 7, 2023, Federal District Court Judge Matthew Kacsmaryk issued a ruling that would have blocked the FDA’s 2000 approval of mifepristone (See Tables 2 and 3). He ruled that the plaintiffs had standing to sue and were likely to succeed on the merits on their claims that the FDA acted “arbitrarily and capriciously” when approving mifepristone, and when it made changes to the rules for prescribing and dispensing the medication in 2016 and 2021. In addition, Judge Kacsmaryk found the plaintiffs had a substantial likelihood of prevailing on their claims that the FDA’s actions violate the Comstock Act by allowing mifepristone to be mailed to patients.

The FDA appealed the district court’s ruling to the 5th Circuit Court of Appeals which also found that the plaintiffs have standing to bring the case but did not uphold the decision to order FDA to revoke mifepristone’s approval. Instead, the court ruled that the FDA acted improperly when changing the REMS. The court order would block the changes made in 2016 and 2021, rolling the dispensing and prescribing rules back to those in place in 2011. The effect of this would be to require in-person dispensing of the medication and permit only physicians to prescribe and dispense the medication, blocking the current ability of physicians, certified providers, and pharmacies to mail the drug. The 5th Circuit Court of Appeals did not base their decision on the Comstock Act, but the plaintiffs and the defendant both appealed this decision to the Supreme Court.

What is the Supreme Court Considering?

The Supreme Court agreed to review the FDA’s appeal of the 5th Circuit decision but denied the plaintiffs’ appeal requesting the Court to review the FDA’s original approval of mifepristone from 2000. Therefore, the Court’s review is limited to two major questions: whether the plaintiffs have standing to bring the case and whether the FDA’s 2016 and 2021 actions to revise the Risk Evaluation and Mitigation Strategies (REMS) and other conditions were arbitrary and capricious. The Court is not reviewing the FDA’s initial approval of mifepristone in the year 2000 nor the plaintiffs’ original claim that the FDA’s actions violated the Comstock Act.

Do the Plaintiffs Have Standing?

The first question the court must consider is whether the plaintiffs have legal standing to bring this case; without legal standing, the case does not proceed. In this case, the plaintiffs are doctors, associations and organizations that oppose abortion; none of them prescribe mifepristone. The issue of standing in the case has caught the attention of many pharmaceutical companies, which rely on the FDA’s decisions regulating drugs. Every drug has side effects. Many court watchers are concerned that if the Court rules that these plaintiffs have standing, then the door will be opened to anyone to bring a case against the FDA’s approval of any drug. The Pharmaceutical Companies, Executives, and Investors warn, “If allowed to stand, the decision below will invite a flood of meritless challenges to the FDA’s drug safety and efficacy decisions, including those brought by parties with no concrete interest at stake.”

Summary of the Plaintiffs’ and the Government’s Positions in Alliance for Hippocratic Medicine v. FDA

The plaintiffs contend they are injured because the FDA has made mifepristone widely available and based on statistical probability, one of their members will likely have to treat a patient with side effects from taking mifepristone, which will force one of their members to act against their conscience in helping to terminate a pregnancy. The doctors assert that their injury is based on:

    • having to divert time and resources away from their regular patients;
    • mifepristone patients exposing them to greater liability and increased insurance costs;
    • violation of their conscience when being forced to participate in an elective abortion and
    • enormous stress and pressure.

The FDA asserts that the plaintiffs have failed to show any concrete injury: “All of respondents’ theories of injury reduce to the assertion that FDA’s changes to mifepristone’s conditions of use could marginally increase the risk that one of respondents’ seven identified doctors may be called upon to treat a woman who has chosen to take mifepristone and experiences an exceedingly rare serious adverse event—a scenario that can occur only at the end of a long chain of contingencies involving independent decisions by third parties.”

The 5th Circuit found that the doctors’ injuries are legally recognizable. If the Supreme Court limits standing based on the conscience violations injuries, then future litigation might be based on challenging the FDA’s approval of other drugs perceived to be controversial such as PrEP or medications for gender affirming care.

In their defense, the FDA and Danco contend that federal law allows doctors to refuse care based on a conscientious objection. In response, the AHM cites to the July 2022 Department of Health and Human Services guidelines  issued by the Biden Administration after the Dobbs ruling, which states that the Emergency Medical Treatment and Active Labor Act (EMTALA) requires hospitals to provide abortions as stabilizing care when that care is necessary to stabilize a patient. The 5th Circuit agreed with AHM that the federal law does not alleviate the doctors’ conscience injury. (The Supreme Court is considering a different case about the interaction between EMTALA, the federal law that requires that hospitals to stabilize the health of patients presenting at emergency room and Idaho’s abortion ban this term.)

Were the FDA’s 2016 and 2021 Actions Arbitrary and Capricious?

Congress has authorized the FDA to review and approve drugs. At issue in this case, is the standard by which the FDA may alter the conditions for use, including the REMS, for a drug. The statute authorizing the FDA to use and modify REMS requires the FDA to balance the drug’s risks against the burden on patient access but does not prescribe a specific methodology for this review. AHM claims the FDA violated the Administrative Procedures Act (APA) when it failed to consider the cumulative effect of all the 2016 changes or to provide a satisfactory explanation for its decision not to study the cumulative effect of the changes.

The 5th Circuit agreed with AHM and ruled that the FDA failed to examine the cumulative effect of all the proposed changes in 2016 through a single controlled study and did not explain why it did not do so. In addition, they found that in 2021, the FDA relied on incomplete data because, in 2016, the FDA removed the requirement for prescribers to report adverse events beyond the FDA’s standard reporting requirements. Further, the court found that the FDA relied on research that did not affirmatively support the suspending of the in-person dispensing requirement. The FDA maintains there is no requirement for the agency to conduct one study with all the proposed changes. The FDA contends that “[a] reviewing court’s only role is to ensure ‘that the agency has acted within a zone of reasonableness’ and ‘has reasonably considered the relevant issues and reasonably explained the decision.’” In addition, the FDA reports that the studies they relied on to make the REMS modifications support their conclusions that mifepristone is safe and effective without the need for mandatory in-person dispensing. They further maintain the Court should defer to their judgment as the agency has the expertise in this area–not the Court.

Summary of the Plaintiffs’ and the Government’s Positions  in Alliance for Hippocratic Medicine v. FDA

Many of the “friend of the court briefs” (amicus curiae) warn that the Supreme Court could destabilize the regulatory process for approving drugs in the U.S. For example, The Pharmaceutical Research and Manufacturers of America warns that the 5th Circuit decision “threatens to disrupt the cycle of drug development and to upend the investment backed expectations of industry that ultimately undergird the availability of innovative medicines on which patients rely.” However, presenting an opposing perspective, former leaders of the Trump Administration claim that the FDA gave Danco special treatment, and if allowed to stand, other companies will expect this treatment.

Potential Impact on Medication Abortion Access and the FDA

The Supreme Court is specifically reviewing the rules that allow people to access mifepristone via telehealth without an in-person visit. Medication abortion accounts for nearly two thirds (63%) of abortions in the United States. In 2022, 789 facilities offered medication abortion, and 243 of these facilities in 27 states provided telehealth medication abortions with an option to mail the abortion pills to the patients.

The Society of Family Planning estimates that 16% of all abortions in September 2023 were provided via telehealth, with nearly 14,000 telehealth abortions that resulted in medications being dispensed via mail. Many of these abortions were performed by virtual-only clinics that offer medication abortion through telehealth. These new clinics were not an option for abortion seekers until 2021, and the prevalence of virtual-only abortion providers has been growing since.

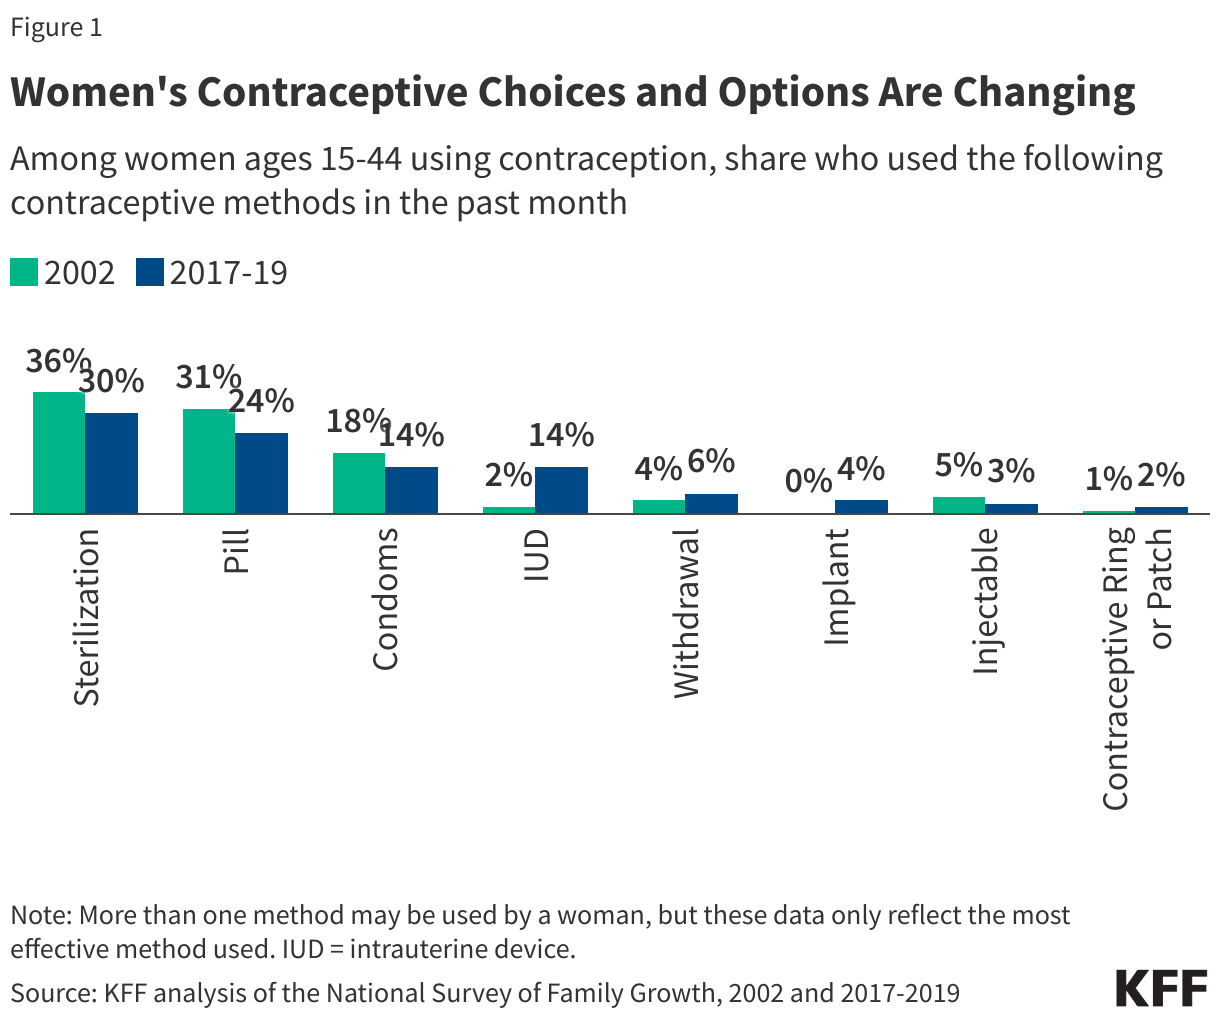
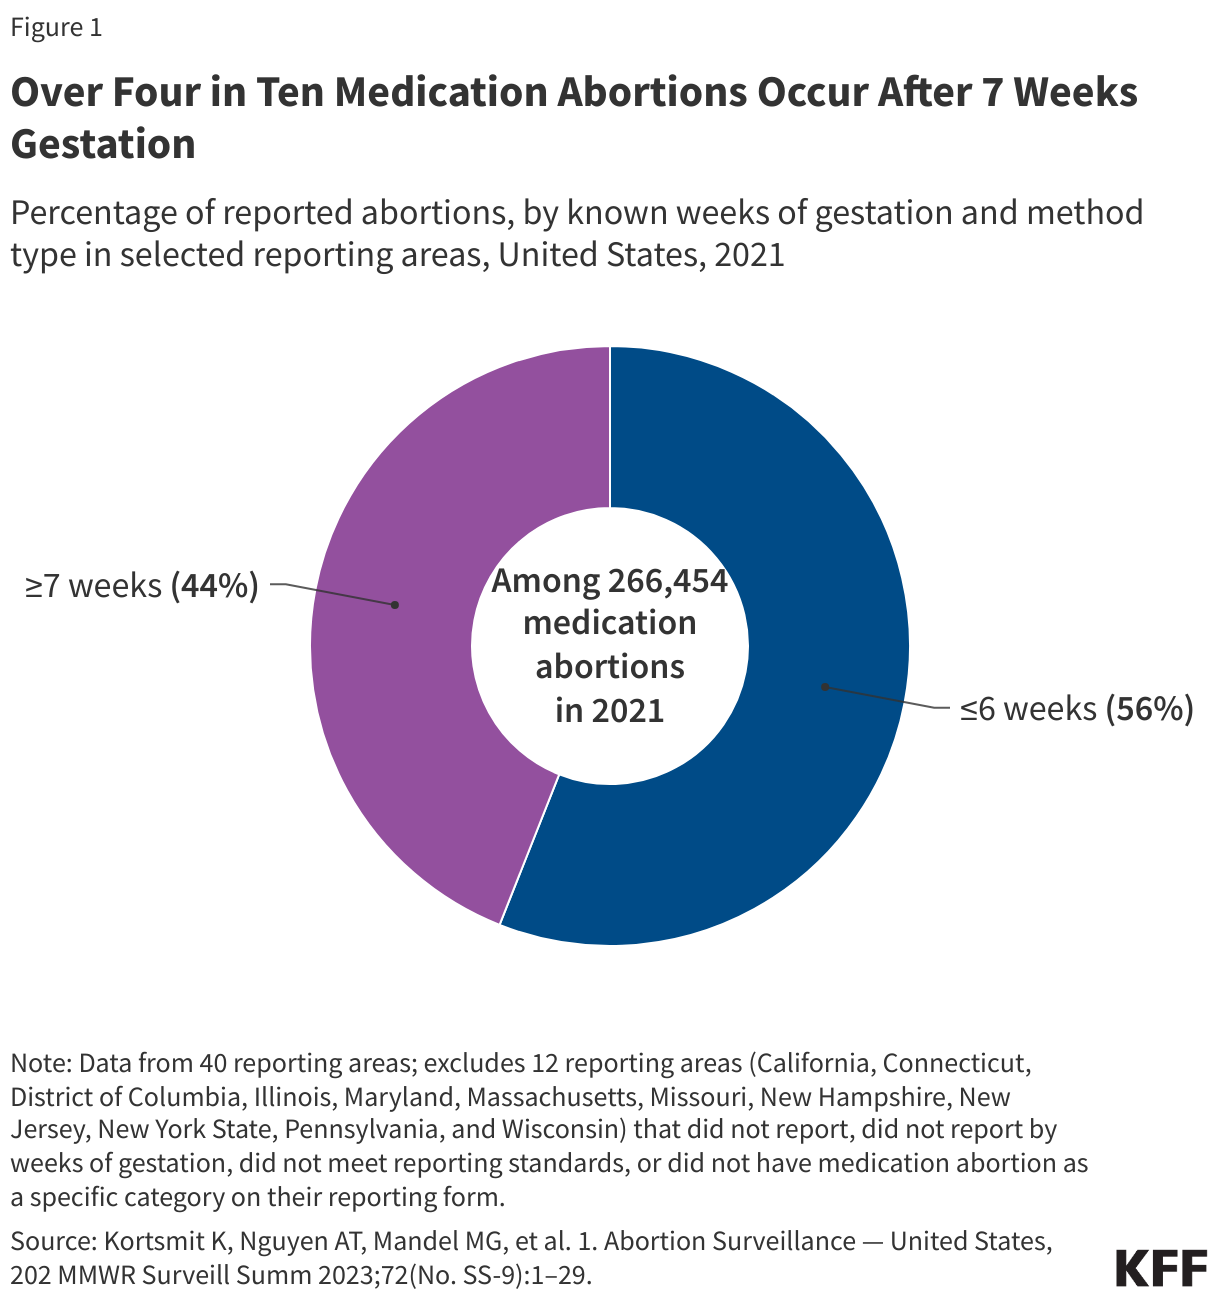
The court’s decision could also substantially reduce the number of abortions that could occur using mifepristone. The 2011 REMS permitted mifepristone to be used up to 7 weeks gestation, while the 2016 REMS expanded access to mifepristone up to 10 weeks gestation. According to the 2021 CDC abortion surveillance data, more than four in ten medication abortions occur 7 weeks and beyond (See Figure 1).

Over Four in Ten Medication Abortions Occur After 7 Weeks Gestation

If the Supreme Court affirms the 5th Circuit’s decision to roll back the requirements to the 2011 protocols, the new protocols the FDA has established removing the in-person dispensing requirement, permitting telehealth abortions, and establishing the process for pharmacies to become certified to dispense mifepristone would be eliminated.

The case also raises questions about the role of the courts in reviewing the FDA’s determinations about a particular drug. This is the first case to ask the Supreme Court to overrule an FDA decision that a drug is safe and effective. The outcome of this case could have far-reaching implications for the FDA’s authority to continue to regulate not only mifepristone, but a wide range of other drugs, including those that could be perceived to be controversial today and in the future. Depending on how the Supreme Court rules, we may see the door opened to new litigation, and a major shift in the FDA’s authority in regulating drugs.

The Availability and Use of Medication Abortion

Published: Mar 20, 2024

This factsheet was updated on March 10, 2025 to reflect policy updates and new data.

On June 13, 2024, the Supreme Court of the United States ruled in Alliance for Hippocratic Medicine (AHM) v. FDA that the AHM does not have standing to sue the FDA for injury. The Court had been asked to ascertain whether or not the FDA had violated federal law when it modified its guidelines for prescribing and dispensing mifepristone in 2016 and 2021. However, three state Attorneys’ Generals have intervened in this case in district court, and it is unclear how this action will shape the case when it goes back to the 5th Circuit Court of Appeals and then back to the originating federal district court.

On June 24th, 2022, the Supreme Court ruled on the Dobbs v. Jackson Women’s Health Organization, overturning Roe v. Wade. States can now set their own policies protecting or banning abortion without any federal standard protecting access to abortion. This has created a new focus on medication abortion as an option for expanding access to people facing barriers to abortion care.

Medication abortion, also known as medical abortion or abortion with pills, is a pregnancy termination protocol that involves taking two different drugs, Mifepristone and misoprostol, that can be safely used up to the first 70 days (10 weeks) of pregnancy according to the U.S. Food and Drug Administration (FDA).  The World Health Organization has authorized use up to 12 weeks of pregnancy. Since the FDA first approved the drug in 2000, its use in the United States has quickly grown. In 2023, 63% of abortions in the US were medication abortions. The medication abortion drug regimen approved by the FDA is available in many states across the nation, however, dispensing these pills for the purpose of terminating a pregnancy is now banned in some states. This factsheet provides an overview of medication abortion, how it is used and regulated, the role of the drug in self-managed abortions, and an analysis of the intersection of federal and state regulations pertaining to its provision and coverage.

What is a Medication Abortion?

There are two medication abortion regimens that have a long safety and efficacy record: mifepristone with misoprostol and misoprostol alone. Both involve taking oral medications to terminate a pregnancy.   

Mifepristone and Misoprostol Regimen

The most common medication abortion regimen in the United States involves the use of two different medications: mifepristone and misoprostol. Mifepristone, also known as the abortion pill, or RU-486 is sold under the brand name Mifeprex and through a generic manufactured by GenBioPro in the United States. Mifepristone works by blocking progesterone, a hormone essential to the development of a pregnancy, and thereby preventing an existing pregnancy from progressing. Misoprostol, taken 24–48 hours after mifepristone, works to empty the uterus by causing cramping and bleeding, similar to an early miscarriage. A follow-up visit can be scheduled a week or two later, to confirm that the pregnancy was terminated via ultrasound or blood test. The FDA has found that medication abortion is a safe and highly effective method of pregnancy termination. When taken, medication abortion successfully terminates the pregnancy 99.6% of the time, with a 0.4% risk of major complications, and an associated mortality rate of less than 0.001 percent (0.00064%).

The FDA first approved Mifeprex in 2000. In 2016, the FDA updated and approved a new evidence-based regimen and drug label. This regimen approves use of medical abortions for up to 70 days (10 weeks) of pregnancy (Table 1). Until 2019, mifepristone was only sold under the brand name Mifeprex, manufactured by Danco Laboratories. In 2019, the FDA approved GenBioPro, Inc.’s application for generic mifepristone. In 2021, the FDA announced they would not enforce the in-person dispensing requirement that had been in effect since the approval of mifepristone. With the new REMS in 2023, the in-person dispensing requirement was formally removed.

Misoprostol-Only Regimen

While the combined regimen of mifepristone and misoprostol for medication abortion is recommended, there is a second medication abortion protocol using misoprostolonly that is more commonly used internationally and currently not approved by the FDA. The regimen is also recommended for up to 70 days (10 weeks) of pregnancy. It involves taking 800 µg (4 pills) of misoprostol sublingually or vaginally every three hours for a total of 12 pills. Research has shown the misoprostol-only regimen to be a safe and highly effective method of pregnancy termination, however it may result in a higher incidence of side effects, particularly diarrhea, fever and chills. When taken, the misoprostol-only regimen successfully terminates the pregnancy approximately 80-100% of the time, with a complication rate of less than 1%. Some U.S. telehealth organizations have been providing the misoprostol-only regimen as an option for medication abortion for a number of years.  

FDA Mifepristone and Misoprostol Regimen

Risk Evaluation and Mitigation Strategies (REMS)

In 2011, the FDA added a Risk Evaluation and Mitigation Strategy (REMS) to the dispensing requirements for mifepristone permitting only medical providers who had obtained certification from the manufacturer to prescribe and directly dispense the drug. This requirement has had the effect of limiting the number of clinicians able to prescribe medication abortions, but also necessitated an in-person visit to a health care setting and meant patients could not obtain the medication from a retail pharmacy or by mail.

On December 16, 2021, the FDA removed the in-person dispensing requirement for mifepristone and expanded the distribution to include certified pharmacies in addition to certified clinicians. This change removed the requirement to dispense the medication in person and expanded the opportunity for telehealth in states that have not banned abortion. Despite the change to the in-person requirement, prescribers are still required to be certified by the manufacturers. On January 3, 2023, the FDA approved a protocol for pharmacies, allowing those that have been certified by the manufacturers to dispense mifepristone directly to patients. In March 2024, two major pharmacy chains in the U.S. announced they had become certified to dispense mifepristone and would start dispensing the medication to patients in certain states later that month. Table 2 shows the change in REMS from 2011 to 2023.

Risk Evaluation and Mitigation Strategy (REMS)0

State Regulations and Availability

State laws that ban or restrict abortion apply to medication abortion just as they apply to abortion procedures. There are currently large swaths of the country, mostly in the South and Midwest that ban abortion. Even though the federal FDA has approved mifepristone as safe and effective, following the Dobbs decision, the availability of medication abortion today depends on state laws. Even before the Dobbs decision, however, some states restricted access to medication abortion either by blocking the use of telehealth abortions by mandating in-person visits for abortions, imposing requirements for in-person dispensing, or limiting the kinds of clinicians who could dispense the pills (only permitting MDs to dispense). In many states these laws are now superseded by state laws that ban abortion.

Box 1: Conflict Between Federal and State Regulations

There are two challenges in federal court to abortion prohibitions and restrictions on federal preemption grounds. The maker of a generic mifepristone medication, GenBioPro, Inc., is challenging West Virginia’s total abortion ban, and an ob-gyn, Dr. Bryant, is challenging the abortion restrictions in North Carolina, which include requirements that Mifepristone be dispensed in person by a physician after state-mandated counseling session and a 72-hour waiting period. In both cases, plaintiffs argue that the FDA’s authorization and regulation of Mifepristone preempt state law banning the use of the medication or regulating its use more strictly, and given this, enforcement of the state laws should be blocked.

There are other ways that state laws also affect use of and access to medication abortion. Some states require that patients be counseled about unsubstantiated claims about the ability to reverse an abortion after mifepristone is ingested. For example, Nebraska, a state that hasn’t banned abortion, requires patients to be counselled that medication abortion may be reversed if given a high dose of progesterone after taking mifepristone—despite a lack of scientific evidence to support this claim. Similarly, Utah requires counseling that mifepristone alone is not always effective in ending a pregnancy and that patients may still have a viable pregnancy after taking mifepristone despite its record of effectiveness. Prior to banning abortion ArkansasIdahoKentucky,  OklahomaSouth Dakota had similar requirements. Research demonstrates that APCs, such as nurse practitioners, physician assistants, or nurse-midwives, can provide medication abortion as safely as physicians can, but they are only permitted to do so in 24 states and DC out of the 38 states where abortion is not currently banned.

Telehealth

Telehealth can be used to expand access to health services in areas where the number of clinicians who provide abortion care is limited. Many patients, particularly those who live in rural communities, must travel long distances to obtain abortion services even in states where abortion is still permitted, which has raised interest in the potential of telehealth to expand access medication abortion. Because the updated FDA label now allows for telehealth, mifepristone has emerged as an option for patients who are either unable to travel to clinic or for other reasons wish to have an abortion in the privacy of their own home, if permitted by state law.

As part of efforts to limit abortion access, some states have taken action to block the use of telehealth for abortion. Among the states that have not banned abortion, thirteen states have at least one restriction that requires at least one trip to the clinic, and effectively ban telehealth for medication abortion (Figure 1).

Availability of Telehealth for Medication Abortion in a Post-Roe United States

Cost

According to a recent study, the median self-pay price for medication abortion significantly increased from $495 in 2017 to $560 in 2020. Although Danco Laboratories does not make the cost of Mifeprex public, providers report that Mifeprex pills alone cost them around $90 a pill. GenBioPro, the manufacturer of the generic mifepristone drug also does not report the cost of their pill but has stated that they want to drive down costs for those who choose medication abortion. Private insurance coverage of abortion services is variable and depends on the type of insurance plan, the policy holder’s state of residence, and employer coverage decisions. Federal Medicaid funding only pays for abortions when the pregnancy is a result of rape or incest or a threat to the pregnant person’s life. Seventeen states have opted to use their own state funds to pay for abortions, including medication abortions, for Medicaid enrollees. For those who do not have abortion coverage, there are limited means of financial support, promoted on both Danco and GenBioPro’s website. The National Abortion Federation, as well as local abortion funds are sometimes able to cover some of the cost of an abortion (including travel) for a pregnant person. Outside of these funding sources or a sliding fee scale clinic, there are few options to help with abortion costs.

Use

Although the overall rate of abortion has declined over the past two decades, the use of medication abortion as a share of all abortions has greatly increased over the years. According to Danco Laboratories, by 2016, over 2.75 million women in the United States had used Mifeprex since its FDA approval in 2000. Data from the Centers for Disease Control and Prevention (CDC) show medication abortions have increased steadily over the past 15 years. A Guttmacher Institute report found that medication abortion accounted for 63% of all nonhospital abortions in 2023, although this is likely an undercount since it does not include self-managed abortions.

Self-Managed Abortion

Self-managed abortion, sometimes referenced as “self-induced” or “at-home” abortion, is when a person ends a pregnancy outside the medical care setting, typically by ordering abortion pills online. Patients may seek to manage their own abortion for many reasons, including state bans, clinic access barriers, cost, transportation, time limitations, and privacy. There are different medication protocols that can be used for a self-managed abortion. As detailed in this JAMA review, an individual can take the FDA-approved medication abortion regimen of mifepristone and misoprostol pills or misoprostol pills alone.

There are a number of companies that offer self-managed abortion services using different approaches. Some companies have a clinician that reviews a customer’s medical information and may have a telehealth visit. Other companies, such as AidAccess based outside the United States, will mail abortion medications to an individual without requiring a clinician visit. Plan C Pills operates a website that provides a list of online retailers in every state and includes information about clinician involvement, price, ship time, product quality, as well as information about how to take the drugs and resources for financing assistance. Prices differ between companies, but typically costs are lower than average charges for a clinic abortion as there is typically no involvement with a brick and mortar clinic. One 2017 study found the median cost of mifepristone-misoprostol products ordered online is approximately $205.

Self-managed abortions have occurred around the world for years, particularly in areas where abortion access in the medical care system has been limited. Before the FDA removed the REMS requirement for in person dispensing of medication abortion, access to telemedicine abortion care (either through the medical system or self-managed) was extremely limited in the United States. Interest in self-managed abortion has grown in recent years in the United States, particularly since the Dobbs decision. For example, research has documented a sharp increase in requests for abortion pills to the company AidAccess since the Dobbs ruling, rising from an average of 82.6 requests daily before the ruling to 213.7/day after it was issued, with the largest increases in states that have banned abortion.

None of the current state abortion bans or restrictions criminalize pregnant people for obtaining self-managed abortions, yet there have been many documented cases of people facing criminal charges for self-managing an abortion. Some states impose criminal penalties on clinicians or others who help an individual obtain abortion services. These policies can create a climate of fear related to self-managed abortion for both patients and clinicians, for instance if a patient were to present to a clinician for a complication or follow up care after a self-managed abortion. Some major medical and public health groups such as ACOG, AMA, and APHA oppose any criminalization of patients that seek self-managed abortion.

Conclusion

The use of medication abortion has grown significantly since its approval by the FDA in 2000. The FDA update of the REMS in 2023 has expanded the availability of medication abortion and broadened the use of telehealth dispensing. However, state abortion bans, specific bans on telehealth for medication abortion, and state-level requirements for in-person dispensation of mifepristone and for in-person counseling visits and ultrasounds that are not medically recommended will continue to restrict access in many states.

Abortion-Related Policies That Affect Access to Medication Abortion, as of November 23, 2022

Oral Contraceptive Pills: Access and Availability

Published: Mar 20, 2024

Note: This brief was updated on March 20, 2024 to incorporate the latest available data.

For over 60 years, American women have relied on oral contraceptive pills to prevent pregnancy. Oral contraceptives are the most widely used form of reversible contraception and are also commonly used to manage other health conditions. In the U.S., daily oral contraceptive pills have traditionally only been available with a prescription. In July 2023, the U.S. Food and Drug Administration approved the first over-the-counter daily oral contraceptive pill, eliminating the requirement for a prescription from a clinician. This progestin-only pill is now available for purchase in stores and online at most major retailers. This brief provides an overview of oral contraception, discusses private insurance and Medicaid coverage, and reviews strategies to promote and expand women’s access to oral contraceptives.

Background

In 1960, the Food and Drug Administration (FDA) approved the sale of Enovid for use as the first oral contraceptive. Controversial from its earliest days, in 1965, the Supreme Court ruling in Griswold v Connecticut upheld married women’s rights to contraception, followed in 1972 by the Supreme Court’s decision in Eisenstadt v Baird which extended the right to single, unmarried individuals.

Oral contraceptive pills (OCP) consist of the hormones progestin and estrogen, or only progestin, and must be taken orally once per day in order to prevent pregnancy. Currently, there are three different types available on the market: the combination pill, the progestin-only pill, and the continuous use pill. The three formulations vary in their chemical hormonal composition as well as regimen for use (Table 1). Different brands further add to the diversity of OCP available by altering the type and/or dose of hormones. Emergency contraceptive pills are also a type of OCP, consisting of the progestin levonorgestrel, but are not intended for daily use. Rather, they are used to prevent pregnancy after unprotected sex.

Table 1: Types, Composition and Regimen for Daily Oral Contraceptive Pills

Both the combined and progestin-only pills are highly effective with perfect use, with a failure rate (rate at which women become pregnant while using the contraceptive) of less than 1%. However, the failure rate with “typical use” is 9%, which accounts for inconsistent or incorrect use.

Use

The pill was the first FDA-approved contraceptive to be used in the U.S. and is still the most commonly used form of reversible contraception. According to KFF analysis of the 2017-2019 National Survey of Family Growth, the most recent years for which data are available, about one-quarter (24%) of women ages 15-44 who currently use contraception reported using the pill as their method of choice, a decline from 31% in 2002 (Figure 1). At the same time, there has been an increase in the use of long-acting reversible contraceptives (LARCs), such as intrauterine devices (IUDs) and implants, which have been promoted by several medical groups in recent years.

Women's Contraceptive Choices and Options Are Changing

Among women ages 15-44 who use any form of contraception, OCP use is higher among younger women and decreases with age. A larger share of White women (29%) use OCP than Hispanic (14%) or Black (13%) women. OCP use increases with higher educational attainment (Figure 2).

Contraceptive Pill Use Varies by Demographic Characteristics

OCPs are primarily used for pregnancy prevention, but they can also be used to address other health conditions, particularly menstrual-related disorders such as menstrual pain, irregular menstruation, fibroids, endometriosis-related pain, and menstrual-related migraines. Use of combined pills for acne has been formally approved by the FDA for specific brands. While most (82%) women who use OCP take them primarily to prevent pregnancy, 18% use them solely for non-contraceptive reasons such as to manage a medical condition (unpublished analysis from the 2022 KFF Women’s Health Survey).

Oral contraceptives are safe for most women. Possible side effects include headache, nausea, breast tenderness, and breakthrough bleeding. The combined hormonal pills may be associated with a small increased risk of deep vein thrombosis, heart attack and stroke for some women.

Insurance Coverage and Financing of Oral Contraceptives

OCPs have not always been covered by insurance plans in the same way as other prescriptions drugs. This became the focus of legislative action in the early 1990’s, first at the state and then the federal level. State legislatures began passing “contraceptive equity” laws which typically required that plans offering prescription drug coverage also cover contraceptives on the same terms as other prescriptions. Some state laws went further to require that plans cover all FDA-approved contraceptives. However, these state laws only applied to plans that were regulated by the state and did not include self-funded employer-sponsored plans, which are federally regulated through ERISA and cover most workers with employer-sponsored insurance. Minimum coverage standards for employer-sponsored plans were established in 2000, when a federal ruling from the Employment Equal Opportunity Commission found it unlawful under the Civil Rights Act for plans to deny coverage for contraceptives if they covered other preventive prescription drugs and services. By 2010, 28 states required insurers that cover prescription drugs to provide coverage for the full range of FDA-approved contraceptives.

Private Insurance and the ACA

In 2010, the Affordable Care Act (ACA) took state laws further by requiring most private plans (including self-funded, small and large group, and individual plans) to cover a wide range of recommended preventive services, without patient cost-sharing. In 2011, the Health Resources and Services Administration (HRSA), following recommendations issued by the Institute of Medicine, added that all FDA-approved, prescribed contraceptive methods and patient counseling for women with reproductive capacity be covered, without cost sharing, as a preventive service. Plans that were in effect on or before March 23, 2010, known as “grandfathered plans,” are not required to cover preventive services, or they may require cost sharing. Additionally, plans offered by an employer with a religious objection to contraception may exclude this coverage from their plan.

Under the ACA, most private health insurance plans must cover at least one form of each of the 18 FDA-approved contraceptive methods for women without cost sharing. This means that plans must cover at least one of each of the three different types of oral contraceptives – the combined pill, the progestin-only pill and the continuous use pill – though it is up to an insurer’s discretion using reasonable medical management practices whether to cover a brand name or generic contraceptive if both are available. Insurers are required to cover other contraceptives if medically necessary and must provide a process for policyholders to request coverage of a contraceptive that is not already covered without cost sharing by the plan. While some contraceptive methods are available over the counter without a prescription, plans typically require a prescription to trigger coverage.

Additionally, 15 states and D.C. have passed laws that build on the federal requirement for no cost sharing for all FDA-approved contraceptive methods for women (Figure 3). Some of these states have gone beyond the ACA requirements, mandating coverage of vasectomies and/or over-the-counter contraceptives.

Fifteen States and D.C. Passed Laws Requiring Most Plans to Cover, Without Cost Sharing, All FDA-Approved Contraceptive Methods

Today, fewer women are paying out of pocket for contraceptives as a result of the ACA’s contraceptive coverage requirement. According to a 2019 KFF analysis of the IBM MarketScan Commercial Claims and Encounters Database, among women with health insurance from a large employer who use OCP, the share experiencing out-of-pocket spending on OCP declined from 96% in 2010 to 11% in 2017.

Controversial since its inception, the provision has sparked litigation and new regulations in response to lawsuits that have reached the Supreme Court. Although the Obama administration allowed certain religious employers with an objection to contraception to request an exemption from the requirement, in 2020, the Supreme Court upheld two Trump administration rules that expanded eligibility to almost all employers that have a religious or moral objection. Female employees, dependents, and students of these exempt employers are not entitled to coverage for the full range of FDA-approved contraceptives.

Public Programs

Federal law has long required state Medicaid programs to cover family planning services and supplies without cost sharing and provides states with an enhanced federal match for providing these services. States that expanded Medicaid under the ACA must follow the ACA requirements for private plans and are required to cover at least one form of all 18 FDA-approved contraceptive methods for women. There is no similar requirement for traditional full-scope Medicaid or through a Medicaid family planning expansion program, and there is variation between states on the specific services that are covered.

Since the passage of the ACA, some states have also strengthened their contraceptive coverage requirements for Medicaid (Figure 3). For example, California passed the Contraceptive Coverage Equity Act of 2014 which extends the ACA’s coverage policy beyond private plan beneficiaries to all Medicaid managed care enrollees, regardless of whether they qualify as a result of the ACA expansion or through traditional pathways. California expanded this coverage in 2022 to cover OTC contraceptive drugs and products without a clinician’s prescription and extends this coverage to fee-for-service Medicaid beneficiaries. Delaware, D.C., Massachusetts, Nevada, New Hampshire, and Vermont have since enacted similar contraceptive equity laws that apply to both private insurance plans and Medicaid.

Coverage for oral contraceptives is also required in the Indian Health Service, the federal program that provides care on or near Indian reservations as well as in the Tricare program for active military personnel and their dependents. Medicare, the federal program for seniors 65 and older as well as younger adults with permanent disabilities, does not require coverage for oral contraceptives. According to KFF analysis of the 2020 Medicare Current Beneficiary Survey, 1.2 million women under age 50 were enrolled in Medicare. Medicare beneficiaries that have enrolled in private Medicare Advantage plans or who have opted into the Medicare Part D prescription drug benefit may have coverage for oral contraceptives, but the scope of coverage varies between plans. There are more than 878,000 women of reproductive age that were dually eligible for Medicaid and Medicare.

Expanding Access to Contraception

The 2022 KFF Women’s Health Survey found that one-third (33%) of female hormonal contraceptive users have missed taking their birth control because they were not able to get their next supply on time. Furthermore, it is estimated that more than 19 million women of reproductive age in need of publicly-funded contraception live in an area considered to be a contraceptive desert, meaning there is limited access to a publicly-funded provider who offers contraception. Research also points to the impacts of state and federal policies on the shrinking number of family planning providers that offer the full scope of contraceptive methods in some communities.

In recent years, there has been public discussion and state and federal policy action to reduce contraceptive access barriers by expanding the availability of daily oral contraceptive pills through different mechanisms. Approaches that have been adopted include making OCP available over the counter without a prescription; expanding the ability of pharmacists to dispense or prescribe OCP; extending the supply of contraception that is dispensed at one time; and using mail-based online services or smartphone applications.

Over-the-Counter (OTC) Access

In July 2023, the U.S. Food and Drug Administration (FDA) approved the progestin-only Opill for OTC use, making it the first OTC daily oral contraceptive pill. Opill is now available for over-the-counter purchase without age restriction in stores and online. The suggested retail price of Opill is $19.99 for one month’s supply or $49.99 for three month’s supply. Although it is farther behind in the process, another pharmaceutical company, Cadence, is working toward FDA approval of an OTC version of its combined (progestin and estrogen) oral contraceptive pill, Zena.

Medications may be eligible for OTC status if the FDA determines that they can be used appropriately by consumers for self-diagnosed conditions; they do not require a clinician for safe and effective use; and they have a low potential for misuse and abuse. Applicants typically must conduct studies to assess whether consumers are able to comprehend the product’s labeling and use the product safely and appropriately without the supervision of a clinician. Research has found that people, including those under the age of 18, are able to understand label instructions and contraindications for OTC contraception without clinician involvement.

Research suggests that OTC access would increase the use of contraception and facilitate continuity of use. It could also allow women to save time spent on travel, at doctor’s office, and off work. Other research suggests that OTC oral contraceptives can especially benefit populations who have historically faced barriers to accessing contraceptive care, such as young adults and adolescents, those who are uninsured, and those living in contraceptive deserts or areas with limited access to health centers offering the full range of contraceptive methods. The 2022 KFF Women’s Health Survey found that four in ten (39%) reproductive-age women would be likely to use OTC birth control if approved by the FDA, increasing to six in ten (60%) of oral contraceptive users.

The ACA currently requires no-cost coverage for contraceptives in most private plans and for Medicaid expansion populations but plans typically require a prescription in order to trigger coverage, even for contraceptive methods that are available OTC without a prescription. Requiring plans to cover non-prescribed contraceptives would require legislation at the federal or state level, or administrative changes to the ACA’s preventive services policy. Seven states (CA, CO, MD, NJ, NM, NY, and WA) have laws or regulations requiring state-regulated private health insurance plans (individual, small group, and large group markets) to cover, without cost sharing, OTC contraception without a prescription. While New York’s law applies to emergency contraception only, the other state laws apply to non-prescribed contraceptive drugs broadly (Figure 4). Seven states (CA, IL, MI, MD, NJ, NY, and WA) use state-only funds to cover at least some OTC contraception without a prescription for Medicaid enrollees. However, these states, with the exception of California, cover non-prescribed emergency contraception and/or condoms only, so a change in law or policy would be needed to cover a daily oral contraceptive pill without a prescription. States wishing to cover OTC contraception without a prescription for enrollees must use state-only funds as federal funds are only available for prescribed drugs.

(See KFF State Health Facts for more details on each state’s private insurance law and Medicaid coverage, including contraceptive methods covered.)

Eight States Require Private Health Plans and/or Medicaid to Cover at Least Some OTC Contraception Without a Prescription

For more information on how states have implemented insurance of OTC contraceptives, see KFF’s report Insurance Coverage of OTC Oral Contraceptives: Lessons from the Field and issue brief Over-the-Counter Oral Contraceptive Pills.

Pharmacy Access

Another avenue that is gaining support in some states allows pharmacists to prescribe or dispense OCP without requiring an in-person medical visit to a physician. As of March 2024, 34 states and D.C. have passed laws to allow pharmacists to prescribe certain self-administered contraceptives to women (Figure 5). All of these states allow pharmacists to prescribe at least oral contraceptives, but states vary in other details, such as the type of prescriptive authority (e.g., collaborative practice agreements, statewide protocols, and standing orders), minimum age requirements, the type of contraceptive that pharmacists can prescribe, the length of the supply, and whether the patient needs a prior prescription from a physician.

Twenty-Seven States and D.C. Have Passed Laws Permiting Pharmacists to Prescribe Oral Contraceptive Pills

Although expanded scope of pharmacist practice can remove some barriers to obtaining contraceptives, challenges still remain for women seeking a prescription for contraception from a pharmacist. For example, pharmacies typically charge consultation fees, which some reports suggest can be as high as $50 in certain areas. Although insurers are generally required to cover contraceptives without cost sharing, they are not obligated to cover this fee. Also, pharmacies can choose not to participate or may not have any pharmacists trained to provide this service.

From the pharmacy perspective, pharmacists must elect to complete additional education requirements, which vary by state, and often include several hours of continuing education from an accredited training program. Additionally, states may not have a reimbursement mechanism in place to pay pharmacists for providing this service. For example, while Oregon and Hawaii require plans to reimburse the dispensing entities, California’s law does not require reimbursement for payers other than Medicaid. Lack of or low reimbursement for pharmacist prescribing can result in fewer pharmacies choosing to provide this service.

Extended Supply

The 2022 KFF Women’s Health Survey found that more than one-third (36%) of reproductive-age females who use oral contraception have missed taking it on time because they were unable to get their next supply. Another approach to facilitate access to oral contraceptives involves increasing the dispensing period of contraceptives to 12 months per prescription. Currently, dispensing patterns vary by insurer, but the vast majority of oral contraceptive pills users receive fewer than 6 packs of pills at a time. In 2022, among reproductive-age females who reported using birth control pills in the past year, 32% received 1-2 packs at a time, 63% received 3-5 packs, and just 6% received a supply of 6 months or more. Providing women with an extended supply of pill packs may lead to more consistent contraceptive use. Women who receive a 1-year supply have been found to be 30% less likely to have an unintended pregnancy compared to women receiving a 1–3-month supply.  

In 2015, Oregon became the first state to pass a law requiring state-regulated plans to cover a three-month supply of contraceptives when first prescribed, followed by a 12-month supply of contraceptives. Laws requiring coverage for 12 months of oral contraceptives have since been enacted in 23 additional states and DC (Figure 6). Louisiana and New Mexico require coverage for a 6-month supply. While most of these states have also enacted policies that require no-cost contraceptive coverage similar to the ACA’s contraceptive coverage provision, nine states (CO, HI, MI, MT, RI, SC, TX, VA, and WV) with extended supply laws have not yet done so. This means that although insurers must cover a 12-month supply in these states, state law does not prohibit cost sharing; however, most plans must abide by the federal requirement and not charge any cost sharing for prescribed, FDA-approved contraceptive methods.

Half of States and D.C. Require Plans to Cover an Extended Supply of Oral Contraceptive Pills

Telecontraception

In recent years, a growing number of companies providing contraception through online platforms (“telecontraception”) have entered the market and are providing a new option for people to obtain contraceptive supplies without the need for an in-person visit. A growing number of online services and smartphone applications offer options for patients to speak with providers by video or chat, get prescriptions, and order birth control pills through mail delivery. These services work by collaborating with physicians, pharmacies, and sometimes health insurers to prescribe and ship OCP to the patient’s home or a local pharmacy.

Costs for these services vary between companies. Most charge a fee for the service, which is typically not covered by insurance and can range from a $15 fee per consultation/prescription to a $99 yearly membership that covers the medical evaluation and customer support for the duration of the prescription.

A 2020-2021 KFF study on telecontraception companies found considerable variation in method availability and acceptance of insurance. Many telecontraception companies accept private insurance and/or Medicaid, to pay for the cost of the pills, while others do not. The price of contraception offered by these platforms vary by method and by brand; generic pills typically range in price from $5 to $25 per pack without insurance.

Most companies ship OCPs free of charge to the patient’s home, while some require pick up from a local pharmacy. Prescriptions are often valid for 12 months and patients are sent either a one- or three-month supply of pills. Video/audio consultations are required by certain services before receiving the prescription. Services that do not require a consultation do require patients to complete a health assessment or questionnaire to determine eligibility and the appropriate pill. People in every U.S. state have access to at least one of these services, but the minimum age to use the service varies by company and state law, although many require the person to be at least 18 years old.

***

Oral contraceptives are the most commonly used form of reversible contraception in the U.S. Most women with private insurance or Medicaid can receive no-cost coverage for OCPs. The FDA recently approved Opill, the first ever daily OCP available over the counter, though insurance coverage of the product will largely depend on state efforts in the absence of federal guidance. Several states have enacted policies to broaden OCP access, particularly through pharmacist prescribing and insurance coverage for extended supplies and non-prescribed OTC contraceptives. The use of telemedicine to expand OCP access continues to evolve, with many women now able to obtain OCP using smartphone and web-based services.

What resources are available for privately insured patients who get surprise balance bills?

Authors: Krutika Amin, Kaye Pestaina, and Cynthia Cox
Published: Mar 19, 2024

For privately insured patients, surprise medical bills can arise from either having to pay a high deductible, or from “balance billing.” Typically, health plans negotiate payments to in-network providers. Out-of-network providers may directly bill privately insured patients the difference between the typical in-network health plan payment and the full charge, also known as “balance bills”. In these cases, patients can be liable for the balance bill in addition to any deductible, coinsurance, or copay under the health plan.

The No Surprises Act prohibits many of these balance bills starting in 2022. Privately insured patients (including those with employer-based coverage, non-group plans, and grandfathered plans) are protected from certain surprise balance bills. The surprise balance billing protections require private health plans to cover out-of-network claims and apply in-network cost sharing (deductibles, copayments) for certain covered benefits. The law prohibits certain providers, hospitals, and air ambulance from surprise balance billing patients for out-of-network care, unless the patient consents ahead of time.

The new protections require plans and providers to take the patients out of many of the most common payment disputes. Though it is possible that patients still get balance bills, including because of plan or provider billing mistakes, the bill is not covered under the new law (for example, ground ambulance rides, non-covered services, patient consents to out-of-network care costs), or the health plan denies the claim completely as not covered by the plan.

The patient might get balanced bills, for instance, if the patient’s plan incorrectly processes a claim or applies out-of-network cost-sharing amount when the NSA prohibits it. A patient could get billed more than they ought to be, for example, if the plan does not recognize that a claim is subject to the No Surprises Act, or because of a billing oversight. Patients can appeal these mistakes using the plan’s internal claims and appeals procedure. Under the federal law, the patient has the right to appeal a health plan denial (called an adverse benefit determination or “ABD”). ABDs also include plan decisions to apply the incorrect cost-sharing amount. Once the adverse benefit determination has been made, the health plan must give the patient at least 180 days to file an internal appeal. For post-service claims, the plan must then complete the internal appeal no later than 60 days after it is filed. If the plan upholds its denial, the patient has a new right under the NSA to ask for an independent external appeal for NSA compliance issues. Federal regulations provide several examples for when NSA-related decisions can be reviewed by an external reviewer, including a decision about whether a specific claim involves an item or service that is covered by the NSA as a surprise bill.

For patients who receive a surprise bill when they should not, what follows may be more complicated. To correct the situation, patients would first need to recognize that the plan’s decision was incorrect and that the provider bill is subject to the No Surprises Act. KFF polling finds the vast majority of Americans (78%) know little or nothing about the new consumer protections law, so the effectiveness of self-advocacy by consumers could be limited if problems arise. Under current law, any health plan ABDs must include contact information for state consumer assistance programs (CAPs) and notice that such programs (in states where they exist) can help people file an appeal. Consumers could reach out to CAPs to get an assessment of whether the bill they received is valid. Additionally, as part of the No Surprises Act, the Centers for Medicare and Medicaid Services (CMS) has established resources for patients to seek review of their medical bills (through this website: https://www.cms.gov/medical-bill-rights/help/submit-a-complaint or by calling the No Surprises Help Desk at 1-800-985-3059 which is available 24/7 and through holidays). This no-wrong-door complaints system is available for consumers who are concerned their plan may have incorrectly denied or covered a surprise medical bill.

Most people are not aware of the No Surprise Act anti-balance billing protections


Meanwhile, however, if a plan incorrectly denies or covers a surprise bill and the patient does not recognize the mistake in order to be able to either appeal or ask for a state or federal review, the patient might get stuck with the bill.

While patients appeal, there is no federal rule preventing providers from trying to collect the outstanding bill. For incorrect bills, if the patient appeals, the out-of-network provider might be able to bill the patient for the full charge while the appeal is underway. Patients who are unable to pay the outstanding bill may be referred to collection agencies. Though the Consumer Finance Protection Bureau (CFPB) has outlined additional guidelines restricting coercive practices from collection agencies. KFF polling has found that 41% of adults have health care debt according to a broader definition, which includes health care debt on credit cards or owed to family members. KFF analysis of a census survey suggests Americans may owe at least $220 Billion in medical debt. People with medical debt report cutting spending on food, clothing, and other household items, spending down their savings to pay for medical bills, borrowing money from friends or family members, or taking on additional debts. Medical debt may make it difficult for patients to get loans for daily living like housing or car.

Later, if the patient prevails on the appeal, the health plan would need to reprocess the claim, this time following the No Surprises Act rules, and the out-of-network provider would then be required to refund the patient for any amount collected in excess of the applicable in-network cost sharing amount.

Under the Affordable Care Act and the No Surprises Act, federal agencies can impose penalties on health plans and providers for incorrectly billing patients. For plans who incorrectly process claims, they can be charged up to $100 per day per affected beneficiary under federal law. State regulators may have additional authority and enforcement tools they can use to address billing problems. On the provider side, the penalty for incorrect billing is up to $10,000 per violation. That is, if a provider sends 200 incorrect bills, the provider could be penalized $2 million. But for these penalties to happen, the patient would have to successfully lodge a complaint with federal regulators and the regulators would need to investigate and enforce.

Through October 2023, about 11,000 patient complaints have been filed through the federal feedback portal. The federal government has said 248 complaints involved a violation and resulted in $3 million in monetary relief paid to consumers or providers. At this point, it is unclear whether the federal government has issued penalties to providers or health plans for incorrect billing practices.

Discussion

Most patients do not know about the new surprise billing protections and likely also do not know of resources available to seek recourse for incorrect medical bills. It’s advisable to ask about the cost ahead of time, when possible. Additionally, when patients get a large, unexpected bill, a good first step is to call the health plan. New federal resources allow patients to submit complaints and get a response from the federal government. The federal process does not provide a determination or help the consumer fight a bill with the payer. Patients may have little recourse, however, if their plan does not cover certain items or services, or if their surprise balance bill is not protected under federal law.

Plans and providers can now arbitrate disagreements over payments for out-of-network care via the No Surprises Act independent dispute resolution. Most payment determinations through the arbitration process have been in favor of the providers’ asking price. Yet most of the lawsuits against the No Surprises Act are also being brought by providers. The federal government recently proposed several changes with the goal of making the IDR process more efficient and increasing early communication between the parties. In the midst of the legal disputes over the dispute resolution process for payment rates, patients are required to be held harmless for surprise, out-of-network balance bills.

Patients are not supposed to get surprise balance bills, unless there’s a mistake or the surprise bill is not protected. In these situations, patients have some recourses, though they are only helpful if people know about them.

The Impact of the Pandemic on Well-Child Visits for Children Enrolled in Medicaid and CHIP

Authors: Elizabeth Williams, Alice Burns, Robin Rudowitz, and Patrick Drake
Published: Mar 18, 2024

In Medicaid, states are required to cover all screening services as well as any services “necessary… to correct or ameliorate” a child’s physical or mental health condition under Medicaid’s Early and Periodic Screening, Diagnostic and Treatment (EPSDT) benefit (see Box 1). Many of these screening services along with immunizations are provided at well-child visits. These visits are a key part of comprehensive preventive health services designed to keep children healthy and to identify and treat health conditions in a timely manner. Various studies have also shown that children who forego their well-child visits have an increased chance of going to the emergency room or being hospitalized. Well-child visits are recommended once a year for children ages three to 21 and multiple times a year for children under age three according to the Bright Futures/American Academy of Pediatrics (AAP) periodicity schedule.

A recent Centers for Medicare and Medicaid Services (CMS) analysis shows that half of children under age 19 received a Medicaid or CHIP funded well-child visit in 2020. The onset of the pandemic in 2020 had a substantial impact on health and health care service utilization, but research has shown that many Medicaid-covered children were not receiving recommended screenings and services even before the pandemic. This issue brief examines well-child visit rates overall and for selected characteristics before and after the pandemic began and discusses recent state and federal policy changes that could impact children’s preventive care. The analysis uses Medicaid claims data which track the services enrollees use and may differ from survey data. In future years, claims data will be used to monitor adherence to recommended screenings. Key findings include:

  • More than half (54%) of children under age 21 enrolled in Medicaid or CHIP received a well-child visit in 2019, but the share fell to 48% in 2020, the start of the COVID-19 pandemic.
  • Despite having the highest well-child visit rates compared to other ethnic and racial groups, Hispanic and Asian children enrolled in Medicaid or CHIP saw the largest percentage point declines in well-child visit rates from 2019 to 2020.
  • Children over age three enrolled in Medicaid or CHIP have lower rates of well-child visits and experienced larger declines in well-child visits during the pandemic than children under age three.
  • Well-child visit rates are lower for Medicaid/CHIP children in rural areas, but rates in urban areas declined more during the pandemic.

Box 1: Medicaid’s EPSDT Benefit

What is the EPSDT benefit?

Medicaid’s Early and Periodic Screening, Diagnostic and Treatment (EPSDT) benefit provides a set of comprehensive health care services to Medicaid enrollees under age 21. Under EPSDT, states are required to cover all screening services for children as well as any services “necessary… to correct or ameliorate” a child’s physical or mental health condition. States must provide screenings for developmental and behavioral health conditions, as well as for vision, hearing, and dental conditions, on a periodic basis that meets reasonable standards of medical practice. These services must be provided for children, regardless of whether a state chooses to cover them for adults.

What is the goal of the EPSDT benefit and why is it important?

The EPSDT benefit aims to identify health conditions that can impede children’s growth and development early and is key in ensuring low-income children receive the care they need. While the EPSDT benefit is important to all children, it has been especially beneficial for children with special health care needs. Through the EPSDT benefit, Medicaid provides more comprehensive coverage for these children than the typical private insurance plan and increases access to needed services that improve the quality of daily life. Medicaid covers almost half of all children with special health care needs. In addition, EPSDT facilitates greater access to care for children with behavioral health needs, as children diagnosed with mental or other behavioral health conditions must receive any service available under federal Medicaid law necessary to address the condition, even if the state does not cover the behavioral health service for adults.

How did use of well-child visits change during the pandemic?

More than half (54%) of children under 21 enrolled in Medicaid or CHIP received a well-child visit in 2019, but the share fell to 48% in 2020, the first year of the COVID-19 pandemic (Figure 1). Rates examined here use Medicaid claims data which differ substantially from survey data (see Box 2). While the vast majority of children in the analysis (91% in 2019 and 88% in 2020) used a least one Medicaid service, including preventive visits, sick visits, filling prescriptions, or hospital or emergency department visits, well-child visit rates remained low and are substantially below the CMS goal of at least 80%. One recent analysis found that 4 in 10 children enrolled in Medicaid or CHIP experienced at least one challenge when accessing health care. Barriers to Medicaid/CHIP children receiving needed care can include lack of transportation, language barriers, disabilities, and parents having difficulty finding childcare or taking time off for an appointment as well as the availability of and distance to primary care providers. Some states have seen a loss in Medicaid pediatric providers, and one recent story reported that families with Medicaid in California were traveling long distances and experiencing long wait times for primary care appointments. Data have also shown slight declines in the share of kindergarten children up to date on their routine vaccinations since the COVID-19 pandemic, which may, in part, be associated with the decline in well-child visits. The national measles, mumps, and rubella (MMR) vaccination rate is below the goal of at least 95%, and some states are now seeing measle outbreaks among children.

The Share of Medicaid/CHIP Children with a Well-Child Visit Declined from 2019 to 2020


Despite having the highest well-child visit rates compared to other ethnic and racial groups, Hispanic and Asian children enrolled in Medicaid or CHIP saw the largest percentage point declines in well-child visit rates from 2019 to 2020 (Figure 2). Prior to the pandemic in 2019, about half or more of children across most racial and ethnic groups had a well-child visit, with rates highest for Hispanic (60%) and Asian (57%) children. The rate for American Indian and Alaska Native (AIAN) children lagged behind at just over one in three (36%), although this may reflect that some services received from Indian Health Service providers not being captured in the analysis (see Methods). Between 2019 and 2020, the well-child visit rate fell for all racial and ethnic groups. Hispanic and Asian children experienced the largest percentage point declines in well-child rates (9 percentage points for both groups), but they still had higher rates compared to other groups as of 2020. Black, Native Hawaiian, and Other Pacific Islander (NHOPI), and AIAN children also experienced larger percentage point declines in their well-child visit rates compared with White children, and AIAN children had the largest relative decline on account of their lower starting rate. As of 2020, rates remained lowest for NHOPI (42%) and AIAN children (29%). Twenty-two states, including some states that are home to larger shares of AIAN and NHOPI children, were excluded from the race/ethnicity analysis due to data quality issues (see Methods).

The Declines in Medicaid/CHIP Well-Child Visit Rates from 2019 to 2020 Vary by Race/Ethnicity, Age, and Geographic Area


Children ages three and older have lower rates of well-child visits and experienced larger declines in well-child visits during the pandemic than children under age three (Figure 2). Well-child visit rates are highest when children are young because multiple well-child visits are recommended for children under age three. Although children under three have highest rates of a single well-child visit within the year, it is unknown whether the rates of adherence to recommended well-child screenings are higher or lower than that of other groups because this analysis only accounts for one well-child visit in a year. Well-child visit rates steadily decrease as children get older with the exception of the 10-14 age group, where somewhat higher rates may reflect school vaccination requirements.

Well-child visit rates are lower in rural areas than urban ones, but urban areas had larger declines during the first year of the pandemic (Figure 2). The share of Medicaid/CHIP children living in rural areas with a well-child visit declined from 47% in 2019 to 43% in 2020 while the share for urban areas fell from 56% in 2019 to 49% in 2020, narrowing the gap between Medicaid/CHIP well-child visit rates in rural and urban areas. Note that 18% of children in the analysis lived in a rural area, and three states were excluded from the geographic area analysis due to data quality issues (see Methods). This analysis also examined changes for children by eligibility group, managed care status, sex, and presence of a chronic condition; data are not shown but well-child visit rates for Medicaid/CHIP children declined across all groups from 2019 to 2020.

Box 2: Variation in Well-Child Visit Rates Across Data Sources

There is substantial variation in children’s well-child visit rates across data sources (Appendix Table 1). Rates vary depending on whether the data are self-reported survey data or medical claims data. KFF analysis of 2020 national survey data and Medicaid claims data (used in this analysis) finds that the share of Medicaid/CHIP children with a well-child visit within the year can vary from 48% in Medicaid claims data to 93% in the National Health Interview Survey (NHIS).

Studies have found that utilization rates can vary substantially between self-reported survey data and claims data, likely due in part to recall bias in surveys and the types of claims being included. Research has shown that the accuracy of self-reported utilization in survey data decline over long recall periods and/or for more routine services. Claims data only capture well-child visits that were billed to the payer, in this case Medicaid, and some settings such as community clinics, schools, or Indian Health Service facilities may not always bill Medicaid.

There can also be variation in utilization rates across survey sources due in part to different survey question designs. National surveys such as NHIS and the National Survey of Children’s Health (NSCH) both collect information on children’s well-child visits, though there are differences in the questions asked. NHIS asks a series of questions about how long it has been since a child has seen a “doctor or other health professional for a well child visit, physical, or general purpose checkup” while NSCH asks about “how many times (in the past 12 months) did this child visit a doctor, nurse, or other health care professional to receive a preventive check-up?”.

Trends in well-child visit rates by race and ethnicity or coverage type vary across data sources. This analysis shows Hispanic and Asian children enrolled in Medicaid/CHIP have the highest well-child visit rates. However, NHIS shows that well-child visit rates in Medicaid/CHIP were similar across racial and ethnic groups in 2020 (Appendix Table 1). NSCH shows that White and AIAN children enrolled in Medicaid/CHIP had the highest rates across all racial and ethnic groups in 2020. Further, different data sources show varying trends by health insurance coverage type. Data from NHIS in 2020 show similar rates for Medicaid/CHIP compared to private insurance while data from the NSCH shows rates are higher for children with private insurance compared with Medicaid/CHIP. Healthcare Effectiveness Data and Information Set (HEDIS) measures for child and adolescent well-care visits also show higher rates in commercial HMO and PPO plans compared with Medicaid HMO plans.

This analysis uses claims data (T-MSIS), not self-reported survey data, to examine trends in well-child visits because of the use of T-MSIS in EPSDT and Child Core Set reporting. States can now opt to have CMS generate their EPSDT CMS-416 reports using T-MSIS; 28 states opted for this in 2021. CMS is also investigating the use of T-MSIS for Child Core Set reporting, which is now mandatory, in attempt to alleviate the reporting burden for states. These reports are intended to monitor the provision of the EPSDT benefit and identify gaps as well as measure health care outcomes and are increasingly using T-MSIS to do so.

What to watch?

Well-child visit rates for Medicaid/CHIP children overall fall below the goal rate, with larger gaps for AIAN, Black and NHOPI children as well as older children and children living in rural areas, highlighting the importance of outreach and other targeted initiatives to address disparities. Addressing access barriers and developing community partnerships have been shown to increase well-child visit rates and reduce disparities. It will be important to track, as data become available, the extent to which well-child visit rates as well as vaccination rates (often administered at well-child visits) rebounded during the pandemic recovery and where gaps remain.

Recent state and federal actions could help promote access, quality and coverage for children that could increase well-child visit rates. The Bipartisan Safer Communities Act included a number of Medicaid/CHIP provisions to ensure access to comprehensive health services and strengthen state implementation of the EPSDT benefit. CMS also released an updated school-based services claiming guide, and states have taken action to expand Medicaid coverage of school-based care in recent years. In 2024, it became mandatory for states to report the Child Core Set, a set of physical and mental health quality measures, with the goal of improving health outcomes for children. In addition, as of January 2024, all states are now required to provide 12-month continuous eligibility for Medicaid and CHIP children, which could help stabilize coverage and help children remain connected to care. Three states also recently received approval to extend continuous eligibility for children in Medicaid for multiple years, which could help children maintain coverage beyond one year. In the recently released FY 2025 budget, the Biden Administration proposes establishing the option for states to provide continuous eligibility in Medicaid and CHIP for children from birth to age six or for 36 month periods for children under 19.

Lastly, millions of children are losing Medicaid coverage during the unwinding of the continuous enrollment provision, which could have implications for access. Data up to March 2024 show that children’s net Medicaid enrollment has declined by over 4 million. In some cases, children dropped from Medicaid may have transitioned to other coverage, but they may also become uninsured, despite in many cases remaining eligible for Medicaid or CHIP. While people of color are more likely to be covered by Medicaid, data on disenrollment patterns by race and ethnicity are limited. KFF analysis shows individuals without insurance coverage have lower access to care and are more likely to delay or forgo care due to costs. A loss of coverage or gaps in coverage can be especially problematic for young children who are recommended to receive frequent screenings and check-ups.

Methods

Data: This analysis used the 2019-2020 T-MSIS Research Identifiable Files including the inpatient (IP), long-term care (LT), other services (OT), and pharmacy (RX) claims files merged with the demographic-eligibility (DE) files from the Chronic Condition Warehouse (CCW).

Identifying Well-Child Visits: This analysis used the procedure and diagnosis codes listed in the Annual Early and Periodic Screening, Diagnostic, and Treatment (EPSDT) Participation Report (CMS-416) reporting instructions (see line 6) to identify when a well-child visit occurred. This method of identifying well-child visits mirrors the recent CMS well-child visit analysis.

Identifying Utilization of Any Medicaid Services: To determine if a child in the analysis utilized any Medicaid services within the year, all fee-for-service or managed care encounter claims across the IP, LT, OT, and RX claims files were flagged (claims for capitated payments or any payments not billed at the enrollee level were excluded). If a child had any flagged claims, the child was identified as utilizing a service within the year.

Defining Rural and Urban Areas: This analysis uses enrollee zip code information and the US Department of Agriculture (USDA) Rural-Urban Commuting Areas (RUCA) codes (based on 2010 census data) to designate rural and urban areas. Zip codes with a RUCA value greater than or equal to 4 are designated as rural.

Enrollee Inclusion Criteria: This analysis includes children ages 0 to 21 who were enrolled in Medicaid or CHIP with full benefits for 12 months. The 12-month enrollment period is consistent with the recent CMS analysis, but that analysis only included children under the age of 19.

State Inclusion Criteria: To assess the usability of states’ data, the analysis examined quality assessments from the DQ Atlas for restricted benefits code, claims volume, and managed care encounters and compared the share of children with a well-child visit in T-MSIS to the share of children receiving at least one initial or periodic screening in the annual EPSDT reporting data files. The analysis excluded any states that, for a particular year, had both a “High Concern/Unusable” DQ Atlas assessment and a more than 10-percentage point difference between the share of children with a well-child visit in T-MSIS and the share reported in the state’s annual EPSDT report. One state (WV) was excluded based on these criteria, leaving 50 states (including DC) in the main analysis.

For reporting by race/ethnicity, we excluded states with “High Concern/Unusable” DQ Atlas assessments in 2019 or 2020. Among states in the main analysis, 21 states were excluded (AL, AZ, AR, CO, CT, DC, HI, IA, KS, LA, MD, MA, MO, MT, NY, OR, RI, SC, TN, UT, and WY). This left 29 states for reporting by race/ethnicity (Figure 2).

For reporting by geographic area, we excluded states with “High Concern/Unusable” DQ Atlas assessments for zip code in 2019 or 2020. Among states in the main analysis, two states were excluded (RI and VT). This left 48 states (including DC) for reporting by geographic region.

Limitations:

  • The most recently available data at the time of this analysis was 2020, so it was not possible to report the extent to which well-child visit rates rebounded to pre-pandemic levels.
  • At the start of the pandemic, Congress enacted the Families First Coronavirus Response Act (FFCRA), which included a requirement that Medicaid programs keep people continuously enrolled in exchange for enhanced federal funding. The continuous enrollment provision increased Medicaid enrollment (increasing the number of children with 12 months of enrollment), which could have had implications for service utilization rates in 2020.
  • As mentioned in Box 2, survey data finds a higher share of children receiving preventive care, which may be due in part to:
    • The claims data only capturing well-child visits that were billed to Medicaid (some settings such as community clinics, schools, or Indian Health Service facilities may not always bill Medicaid).
    • Research has shown that the accuracy of self-reported utilization in survey data declines over long recall periods and/or for more routine services.
Comparison of Well-Child Visit Rates in Medicaid/CHIP by Race/Ethnicity Across Sources, 2020

A Closer Look at the Remaining Uninsured Population Eligible for Medicaid and CHIP

Authors: Patrick Drake, Robin Rudowitz, Jennifer Tolbert, and Anthony Damico
Published: Mar 15, 2024

During the three years of the pandemic, states maintained coverage for people enrolled in Medicaid. As a result of this continuous enrollment provision, the number of people enrolled in Medicaid increased. The result – in combination with enhanced premium subsidies in the Affordable Care Act marketplace – is that the number of people who were uninsured decreased and the uninsured rate dropped to historic lows. However, despite these improvements in coverage, 25.6 million nonelderly people remained uninsured in 2022 (Figure 1), and six in ten of the uninsured people are eligible for Medicaid (6.4 million or 25%) or subsidized plans (35%) in the Marketplace but are not enrolled in these programs. Among the remaining uninsured, 6% fall into the “coverage gap” because they live in one of the 10 states that have not adopted the Medicaid expansion. People in the coverage gap have incomes too high to qualify for Medicaid in their state, but too low (below 100% of the poverty level) to qualify for subsidies in the Marketplaces. States began the process of unwinding continuous enrollment in the spring/summer of 2023 and have disenrolled millions of people from Medicaid, likely increasing the number of people who are uninsured.

This issue brief examines the characteristics of the nonelderly uninsured population that is eligible for Medicaid or CHIP using the most recent available national survey data from 2022, which is before the end of Medicaid continuous enrollment, and the most recent eligibility levels for Medicaid (from 2023). Even with declines in the uninsured, the characteristics of the uninsured but eligible for Medicaid remained fairly stable from the prior year.

Distribution of the 25.6 Million Nonelderly Uninsured Population by Eligibility for ACA Coverage, 2022


Who are the people who are uninsured and eligible for Medicaid and CHIP?

Among the 6.4 million nonelderly people who are uninsured and eligible for Medicaid or CHIP (referred to as people who are uninsured and eligible for the rest of this brief), most are adults. Two-thirds of people who are uninsured and eligible, 4.2 million, are adults and one-third, 2.2 million, are children (Figure 2). Adults include those eligible for the program through the Medicaid expansion and individuals who qualify under pre-ACA rules but are not enrolled.

Across all people who are uninsured and eligible, over six in ten are people of color and nearly seven in ten live in working families (Figure 2). Nonelderly Hispanic people account for 36.0% of those who are uninsured and eligible, and Black people account for another 13.9%. While just under three in ten (29.6%) of people who are uninsured and eligible are in families with no workers, over half (54.6%) are in families with one or more full-time workers. Both full- and part-time low-wage workers are less likely to report having an offer of coverage from their employer than higher wage workers, and among those with an offer of coverage, are more likely to report the coverage offered is too expensive.

Over three-quarters of the 6.4 million people who are uninsured and eligible (5.2 million people) reside in expansion states, which have more people living in them and have higher Medicaid income eligibility for adults than non-expansion states (Figure 2). The remaining 1.2 million people are in states that have not expanded Medicaid but are eligible for Medicaid or CHIP under traditional (not ACA expansion) pathways. Most of the people who are uninsured and eligible in expansion states are adults, while children make up the majority of uninsured and eligible people in non-expansion states (Figure 2). All states have opted to set eligibility thresholds for children in Medicaid and CHIP at higher levels, in most states above 200% of poverty. In Medicaid expansion states, eligibility for adults was expanded to 138% of poverty ($20,783 for an individual and $35,632 for a family of three in 2024) and extended to adults without children. In non-expansion states, eligibility is limited for adults, often to below half of the federal poverty level, and generally only available for parents of dependent children. The differences in eligibility for adults across expansion and non-expansion states drives the variation in the shares of children and adults who are uninsured but eligible for Medicaid and CHIP for these states.

Characteristics of the 6.4 Million Nonelderly Uninsured and Eligible for Medicaid Population, 2022


What are key issues to watch?

Medicaid continuous enrollment contributed to a decline in the number of people uninsured overall as well as the number of uninsured individuals who are eligible for Medicaid but not enrolled. However, since the end of continuous enrollment on March 31, 2023, states have disenrolled millions of people. Although national survey data that will show changes in coverage is lagged, the unwinding of continuous enrollment is expected to increase the number of people who are uninsured, including among those who are still eligible for Medicaid and those who are eligible for subsidies in the Marketplace. Some people who are disenrolled from Medicaid for procedural or paperwork reasons, even though they are still eligible for Medicaid, may struggle to re-enroll and may remain uninsured. Even as the number of people who are uninsured increases, the characteristics of those who are eligible for Medicaid but uninsured may remain relatively stable. Understanding these characteristics can help inform outreach efforts as well as policy changes that can mitigate coverage losses by making it easier for people who are eligible to obtain or retain Medicaid coverage.

Medicare Households Spend More on Health Care Than Other Households

Authors: Nancy Ochieng, Juliette Cubanski, and Anthony Damico
Published: Mar 14, 2024

Medicare provides health insurance coverage to 66 million adults, including 59 million adults ages 65 and older and more than 7 million adults under age 65 with disabilities. While the vast majority (91%) of Medicare beneficiaries give their Medicare coverage an overall positive rating, health care cost-related problems are not uncommon. Medicare beneficiaries contribute to the cost of their health care coverage through monthly premium payments, deductibles, and other cost-sharing requirements. Additionally, people on Medicare may face additional premiums for Medicare Part D prescription drug coverage and supplemental insurance. Further, there is no limit on out-of-pocket spending for beneficiaries in traditional Medicare, and beneficiaries often incur out-of-pocket costs for services not covered under traditional Medicare, such as dental, hearing, and vision services. Medicare Advantage plans have a cap on out-of-pocket costs and typically offer reduced cost-sharing for no premium, but enrollees can still have substantial expenses.

In 2022, the Consumer Price Index (CPI) for all Urban Consumers, a closely tracked measure of price inflation, increased to its highest annual rate since 1981, which translated to higher costs for housing, food, transportation, and other household expenditures, including health care costs. The inflation rate has come down since then, but prices for many household expenses are still substantially higher than they were previously. In this analysis, we assess the financial burden of health care spending among households where all members are covered by Medicare (referred to as Medicare households) compared to households where no members are covered by Medicare (referred to as non-Medicare households), based on data from the 2022 Consumer Expenditure Survey. We also assess trends in household spending and the financial burden of health care spending over the 10-year period from 2013 to 2022. (See Methods for details on the analysis.)

The health spending burden was twice as large among Medicare households than non-Medicare households in 2022

Medicare households spent more on health care than non-Medicare households in 2022, both as an annual dollar amount and as a share of total household spending. Medicare households spent an average of $7,000 on health care, accounting for 13.6% of their total household spending ($51,800), while non-Medicare households spent $4,900 on their health care, accounting for 6.5% of their total household spending ($74,100) (Figure 1). Health care expenses include health insurance premiums, medical services (e.g., hospital and physician services), prescription drugs, and medical supplies (e.g., crutches, eyeglasses, hearing aids).

The larger burden of health care spending among Medicare households than non-Medicare households is a function of both lower average total household spending for Medicare households than non-Medicare households and higher health care use, which results in higher health care spending by Medicare households.

Health Care Accounted for a Larger Share and Amount of Total Household Spending for Medicare Households Than for Non-Medicare Households in 2022


Across all household spending categories, housing accounted for the largest share of total spending for both Medicare and non-Medicare households (35.3% for Medicare households and 32.5% for non-Medicare households). Across other major categories of household spending – transportation, food, and other expenses such as education and clothing – Medicare households devoted a smaller share of their household spending (and less in dollar terms) to these items than non-Medicare households. This may be a function of both smaller average family sizes in Medicare households than non-Medicare households (1.4 vs. 2.6 people), as well as lower median household income ($31,700 vs $76,600).

Consistent with the higher average health care spending burden among Medicare households compared to non-Medicare households, a larger share of Medicare households than non-Medicare households spent 20% or more of their total household spending on health-related expenses than non-Medicare households – nearly 3 in 10 (29%) Medicare households versus 7% of non-Medicare households. Nearly three out of four Medicare households (74%) spent 10% percent or more of their total household spending on health expenses, compared to a quarter (25%) of non-Medicare households (Figure 2).

A Larger Share of Medicare Households Spent 20% Or More of Their Total Household Spending on Health-Related Expenses Than Non-Medicare Households in 2022


Health care spending by Medicare households increased by 53% between 2013 and 2022, but health care as a share of total household spending changed very little over these years

In 2022, Medicare households spent an average of $7,000 on health care—$2,400 or 53% higher than the amount spent on health care in 2013 ($4,600) (Figure 3). With total household spending by Medicare households growing at nearly the same rate as the growth in health care spending over these years, health care as a share of total household spending was nearly the same in 2022 (13.6%) as in 2013 (13.5%).

Similarly, non-Medicare households also spent more on health care in 2022 ($4,900) than in 2013 ($2,800), a 71% ($2,100) increase. Health care as a share of total household spending for non-Medicare households was somewhat higher in 2022 (6.5%) than in 2013 (5.4%).

Medicare Households Spent $2,400 More on Health Care in 2022 Than in 2013, on Average, But Health Care Spending as a Share of Total Household Spending Varied Only Modestly Over These Years


Between 2019 and 2020, spending by Medicare households on food and transportation fell, likely reflecting stay-at-home policies established at the outset of the COVID-19 pandemic, and total household spending declined somewhat (Figure 4). By contrast, between 2021 and 2022, total household spending increased substantially, reflecting increases in all categories of household spending, as price inflation hit its highest level since 1981 in 2022. This was true for both Medicare households and non-Medicare households.

The Effects of the COVID-19 Pandemic and Recent Spike in Inflation Are Reflected in Household Spending Patterns Between 2019 and 2022


Discussion

The health care spending burden was twice as large for Medicare households than for non-Medicare households in 2022, measured by average health care spending as a share of total household spending, and a larger share of Medicare households spent at least 20% of their household budgets on health care than non-Medicare households. Of note, this analysis underestimates the health care spending burden for households that incur long-term care facility costs because the Consumer Expenditure Survey does not include people who reside in facilities. This exclusion is more likely to affect the spending burden estimates for Medicare households than non-Medicare households since spending on long-term care facilities is a significant share of average out-of-pocket health care costs for people with Medicare.

With health care use increasing with age and with most Medicare beneficiaries living on relatively low incomes and modest financial assets to draw upon in retirement, it’s not unexpected that health care is a bigger cost burden for Medicare households. This cost burden has important implications for policy debates, including the level of cost-sharing and premiums in Medicare. Policies aimed at improving financial protections for Medicare beneficiaries have been proposed in recent years. The Inflation Reduction Act of 2022 includes several provisions that lower prescription drug costs for people with Medicare, including a cap on Medicare beneficiaries’ out-of-pocket spending under the Medicare Part D benefit; a limit on insulin cost sharing to $35 a month in Medicare Part B and Part D; and expanded eligibility for full Part D Low-Income Subsidies. Policy makers have also considered other proposals that would improve the affordability of health care for Medicare beneficiaries, such as expanding income eligibility thresholds for the Medicare Savings Programs to enable more people to qualify for these financial supports, and adding an out-of-pocket cap on cost sharing for benefits covered under traditional Medicare. Adopting such changes, however, would require additional federal spending.

This work was supported in part by AARP. KFF maintains full editorial control over all of its policy analysis, polling, and journalism activities.

Nancy Ochieng and Juliette Cubanski are with KFF. Anthony Damico is an independent consultant.

Methods

This analysis uses 2013-2022 data from the Bureau of Labor Statistics Consumer Expenditure Survey (CE). The CE provides data on expenditures, income, and demographic characteristics of consumers in the United States.

The CE is a survey of households (“consumer units”), excluding people residing in institutions such as long-term care facilities. A consumer unit consists of any of the following: (1) all members of a particular household who are related by blood, marriage, adoption, or other legal arrangements; (2) a person living alone or sharing a household with others or living as a roomer in a private home or lodging house or in permanent living quarters in a hotel or motel, but who is financially independent; or (3) two or more persons living together who use their incomes to make joint expenditure decisions. Financial independence is determined by spending behavior with regard to the three major expense categories: housing, food, and other living expenses.

Total expenditures include the following components of household expenditures: food; housing; transportation; health care; entertainment; personal care products and services; reading; education; tobacco products and smoking supplies; cash contributions: life, endowment, annuities, and other personal insurance; contributions to retirement pensions and Social Security. Note that total expenditures for each consumer unit does not include tax expenditures, such as income tax.

Total health care expenditures include spending on four subcomponents of health care: health insurance premiums, medical services, prescription drugs, and medical supplies.

The estimates presented in this analysis are averages for demographic groups of consumer units, not per capita estimates, and thus are not comparable to estimates based on other surveys that report per capita estimates, such as out-of-pocket health care spending reported in the Medicare Current Beneficiary Survey. Expenditures by individuals would differ from the average even if the characteristics of the group are similar to those of the individual. Another source of differences between averages reported here and elsewhere is that the spending data are based on survey self-reports and therefore are subject to nonsampling error, including the inability or unwillingness of respondents to provide accurate data.

Unless otherwise noted, all differences discussed in the text are significant at the 95% confidence level.


News Release

Most Parents Haven’t Heard Misinformation About the Measles Vaccine though Significant Shares Are Uncertain About the Validity of Claims

Majorities across Partisans Say Social Media Companies Should Take Steps to Restrict Health Misinformation Even if It Limits Some Freedoms

Published: Mar 14, 2024

As rates of childhood vaccination decline and with measles on the rise again, a KFF Health Misinformation Tracking Poll, fielded in late February, examines the extent to which adults have heard and believe misinformation about the measles vaccine. The poll also examines the public’s views of the U.S. government and social media companies’ role in moderating false health claims online.

While most of the public—including parents—haven’t heard misinformation about the measles vaccine, many are uncertain about the validity of one specific false claim. About one in five adults (18%, including 19% of parents of children under age 18) say they have heard or read the claim, “Getting the measles vaccine is more dangerous than becoming infected with measles.”

A relatively small share leans towards believing the claim is true. Regardless of whether they have heard the claim, a fifth of adults (19%), including one quarter of parents (25%), say the claim is “definitely” or “probably” true. Six percent of U.S. adults—including about one in ten (9%) parents—say they have heard the claim and think it is probably or definitely true.

Across partisans, levels of educational attainment, and race and ethnicity, fewer than five percent of adults say that the claim is “definitely true,” meaning that there are few ardent believers in this piece of misinformation. However, independents (37%) and Republicans (21%) are less likely than Democrats (59%) to be certain that the claim is “definitely false.” Those without a college degree (29%) are also less likely to say that the claim is false than those with a college degree (55%).

Large Shares Support Social Media Companies in Restricting Health Misinformation at the Expense of Certain Freedoms

Later this March, the Supreme Court will hear arguments in three important cases related to misinformation on social media that will have implications for how the U.S. government and social media companies interact with users and can moderate information.

Two-thirds (68%) of the public views the spread of health misinformation on social media as a bigger problem than censorship of speech on social media platforms (31%). This sentiment is in turn reflected in opinions about what kind of action social media companies should take to curb the spread of false health claims.

Large shares of the public support social media companies in tamping down on misinformation even at the expense of certain freedoms. About two-thirds (66%) of adults overall say, “Social media companies should restrict false health information, even if it limits people from freely publishing or accessing information,” while one-third instead say “People’s freedom to publish and access health information should be protected, even if it means false information can also be published.

The public is more divided about whether the U.S. government should take action. Nearly six in ten adults overall (57%) say, “The U.S. government should require social media companies to take steps to restrict false health information, even if it limits people from freely publishing or accessing information,” while about four in ten (42%) say “People’s freedom to publish and access health information should be protected, even if it means false information can also be published.”

There are partisan divisions on both these questions, with Democrats more likely than independents or Republicans to favor both the government and social media companies taking action to restrict false health information. Notably, however, majorities of Democrats (82%), independents (57%), and Republicans (56%) say that social media companies should take steps to restrict health misinformation even if it limits certain freedoms.

The Health Misinformation Tracking Poll is part of a new KFF program area focused on identifying and monitoring health misinformation and trust in the United States, emphasizing communities that are most adversely affected by misinformation, including people of color, immigrants, and rural communities.

Designed and analyzed by public opinion researchers at KFF, the poll was conducted from February 20-28, 2024, online and by telephone among a nationally representative sample of 1,316 U.S. adults including 283 parents. Interviews were conducted in English and in Spanish. The margin of sampling error is plus or minus 3 percentage points for the full sample and 7 percentage points for the sample of parents. For results based on other subgroups, the margin of sampling error may be higher.

Five Key Facts About Immigrants with Limited English Proficiency

Published: Mar 14, 2024

About half (47%) of immigrant adults in the U.S. have limited English proficiency (LEP), meaning that they speak English less than very well. Immigrants with LEP come from diverse backgrounds and speak a variety of languages. The top five languages spoken by people with LEP include Spanish (63%), Chinese (7%), Vietnamese (3%), Arabic (2%), and Tagalog (2%), while the remaining roughly quarter (23%) of people with LEP speak other languages. Having LEP can impact individuals’ daily lives and access to health coverage and care. Below are five key facts about immigrants with LEP drawing on the 2023 KFF/LA Times Survey of Immigrants.

About half (53%) of immigrants with LEP say they have faced language barriers in a variety of interactions, including accessing health care.

About three in ten immigrants with LEP report that difficulty speaking or understanding English has ever made it hard for them to get health care services (31%), receive services in a store or restaurants (30%), or get or keep a job (29%) (Figure 1). A quarter say it has made it hard to apply for government financial assistance for food, housing, or health coverage, and about one in five (22%) cite difficulty reporting a crime or getting help from the police. These difficulties are more pronounced among lower income immigrants with LEP. Among immigrants who are parents with LEP (52% of all immigrant parents), about one in four (24%) report difficulties communicating with their child’s school.

About Half Of Immigrants With LEP Face Language Barriers In A Variety Of Settings And Interactions


Immigrants with LEP (21%) are twice as likely to be uninsured as immigrants who are English proficient (10%).

Immigrants with LEP are twice as likely as English proficient immigrants (defined as speaking English exclusively/very well) to be uninsured (21% vs 10%) (Figure 2), and parents with LEP are about three times as likely to say they have a child who is uninsured compared to English proficient immigrant parents (14% vs. 5%).This pattern reflects lower rates of private coverage among immigrants with LEP due to disproportionate employment in lower income jobs that are less likely to offer employer-based insurance. While Medicaid helps fill some of this gap, some may also face linguistic and other barriers to enrollment even if they are eligible for coverage.

Immigrants With LEP Are Twice As Likely To Be Uninsured As English Proficient Immigrants


Immigrants with LEP face greater barriers to accessing health care and report worse health compared to their English proficient counterparts.

Reflecting their higher uninsured rates and other barriers, immigrants with LEP are somewhat less likely than those who are English proficient to say they have a usual source of care other than the emergency room (77% vs 84%), have a trusted health care provider (68% vs. 80%) and to have seen a health care provider within the past year (74% vs. 80%). However, they are twice as likely as their English proficient immigrants to report fair or poor health status (28% vs. 14%). Community health centers (CHCs) play a particularly important role serving immigrants with LEP, with about four in ten (39%) saying that they usually rely on a CHC for care, reflecting CHCs’ role serving uninsured populations and their provision of linguistically and culturally appropriate services.

Immigrants With LEP Report More Barriers To Accessing Health Care and Worse Health Than English Proficient Immigrants


About half (55%) of immigrant workers with LEP report experiencing discrimination at work.

While immigrants with LEP are as likely as their English proficient peers to be employed (64% vs 67%), they are more likely to be in hourly jobs (60% vs. 45%) and less likely to receive a salary (21% vs 42%) (Figure 4). Reflecting these patterns, they are more likely to have lower incomes, with 55% having household incomes of less than $40,000 per year compared with 28% of English proficient immigrants. Half (55%) of immigrant workers with LEP report experiences with discrimination at work, such as being given fewer opportunities for advancement compared to people born in the U.S. doing the same job (38%), getting paid less (34%),not getting paid for all hours they worked (25%), being given undesirable work shifts or having less control over their hours than people born in the U.S. doing the same work (21%), or being harassed or threatened by someone at their work because they are an immigrant (14%).

About Half Of Working Immigrants With LEP Report Experiencing Discrimination At Work


About six in ten immigrants with LEP say they lack sufficient information about U.S. immigration policy (58%) and are unsure about public charge rules (62%).

About six in ten immigrants with LEP (58%) say they do not have enough information about U.S. immigration policy to understand how it affects them and their family compared with 34% of English proficient immigrants (Figure 5). Immigrants with LEP primarily get their information on immigration policy from a search engine such as Google (30%), a U.S. government website (26%), or an attorney or other professional (24%). They are less likely than English proficient immigrants to seek information from an internet search engine and more likely to rely on an attorney or other professional and other sources of information such as news media, social media, and family and friends. Information gaps among immigrants with LEP extend to public charge rules, with 62% saying they are unsure about whether using government programs to help pay for health care, housing, or food will decrease their chances of being approved for a green card compared with 55% of those who are English proficient, and another 17% incorrectly believing this to be the case.

About Six In Ten Immigrants With LEP Say They Do Not Have Enough Information About Immigration Policy
News Release

KFF Examines the Hyde Amendment and its Impact in States Without Abortion Bans

Published: Mar 14, 2024

KFF takes a new look at the continued impact of the Hyde Amendment, the federal ban on payment for abortion services, in the wake of the Supreme Court’s Dobbs decision. At a moment when all eyes are on states that have banned abortion, the Hyde Amendment remains a barrier to abortion care for people with low incomes in states where abortion is legal but the state restricts Medicaid coverage to the narrow exceptions allowed under Hyde.

Today, the policy limits abortion coverage in 19 states and the District of Columbia where abortion isn’t banned. The policy potentially affects 5.5 million women ages 15 to 49 who reside in those states and are covered by Medicaid.

Since 1977, the Hyde Amendment has banned the use of federal funds for abortion, allowing exceptions to pay for terminating pregnancies that endanger the life of the pregnant person or that result from rape or incest.  This policy has limited abortion coverage for millions of pregnant people on Medicaid, as well others who rely on federal programs such as Medicare, TRICARE, and the federal Employee Health Benefit Program for their coverage.

This longstanding federal funding ban has had a disproportionate effect on women with low incomes and women of color who are covered by Medicaid at higher rates and are more likely to seek abortion care because of persistent systemic barriers to care and contraceptive access. Some states choose to pay for abortions for their Medicaid enrollees in other instances but use their own state revenues, not federal funds, to cover the service.

For more information about the federal programs affected by the Hyde Amendment, the impact of the law on access to abortion services, and the potential effect if the law were to be repealed, check out the brief, “The Hyde Amendment and Coverage for Abortion Services Under Medicaid in the Post-Roe Era.”