5 Key Facts About Medicaid Work Requirements
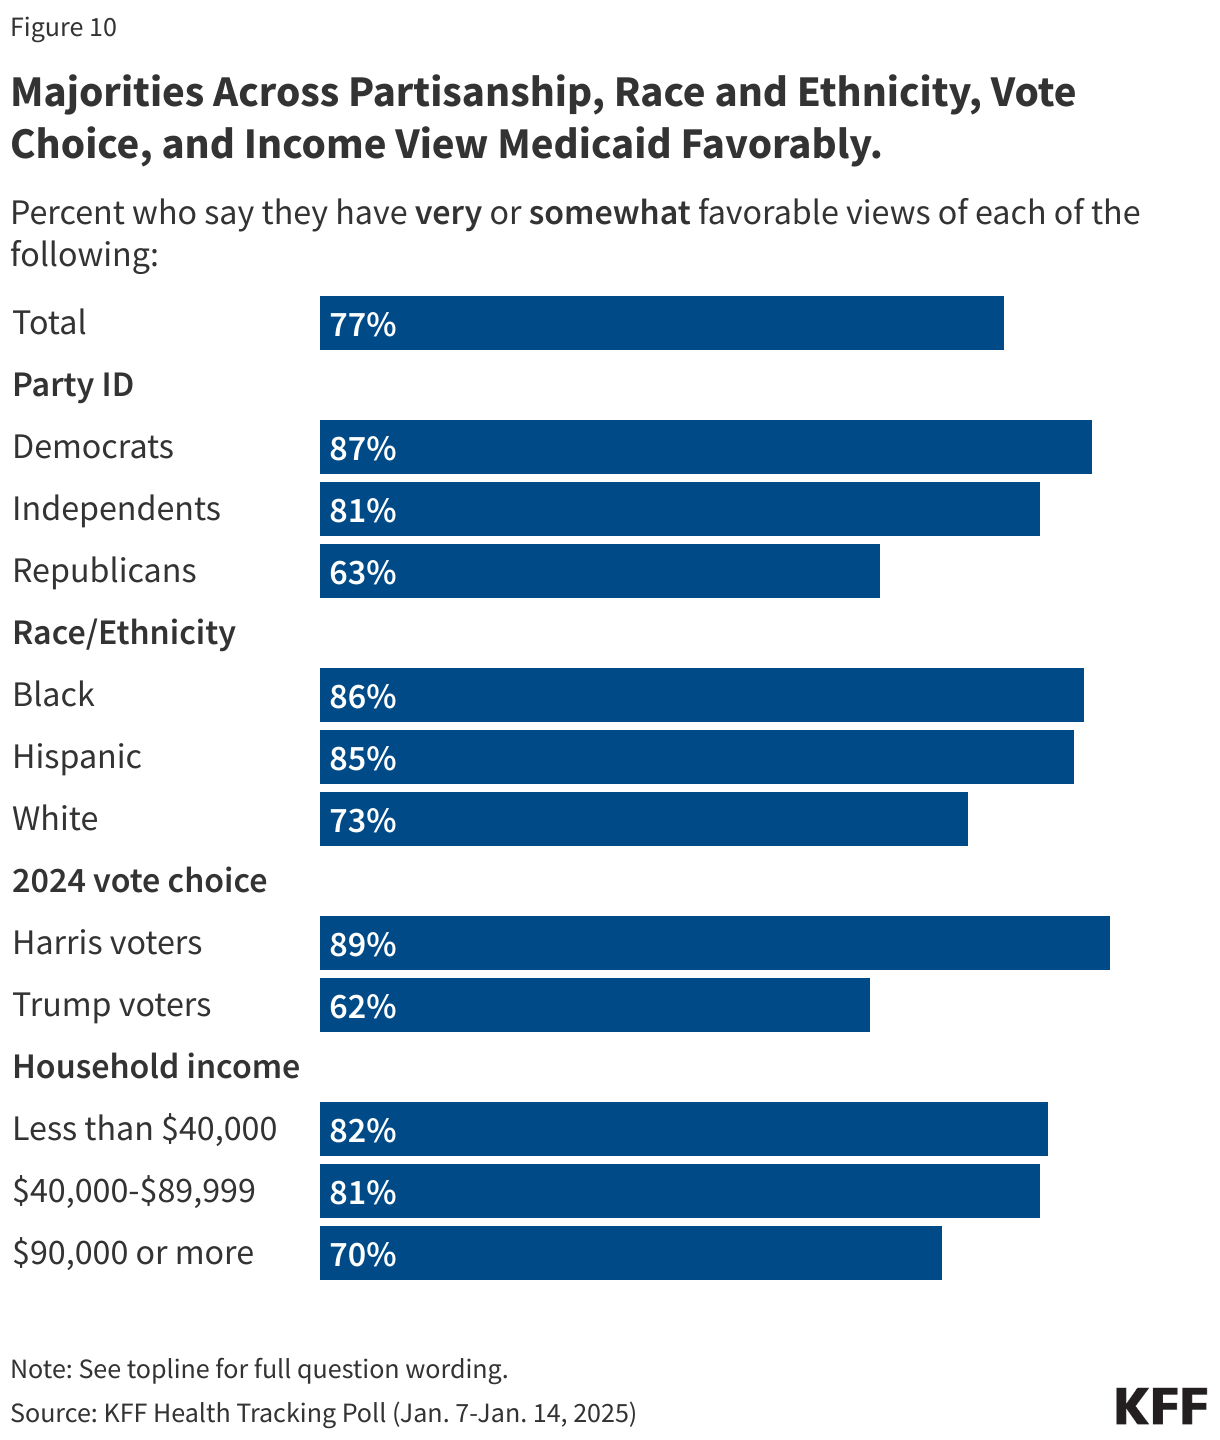
Work requirements in Medicaid have resurfaced as part of a broader legislative package of potential changes to Medicaid designed to significantly reduce federal Medicaid spending. Reductions could help offset the costs of extending expiring tax cuts. A draft bill introduced in the U.S. House of Representatives in February 2025 includes a minimum work requirement for certain adults enrolled in Medicaid as a condition of coverage. The idea of promoting “work” is popular, particularly among Republicans who view Medicaid as a form of welfare. As debate heats up about Medicaid work requirements, data show most Medicaid adults are working or face barriers to work. Many Medicaid adults who are working low-wage jobs are employed by small firms and in industries that have low employer-sponsored insurance offer rates.
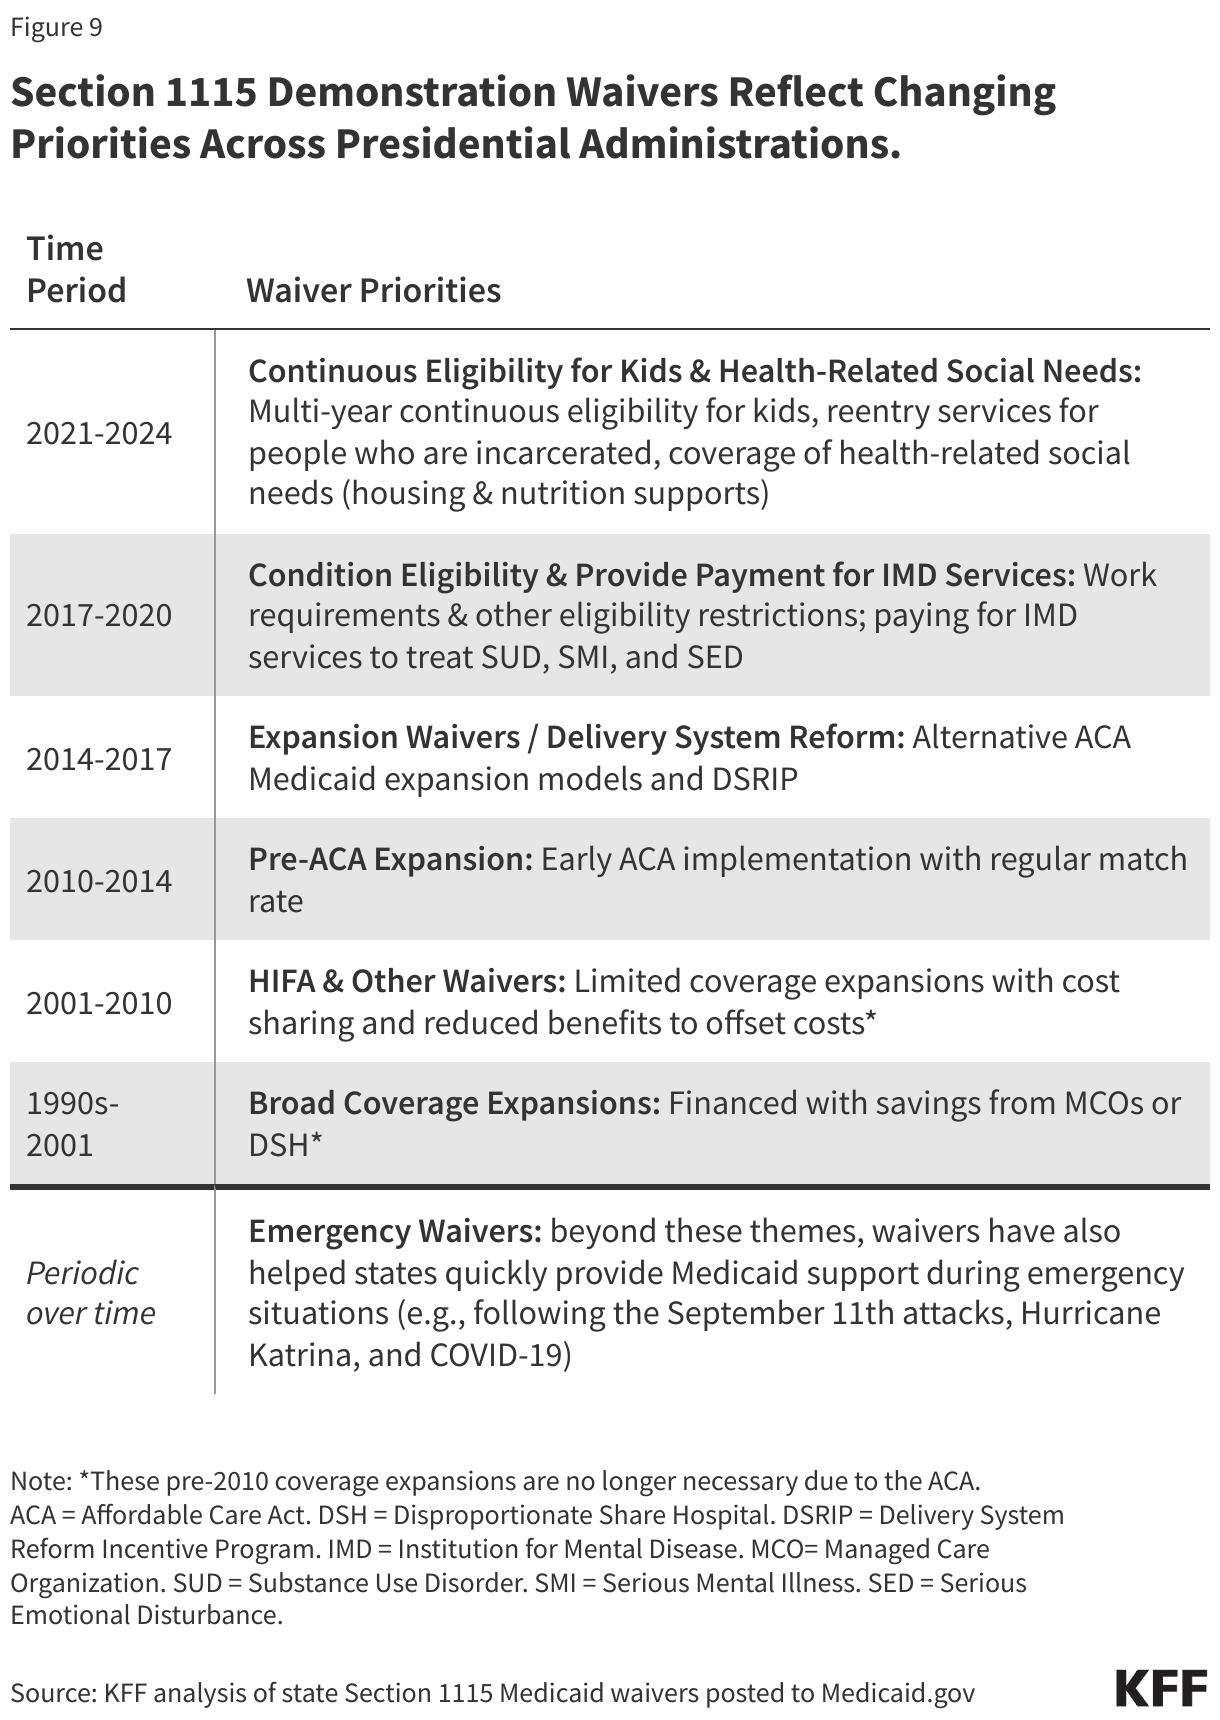
If Congress does not include work requirements in federal legislation, some states will pursue Medicaid work requirements through Medicaid demonstration waivers. The first Trump administration encouraged and approved “Section 1115” demonstration waivers that conditioned Medicaid coverage on meeting work and reporting requirements, approving 13 state work requirement waivers. Only Arkansas implemented such requirements with consequences for noncompliance, which resulted in over 18,000 people losing coverage. These approvals were either rescinded by the Biden administration or withdrawn by states, and Georgia is the only state with a Medicaid work requirement waiver in place (following litigation over the Biden administration’s attempt to stop it). While work requirement waivers were the subject of litigation during the Trump and Biden administrations, the Supreme Court never ruled on the issue leaving it open for future administrations. This issue brief highlights five key facts about Medicaid work requirements, including what research shows about the impact of work requirements.
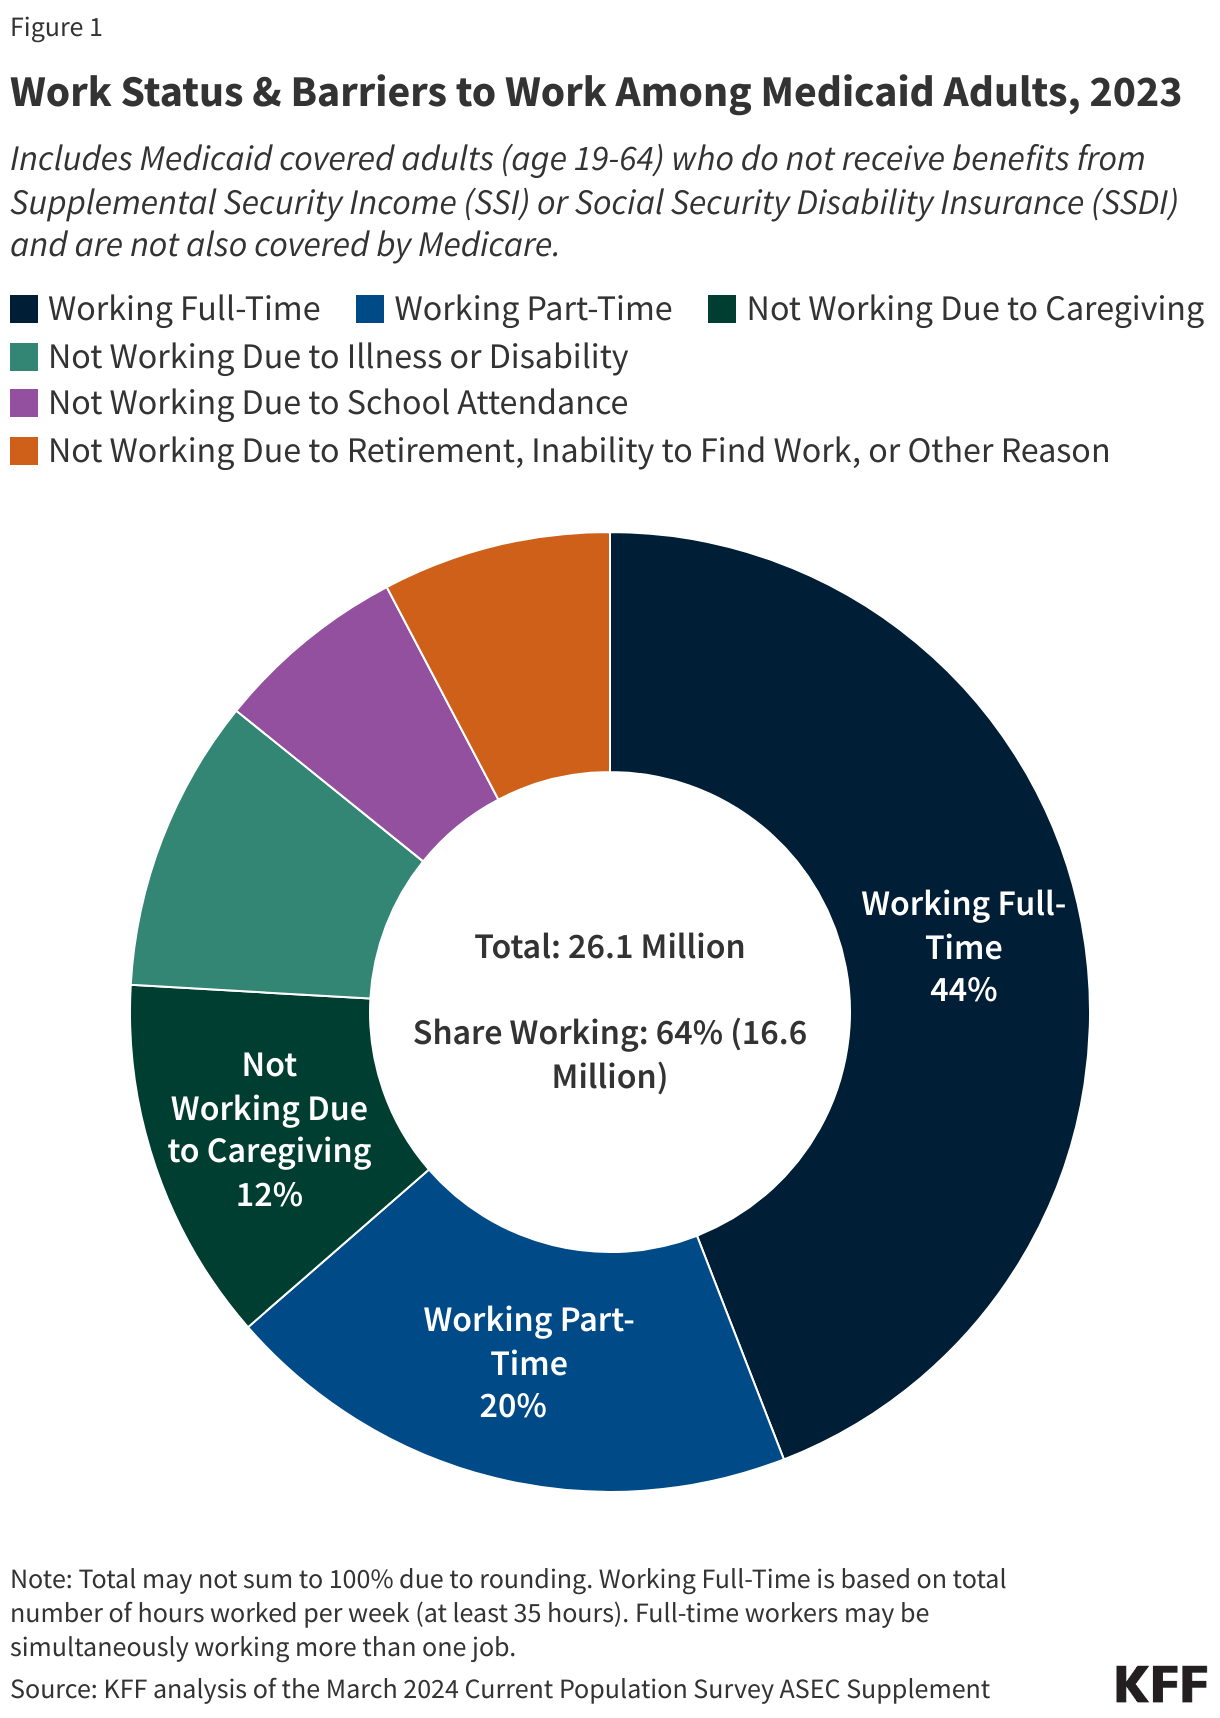
1. Most Medicaid adults under age 65 are working already, without a “work requirement.”
Among adults under age 65 with Medicaid who do not receive benefits from the Social Security disability programs, Supplemental Security Income (SSI) and Social Security Disability Insurance (SSDI), and who are not also covered by Medicare, 92% were working full or part-time (64%), or not working due to caregiving responsibilities (12%), illness or disability (10%), or school attendance (7%) (Figure 1). The remaining 8% of Medicaid adults reported that they are retired, unable to find work, or were not working for another reason. Those in better health, with more education, and without disabilities are more likely to be working. Many Medicaid adults who work are employed by small firms or in industries (e.g., agriculture, service) with historically low employer-sponsored health insurance rates; even if eligible for job-based insurance, some low-wage workers may not take up the offer because it is not affordable to them.
2. CBO estimates of national work requirements show lower federal spending and an increase in the number of uninsured, but no increase in employment.
In April 2023, the U.S. House of Representatives passed a debt ceiling bill (HR 2811, the Limit, Save, Grow Act of 2023) that included a requirement for states to implement work requirements for certain Medicaid enrollees. While this bill never became law, the Congressional Budget Office (CBO) estimated (under this proposal) each year an average of 15 million enrollees would be subject to the requirements and 1.5 million would lose eligibility for federal funding, resulting in federal savings of $109 billion over a ten-year period (2023 – 2033). CBO analysis also showed the policy would increase the number of people without health insurance (by 600,000) but would not increase employment. CBO cited evidence of the effects of Medicaid work and reporting requirements implemented in Arkansas, the only state where a work requirement was established with disenrollment for noncompliance.
A 2022 CBO report notes high rates of employment among SNAP and Medicaid recipients leave little room to increase employment rates further. When people (who are not working) have conditions that make it difficult to find and keep employment (e.g., disabilities, caregiving responsibilities etc.), CBO indicates work requirements are less likely to lead to employment and more likely to reduce income/benefits. Targeted work supports (e.g., childcare, transportation, job training) can boost employment for some; however, CBO notes Medicaid and SNAP do not provide such supports.
3. In Arkansas, implementing Medicaid work requirements resulted in more than 18,000 people losing coverage.
Arkansas implemented Medicaid work and reporting requirements with consequences for noncompliance before a federal court deemed the work requirement unlawful. The requirements were in effect from June 2018 through March 2019. More than 18,000 people lost coverage, or about 25% of the population subject to the requirement, primarily due to failure to regularly report work status or document eligibility for an exemption. Researchers found work and reporting requirements in Arkansas were associated with losses in Medicaid coverage, an increase in the percentage of adults who were uninsured, and no significant change in employment—as nearly everyone targeted by the policy met the requirements already or qualified for an exemption. More recent research looking at two-year impacts of Arkansas’s work and reporting requirements found disenrollment was also associated with poorer medication adherence, delays in care, and medical debt.
Georgia has not expanded Medicaid under the ACA but expanded eligibility (under its “Pathways” waiver) to 100% of the federal poverty level (FPL) for parents and childless adults, with initial and continued enrollment conditioned on meeting work requirements. The current waiver does not include any exemptions (e.g., for caregiving). The waiver was implemented in July 2023 and as of January 2025, the state had only enrolled about 6,500 adults, considerably short of the state’s own estimates (25,000 adults in the first year and 64,000 over 5 years). In August 2024, Georgia’s governor announced a $10.7 million ad campaign aimed at boosting Pathways low enrollment. The Pathways waiver expires in September 2025. The state is seeking changes in its waiver renewal application including allowing parents / caretakers of children up to age 6 (in households at or below 100% FPL) to receive Medicaid without work requirements and eliminating the requirement to monthly report work activities (in exchange for annual reporting).
4. Evidence shows Medicaid work and reporting requirements are confusing to enrollees and complex and costly for states to implement.
In Arkansas, lack of awareness and confusion about the requirements were common. Despite robust outreach efforts, many enrollees were not successfully contacted. Lack of computer literacy and internet access were also barriers, as individuals were required to report on their work or exemption status monthly using an online portal. Providers reported the most vulnerable enrollees (e.g., people with disabilities, people experiencing homelessness) were the most likely to face barriers in complying with the requirements. (While proponents of Medicaid work requirements often describe these policies as applying to “able-bodied” adults, people with disabilities may be subject to the requirements—as many people with disabilities do not meet criteria to receive Supplemental Security Income (SSI) and therefore qualify for Medicaid based on income (vs. disability status).) Although Arkansas’s program included safeguards intended to protect coverage for people with disabilities and others who should not have been subject to the requirements from losing coverage, few people used these safeguard measures relative to the number who lost coverage.
For states, implementing work requirements involves complex systems changes (e.g., developing or adapting eligibility and enrollment systems), enrollee outreach and education, and staff training. GAO examined selected states’ estimates of the administrative costs to implement work requirements and found costs varied from under $10 million to over $270 million. States estimated that federal funds would cover most of these costs, largely due to higher matching rates of 75% and 90% percent of applicable IT costs. GAO found CMS did not consider administrative costs when approving Medicaid work requirement demonstrations. According to data obtained by KFF Health News, Georgia’s “Pathways” program cost the state and federal government more than $40 million (through June 2024), with nearly 80% of costs spent on program administration and consulting fees (vs. paying for health care).
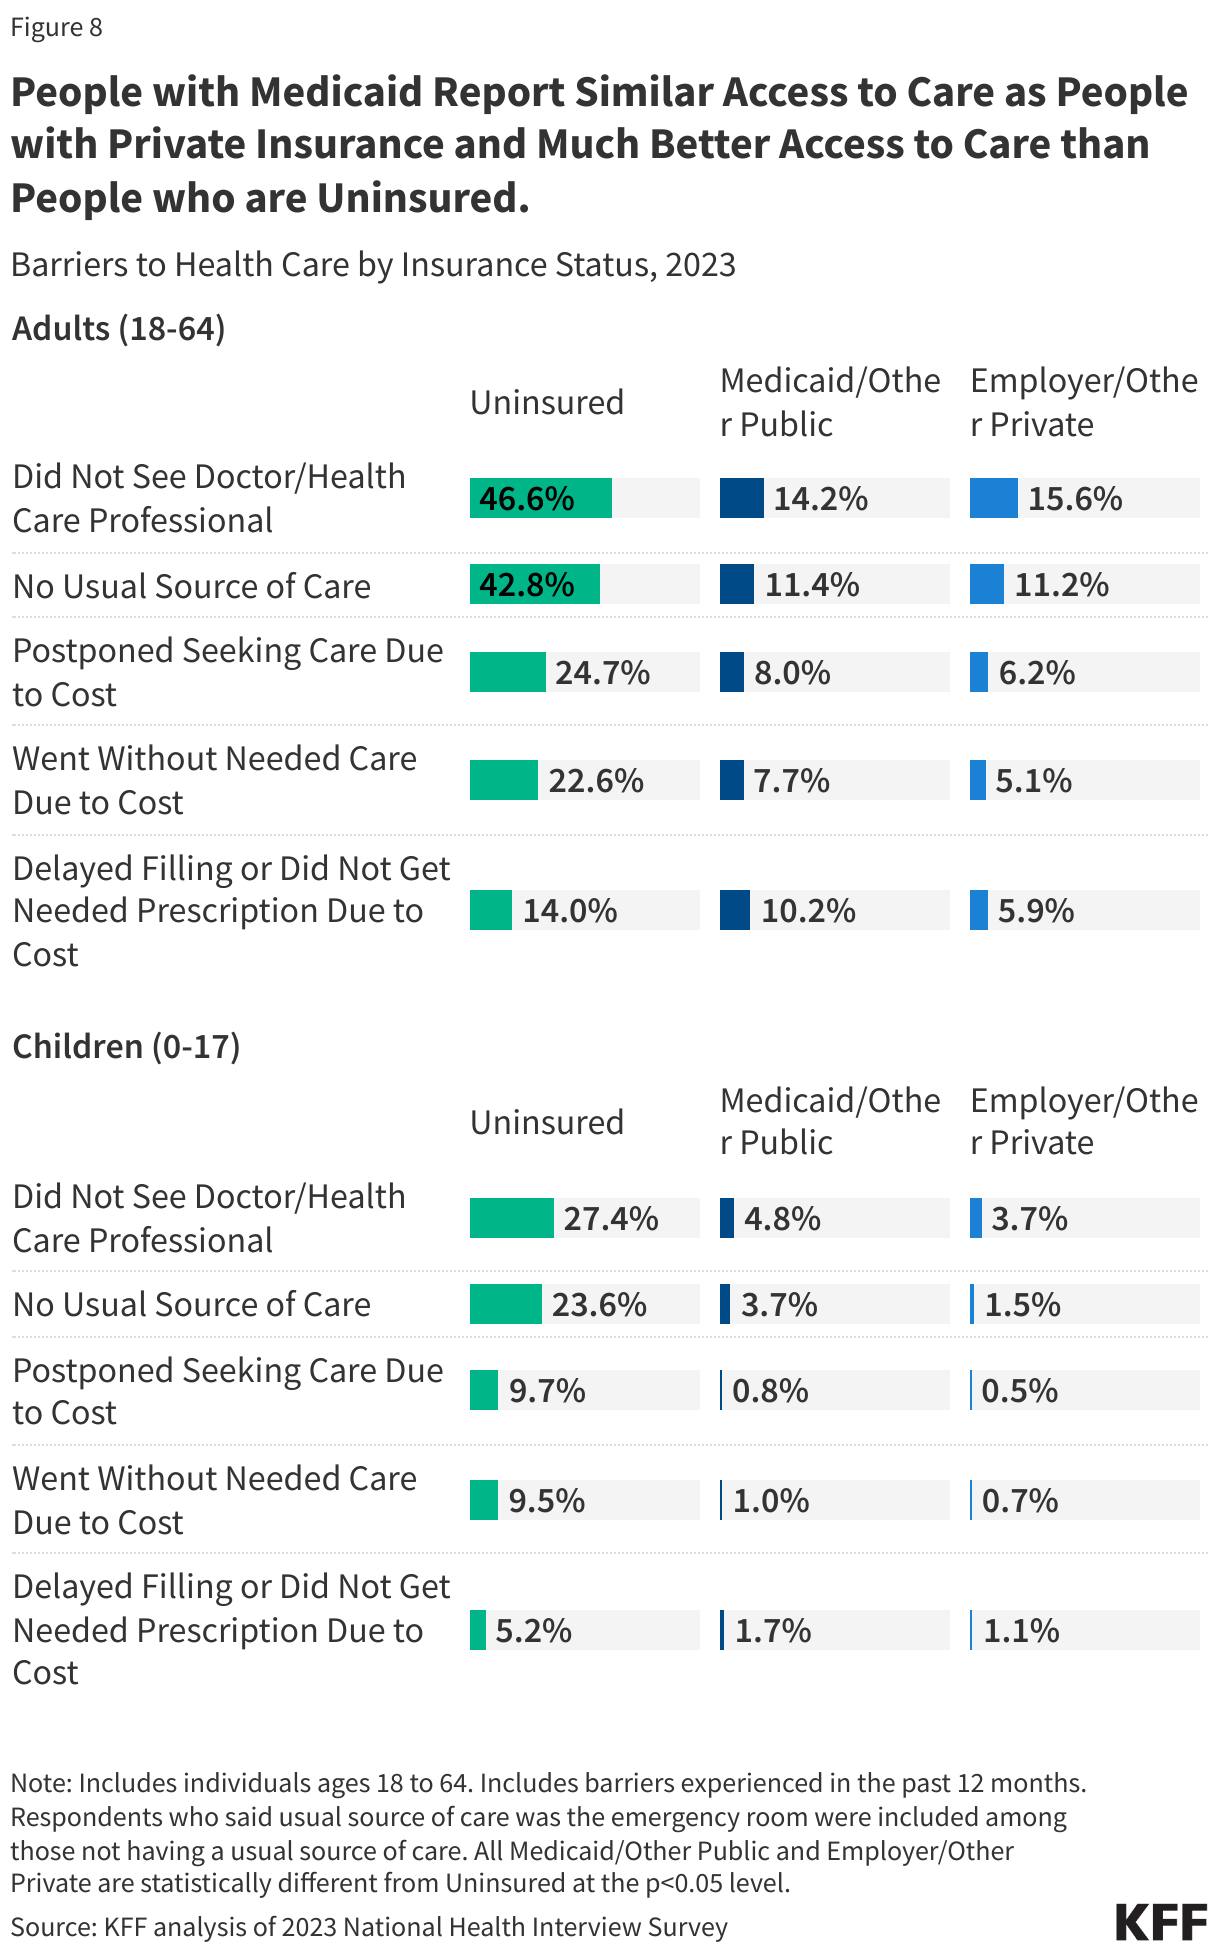
5. Research shows access to affordable health insurance and care promotes individuals’ ability to obtain and maintain employment.
Research shows that being in poor health is associated with increased risk of job loss, while access to affordable health insurance has a positive effect on the ability to obtain and maintain employment. Many of the jobs held by people with low incomes involve walking, standing, lifting and carrying objects, repetitive motions, and other physical labor. Most Medicaid adults work in industries with low offer rates for employer-sponsored insurance, such as the agriculture and service industries. As a result, working does not replace the need for affordable coverage, including Medicaid coverage. Having access to regular preventive health care to manage chronic conditions, access medications, and address health issues before they worsen can help support work. In addition, an unmet need for mental health or addiction treatment results in greater difficulty with obtaining and maintaining employment, and Medicaid is an important source of coverage for mental health and addiction treatment services, such as opioid addiction.


 Irving Washington
  Hagere Yilma