Potential Impacts of 2025 Budget Reconciliation on Health Coverage for Immigrant Families
Editorial Note
Originally published on May 15, 2025. This content was updated on September 10, 2025 to clarify the provisions in the final bill signed into law on July 4, 2025.
Introduction
Congressional Republicans recently passed a budget reconciliation package that will make significant changes to Medicaid and the Affordable Care Act (ACA), with a number of provisions specifically limiting access to health coverage for immigrants. The bill was signed into law on July 4, 2025 and includes provisions to meet spending targets that would make significant cuts to the Medicaid program and also include immigrant eligibility restrictions for ACA Marketplaces and Medicare. Beyond these changes, reductions have been made in other areas that would have significant impacts for immigrant families, including eligibility restrictions for the Child Tax Credit and the Supplemental Nutrition Assistance Program. The legislation also provides hundreds of billions of dollars in additional funding for immigration enforcement. This includes funding to further militarize enforcement and build detention centers for immigrant children and families.
This policy watch discusses key provisions in the new law that are aimed at limiting health coverage for immigrant families. These provisions would likely increase the uninsured rate among immigrant families, including citizen children in those families, and have broader ramifications for the nation’s workforce and economy given the role immigrants play.
Medicaid Changes
Eliminate Medicaid and CHIP eligibility for many lawfully present immigrants. Under current law, in addition to meeting other eligibility requirements, lawfully present immigrants must have a “qualified” immigration status to be eligible for Medicaid or CHIP. Qualified immigrants include lawful permanent residents (LPRs); refugees; individuals granted parole for at least one year; individuals granted asylum or related relief; certain abused spouses and children; certain victims of trafficking; Cuban and Haitian entrants; and citizens of the Freely Associated States (COFA migrants) residing in states and territories. In addition, many lawfully present immigrants must wait five years after obtaining qualified status before they may enroll in Medicaid; states may waive the five-year wait for children and pregnant individuals. Some states have state-only funded coverage programs for undocumented immigrants. Undocumented immigrants already are ineligible for federally funded Medicaid coverage. Emergency Medicaid pays hospitals for the costs of emergency care provided to immigrants who would qualify for Medicaid except for their immigration status, which hospitals are required to provide under federal law.
A provision in the final version of the bill that was signed into law will restrict the definition of qualified immigrants for purposes of Medicaid or CHIP eligibility to LPRs, Cuban and Haitian entrants, citizens of the Freely Associated States (COFA migrants) lawfully residing in the US, and lawfully residing children and pregnant adults in states that cover them; thereby eliminating Medicaid eligibility for many lawfully present immigrants. These eligibility restrictions would further limit access to health coverage for lawfully present immigrants likely resulting in an increase in their uninsured rate and increased barriers to accessing care. This provision will become effective October 1, 2026.
Reduce the federal Medicaid match rate for Emergency Medicaid for immigrants who would be eligible for Medicaid expansion coverage but for their immigration status. Currently, undocumented immigrants and some lawfully present immigrants are not eligible for federally funded Medicaid coverage. Emergency Medicaid reimburses hospitals for the costs of emergency care provided to immigrants who would qualify for Medicaid except for their immigration status, which hospitals are required to provide under federal law. Data from the Centers for Medicare and Medicaid Services show that spending on Emergency Medicaid accounts for less than 1% of total Medicaid spending. The final bill that was signed into law will limit federal matching payments for Emergency Medicaid for individuals who would otherwise be eligible for expansion coverage except for their immigration status to the state’s regular federal Medicaid match rate as opposed to the expansion match rate. This change will shift costs to states to reimburse hospitals for the costs of care they are required to provide, but only in states that have expanded Medicaid under the ACA. This provision will become effective October 1, 2026.
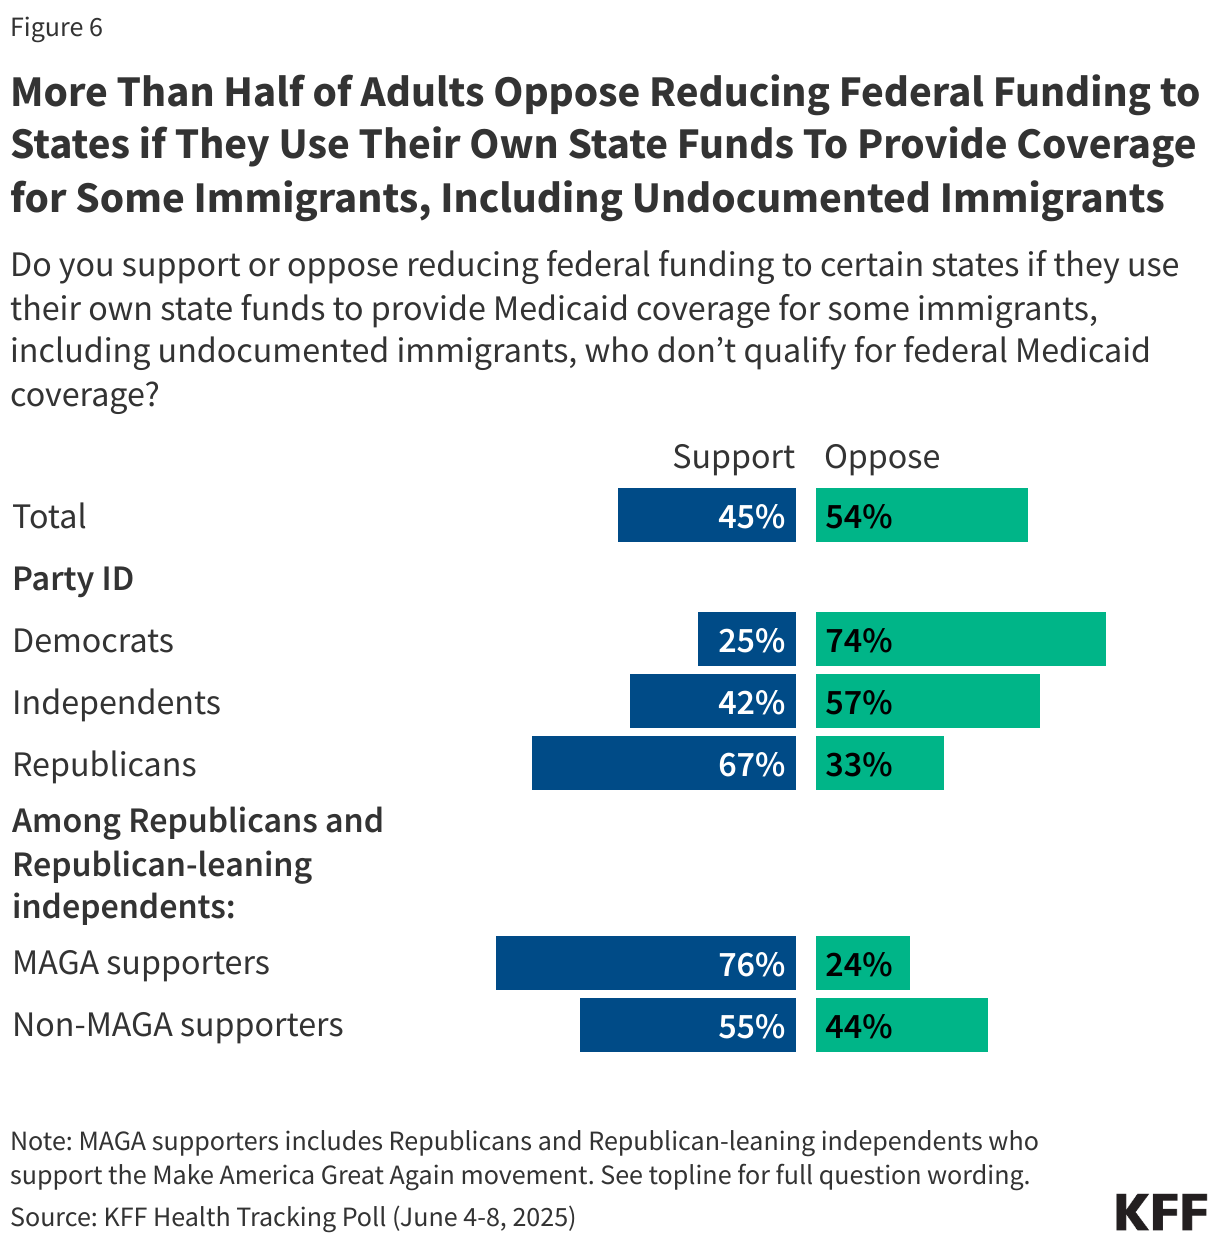
Under the initial House-passed bill, reduce the federal Medicaid match rate for the ACA Medicaid expansion group from 90% to 80% for states that use their own funds to expand health coverage to certain immigrants, but this provision was not included in the final version of the bill. Some states have established fully state-funded coverage programs for at least some undocumented and lawfully present immigrants who are not eligible for federally funded Medicaid. As of April 2025, 14 states plus DC provide health coverage to children regardless of immigration status, including 7 states plus DC that extend coverage to at least some adults regardless of immigration status. The initial House-passed bill would have penalized states that offer this coverage by reducing the expansion match rate from 90% to 80% for states that provide health coverage or financial assistance, including using their own funds, to purchase health coverage for individuals who do not have a qualified status (including undocumented immigrants) and who are not lawfully residing children or pregnant adults covered under the Medicaid option for these groups. This provision was removed from the final version of the bill that was signed into law.
Under the House-passed bill, end requirement and federal Medicaid financing for states to cover people while they are verifying immigration or citizenship status, but this provision was not included in the final version of the bill. Under current law, states verify an applicant’s immigration status for Medicaid through the Department of Homeland Security’s Systematic Alien Verification for Entitlements (SAVE) system, which can provide automatic real-time verification. If the SAVE system cannot verify immigration status in real time, states are required to provide Medicaid benefits to applicants during a “reasonable opportunity period” of 90 days while their immigration status is being verified, if they meet all other eligibility criteria. Under the initial House-passed bill, states would no longer have been required to provide Medicaid benefits to applicants during a “reasonable opportunity period,” although they could do so at state option. The provision would also have prohibited states from claiming federal matching funds during a reasonable opportunity period, meaning that, if states elected to provide this coverage, they would do so with solely state funds. This provision was removed from the final version of the bill that was signed into law.
Changes to ACA Marketplace Coverage
Eliminate ACA Marketplace coverage for many lawfully present immigrants. Under existing law, citizens and lawfully present immigrants are eligible to enroll in ACA Marketplace coverage and receive premium subsidies and cost-sharing reductions. The group of lawfully present immigrants eligible for Marketplace coverage is broader than the group of “qualified immigrants” who are eligible for Medicaid. In general, Marketplace coverage is limited to individuals with incomes at or above 100% of the federal poverty level (FPL), since most of those with lower incomes would be eligible for Medicaid. However, because some lawfully present immigrants with lower incomes remain ineligible for Medicaid (e.g., due to the five-year waiting period), Marketplace eligibility was also extended to lawfully present immigrants with incomes under 100% FPL who do not qualify for Medicaid due to their immigration status.
A provision in the final version of the bill signed into law would limit eligibility for subsidized ACA Marketplace coverage to lawfully present immigrants who are lawful permanent residents (LPRs or “green card” holders), Compact of Free Association (COFA) migrants residing in the U.S., and certain immigrants from Cuba and Haiti, thereby eliminating eligibility for many lawfully present immigrants, including asylees, refugees, people with Temporary Protected Status, as well as Deferred Action for Childhood Arrivals (DACA) recipients beginning January 1, 2027. The legislation also eliminates eligibility for subsidized Marketplace coverage for all lawfully present immigrants with incomes under 100% of the federal poverty level beginning January 1, 2026, leaving some ineligible for either Medicaid or Marketplace coverage.
Changes to Medicare Coverage
Eliminate Medicare eligibility for many lawfully present immigrants. Currently, lawfully present immigrants are eligible for Medicare if they have the required work quarters and meet the disability or age requirements. Those without required work history can also purchase Medicare Part A after residing legally in the U.S. for five years continuously. A provision in the final version of the bill signed into law would limit Medicare eligibility to lawfully present immigrants who are LPRs (“green card” holders), COFA migrants residing in the United States, and certain immigrants from Cuba and Haiti. This will eliminate eligibility for many lawfully present immigrants including refugees, asylees, and people with Temporary Protected Status. Current beneficiaries subject to the new restrictions would lose coverage no later than 18 months from enactment of the legislation. The Commissioner of Social Security would review beneficiaries to identify those who would be subject to the restrictions and notify them that their benefits will be terminated.
Health Coverage and Economic Implications
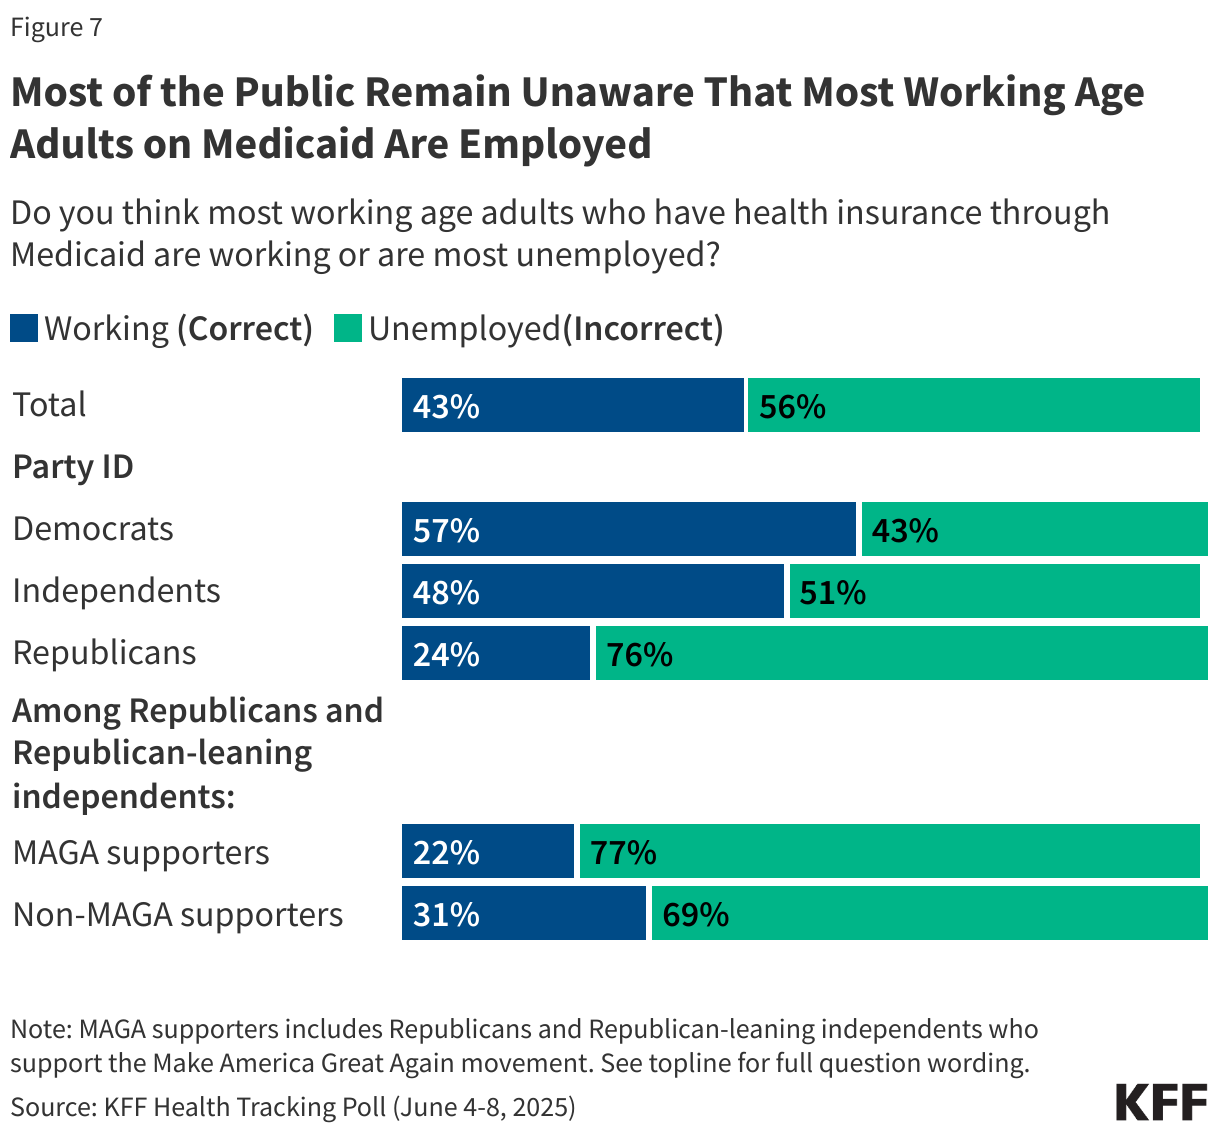
Noncitizen immigrants already are disproportionately likely to be uninsured due to limited access to health coverage options. Although most are working, they tend to be employed in industries and jobs that are less likely to offer employer-sponsored health coverage and face eligibility restrictions for federally funded health coverage. The provisions highlighted in this policy watch will further curtail access to health coverage for both undocumented and lawfully present immigrants and will likely lead to coverage losses and increased barriers to care among immigrant families. Because parental coverage has spillover effects on children’s coverage, coverage losses among immigrant parents may also lead to coverage losses for citizen children in immigrant families. Overall, one in four children in the U.S. lives with an immigrant parent, including one in ten (12%), or 9 million, who are citizen children with a noncitizen parent. People who are uninsured often delay or go without needed care, which can contribute to health conditions becoming worse and more costly. Data from the 2023 KFF/LA Times Survey of Immigrants show that uninsured immigrant adults are about three times as likely as their insured counterparts to report not having a usual source of care other than an emergency room (42% vs. 13%) and not having had a doctor’s visit in the past 12 months (52% vs. 18%); they also are about twice as likely to report skipping or postponing care in the past 12 months (36% vs. 19%). Reduced coverage and access to care may also negatively impact the U.S. economy and workforce due to lost productivity since immigrants play an outsized role in many occupations including health care, construction, and agriculture.