Health and Health Care Experiences of Uninsured Immigrants 

Published: Jul 30, 2026

Introduction

As of 2024, there were about 50 million immigrants residing in the U.S. Within this group, there were 24 million noncitizen immigrants, including lawfully present and undocumented immigrants, and 26 million naturalized citizens, who accounted for about 7% and 8% of the total population, respectively. Actions taken by the Trump administration and Congress will likely have major impacts on health and health care for immigrant families, including increasing the number of uninsured immigrants.

While undocumented immigrants have been ineligible for federally-funded health coverage programs under longstanding policy, the 2025 reconciliation law includes new eligibility restrictions for many lawfully present immigrants, including refugees and asylees, to access Medicaid and the Children’s Health Insurance Program (CHIP), subsidized Affordable Care Act (ACA) Marketplace, and Medicare coverage. The CBO estimates that 1.4 million lawfully present immigrants could lose health coverage by 2034 due to the law’s eligibility changes. Research shows that having insurance makes a difference in whether and when people access needed care. Those who are uninsured often delay or go without needed care, which can lead to worse health outcomes over the long-term that may ultimately be more complex and expensive to treat.

This brief provides data on health and health care experiences of uninsured immigrant adults based on a KFF survey of immigrant adults ages 18 and older conducted in partnership with The New York Times in Fall 2025. The data provide insight into how the projected coverage losses under the 2025 reconciliation law may impact health and health care for immigrant families as more lawfully present immigrants become uninsured. Key takeaways include the following:

Compared to those with insurance coverage, uninsured immigrant adults are more likely to not have a usual source of care and to delay or go without health care. Half of uninsured immigrant adults say that they do not have a usual source of health care other than the emergency room compared to about one in six (16%) of their insured counterparts. Further, half of uninsured immigrant adults report skipping or postponing care, twice the share of those with coverage (50% vs. 26%). Nearly one in five (18%) of all uninsured immigrant adults said their health got worse as a result of skipping or postponing health care.

Cost or lack of coverage is the primary reason uninsured immigrant adults cite for skipping or postponing care, reflecting the role insurance plays in facilitating access to care. Almost half (46%) of uninsured immigrant adults say they delayed or went without care because of cost or lack of insurance compared to 14% of insured immigrant adults. Overall, about seven in ten (69%) uninsured immigrant adults say they have had problems paying for health care (62%), housing (41%), or food (36%) in the past 12 months. In comparison, over four in ten (44%) insured immigrant adults report problems paying for health care (31%), housing (29%), or food (26%) in the past 12 months.

Consistent with other research demonstrating that parental coverage affects children’s health coverage and access to care, uninsured immigrant parents are three times as likely as those with insurance coverage (32% vs. 10%) to say they have at least one child who is uninsured. Further, over four in ten (44%) uninsured immigrant parents say any of their children delayed or skipped health care in the past 12 months compared to about a quarter (26%) of those with insurance coverage.

Findings

Characteristics of Uninsured Immigrants

About one in seven (15%) immigrant adults age 18 and older report being uninsured as of 2025, with higher uninsured rates among those who are noncitizens, Hispanic, lower income, have limited English proficiency (LEP), or live in states with less expansive coverage. Nearly half of likely undocumented immigrant adults (46%) and one in five lawfully present immigrant adults (21%) report being uninsured compared to fewer than one in ten of their U.S.-born (6%) and naturalized citizen (7%) counterparts (Figure 1). Uninsured rates also are higher among immigrant adults who are Hispanic (27%), have lower incomes (household income of less than $40,000 per year) (23%), or have LEP (23%) compared to their White (5%), higher income (household income of $90,000 or more per year) (4%), and English proficient (10%) counterparts, likely reflecting that these groups also are more likely to be noncitizens. Further, immigrant adults who live in states that provide less expansive coverage, including not adopting the ACA Medicaid expansion to all low-income adults or any coverage expansions for immigrants, are about twice as to be uninsured compared with those living in states with more expansive policies (23% vs. 11%).

About One in Five Lawfully Present Immigrant Adults and Nearly Half of Likely Undocumented Immigrant Adults Report Being Uninsured (Bar Chart)

Access to Health Care

Half of uninsured immigrant adults say they do not have a usual source of care other than an emergency room (Figure 2). In comparison, about one in six (16%) insured immigrant adults say they do not have a usual source of care other than an emergency room. Research shows that having a usual source of care is associated with better access to health care even after controlling for demographic and socioeconomic characteristics.

Half of Uninsured Immigrant Adults Say They Do Not Have  a Usual Source of Care Other Than the Emergency Room (Bar Chart)

Uninsured immigrant adults are about twice as likely as those who are insured to report delaying or going without needed care (50% vs. 26%) (Figure 3). Delaying or going without needed care can contribute to health problems becoming worse and taking more time and resources to treat.  Nearly one in five (18%) of uninsured immigrant adults say they skipped or postponed health care and their health got worse compared to 9% of insured immigrant adults. 

Uninsured Immigrant Adults Are  Twice as Likely as Insured Immigrant Adults to Skip or Postpone Health Care (Stacked Bars)

Uninsured immigrant adults are more likely than those with insurance to cite cost or lack of coverage and immigration-related concerns as reasons for delaying or going without care. Almost half (46%) of uninsured immigrant adults say they delayed or went without care because of cost or lack of insurance compared to 14% of insured immigrant adults (Figure 4). Additionally, 16% of uninsured immigrant adults identified concerns about their or a family member’s immigration status as a reason compared to 4% of insured immigrant adults, likely reflecting that uninsured immigrants include a higher share of likely undocumented immigrants. Similar shares of uninsured (14%) and insured immigrant adults (12%) cited not being able to find services at a time or location that worked for them as a reason for delaying or going without care. Language barriers were also cited by some of those with LEP.

Uninsured Immigrant Adults Are More Likely Than Those With Insurance To Cite Cost or Lack of Coverage as Reasons for Skipping or Postponing Care (Split Bars)

Likely reflecting their lower incomes, uninsured immigrant adults report more difficulty paying for basic needs, including health care, compared to those with insurance. Six in ten uninsured immigrant adults say that it has been harder to earn a living since January 2025 (60%) and about seven in ten (69%) say they have had problems paying for basic necessities such as health care (62%), housing (41%), or food (36%) in the past 12 months (Figure 5). These shares are higher compared to those with insurance coverage, with the largest gap in difficulty paying for health care (62% vs. 31%).

Uninsured Immigrant Adults Are More Likely to Report Problems Paying for Health Care and Other Basic Needs Than Their Insured Counterparts (Split Bars)

Impacts of Parental Coverage on Children’s Coverage and Access to Care

Uninsured immigrant parents are about three times as likely as insured immigrant parents (32% vs. 10%) to report at least one uninsured child as of 2025 (Figure 6). Further, over four in ten (44%) uninsured immigrant parents say any of their children delayed or skipped health care in the past 12 months compared to about a quarter (26%) of those with insurance coverage. These findings are consistent with other research showing that parental coverage impacts children’s access to health coverage and care.

Uninsured Immigrant Parents Are More Likely Than Immigrant Parents With Insurance Coverage to Say That Their Child is Uninsured And That Their Child Delayed or Skipped Health Care (Split Bars)
Poll Finding

KFF Health Tracking Poll: Mifepristone and the Midterms

Published: Jul 30, 2026

Key Takeaways

  • The latest KFF Health Tracking Poll finds that though a majority of the public has heard of the abortion medication mifepristone, public awareness of its prevalence and longstanding safety record is limited. Six in ten adults say they have heard of mifepristone, but just one in four (26%) correctly identify abortion pills as the most common way abortions are administered in the U.S. Additionally, while about four in ten (44%) adults say abortion pills are safe when taken according to a health care provider’s instruction, one in seven (15%) say they are unsafe and four in ten (41%) are unsure of their safety.
  • The FDA’s re-evaluation of the safety of mifepristone is now underway, following Health and Human Services Secretary Robert F. Kennedy Jr.’s call to the federal health agency late last year. Public confidence in the FDA to make decisions based on science when reviewing the safety of mifepristone is somewhat limited as slightly more than half (54%) say they have little to no confidence at all in this regard. Partisans differ over the motivation behind the review, with a majority of Republicans saying it was mostly to protect the health and safety of women and a similar majority of Democrats saying it was to make abortion pills more difficult to access.
  • Majorities of the public oppose laws restricting medication abortion, though Republicans lean more in support. Two-thirds of the public – including large majorities of Democrats and independents – oppose laws that would ban mifepristone nationwide (65%) and laws that would make it a crime for health care providers to mail abortion pills to patients in states with abortion bans (64%).  Republicans are notably split on the issue of banning mifepristone nationwide (52% support, 48% oppose), while a majority (57%) of Republicans support laws criminalizing health care providers mailing abortion pills to patients in states with abortion bans.
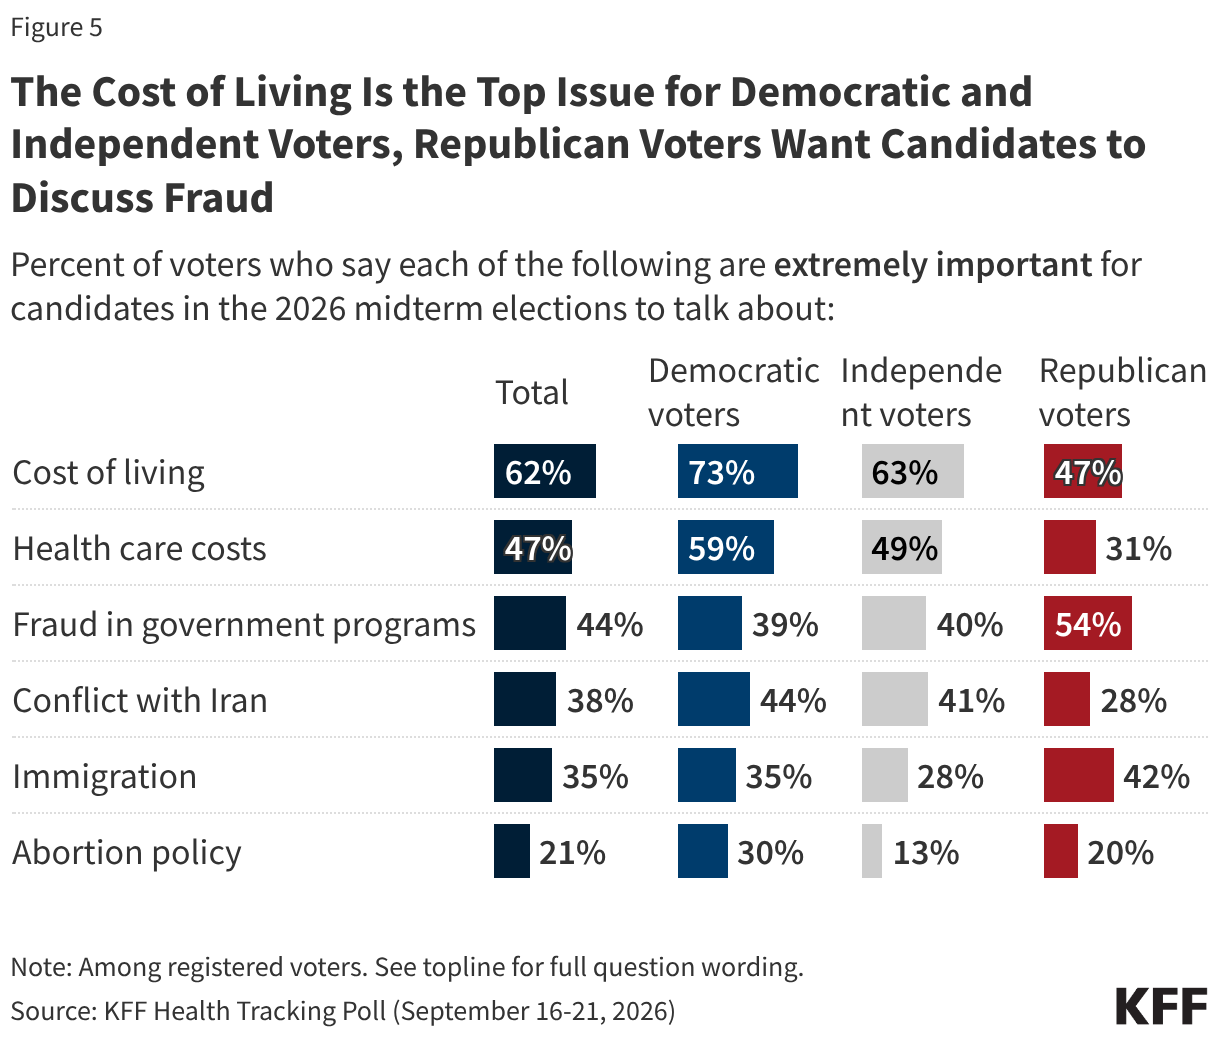
  • While health costs and the future of government health programs are key health issues for voters in the upcoming midterm elections, a majority of voters (57%) say it is “extremely” or “very important” for candidates to discuss abortion policy. Since the Dobbs decision, abortion policy remains a core issue for Democratic voters. Four in ten Democratic voters say abortion policy is “extremely important” for 2026 midterm candidates to talk about, compared to fewer independent (22%) and Republican (20%) voters. The Democratic Party has the advantage over the Republican Party when it comes to which political party voters trust more on the issue of abortion (39% vs. 28%, respectively), though nearly three in ten (27%) voters say they trust neither party on this issue. Among independent voters, the Democratic Party has the edge over the Republican Party (35% vs. 19%), though four in ten say they trust neither party on the issue.

Sizeable Shares of the Public Are Unaware of Mifepristone’s Prevalence and Safety

Mifepristone, commonly known as the abortion pill, is one of two drugs that are used in medication abortion, the most common abortion method in the United States. While mifepristone has been approved by the FDA for over 25 years and has a longstanding safety record, Congressional Republicans and anti-abortion groups continue to call into question the safety of the abortion pill. The latest KFF Health Tracking Poll finds six in ten (60%) adults have heard of the abortion medication mifepristone, including two-thirds (66%) of women of reproductive age (ages 18 to 49). Public awareness of mifepristone has risen sharply since the overturning of Roe v. Wade and the lawsuits and public scrutiny of the abortion pill that followed, increasing from 31% in January 2023 to about six in ten since then.

Despite increased awareness of mifepristone, the public is still largely unaware that most abortions in the U.S. are done by taking abortion pills. About one-quarter of adults (26%) correctly identify abortion pills as the most common way abortions are administered in the United States, while another quarter (26%) incorrectly say medical procedures are the most common, and nearly half (48%) say they are not sure. Democrats, independents, women of reproductive age, and adults who identify as “pro-choice” are most likely to correctly say most abortions in the U.S. are done using abortion pills. Yet, even among these groups, about half say they are not sure how most abortions in the U.S. are provided.

Stacked bar chart showing share of adults who believe most abortions in the United States are done using abortion pills, a medical procedure, or are unsure of the correct answer. Results shown by total, women of reproductive age, party, and view on abortion.

A large share of the public is unaware of the abortion medication’s longstanding safety record. Less than half (44%) of adults say abortion pills are safe when taken according to a health care provider’s instruction, about three times larger than the share who say they are unsafe (15%). Still, four in ten (41%) adults are “not sure” about the safety of abortion pills when administered according to a health care provider’s instruction.

Similar shares of adults overall say abortion pills are safe compared to last year (42% in November 2025). Among women ages 18 to 49, the group who would be most directly impacted by changes to the availability of mifepristone, about half (52%) say abortion pills are safe when taken as directed by a health care provider, a share that has increased from four in ten (41%) last November. Currently, one in five (19%) women ages 18-49 say they are not safe and three in ten are not sure of their safety.

Looking at women across racial and ethnic groups, Black women are less likely than White women to say abortion pills are safe (33% vs. 51%) and more likely than White women to say they are unsure how safe they are (51% vs. 35%). Among Hispanic women, about four in ten (42%) say abortion pills are safe, while a similar share (41%) say they are unsure.

Partisans differ in their assessment of the safety of mifepristone, with about six in ten Democrats (61%) saying medication abortion pills are “very” or “somewhat safe,” compared to about four in ten (44%) independents and three in ten Republicans. Larger shares of independents (42%) and Republicans (50%) than Democrats (30%) say they are not sure whether abortion pills are safe.

Stacked bar chart showing share of adults who believe abortion bills are very safe, somewhat safe, somewhat unsafe, very unsafe, or are unsure of the correct answer. Results shown by total, women of reproductive age, and party.

Public Divides Over Motives Behind FDA Review of Mifepristone and Ability to Conduct a Scientific Review

Last September, Health and Human Services Secretary Robert F. Kennedy Jr. and the FDA Commissioner at the time—Dr. Marty Makary—wrote to Republican state attorneys general in response to states’ concerns about mifepristone, announcing the FDA would conduct another review of the abortion pill’s safety. This new review has now begun and FDA officials are investigating whether the abortion pill’s current Risk Evaluation and Mitigation Strategy (REMS) is “sufficient to protect women from unstated risks” following the 2023 update that removed the in-person dispensing requirement and therefore made the drug accessible through telehealth. Depending on the safety review’s conclusions, the FDA could restrict mifepristone access, potentially limiting its availability through telehealth and mail, limiting the ability of advance practice clinicians from prescribing the medication, or removing pharmacies as authorized dispensers.

The latest KFF Health Tracking Poll finds a slim majority (54%) of the public has little to no confidence in the FDA to make decisions based on science when it comes to reviewing the abortion pill’s safety—including one in four (24%) who say they have no confidence “at all.” Fewer than half (46%) have “a lot” (10%) or “some” (36%) confidence. Among women of reproductive age, about half (52%) say they have little to no confidence, while 47% say they have at least some confidence. This limited trust is consistent with KFF’s Health Information and Trust research, which has found less than half of adults have confidence in the FDA’s ability to fulfill core responsibilities, such as making recommendations about childhood vaccine schedules and ensuring the safety and effectiveness of vaccines.

Across partisans, about half of Democrats and Republicans say they have little or no confidence (47% of Democrats; 53% of Republicans) in the FDA to make decisions based on science when evaluating the safety of mifepristone and similar shares say they have least some confidence (53% of Democrats; 47% of Republicans). Among independents, most (57%) say they have little to no confidence at all in the FDA in this regard.

Stacked bar chart showing share of adults who believe abortion bills are very safe, somewhat safe, somewhat unsafe, very unsafe, or are unsure of the correct answer. Results shown by total, women of reproductive age, and party.

When asked about the motivation behind Secretary Kennedy’s request to the FDA to review the safety of the abortion pill, the public is split, with half (51%) saying this decision was mostly to “make it more difficult to access abortion pills,” and another half (48%) saying it was mostly to “protect the health and safety of women.”

Notably, Democrats are more likely to say the reasoning behind Kennedy’s request was to “make it more difficult to access abortion pills” (71%), while Republicans are more likely to say it was to “protect the health and safety of women” (73%). Independents are split with about half saying the decision was to make abortion access more difficult (53%) and half saying it was to protect women’s safety (47%).

Women ages 18 to 49 are also divided on the motivation behind Secretary Kennedy’s request, with about half saying his call to review mifepristone was to “make it more difficult to access abortion pills” (55%) and another half saying it was to “protect the health and safety of women” (45%).

Split bar chart showing share of adults who believe RFK Jr.'s call for an FDA review of mifepristone is to protect the health and safety of women versus make it more difficult to access abortion pills. Results shown by total, women of reproductive age, and party.

The latest KFF Health Tracking Poll finds majorities oppose laws that would place further restrictions on medication abortion. Around two-thirds of adults say they oppose banning the use of mifepristone, or medication abortion, nationwide (65%) and a similar share oppose making it a crime for health care providers to mail abortion pills to patients in states where abortion is banned (64%).

Eight in ten Democrats (81%) and two-thirds of independents (67%) say they oppose banning mifepristone entirely. However, Republicans are split in their views, with half (52%) saying they support laws that would ban the abortion pill nationwide while a similar share (48%) say they are opposed. And, while large majorities of Democrats (79%) and independents (66%) oppose laws making it a crime to mail abortion pills to patients in states with abortion bans, a majority (57%) of Republicans support such laws while 43% are opposed.

Unsurprisingly, about eight in ten adults who identify as pro-choice oppose the restrictive abortion laws asked about in this KFF Health Tracking Poll (78% banning mifepristone; 79% criminalizing the mailing of abortion pills to patients in states with abortion bans). Among those who identify as pro-life, majorities say they support these laws (57% and 61%, respectively), though sizeable shares—about four in ten—say they would oppose laws banning mifepristone nationwide (43%) and criminalizing the mailing of abortion pills to abortion-banned states (38%).

Split bar chart showing share of adults who support versus oppose laws that ban the use of mifepristone or medication abortion nationwide and laws that make it a crime for health care providers to mail abortion pills to patients in states where abortion is banned. Results shown by total and party.

Voters’ Attitudes Toward Abortion in the Upcoming Midterm Elections

While health costs and the future of government health programs such as Medicare and Medicaid are the health issues taking center stage in this election, a majority of voters (57%) say it is “extremely” (27%) or “very important” (31%) for candidates to talk about abortion policy. Looking at voters by views on abortion, slightly larger shares of pro-choice voters say abortion is extremely important for 2026 midterm candidates to discuss compared to their pro-life counterparts (30% vs. 22%).

Previous election-related polling at KFF has found that, since the Dobbs decision, voters who view abortion policy as an important issue are disproportionately Democrats, and this election is no exception. Three-quarters (73%) of Democratic voters say abortion policy is important for 2026 midterm candidates to talk about, including four in ten who say it is “extremely important.” Notably, the share who say abortion policy is “extremely important” is consistent among Democratic voters, regardless of whether those voters live in states where abortion is either banned or limited (40%) or where abortion is available (39%). In contrast, fewer independent (22%) and Republican (20%) voters say abortion policy is extremely important for midterm candidates to discuss.

Among Republican and Republican-leaning independent voters who support the Make America Great Again movement, nearly one in four (23%) say abortion policy is extremely important for candidates to discuss, compared to one in ten (11%) non-MAGA-supporting Republicans and Republican-leaning independents who say the same. About two-thirds of MAGA Republicans identify as pro-life (63%), while about four in ten (44%) non-MAGA supporting Republicans identify as pro-choice.

Stacked bar chart showing share of adults who believe most abortions in the United States are done using abortion pills, a medical procedure, or are unsure of the correct answer. Results shown by total, women of reproductive age, party, and view on abortion.

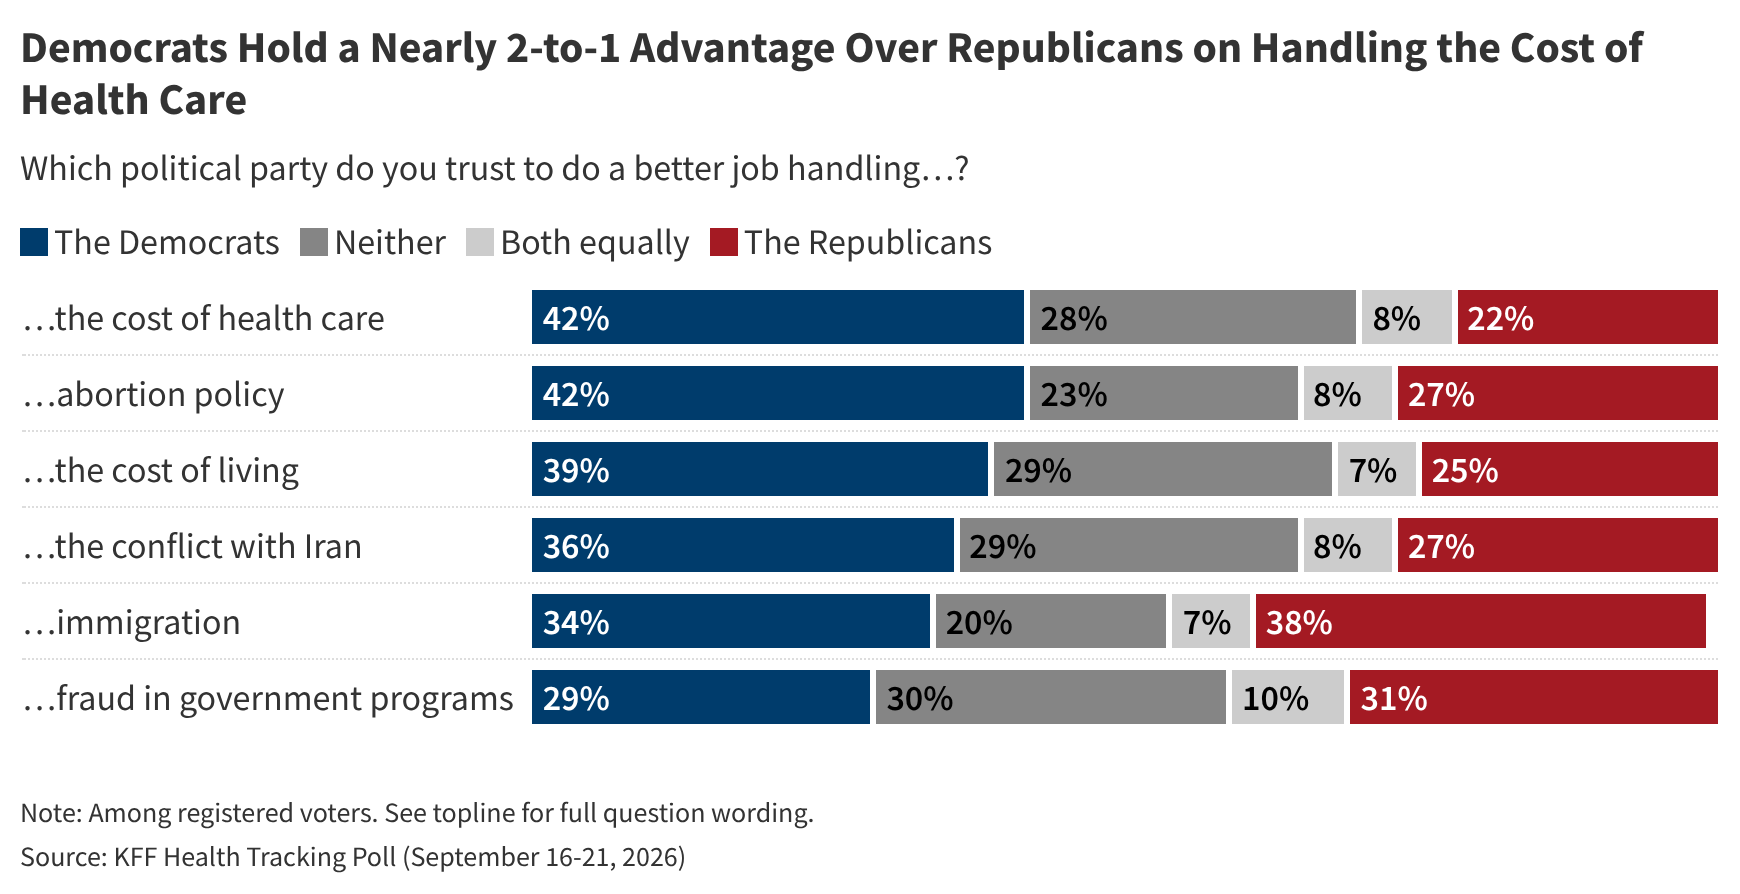
The Democratic Party has the advantage over Republicans when it comes to which political party voters trust more on the issue of abortion (39% vs. 28%, respectively), though nearly three in ten (27%) voters say they trust neither party on this issue. Women voters ages 18 to 49 and younger voters (ages 18 to 29) are notably among the most likely to trust the Democratic Party more (46% and 52%, respectively).

Unsurprisingly, voters are largely split across partisan identification when it comes to which political party they trust more on the issue of abortion. Among independent voters, the Democratic Party has the edge over the Republican Party (35% vs. 19%), though four in ten (41%) say they trust neither party on the issue.

Stacked bar chart showing share of adults who believe most abortions in the United States are done using abortion pills, a medical procedure, or are unsure of the correct answer. Results shown by total, women of reproductive age, party, and view on abortion.

This KFF Health Tracking Poll/KFF Tracking Poll on Health Information and Trust was designed and analyzed by public opinion researchers at KFF. The survey was conducted June 25 – June 30, 2026, online and by telephone among a nationally representative sample of 1,321 U.S. adults in English (n=1,238) and in Spanish (n=83). The sample includes 1,015 adults (n=69 in Spanish) reached through the SSRS Opinion Panel either online (n=990) or over the phone (n=25). The SSRS Opinion Panel is a nationally representative probability-based panel where panel members are recruited randomly in one of two ways: (a) Through invitations mailed to respondents randomly sampled from an Address-Based Sample (ABS) provided by Marketing Systems Groups (MSG) through the U.S. Postal Service’s Computerized Delivery Sequence (CDS); (b) from a dual-frame random digit dial (RDD) sample provided by MSG. For the online panel component, invitations were sent to panel members by email followed by up to three reminder emails.

Another 306 (n=14 in Spanish) adults were reached through random digit dial telephone sample of prepaid cell phone numbers obtained through MSG. Phone numbers used for the prepaid cell phone component were randomly generated from a cell phone sampling frame with disproportionate stratification aimed at reaching Hispanic and non-Hispanic Black respondents. Stratification was based on incidence of the race/ethnicity groups within each frame. Among this prepaid cell phone component, 142 were interviewed by phone and 164 were invited to the web survey via short message service (SMS).

Respondents in the prepaid cell phone sample who were interviewed by phone received a $15 incentive via a check received by mail or an electronic gift card incentive. Respondents in the prepaid cell phone sample reached via SMS received a $10 electronic gift card incentive. SSRS Opinion Panel respondents received a $5 electronic gift card incentive (some harder-to-reach groups received a $10 electronic gift card). In order to ensure data quality, cases were removed if they failed two or more quality checks: (1) attention check questions in the online version of the questionnaire, (2) had over 30% item non-response, or (3) had a length less than one quarter of the mean length by mode. Based on this criterion, 1 case was removed.

The combined cell phone and panel samples were weighted to match the sample’s demographics to the national U.S. adult population using data from the Census Bureau’s 2025 Current Population Survey (CPS), September 2023 Volunteering and Civic Life Supplement data from the CPS, and the 2026 KFF Benchmarking Survey with ABS and prepaid cell phone samples. The demographic variables included in weighting for the general population sample are gender, age, education, race/ethnicity, region, civic engagement, frequency of internet use and political party identification. The weights account for differences in the probability of selection for each sample type (prepaid cell phone and panel). This includes adjustment for the sample design and geographic stratification of the cell phone sample, within household probability of selection, and the design of the panel-recruitment procedure.

The margin of sampling error including the design effect for the full sample is plus or minus 3 percentage points. Numbers of respondents and margins of sampling error for key subgroups are shown in the table below. For results based on other subgroups, the margin of sampling error may be higher. Sample sizes and margins of sampling error for other subgroups are available on request. Sampling error is only one of many potential sources of error and there may be other unmeasured error in this or any other public opinion poll. KFF public opinion and survey research is a charter member of the Transparency Initiative of the American Association for Public Opinion Research.

GroupN (unweighted)M.O.S.E.
Total1,321± 3 percentage points
Total voters1,055± 4 percentage points
   
Democrats426± 6 percentage points
Independents439± 6 percentage points
Republicans358± 6 percentage points
   
Democratic voters372± 6 percentage points
Independent voters316± 7 percentage points
Republican voters312± 7 percentage points
   
Women ages 18-49414± 6 percentage points

Medicare’s Proposed Cut to 340B Drug Payments Would Hit Safety-Net Hospitals While Benefiting For-Profit Hospitals

Published: Jul 29, 2026

The recently proposed 2027 Medicare Hospital Outpatient Perspective Payment System (OPPS) rule from the Centers for Medicare & Medicaid Services (CMS) includes a proposal to reduce Medicare’s reimbursement for 340B drugs. The proposal would reduce reimbursement for 340B drugs from average sales price (ASP) plus 6% (what Medicare generally pays for Part B outpatient drugs administered by providers) to ASP minus 33.4%, a 37% reduction. CMS indicated that this change would better align Medicare reimbursement with hospitals’ costs of acquiring 340B drugs.

The 340B Drug Pricing Program requires drug manufacturers participating in Medicaid to sell outpatient drugs to eligible nonprofit and government providers at a substantial discount, allowing providers to earn larger profits when being reimbursed for 340B drugs. The intent of the program is to support providers, such as certain disproportionate share hospitals and federally qualified health clinics, that care for low-income and other underserved populations. Critics have raised concerns that the 340B program, which has grown substantially over time, is not well-targeted; that savings from the program are not shared with patients; and that the program incentivizes hospitals to acquire clinics and physician practices in order to extend 340B discounts to those settings, enabling them to generate more revenue. Supporters of the program say that revenues generated by the difference between Medicare (and other payer) reimbursement for 340B drugs and the discounted price help 340B providers care for underserved populations and invest in operations.

CMS based the amount of the proposed payment reduction on a cost acquisition survey of 340B drugs completed by hospitals in early 2026. This proposed change revives an earlier effort by CMS to reduce Medicare payments for 340B drugs that was implemented in 2018 under the first Trump administration, but the Supreme Court overturned that rule in 2022 because the agency had not first conducted a cost acquisition survey. If finalized, CMS’s proposed Medicare 340B payment reduction would take effect on January 1, 2027, and would have disparate effects on different types of hospitals, as described more below.

CMS’s proposed cut to 340B drug reimbursement would reduce Medicare spending on 340B drugs by an estimated $4.85 billion in 2027, while increasing spending on non-drug outpatient services by the same amount because of budget neutrality requirements. Under federal law, CMS is generally required to maintain the same amount of aggregate spending through OPPS regardless of reimbursement changes (i.e., maintain budget neutrality). Based on this requirement, CMS proposed an 8.44% across-the-board increase in payments for non-drug outpatient services covered under the OPPS, which the agency estimates will offset the impact of cuts to spending on 340B drugs in 2027.

The budget neutrality requirement means that savings from reductions in 340B payments to 340B hospitals would be redistributed to both 340B and non-340B hospitals through higher payments for non-drug outpatient services. Similarly, Medicare beneficiaries would face lower cost sharing on 340B drugs (e.g., based on 20% coinsurance applied to a lower amount) but higher cost sharing for non-drug outpatient hospital services. CMS estimates that Medicare beneficiaries who use 340B drugs would save $1.15 billion in total in 2027, but cost sharing would increase for beneficiaries who use non-drug outpatient hospital services based on Medicare’s proposed 8.44% payment increase.

Proposed cuts would reduce revenues among safety-net hospitals while increasing revenues among for-profit hospitals, among other differences. For 340B hospitals, total Medicare revenues would decrease or increase depending on how reliant they are on revenues from 340B drugs versus non-drug outpatient services, but non-340B hospitals would experience revenue increases only based on the higher payment rate for non-drug outpatient services. CMS’s proposal to reduce reimbursement for 340B drugs would exempt rural sole community hospitals (SCHs) (rural hospitals that are the only source of short-term, acute inpatient care in a region), children’s hospitals, and PPS-exempt cancer hospitals. Changes would not affect hospitals that are not reimbursed under the OPPS, including critical access hospitals (CAHs), which make up the majority of rural hospitals.

In the aggregate, some types of hospitals would lose or benefit more from these changes than others, based on estimates from CMS (Figure 1):

  • Safety-net hospitals would face a 5.8% net reduction of OPPS revenue under this proposal (see figure notes for definition of “safety-net hospitals”). Other types of hospitals would also see net reductions in OPPS revenue in the aggregate, including large urban hospitals (with 500 beds or more) (-5.2%), major teaching hospitals (-4.3%), government hospitals (-3.0%), and nonprofit hospitals (-0.5%). Some hospitals that would see the largest decrease in revenue likely fall into more than one of these categories (e.g., major teaching hospitals tend to be large urban hospitals).
  • For-profit hospitals would see a 7.4% net increase in OPPS revenues. For-profit hospitals are not eligible for the 340B program and so would only see increases in reimbursement for non-drug outpatient services. Other types of hospitals would also face net increases in Medicare OPPS reimbursement in aggregate, including rural SCHs (5.7%), small urban hospitals (with 0 to 99 beds) (4.8%), and non-teaching hospitals (3.5%). 
Proposed Change in Medicare Reimbursement for 340B Drugs Would Decrease Revenues for Safety-Net Hospitals but Increase Revenues for For-Profit Hospitals (Table)

Reductions in 340B payments could add to the financial challenges facing safety-net hospitals while increasing margins of for-profit hospitals. Safety-net hospitals have lower operating margins than average and so could have an especially difficult time absorbing any revenue losses from the 340B payment cut, while for-profit hospitals have much higher operating margins than the average hospital. Additionally, safety-net hospitals, which are particularly dependent on Medicaid revenues, are likely to be disproportionately affected by the 2025 reconciliation law, as it achieves most of its health care savings through federal Medicaid spending reductions.

The substantial growth of the 340B program in recent years has led hospitals, pharmaceutical companies, and policymakers to focus on whether and how to change the program. At the federal level, lawmakers have proposed options that would preserve or narrow the scope of the program and have proposed increasing transparency around the program, such as by requiring hospitals to report 340B savings. At the state level, some states have passed laws that would preserve the ability of hospitals to use multiple contract pharmacies to dispense 340B drugs, among other things. Other states have implemented requirements for hospitals to disclose the amount of savings generated from the 340B program (as required by Minnesota) or how those savings are spent.

Some pharmaceutical companies have attempted to start providing 340B drug discounts through a rebate model, an approach that would require hospitals to purchase 340B drugs at a non-discounted price and receive post-sale rebates after submitting claims information. These efforts have been halted by the courts due to lack of authorization from HHS, the agency that administers the 340B program. In 2025, the Trump administration attempted to implement the 340B Rebate Model Pilot Program, but a court halted the pilot after a lawsuit was filed by the hospital industry. HHS has recently requested information from stakeholders on a revised rebate model pilot.

Appendix

Estimated Changes in 2027 Medicare OPPS Reimbursements Due to 340B Changes by Hospital Characteristics (Table)

What Could Medicaid Work Requirements Mean for SSI Applicants?

Published: Jul 29, 2026

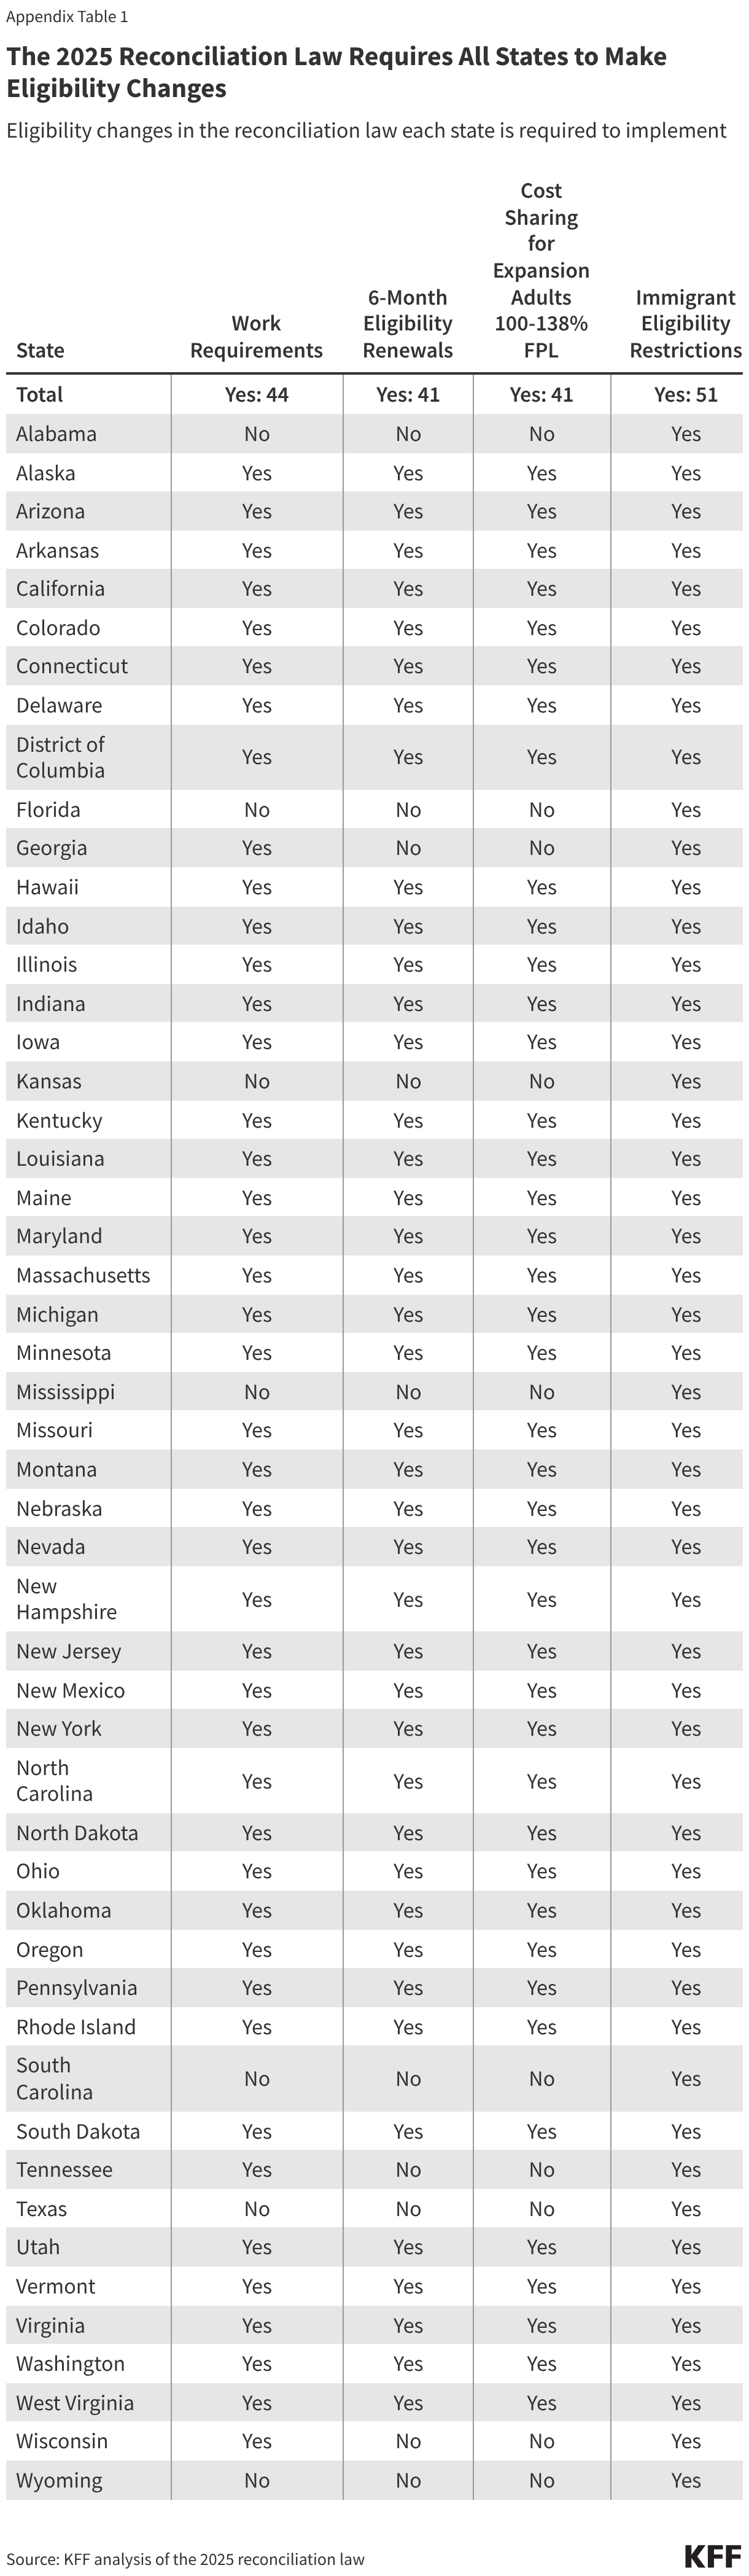
The 2025 reconciliation law requires 44 states to condition Medicaid eligibility for adults in the Affordable Care Act (ACA) Medicaid expansion group and enrollees in certain waiver programs, on meeting work requirements starting January 1, 2027, or sooner at state option. While the law specifies mandatory exclusions, including for individuals who are “medically frail,” the approach to determining medical frailty specified in the June 2026 interim final rule could make it difficult for some people to qualify for this exclusion. Medicaid expansion provides coverage to many adults with significant health care needs, including some with disabilities who are applying for the Supplemental Security Income Program (SSI). This coverage could be at risk for some because of the planned approach to defining medical frailty.

SSI is a means-tested federal program administered by the Social Security Administration (SSA) that pays monthly cash assistance to people with limited resources who are unable to work because of a disability and generally qualifies people to receive health coverage through Medicaid. Once approved for SSI, Medicaid enrollees would not be subject to work requirements, but the application for SSI can be a lengthy and complicated process, spanning months, if not years, during which time applicants may be at risk of uninsurance because they are unable to work. Medicaid can fill coverage gaps during the SSI application period, particularly in states that have adopted the Medicaid expansion.

This issue brief finds that the percent of new SSI enrollees ages 19 through 64 with Medicaid prior to SSI entitlement is twice as high in ACA expansion states as it is in non-expansion states, and in 2023, over 100,000 new SSI enrollees had ACA Medicaid coverage prior to their SSI entitlement. It also describes the lengthy SSA process for determining SSI eligibility, particularly assessing ability to work, and how the current approach to determining medical frailty could cause some SSI applicants to undergo concurrent assessments of their ability to work using different processes and criteria. The new documentation requirements and processes could cause some people with disabilities to lose Medicaid coverage or be denied Medicaid enrollment while they are waiting on their SSI determination.  

How does Medicaid provide coverage for people during the SSI application process?

Medicaid provides coverage for many people with disabilities, including those who are applying for SSI. One in five Medicaid enrollees have a disability, including 43% of adults ages 50-64, but only one-third of these individuals receive SSI income, generally qualifying for Medicaid for that reason. The remaining people with disabilities are covered through different Medicaid eligibility pathways, including the ACA Medicaid expansion. Because of the lengthy process for obtaining an SSI determination and the fact that people who are applying for SSI are unable to work, many people applying for SSI rely on Medicaid to avoid going uninsured.

In 2023, 223,000 SSI applicants ages 19 through 64 had Medicaid while they were waiting for an SSI determination, including over 106,000 with coverage through the ACA expansion. KFF analyzed detailed Medicaid administrative data to identify people who were ages 19 through 64 and became eligible for Medicaid because of SSI during the calendar year 2023 and whether those enrollees had Medicaid coverage in the months prior to their SSI-based eligibility (see Methods). Among the 337,000 people who started SSI during the calendar year, over 200,000 had prior Medicaid coverage through a different eligibility pathway, with roughly half receiving that coverage through the ACA expansion.

In ACA expansion states, 76% of new SSI enrollees ages 19 through 64 had Medicaid coverage through a different eligibility pathway prior to their disability determination (including 42% who were covered through the Medicaid expansion) compared with only 33% in non-expansion states (Figure 1). In both expansion and non-expansion states, roughly 1 in 3 new SSI enrollees ages 19 through 64 were enrolled in non-ACA Medicaid coverage (such as coverage for parents and caretakers) prior to becoming eligible for SSI. However, in expansion states, an additional 42% of new SSI enrollees were enrolled in Medicaid through the expansion, covering over 100,000 people in 2023. New SSI enrollees who were not covered by Medicaid prior to their SSI approval were likely uninsured because of their low income and inability to work.

In Expansion States, 42% of New SSI Enrollees Were Previously Covered Through the Expansion Pathway (Stacked Bars)

How do people demonstrate eligibility for SSI?

To be eligible for SSI, people must have limited income (defined as no more than $2,073 per month in 2026), limited resources (defined as no more than $2,000 for an individual or $3,000 for a couple), and a disability that affects their ability to work for at least a year or result in death or be age 65 and older.

For applicants under age 65, demonstrating a disability is often the most complicated part of the SSI application process, involving a lengthy five-step process that starts by proving one is not gainfully employed (Figure 2). The federal government establishes verification processes that all states must use to determine applicants’ disability status, and funds state Disability Determination Services (DDS) offices to carry out these processes. The same processes are used for SSI and for Social Security Disability Insurance. Illustrating the high costs of this lengthy process, the Social Security Administration provided states with $2.6 billion in Fiscal Year (FY) 2025 to run the DDS offices. The first step requires people to demonstrate that their current earnings are below the threshold of “substantial gainful activity” (SGA, $1,690 per month in 2026).

The second step assesses whether applicants have a severe impairment, where impairment is defined based on which body system is affected. For adults, impairments are classified into the following categories with associated medical criteria: musculoskeletal disorders, special senses and speech, respiratory disorders, cardiovascular system, digestive disorders, genitourinary disorders, hematological disorders, skin disorders, endocrine disorders, congenital disorders that affect multiple body systems, neurological disorders, mental disorders, cancer, and immune system disorders.

The third step assesses whether the impairment qualifies as a disability that wouldn’t require further demonstration of an inability to work using established criteria for disabilities. Some impairments allow applicants to qualify for SSI without further demonstrating an inability to work, including blindness and several hundred specific disorders or conditions included in the “compassionate allowance program,” which quickly identifies diseases and other conditions that meet SSA’s standards for disability benefits. Examples of such conditions include Amyotrophic Lateral Sclerosis (ALS), certain cancers, and Duchenne Muscular Dystrophy. SSA reports that between 2008 and 2025, the agency approved more than 1 million people (for SSI and Social Security Disability Insurance combined) through the compassionate allowance program.

The final two steps respectively assess peoples’ ability to engage in “past relevant work” or any job in the national economy that is feasible considering the applicant’s residual functional capacity, age, education, and work experience. The SSA makes this assessment based on information provided in Form 3368 which requires people to provide personal information including their English language proficiency, current work activity, job history over the last 15 years, the claimed disability onset date, list of medical conditions, prescription list, and medical treatment history. Medical records from providers can be submitted with the application. Along with this form, the SSA will request any missing medical records and may request that the person have a consultative medical examination by an SSA medical consult. SSA also compares information about people’s jobs from the past 5 years (such as job title and pay; tasks performed; tools, machinery, and equipment used; knowledge, skills, and ability required; physical demands; and environmental conditions) with tables of rules about the requirements for jobs in the national economy.

Assessing ability to engage in any job requires information about all jobs in the economy, which can be difficult to implement in practice, and SSA is currently relying on outdated job information. SSA’s current jobs listing comes from the Department of Labor’s Dictionary of Occupational Titles which was last updated in 1991 and is not currently used by the Department of Labor. Since FY 2021, SSA has partnered with the Department of Labor to develop a survey that will be the main source of updated occupational information, but that new system has not yet been implemented. Congressional Research Services reports that between FYs 2012 and 2024, SSA spent $300 million on this project.


The application for disability benefits can be a lengthy and complicated process, spanning months, if not years, meaning hundreds of thousands of people are currently waiting for determinations. As of May 2026, the initial processing time for all disability applications was 184 days—over 6 months—and roughly 862,000 people were waiting for their initial determinations. (This number includes applications for SSI and applications for Social Security Disability Insurance, a related program that uses the same disability determination process.) Many people receive initially unfavorable decisions and choose to appeal, which can considerably lengthen the process. Having a lawyer increases the likelihood of being approved at the initial stage and, on average, can reduce the time it takes to reach a final decision by nearly one year.

How might work requirements affect Medicaid coverage for people during the SSI application process?

Starting in January 2027, individuals applying for or enrolled in coverage through the ACA expansion and in certain waiver programs will be required to work or engage in qualifying activities, such as volunteer community service, for 80 or more hours per month, attend school half-time, unless they qualify for an exemption or exclusion from the requirements. SSI applicants enrolled in the ACA expansion will be subject to these new requirements. Applicants who meet the SSI criteria do not have to meet the community engagement requirements, but there may be challenges for them in proving their eligibility for the medical frailty exclusion while they are applying for SSI.

People applying for SSI are generally unable to work, but current rules could make it challenging for them to qualify for a medical frailty exclusion. Because individuals must have earnings below the SGA level to be eligible for SSI, they are unlikely to be able to work 80 or more hours in a month. Additionally, most people with new impairments significant enough to qualify for SSI will likely also face challenges meeting the Medicaid community engagement requirements through education or volunteering. Instead, to obtain or retain Medicaid, individuals applying for SSI who are subject to the work requirements will need to qualify for an exclusion from the requirements, most likely through the medical frailty exclusion. The interim final rule implementing Medicaid work requirements issued on June 1, 2026, adopts a restrictive definition of medical frailty that requires individuals to have a physical or mental health condition that impairs their ability to meet community engagement requirements. This two-part test for medical frailty will require navigating a verification process that may lead to people losing coverage because they cannot provide the required documentation, even though they qualify for the exclusion.

Different requirements for Medicaid eligibility determinations mean SSI applicants covered through the Medicaid expansion could face two concurrent assessments of their ability to work: one for SSI and one for Medicaid. Medicaid eligibility determinations of whether an individual meets the medical frailty exclusion will need to be done on a faster timeline than SSI determinations. States are required to process Medicaid applications for individuals who qualify based on income within 45 days, and starting January 1, 2027, they must conduct renewals for individuals enrolled through the Medicaid expansion every six months instead of annually. That makes it likely that many SSI applicants will not have a disability determination before they have an assessment of their ability to work to meet the medical frailty exclusion from Medicaid work requirements. These new requirements could place additional administrative burdens on individuals who are experiencing significant physical or mental health challenges and could cause people to lose health insurance while they wait for an SSA disability determination.

In contrast to the SSI determination process, the Medicaid interim final rule is not clear on how states should determine ability to work in the context of Medicaid work requirements, which will lead states to adopt different approaches that could put coverage at risk for some SSI applicants. The rule requires states to automate, to the extent possible, verification of the Medicaid medical frailty exclusion using claims and encounter data before requesting information from the individual. However, claims data alone will often be insufficient to assess whether a condition impairs the ability to work or engage in community service, and claims data do not include information about people’s ability to engage in the activities of daily living (one measure of disability) or their overall functional status and frailty. Given the broader Medicaid definition of community engagement activities, states will need to assess people’s ability to participate in education or volunteer activities in addition to doing any work in the national economy. The lack of information about minimum acceptable practices raises questions about what standards states will use to assess ability to work, and what types of documentation will be sufficient to prove the inability to comply with the requirements. As they develop processes for verifying medical frailty, states will rely more heavily on provider determinations or other documentation and self-attestation, to the extent permitted by the rule, for individuals who cannot be automatically verified. Self-attestation will be permitted in 2027 and once for each individual in 2028. Absent clearer guidance, the approaches states develop will differ. This variability coupled with enhanced documentation requirements could cause some people with disabilities to lose Medicaid coverage or be denied Medicaid while they are waiting on their SSI determination.

This work was supported in part by Arnold Ventures. KFF maintains full editorial control over all of its policy analysis, polling, and journalism activities.

Methods

Data: Data are from the 2023 Transformed Medicaid Statistical Information System (T-MSIS) Analytic Files (TAF) Research Identifiable Files (RIF) files.

State inclusion criteria: National estimates include enrollees living in 49 states and DC and exclude residents in the U.S. territories. Non-expansion states include AL, FL, GA, KS, MS, NC (Medicaid expansion started 12/1/23), SC, TN, TX, and WY. WI is excluded from this analysis because it has an 1115 waiver that offers coverage similar to the ACA expansion. The pre-SSI Medicaid coverage rates look much more similar to those of an ACA expansion state, but the T-MSIS data do not clearly identify people enrolled in the 1115 coverage.

Identifying new SSI enrollees using Medicaid administrative data: Enrollees are classified as new SSI enrollees if their latest eligibility group in the year is SSI (having ELGBLTY_GRP_CD_LTST with value of 11-22, 37, 38, 40, or 41) but in January, they are either not enrolled in Medicaid or they are enrolled through some other pathway (ELGBLTY_GRP_CD_01 not having value of 11-22, 37, 38, 40, or 41). The analysis is limited to enrollees ages 19 through 64 who are in Medicaid only (and not CHIP) during the year.

Assessing prior Medicaid coverage in the year for new SSI enrollees: Monthly eligibility group codes (ELGBLTY_GRP_CD_01-ELGBLTY_GRP_CD_12) are used to determine the first month of SSI enrollment (first monthly eligibility group code with value of 11-22, 37, 38, 40, or 41). Then, all monthly eligibility group codes prior to the first month of SSI enrollment are used to assess prior Medicaid enrollment during the year as follows:

  • Prior Medicaid coverage through the expansion pathway: having at least one monthly eligibility group code indicating enrollment through the ACA expansion group (value of 72, 73, 74, or 75) before the first month of SSI enrollment.
  • Prior Medicaid coverage through non-expansion pathway: having at least one non-missing monthly eligibility group code and no monthly eligibility group codes indicating enrollment through the ACA expansion group (value of 72, 73, 74, or 75) before the first month of SSI enrollment.
  • No prior Medicaid coverage: eligibility group codes for all months before the first month of SSI enrollment are missing.

How Has ACA Marketplace Enrollment Changed Across States in 2026?

Published: Jul 28, 2026

Following several years of rapid enrollment growth in the Affordable Care Act (ACA) Marketplaces that corresponded with temporary enhanced premium tax credits, enrollment fell for the first time in seven years in 2026, when those tax credits expired. The Assistant Secretary for Planning and Evaluation (ASPE) of the Department of Health and Human Services reported that enrollment declined by nearly three million people between 2025 and 2026.

Earlier federal data and analysis had focused on plan selections, or sign-ups, which decreased by about one million (5%) from last year, but plan selections do not account for enrollees who ultimately do not make their premium payments and are not covered. Effectuated enrollment is different from selection or sign-up data in that it accounts for who paid their premiums. Consumers who canceled their coverage or did not make their premium payments, resulting in termination of coverage, do not contribute to effectuated enrollment totals.

This analysis uses data from the Centers for Medicare and Medicaid Services (CMS) on effectuated enrollment in addition to Open Enrollment plan selections to examine how enrollment in the ACA Marketplaces has changed in 2026.

Key Findings

  • Every state except for New Mexico saw a drop in ACA Marketplace enrollment from 2025 to 2026. New Mexico is the only state to fully replace the expired federal enhanced premiums tax credits with state-funded subsidies.
  • State-based Marketplaces that run their own enrollment platforms, including those that partially offset the expiring federal enhanced tax credits, generally saw lower drops in enrollment (a 6% decline versus a 15% decline for states that use the federal marketplace).
  • The effectuation rate (the rate at which people who initially signed up for a plan kept their coverage by making their premium payments) was lower in 2026 than in recent years.
  • States that run their own Marketplaces, and particularly those that offered state-funded subsidies, generally saw higher-than-average effectuation rates.

February effectuated enrollment declined in 2026 to 19.2 million people (as of May 5, 2026), down from 21.8 million people in 2025, a record high enrollment (see note in Methods about 2025 total enrollment). This represents a 12% decline in enrollment year-over-year. Similarly,  KFF polling indicated about one in ten 2025 Marketplace enrollees (9%) said they became uninsured for the 2026 plan year. The decline in enrollment coincides with the expiration of the enhanced premium tax credits at the end of 2025.

Effectuated Enrollment Has Dropped for the First Time Since 2019 (Column Chart)

While effectuated enrollment data do not capture the reasons coverage lapsed, these significant declines in enrollment correspond with rising premium payments after the expiration of enhanced premium tax credits. Without the enhanced credits, premium payments increased substantially for most subsidized enrollees, and some middle-income enrollees who previously qualified for subsidies faced the full cost of coverage for the first time. On average, premium payments net of tax credits increased by 58% for people who signed up for 2026 coverage. A 2026 KFF follow-up survey of people who had been enrolled in ACA Marketplace coverage in 2025 found that eight in 10 enrollees who made changes to their ACA coverage or became uninsured cited cost as a reason, with 17% of returning Marketplace enrollees stating they worried about being able to pay their premiums for the entirety of 2026.

As shown in Figure 2, 2026 was the first year of widespread increases in premium payments. In prior years, including before the implementation of enhanced premium tax credits, people receiving a subsidy were largely sheltered from increases in the premiums charged by insurers. This may at least in part explain why the effectuation rate in 2026 was lower than some years preceding the enhanced premium tax credits. While the drop in enrollment from 2025 to 2026 is the largest drop since the Marketplaces opened, there are still more ACA Marketplace enrollees now than there were before the enhanced premium tax credits were passed.

Average Consumer Premium Payments Rose Substantially Between 2025 and 2026 (Stacked column chart)

Effectuated enrollment declined in nearly every state from 2025 to 2026, though the size of the decline varied substantially. New Mexico was the only state to see an increase in effectuated enrollment, growing 14% between 2025 and 2026, coinciding with the state's premium assistance program that fully replaced the expiring federal enhanced tax credits with state-funded subsidies. Effectuated enrollment in Illinois, Connecticut, Pennsylvania, Idaho, the District of Columbia, Massachusetts, and Texas held relatively flat or fell by less than 5%. Of these states, Texas is the only state that is not a state-based Marketplace. Enrollment in Texas may have been buoyed by a state rule that mandates substantial silver loading, which can lead to more subsidized people being eligible for a bronze plan, or in some cases a gold plan, with little or no premium payment.

At the other end of the spectrum, effectuated enrollment fell by just over 32% in Ohio and Oklahoma, and by more than a quarter in Arizona (30%), South Carolina (29%), Indiana (28%), Michigan (27%), Minnesota (27%), Mississippi (26%), and Louisiana (26%). Of these states, Minnesota is unlike the others in that it offers a Basic Health Program covering low-income people who would otherwise sign up on-exchange. With a relatively higher-income group of Marketplace enrollees, Minnesota enrollees may have been disproportionately affected by the return of the subsidy cliff as enhanced tax credits expired.

A sortable table in the appendix shows the change in enrollment for each state, alongside other information about the type of Marketplace, whether state subsidies are available, and the effectuation rate.

Figure 3

States that run their own enrollment platforms, and particularly those that offered state-funded subsidies, generally saw a smaller drop in enrollment (or an increase, in the case of New Mexico). When weighted by enrollment in each state, those that use the HealthCare.gov platform (and do not offer state-specific subsidies) saw a decline in effectuated enrollment of 15% from 2025 to 2026. However, state-based Marketplaces experienced a 6% decline during the same period. States that offered state-funded subsidies all saw below-average declines in enrollment, or an increase in the case of New Mexico. 

Figure 4

Of the 26 states with effectuated enrollment drops smaller than the national average, 18 were state-based Marketplaces, including all nine that offered their own state-funded subsidies. These differences across states suggest that the availability of state-level premium assistance helped cushion the effect of expiring enhanced premium tax credits on enrollees' ability to maintain coverage, though enrollment changes likely also reflect broader differences in state populations and Marketplace administration.

Figure 5

Changes in both plan selections and effectuated enrollment from 2025 to 2026 varied considerably among states. However, changes in effectuated enrollment were not always well predicted by earlier reported changes in plan selections. In most states (37), both plan selections and effectuated enrollment declined, and the gap between the two widened, meaning that drops in plan selections underpredicted the change in effectuated enrollment. This pattern was particularly pronounced in states such as South Carolina, where plan selections fell 7% but effectuated enrollment fell 29%; Michigan, where plan selections fell 6% but effectuated enrollment fell 27%; and Minnesota, where plan selections fell 8% but effectuated enrollment fell 28%.

For nine states, plan selections rose from 2025 to 2026 but effectuated enrollment fell, reflecting a declining effectuation rate. Louisiana saw the largest divergence: plan selections increased by about 1% but effectuated enrollment fell by 27%. Texas showed the largest difference by number of enrollees: about 206,000 more people signed up this year (a 5% increase in sign-ups), with effectuated enrollment ultimately falling by about 146,000 people (a 4% decrease). Connecticut, Idaho, Massachusetts, Maryland, Pennsylvania, and Rhode Island saw smaller versions of this trend, with modest increases in plan selections alongside slight declines in effectuated enrollment.

Fewer Consumers Maintain Coverage than Sign Up During Open Enrollment (Line chart)

Nationwide, the February effectuation rate fell from 90% in 2025 to 83% in 2026. This means a larger share of the people who signed up for coverage during open enrollment did not maintain their coverage, perhaps because they did not pay the first month's premium, canceled after enrolling, or fell behind on payments and had their coverage terminated. Since 2019, the effectuation rate (measured past the end of the three-month grace period for February premium payment) has been above 90% but was lower in the early years of Marketplace coverage.

This year, Mississippi had the lowest effectuation rate (61%), meaning nearly two in five consumers who signed up during open enrollment did not maintain coverage past January. Similarly, South Carolina, Louisiana, Indiana, and Oklahoma also saw effectuation rates below 70% in 2026. By contrast, New Mexico, California, Nevada, Vermont, and Idaho each had effectuation rates of 95% or more.

Figure 7

States that run their own Marketplaces generally maintained higher effectuation rates than states that use HealthCare.gov. The ten states with the lowest effectuation rates all use the Healthcare.gov platform, while the ten states with the highest effectuation rates are all state-based Marketplaces. These differences may reflect variation in state populations, subsidy structures, or outreach and enrollment assistance efforts. Of state-based Marketplaces, Minnesota and the District of Columbia were the only ones to see lower-than-average effectuation rates. Both markets skew relatively higher-income, as both offer Basic Health Programs that cover lower-income enrollees who would otherwise sign up on exchange. 

Figure 8

As with smaller drops in effectuated enrollment, states that implemented state-based subsidy programs to help offset the expiration of the enhanced premium tax credits through their state-based Marketplaces saw higher effectuation rates. Of the nine states offering state-based premium subsidies, seven saw effectuation rates higher than 90%, and all saw effectuation rates higher than the U.S. average. New Mexico, which, as mentioned earlier, fully replaced the lost enhanced premium tax credits through state funds, had the highest effectuation rate among all states at 96%.

These patterns suggest that state policies designed to blunt the effect of rising premiums may be associated with higher rates of enrollees maintaining active coverage, though other factors—such as income levels, Marketplace type, and state outreach efforts—likely also play a role. All states that offered state subsidies to backfill some portion of the expired enhanced premium tax credits were above the median change in effectuated enrollment.

Appendix

Plan Selections and Effectuated Enrollment (Table)

Methods

Open enrollment plan selections and monthly effectuated enrollment were collected from Centers for Medicare & Medicaid Services (CMS) sites. Effectuated enrollment in this current analysis refers to enrollees with any coverage in February. For 2025, effectuated enrollment is as of March 15, 2026; for 2026, as of May 5, 2026. Both of these dates are past end of the February premium payment grace period for consumers who had effectuated coverage. State-based subsidy information was obtained from state government websites; see Figure 3 for links to source data. States that operate their own exchanges but use the HealthCare.gov platform are included in the HealthCare.gov category; none of them provide state-funded premium assistance. Weighted average enrollment changes by platform type were calculated using the above described categorizations. Illinois, which switched from using HealthCare.gov in 2025 to its own state-based Marketplace platform in 2026, is counted as a state-based Marketplace for change in effectuated enrollment.

An analysis by ASPE reported the 2025 February effectuated enrollment total to be 22.1 million, but the CMS monthly effectuated enrollment data report a total of 21.8 million enrollees in February 2025. Effectuated enrollment totals may differ across data sources, potentially due to the date of measurement. This KFF analysis is based on CMS monthly effectuated enrollment data (linked above) which indicated a total of 21.8 million effectuated enrollees.

Comparing U.S. Ebola Outbreak Response Capabilities and Practices Over Time

Published: Jul 28, 2026

The current Ebola outbreak centered in the Democratic Republic of the Congo (DRC), first identified in May 2026, has rapidly developed into the third largest Ebola outbreak on record. It presents particular challenges for responders because there are no readily available vaccines or treatments for the species of Ebola causing this outbreak, which is also taking place in a region with active conflict and multiple concurrent humanitarian crises. It is also the most significant international infectious disease outbreak the Trump administration has had to face in its second term. Given major changes made by the administration to U.S. global health and pandemic response mechanisms over the past year and half – including reducing funding, cutting staff, changing priorities and shuttering USAID – some have raised concerns that U.S. international disease response capacity has been compromised and the effectiveness of the U.S. response has been limited. Others have observed that the U.S. has, in comparison to previous Ebola responses, mobilized relatively quickly this time. To help put U.S. capacities and actions in further context, this analysis compares the current U.S. Ebola response to those of the two prior largest outbreaks – the West African outbreak of 2014-2015 and the DRC outbreak of 2018-20201 looking across a range of indicators and categories. Even so, such comparisons are complex, as there are many interrelated factors that affect any governmental response — including the severity and size of the outbreak itself, the response of other international and domestic actors, whether there are medical countermeasures available, and whether the outbreak is occurring under exceptionally difficult conditions, such as active conflict.

Taking these dimensions into consideration, this analysis finds that:

  • The speed of the U.S. government’s response to the current outbreak is on par with the prior two outbreaks. In all three cases, the U.S. mobilized an initial response, including funding and personnel, within days of cases first being reported.
  • Initial U.S. funding amounts are already surpassing the prior two outbreaks. The U.S. provided $21 million in the first six months of the West African outbreak, $98 million in the first year of the 2018-2020 DRC outbreak and has already pledged $375 million in the first two months of the current outbreak.  Given that it is still relatively early in the current outbreak, which could become protracted, final U.S. funding levels will likely grow; the administration has already asked Congress for emergency funding of $1.4 billion. 
  • Across all outbreak responses including the current response, the U.S. has consistently supported research and development (R&D) for Ebola countermeasures such as diagnostics, tests, treatments, and vaccines, which has been instrumental in identifying and testing new vaccine and treatment candidates; given that there is no vaccine or specific treatments for the current species of Ebola, this work is quite critical.
  • At the same time, a significant difference between current and past responses is in the U.S. organizational structure and approach, resulting from the changes made last year by the administration. Past responses were led by USAID and its Office of Foreign Disaster Assistance (OFDA), with a major role played by CDC. Given the dissolution of USAID in 2025, the response lead has shifted to the State Department and its Bureau of Global Health Security and Diplomacy (GHSD) and Bureau of Disaster and Humanitarian Response (DHR), both of which have seen their staffing reduced over the past year. Past responses also had White House National Security Council (NSC) level offices and staff with specific responsibilities for international infectious disease response coordination, something initially absent this time. The current relative lack of specified inter-departmental coordination mechanisms could affect the U.S. response over time, particularly if the outbreak is protracted and the U.S. response scales up further, although there are indications that the administration may seek to name an Ebola response coordinator.
  • In addition, while the U.S. has had pre-existing global health programs in these countries when each outbreak has occurred, the current U.S. response takes place after significant upheaval in U.S. global health programs, and as the administration implements its new America First Global Health Strategy, including through a new memorandum of understanding (MOU) the U.S. signed with the DRC in February, three months before the current outbreak was identified. That new agreement will reduce U.S. funding over time and shift financial and operational responsibility to the country.  
  • Another notable difference is in U.S. multilateral engagement. In the past, the U.S. was directly engaged with the World Health Organization (WHO) and synced to the strategic pillars identified by WHO and other partners in Ebola response plans. Having left WHO membership last year, the U.S. is, for the first time, not formally coordinating with the agency, although it is coordinating with other United Nations (UN) agencies including the Office for the Coordination of Humanitarian Affairs (OCHA), the International Organization for Migration (IOM), the World Food Programme (WFP), and the United Nations Children’s Fund (UNICEF). The lack of formal relations with WHO, however, could have implications as the response continues to unfold, and present barriers to communications or coordination at times.
  • There is also a marked difference in how the U.S. has approached domestic border protection in the current outbreak compared to the past. During prior outbreaks, the U.S. relied on country exit screening, screening at U.S. ports of entry, and follow-up monitoring of travelers from affected countries but not outright travel bans. At present, the administration has imposed a more restrictive posture barring incoming travelers altogether (U.S. citizens and non-citizens that have been in DRC within the last 21 days, as well as non-citizens that have been in Uganda or South Sudan in that time period).  

While it is still early to take full stock of the U.S. response to the current outbreaks, based on this analysis some key questions and areas to watch going forward include:

  • Will this escalate and potentially require more long-standing U.S. engagement?
  • Will the level of U.S. international engagement shift, particularly if the outbreak worsens significantly and/or spreads beyond DRC borders in a more substantial way?
  • If the outbreak does expand significantly, will the U.S. support greater mobilization of U.S. staff?
  • Will Congress appropriate emergency funding?
  • How might the outbreak affect other U.S. supported health efforts in the DRC including the recently signed MOU on global health?
  • What will happen with the approach to U.S. border security, especially if more Americans become infected? What other domestic response would be put in place if Ebola cases are identified in the U.S.?

Table 1. Comparing U.S. Responses to Three Ebola Outbreaks
2014-2015 West Africa
Ebola Outbreak
2018-2020 DRC
Ebola Outbreak
2026 DRC
Ebola Outbreak
Key Outbreak Characteristics
Date of initial case report/confirmationMarch 21, 2014
(First lab confirmed cases from Guinea)
August 1, 2018
(Outbreak declared by Democratic Republic of the Congo (DRC) Ministry of Health (MOH)

August 7 (lab confirmed cases reported).
May 5, 2026(DRC notified World Health Organization (WHO) of possible outbreak) 

May 15, 2026 (lab confirmed cases reported)
Date of first WHO Emergency Committee (EC) Meeting to Assess This OutbreakAugust 7, 2014October 17, 2018May 19, 2026
Date of Initial WHO “Public Health Emergency of International Concern (PHEIC) declarationAugust 8, 2014
(141 days after initial cases identified)
July 17, 2019
(almost 1 year after first case reports, due to the WHO EC initial determination the outbreak was not a regional threat, a key criteria for PHEIC determinations).
May 17, 2026
(16 days after first cases identified, 2 days after first cases confirmed).

PHEIC declaration was made by Director-General before Emergency Committee met.
Virus speciesZaireZaireBundibugyo
Primary countries affectedGuinea, Liberia, Sierra LeoneDRCDRC and Uganda
Total number of reported cases and deaths28,610 cases, 11,323 deaths over 28 months (outbreak declared over in June 2016)3,470 cases and 2,287 deaths over 22 months (outbreak declared over in June 2020)3,200 cases, 1405 deaths (over 8 weeks, through July 25, 2026)
Vaccine availabilityNo vaccine available initially. Clinical trials with candidate vaccines began in in West Africa in February and March 2015. A candidate vaccine was made available under a compassionate use protocol for broader community “ring vaccination” purposes in March 2016 in Guinea.Yes. Over 236,000 people vaccinated in DRC during the outbreak response.No vaccine availability at this time. Trials with candidate vaccines began in July 2026.
Therapeutics availabilityNo therapeutics available initially. Limited use of experimental therapeutics began in August 2014; clinical trials began in March 2015.Limited use of experimental therapeutics in 2018; a trial of several candidate treatments began November 2018.No therapeutics available at this time. Clinical trials of experimental candidates began in July 2026.
Active conflict/ instability in affected areasNoYesYes
U.S. Funding for Response
Speed of initial U.S. response funding

(time from outbreak detection to mobilization of U.S. response funds)
Initial U.S. Agency for International Development (USAID)/Office of Foreign Disaster Assistance (ODFA) funding provided in March 2014, soon after initial outbreak reports.

Centers for Disease Control and Prevention (CDC) supported initial staff deployments to affected areas in late March/early April. As the outbreak worsened considerably over subsequent months, U.S. funding scaled up, particularly from August 2014 on.
Initial USAID funding provided in August 2018, within weeks of the initial announcement of confirmed Ebola cases in eastern DRC. CDC also supported staff deployments and response activities in August

As outbreak worsened considerably in March/April 2019, U.S. response funding scaled up.
Initial funding announced on May 19.
(four days after initial case confirmation and two days after PHEIC declaration).
Amount and source of initial response fundingBetween March and August 2014, $21 million in cumulative response funding reported from USAID. By October 2014, CDC had committed >$16.7 million for its Ebola response activities. Initial funding drawn from USAID International Disaster Assistance fundsAs of September 5, 2018, USAID had provided at least $2 million for response activities. Over the first 11 months of the response (through July 2019) USAID reported $98 million in support for the response.  Funds drawn from unspent FY2015 Ebola emergency supplemental funds.State Department announced $23 million in initial Ebola response funding on May 19, drawn from existing FY2026 State Department humanitarian assistance funds. 
Total U.S. response funding amount and sourceApproximately $2 billion in U.S. international response funding obligated by the end of 2015, primarily through emergency/supplemental appropriations provided to USAID and CDC.From August 2018 to June 2020, USAID provided over $342 million for response activities, drawn from USAID International Disaster Assistance, USAID/Global Health, USAID/Food for Peace, and USAID Mission funds. USAID used unspent FY2015 Ebola emergency supplemental funds.$270 million was committed by the State Department as of June 12, drawn from State Department’s existing FY2026 humanitarian response funds. The U.S. has made an overall pledge of $375 million in support of the response as of June 19.
Emergency / supplemental funding requests and appropriationsWhite House requested $6.2 billion in emergency supplemental funding in November 2014. In December 2014, Congress appropriated $5.4 billion, including $3.7 for international response activities.None requested.
White House requested $1.4 billion in emergency supplemental funding in June 2026. As of July 2026, Congress had not yet appropriated additional funding.
U.S. funding share of overall international response funding The U.S. was the largest donor to the response, providing $2.4 billion (41%) of the $5.81 billion in overall donor funding provided between 2014 and 2016.The U.S. was the largest donor to the response, providing $252 million (34%) of the $734 million in overall donor funding provided between August 2018 and December 2019.The $375 million pledged $375 million by the US for Ebola response activities represents 41% of the $910 million in overall donor funding ‌pledges made by international donors in support of the joint continental Ebola response plan.
U.S. Staff Deployments, EOC Activation
Staff Mobilized/ DeployedPrior to the outbreak, USAID and CDC presence in the three most affected countries “very limited.” On March 31, 2014, a 5-person CDC team deployed to Guinea. In August 2014, 28-member DART team deployed (staff from USAID, CDC, the Department of Defense (DoD), other agencies).

By the end of the outbreak, over 3,500 personnel from DoD, CDC, U.S. Public Health Service (USPHS) Commissioned Corps, USAID, and National Institutes of Health (NIH) were deployed.
First 5 CDC staff deployed to North Kivu August 2018 (pulled back after a few days). By May 2019, CDC had 17 staff in Kinshasa and Goma. 

USAID established a DART team on September 21, 2018. 

During response, U.S. staff kept away from front lines due to security concerns.
CDC reports it has 23 field staff in DRC and over 100 staff in Uganda.

State Department has deployed an unknown number of staff from GHSD and DHR via DART to DRC and Uganda.
CDC Emergency Operations Center (EOC) ActivationEOC activated on July 9, 2014. (110 days after initial case confirmations).

On March 31, 2016, CDC officially deactivated the EOC for this response.
EOC activated in June 2019. (10 months after initial case confirmations).

The EOC was deactivated some time in 2020, no official announcement made.
EOC activated on May 17, 2026 (two days after case confirmations)

Raised to “highest alert level” June 26, 2026.
U.S. Organizational Approach
Agencies involved and coordinationUSAID/OFDA, CDC, DoD, NIH, and State Department. 

In May 2014, the White House asked the HHS Office of Global Affairs to coordinate the U.S. government response, with USAID as operational lead and CDC as lead on technical and public health issues. 

As the outbreak continued to expand in West Africa, and several Americans working in West Africa became infected with Ebola, President Obama became directly involved, offering to send U.S. troops in September, and appointing an Ebola Response Coordinator in October 2014 who eventually led coordination of U.S. agencies through a position at the National Security Council (NSC)
USAID/OFDA, CDC. 

No NSC-level leader designated for coordinating U.S. response, as the global health security team at NSC was disbanded in May 2018 during a reorganization process under the first Trump Administration. Primarily,  coordination occurred at the department/agency level.
USAID was dissolved in 2025, making the State Department the primary response agency along with CDC. At the State Department, the Bureau of Global Health Security and Diplomacy (GHSD), and Bureau of Disaster and Humanitarian Response (DHR) are the key bureaus overseeing response activities. 

No specific NSC GHS staff/office designated initially to provide coordination, though a director for bioresponse at the National Security Council was named in July. In June, Secretary of State Rubio stated the administration is considering naming an Ebola response coordinator to oversee the U.S. response.
Pre-existing U.S. Global Health Programs in Affected Countries
Amount of U.S. GH funding in affected countries in the fiscal year prior to initial outbreak

(amounts are disbursements for the indicated fiscal year)
In FY2014, U.S. GH funding by affected country was:
Guinea: $18.8 million, primarily for malaria and family planning/ reproductive health (FPRH), plus maternal and child health (MCH), and HIV/AIDS.
Liberia: $26.2 million, primarily malaria, MCH, and FPRH, plus HIV/AIDS, and Nutrition.
Sierra Leone: $750k for HIV/AIDS.
In FY2018, U.S. GH funding for DRC was $146.4 million, primarily for malaria, HIV/AIDS, MCH, FPRH, tuberculosis (TB), Global Health Security (GHS), and Nutrition. In FY2025, U.S. GH funding for DRC was $165.8 million, primarily for malaria, HIV/AIDS, MCH, FPRH, GHS, and Nutrition.
U.S. Communications Practices
USG public communications on Ebola responseRegular communications from USAID, CDC and other federal agencies on international response activities, domestic public health guidance. National press conferences and televised briefings were featured. Notable White House involvement in communications starting in August 2014 due to significant public interest in the topic following identification of Ebola cases in the U.S. USAID had the lead for communications regarding U.S. response operations in West Africa, while HHS (including CDC) and the National Security Council handled communications about domestic Ebola cases.Comparatively less U.S. public attention compared to 2014. Still, CDC and USAID provided situation updates, travel notices, technical guidance. WH public facing engagement was not apparent.


CDC has conducted media briefings, technical briefings, publication of updates, guidance, risk assessments. State Department has provided press conferences, semi-regular posts about U.S. activities and support. President Trump mentioned U.S. support for international response in public remarks.
U.S. Research & Development Support
U.S. support for countermeasures R&D, including vaccinesNIH provided accelerated early clinical trials of vaccine candidates, and field efficacy studies in Guinea and Liberia. U.S. supported evaluation of several experimental therapies, including ZMapp, TKM-Ebola, Favipiravir, and convalescent plasma.  NIH supported ZMapp investigational treatment R&D in DRC.The rVSV Ebola vaccine was used extensively during the response, under expanded-access, with the U.S. supporting vaccine logistics, effectiveness monitoring, operational research, ring vaccination strategy, and other related activities.  U.S. research response has focused on evaluating cross-protection of existing vaccines/treatments, development of multivalent vaccine candidates.USG committed $50 million to the Coalition for Epidemic Preparedness Innovations (CEPI) to advance Bundibugyo vaccine R&D.

BARDA/Mapp Biopharmaceutical announced a transfer of investigational doses of MBP134 monoclonal antibody to DRC. 
U.S. Multilateral Engagement
U.S. multilateral engagement on response activitiesThe U.S. led much of the response, especially in the early stages in 2018, as the WHO-led multilateral response took time to scale up. U.S. response primarily bilateral, with a focus particularly on supporting activities in Liberia 

As the multilateral response expanded, the U.S. engaged as active, partner for WHO, UN agencies, and the UN special mission for Ebola response known as UNMEER that was created in September 2014. U.S. activities and engagement spanned all major “response pillars” outlined in multilateral response plans. The U.S. was the largest donor to WHO’s Ebola response activities, providing $73.9 million, and largest donor overall to Ebola response in the region.
The U.S. played an important, though more supporting role as WHO and the DRC government primarily led the response. U.S. activities supported the Ebola response plan developed by DRC, WHO and other international partners. U.S. agencies (including NIH, USAMRIID, and CDC) as well as U.S. funded NGOs were listed as supporting partners across most of the response sectors/pillars, though the U.S. CDC was the only U.S. agency listed as a co-lead (along with WHO) for one of the main response pillars (“Health Information and Analytics”).Following U.S. withdrawal as a WHO member state, communication and engagement with WHO is limited. The U.S. has direct engagement with UN humanitarian response organizations including OCHA, WFP, UNICEF. The multisectoral continental response plan released by DRC, WHO, and Africa CDC lists the following USG entities as partners across response activities: CDC as co-lead for the surveillance and epidemiology & laboratory systems and genomic sequencing response pillars, and NIH as a partner organization for the clinical trials/R&D sub-pillar.
Domestic border protection measures
U.S. government border policies during Ebola responseFocused on exit screening of travelers from at-risk countries, and entry risk assessment and management for incoming travelers. Travelers from West Africa were primarily directed through five US airports where they went through CDC-designed screening and follow-up with active monitoring of at-risk contacts. In limited cases, there were state-imposed quarantines/isolation.CDC implemented routine border health security measures at ports of entry. No additional measures imposed.The U.S. has barred entry for all travelers on commercial flights who were recently in DRC – including U.S. citizens – and non-U.S. citizen travelers who were recently in Uganda or South Sudan. U.S. officials have stated they do not wish to repatriate any Americans who become infected with Ebola overseas. Already, two U.S. citizen health care workers infected with Ebola in DRC have been transported to Germany for monitoring and treatment, rather than brought to the U.S., and seven American aid workers working on the Ebola response in DRC have been sent to a facility in Kenya to quarantine rather than allowed to return to the U.S. immediately.

  1. There was an earlier, smaller Ebola outbreak in 2018 in the northwestern Equateur Province in DRC, initially identified in May 2018. The Equateur outbreak was contained by the end of July 2018, just weeks before the before another, separate, and eventually much larger, outbreak was identified in the Ituri Province in eastern DRC in August 2018. This analysis does not examine the U.S. response to the Equateur outbreak. ↩︎
Poll Finding

KFF Health Tracking Poll: Ebola & Pandemic Preparedness

Published: Jul 28, 2026

In May, authorities confirmed an Ebola outbreak centered in the Democratic Republic of the Congo (DRC), which has since grown to become the third largest Ebola outbreak on record, causing more than 2,000 cases and 750 deaths as of July. The State Department has announced the U.S. would provide “$270 million in direct Ebola response funding” and other support to assist the international response. This response from the Trump administration, however, comes amid a changed global and domestic health landscape, marked by reduced U.S. foreign aid funding and the dissolution of USAID, as well as cuts to domestic public health programs.

The latest KFF Health Tracking Poll finds many adults have yet to form an opinion on the U.S. government’s response to the Ebola outbreak in the Democratic Republic of the Congo, though among those with a view, more say the government is falling short than say it is doing enough.

About four in ten adults (38%) say the U.S government is not doing enough to prevent an Ebola outbreak in the U.S., while one in four (23%) say the government is doing enough and 39% say they are not sure. Views are similar when it comes to the U.S. role abroad, with four in ten (40%) saying the government is not doing enough to help fight the outbreak in Africa, while one in five (18%) say the government is doing enough and 42% say they are not sure.

Across partisans, Democrats are more critical of the U.S. government’s Ebola response with majorities saying it is not doing enough to prevent an outbreak in the U.S. (58%) nor to help fight the outbreak in Africa (66%). Notably, about four in ten independents and Republicans say they are not sure if the U.S. is doing enough to prevent an Ebola outbreak in the U.S. and about half of both groups are unsure if the government is doing enough to help fight the outbreak in Africa.

Stacked bar chart showing share of adults who think the U.S. government is doing enough or not doing enough to prevent an Ebola outbreak in the U.S. and help fight the current Ebola outbreak in Africa. Shown among total adults and by party identification. Four in ten adults say the U.S. is either not doing enough or they are unsure. Adults are split in their answers by partisanship, though large shares of independents and Republicans are unsure.

Several years after the height of the COVID-19 pandemic and amid recent changes to federal health agencies and global health engagement during President Trump's second term, the public holds mixed views on whether the U.S. government is prepared for another pandemic or widespread health crisis. A plurality of adults (40%) say the U.S. government is “less prepared” to deal with a pandemic now than it was in 2020, while about a third (34%) say the government is now “more prepared,” and one in four say it is “just as prepared” as it was in 2020. Views are divided across partisan lines. While two-thirds of Democrats (67%) say the U.S. government is now “less prepared,” a majority of Republicans (56%) say the country is now more prepared for a pandemic. About four in ten independents (41%) say the U.S. is “less prepared” for a pandemic compared to 2020, while about a third (32%) say it is “more prepared.”

Republicans and Republican-leaning independents who identify as supporters of the Make America Great Again (MAGA) movement are the most confident; six in ten (61%) of them say the U.S. is “more prepared” to deal with a pandemic now than in 2020, compared to about half (47%) of their non-MAGA counterparts who say the same.

Stacked bar chart showing share of adults who think the U.S. government is now more prepared, less prepared, or just as prepared to deal with another pandemic or widespread health crisis compared to 2020. Shown among total adults and by party identification. One third of total adults think the U.S. is now more prepared to deal with another pandemic, though views diverge by partnership. Large shared of Republicans and MAGA supporters think the U.S. is now more prepared, while Democrats and independents think the U.S. is now less prepared to deal with a pandemic compared to 2020.

Compared to views shortly before the start of the second Trump administration, the public overall now takes a dimmer view of the U.S. government’s pandemic preparedness, though Republicans’ views have moved in the opposite direction. The share of the public who say the U.S. government is now less prepared to deal with another pandemic than it was in 2020 is up 14 percentage points since January 2025, before the Trump administration made significant changes to U.S. foreign aid efforts (40%, up from 26%). This increase is driven largely by Democrats, two-thirds (67%) of whom now say the U.S. is "less prepared" — an increase of 40 percentage points from early last year. Independents are also now more likely to say the U.S. is “less prepared” (41%, up from 23% in January 2025).

Republicans’ views, on the other hand, have shifted in the opposite direction. The share of Republicans who say the government is "more prepared" for a pandemic has increased 12 percentage points since January 2025 (56%, up from 44%), while fewer Republicans now view the U.S. as “less prepared” (14%, down from 27%).

Stacked bar chart showing share of adults who think the U.S. government is now more prepared, less prepared, or just as prepared to deal with another pandemic or widespread health crisis compared to 2020. Results shown for July 2026 and January 2025. Shown among total adults and by party identification. Large shares of total adults, Democrats and independents now say the U.S. is less prepared to deal with another pandemic compared to 2020 than when asked in 2025. A majority of Republicans say the U.S. is now more prepared to deal with another pandemic or widespread health crisis compared to 2020 than when asked in 2025.

This KFF Health Tracking Poll/ KFF Tracking Poll on Health Information and Trust was designed and analyzed by public opinion researchers at KFF. The survey was conducted June 25 – June 30, 2026, online and by telephone among a nationally representative sample of 1,321 U.S. adults in English (n=1,238) and in Spanish (n=83). The sample includes 1,015 adults (n=69 in Spanish) reached through the SSRS Opinion Panel either online (n=990) or over the phone (n=25). The SSRS Opinion Panel is a nationally representative probability-based panel where panel members are recruited randomly in one of two ways: (a) Through invitations mailed to respondents randomly sampled from an Address-Based Sample (ABS) provided by Marketing Systems Groups (MSG) through the U.S. Postal Service’s Computerized Delivery Sequence (CDS); (b) from a dual-frame random digit dial (RDD) sample provided by MSG. For the online panel component, invitations were sent to panel members by email followed by up to three reminder emails. 

Another 306 (n=14 in Spanish) adults were reached through random digit dial telephone sample of prepaid cell phone numbers obtained through MSG. Phone numbers used for the prepaid cell phone component were randomly generated from a cell phone sampling frame with disproportionate stratification aimed at reaching Hispanic and non-Hispanic Black respondents. Stratification was based on incidence of the race/ethnicity groups within each frame. Among this prepaid cell phone component, 142 were interviewed by phone and 164 were invited to the web survey via short message service (SMS). 

Respondents in the prepaid cell phone sample who were interviewed by phone received a $15 incentive via a check received by mail or an electronic gift card incentive. Respondents in the prepaid cell phone sample reached via SMS received a $10 electronic gift card incentive. SSRS Opinion Panel respondents received a $5 electronic gift card incentive (some harder-to-reach groups received a $10 electronic gift card). In order to ensure data quality, cases were removed if they failed two or more quality checks: (1) attention check questions in the online version of the questionnaire, (2) had over 30% item non-response, or (3) had a length less than one quarter of the mean length by mode. Based on this criterion, 1 case was removed. 

The combined cell phone and panel samples were weighted to match the sample’s demographics to the national U.S. adult population using data from the Census Bureau’s 2025 Current Population Survey (CPS), September 2023 Volunteering and Civic Life Supplement data from the CPS, and the 2026 KFF Benchmarking Survey with ABS and prepaid cell phone samples. The demographic variables included in weighting for the general population sample are gender, age, education, race/ethnicity, region, civic engagement, frequency of internet use and political party identification. The weights account for differences in the probability of selection for each sample type (prepaid cell phone and panel). This includes adjustment for the sample design and geographic stratification of the cell phone sample, within household probability of selection, and the design of the panel-recruitment procedure. 

The margin of sampling error including the design effect for the full sample is plus or minus 3 percentage points. Numbers of respondents and margins of sampling error for key subgroups are shown in the table below. For results based on other subgroups, the margin of sampling error may be higher. Sample sizes and margins of sampling error for other subgroups are available on request. Sampling error is only one of many potential sources of error and there may be other unmeasured error in this or any other public opinion poll. KFF public opinion and survey research is a charter member of the Transparency Initiative of the American Association for Public Opinion Research. 

GroupN (unweighted)M.O.S.E.
Total1,321± 3 percentage points

Democrats426± 6 percentage points
Independents439± 6 percentage points
Republicans358± 6 percentage points

Donor Government Funding for HIV in Low- and Middle-Income Countries in 2025

Published: Jul 27, 2026

This report, Donor Government Funding for HIV in Low- and Middle-Income Countries in 2025, tracks funding levels of the donor governments that collectively provide the bulk of international assistance for AIDS through bilateral programs and contributions to multilateral organizations. The new report, produced as a partnership between KFF and UNAIDS, provides the latest data available on donor funding disbursements based on data provided by governments. It includes their bilateral assistance to low- and middle-income countries and contributions to the Global Fund to Fight AIDS, Tuberculosis and Malaria as well as UNITAID.

Donor government funding for the HIV response in low-and middle-income countries fell substantially in 2025, its largest drop since the donor government funding scale-up to address HIV began, with funding dipping to pre-2008 levels. The decline was driven by reductions in disbursements from the United States, the largest donor to HIV in the world; aggregate funding from all other donors remained flat (even after adjusting for exchange rate fluctuations). This report, which focuses on both bilateral and multilateral funding for HIV provided by donor governments, provides the first analysis of the extent of this decline, comparing funding levels in 2025 to 2024 and examining broader funding trends over the past 15 years. Key findings are as follows:

  • Donor government funding for HIV decreased by US$2.1 billion, or 25%, in 2025 compared to the prior year. Disbursements totaled US$6.2 billion in 2025 compared to US$8.3 billion in 2024. This was the lowest level of donor government support since 2007 (US$5.0 billion).1, 2, 3
  • Both bilateral and multilateral funding from donor governments decreased. Bilateral funding declined by US$1.5 billion (26%) and multilateral funding declined by US$581 million (23%).
  • U.S. disbursements for HIV were US$2.1 billion less in 2025 compared to 2024 (US$4.6 billion compared to US$6.7 billion). The U.S. declines were due to significant changes made by the current U.S. administration to foreign assistance programs, including global health and HIV. At the same time, the U.S. Congress has continued to appropriate funding for HIV at steady levels, meaning that additional funding remains in the U.S. pipeline, although the extent to which those funds will be fully spent remains uncertain.
  • While HIV funding provided by all other donor governments was flat in 2025, the longer trend shows a decline, resulting in the U.S. shouldering an increasing share of the funding burden. Excluding the U.S., funding from all other donor governments totaled US$1.6 billion in 2025 compared to US$3.2 billion in 2011, a decrease of nearly 50%, largely due to declining bilateral support from other donor governments.  As a result, the U.S. share of total donor government funding for HIV rose from 59% in 2011 to 74% in 2025 making it increasingly vulnerable to changes in U.S. support as was seen in 2025. 
  • Future funding prospects are uncertain. The Organisation for Economic Co-operation and Development (OECD) Development Assistance Committee (DAC), which reported a 23% decrease in official development assistance (ODA) in 2025, has projected ODA will decrease again in 2026. Whether donor governments provide additional funding for HIV in the future, the significant reductions in 2025 have already affected the HIV response. While the U.S., the world’s largest donor for HIV, has begun to speed up obligations – agreements that will result in disbursements in the future, and the U.S. Congress has continued to appropriate funding at prior year levels, the America First Global Health Strategy calls for a significant reduction in funding to countries over a five-year period. As such, the extent to which all appropriated U.S. funds will be spent remains uncertain. In addition, the longer trend shows that funding from most other donor governments is on the decline, having already decreased by 50% since 2011.

Introduction

This report provides the latest available data on donor government resources provided to address HIV in low- and middle-income countries, reporting on disbursements made in 2025. It is part of a collaborative tracking effort between UNAIDS and KFF that began almost 20 years ago, just as new global initiatives were being launched to address the epidemic. The analysis includes data from all 34 members of the Organisation for Economic Co-operation and Development (OECD)’s Development Assistance Committee (DAC), as well as non-DAC members who report data to the DAC. Data are collected directly from donor governments, UNAIDS, the Global Fund, and Unitaid, and supplemented with data from the DAC. Of the 34 DAC members, fifteen provide 98% of total disbursements for HIV; data for these donors are presented individually. For the remaining 19 DAC members, data are provided in aggregate. All totals are presented in current U.S. dollars (amounts are not adjusted for inflation). Totals include both bilateral and multilateral assistance. Multilateral assistance for HIV includes disbursements by donors to the Global Fund and Unitaid, adjusted for an estimated HIV share, and to UNAIDS. Overall trend data are provided for the 2002 to 2025 period). Disaggregated data on bilateral and multilateral amounts are provided starting in 2011 (see methodology for more detail).

The data for 2025 represent one of the first assessments of the financial impact of major changes made by the United States starting last year, including a freezing and then canceling of numerous global HIV projects, eliminating the U.S. Agency for International Development (USAID), and introducing a new approach, the America First Global Health Strategy, with plans to significantly scale-down U.S. support for countries over the next few years.   

Findings

Total Funding

In 2025, donor government funding for HIV through bilateral and multilateral channels totaled US$6.2 billion in current USD.4 This is a decrease of US$2.1 billion (25%) compared to 2024 (US$6.2 in 2025 compared to US$8.3 billion in 2024), marking the largest drop since the donor government funding scale-up began and the lowest level of funding since 2007 ($5.0 billion) (See Figure 1 and Table 1). Donor governments accounted for more than one-third of the UNAIDS estimated US$17.6 billion made available from all sources to address HIV in 2025, an 18% decline compared to the total resources available in 2024.5,6

HIV Funding from Donor Governments, 2002-2025 (Column Chart)
Donor Government Funding for HIV (bilateral & multilateral), 2011-2025 (current USD in millions) (Table)

The decrease in 2025 was due to a decline in disbursements, or payouts, by the United States following the current administration’s actions that fundamentally altered U.S. foreign assistance programs. Collectively, these actions temporarily halted, and then slowed, U.S. HIV disbursements in 2025. Although, these declines in U.S. HIV disbursements were not as steep as overall decreases in U.S. development assistance as reported by the OECD DAC.7 At the same time, the U.S. Congress has continued to appropriate funding for HIV at steady levels, meaning that additional funding remains in the U.S. pipeline and could be spent in the future. Still, the extent to which the administration will spend these funds is unknown and the administration’s America First Global Health Strategy calls for significant scale-down in U.S. funding for countries in the future, including an estimated $7.3 billion decline over the next five years, compared to the prior five-year period.

Although there were some fluctuations by other donors, in the aggregate, their HIV funding remained flat in 2025 (US$1.6) compared to 2024. Still, when the U.S. is removed, the longer trend shows that funding for HIV provided by other donor governments has been on the decline and is significantly below funding provided in 2011 (US$3.2 billion), a decrease of nearly 50%, largely due to declining bilateral support from other donor governments (See Figure 2).8

HIV Funding from Donor Governments, Other than the United States, 2011-2025 (Line chart)

Despite the decline, the United States continued to be the largest donor to HIV efforts, providing US$4.6 billion and accounting for 74% of total donor government funding in 2025.9 The second largest donor was France (US$280 million, 4%), followed by the U.K. (US$213 million, 3%), Japan (US$202 million, 3%), and Germany (US$200 million, 3%).10,11

Bilateral Disbursements

Bilateral disbursements for HIV – that is, funding disbursed by a donor on behalf of a recipient country or region – totaled US$4.3 billion in 2025, a decrease of US$1.5 billion (-26%) compared to 2024 (US$5.8 billion). The decline was due to decreased bilateral funding by the U.S., which disbursed US$3.9 billion in 2025, a decline of US$1.5 billion (28%) compared to 2024 (US$5.4 billion). As noted above, while the U.S. Congress has continued to appropriate funding for HIV, and the administration could choose to disburse additional funds in the future, the extent to which this will occur is unknown (See Figure 3).12,13

Bilateral HIV Funding from the United States, Appropriations vs. Disbursements, 2005-2025 (Line chart)

When the U.S. is removed, bilateral disbursements from all other donor governments totaled US$373 million in 2025, a slight increase compared to 2024 (US$368 million). Almost all other donor governments either increased slightly (Australia, Canada, Italy, Norway, Spain, and Sweden), or remained flat (Denmark, Ireland, Japan, the Netherlands, and the U.K.); bilateral funding from France and Germany declined. These trends were the same after accounting for exchange rate fluctuations.

Looking more broadly, bilateral funding from these donor governments (excluding the U.S.) declined by US$1.3 billion, or 78%, between 2011 (US$1.7 billion) and 2025 (US$373 million) (See Figure 2).

Multilateral Contributions

Multilateral contributions from donor governments to the Global Fund, Unitaid, and UNAIDS for HIV – funding disbursed by donor governments to these organizations which in turn use some (Global Fund and Unitaid) or all (UNAIDS) of that funding for HIV – totaled US$1.9 billion in 2025 (after adjusting for an HIV share to account for the fact that the Global Fund and Unitaid address other areas). This represents a decrease of US$581 million (23%) compared to 2024 (US$2.5 billion).14,15  While contributions to the Global Fund accounted for most of this decline - decreasing by US$470 million (21%) between 2025 (US$1.8 billion) and 2024 (US$2.3 billion), funding for UNAIDS was reduced by US$109 million (65%) in 2025 (US$60 million) compared to 2024 (US$169 million) as several donor governments eliminated or significantly reduced support; contributions to Unitaid were flat (US$57 million in 2025 compared to US$59 million in 2024).

The decrease in 2025 multilateral disbursements was primarily driven by the U.S., which provided US$672 million in 2025, a decline of nearly half ($588 million or 47%) the amount provided in 2024 (US$1.3 billion). This decline was due in part to the timing of U.S. payments to the Global Fund (per U.S. policy requirements, U.S. contributions cannot exceed 33% of total contributions to the Global Fund, resulting in significant year-to-year differences depending on the amounts other donors have provided),16 but also to a reduction in U.S. payments to the Global Fund last year, even where they were matched by other donor contributions. The U.S. also eliminated its support to UNAIDS in 2025 (U.S. funding totaled US$50 million in 2024). As with bilateral support, appropriated funds remain and the administration could choose to provide this funding in the future (See Figure 4).17

United States funding for the Global Fund, Appropriations vs. Disbursements, 2005-2025 (Line chart)

While there were fluctuations among some of the other donor governments, these changes were largely due to the timing of payments to the Global Fund that coincide with pledge periods and donor decisions about when to fulfill pledges. When the U.S. is removed, multilateral funding from all other donor governments totaled US$1.2 billion in 2025, matching the prior year level.

Most donor governments (eleven of the fifteen profiled in 2025) provide the majority of their HIV funding through multilateral organizations. Only Denmark, the Netherlands, the U.K., and the U.S. provide a larger share bilaterally (See Figure 5). While the U.K. provided most of its HIV funding bilaterally in 2025 (and 2024), this was entirely due to the timing of payments to the Global Fund. The U.K. fulfilled almost its entire pledge to the Global Fund for 2023-2025 in 2023 resulting in significantly lower levels of multilateral funding in both 2024 and 2025. In fact, between 2019-2023, most HIV funding from the U.K. was provided through multilateral channels.

HIV Funding from Donor Governments by Funding Channel, 2025 (Stacked column chart)

Fair Share

There are different ways to measure donor government contributions to HIV, relative to one another. While the U.S. government provides the largest amount of funding for HIV, for example, it also has the largest economy in the world. To assess relative contributions, or “fair share”, two measures were used: ranking by overall funding amount and ranking by funding for HIV per US$1 million GDP, to adjust for the size of donor economies (See Table 2):

  • Rank by share of total donor government funding for HIV: By this measure, the U.S. ranked first in 2025, followed by France, the U.K., Japan, and Germany. The U.S. has ranked #1 in absolute funding amounts since tracking efforts began.
  • Rank by funding for HIV per US$1 million GDP: By this measure, the Netherlands ranks first, followed by the U.S., Denmark, Norway, and France (See Figure 6).18
Assessing Fair Share Across Donor Governments, 2025 (Table)
Donor Government Ranking by Funding for HIV per US Million GDP, 2025 (Bar Chart)

Looking Forward

Future funding prospects are uncertain. While the current administration could choose to disburse additional funds, the extent to which they will do so is unclear. Moreover, the stated strategy of the administration is to reduce, and in some cases eliminate, U.S. funding to countries as these countries take on an increasing level of financial and operational responsibility. More broadly, the OECD DAC reported a 23% decrease in official development assistance (ODA) in 2025 and is projecting further decreases in 2026; while largely driven by the U.S., other donor governments have also reduced their development assistance.

This work was supported in part by the Joint United Nations Programme on HIV and AIDS (UNAIDS) and the Bill & Melinda Gates Foundation. KFF maintains full editorial control over all of its policy analysis, polling, and journalism activities.

Adam Wexler, Jen Kates, and Stephanie Oum are with KFF. Joint United Nations Programme on HIV and AIDS (UNAIDS).

This project represents a collaboration between the Joint United Nations Programme on HIV/AIDS (UNAIDS) and KFF. Data provided in this report were collected and analyzed by UNAIDS and KFF.

Totals presented in this analysis include both bilateral funding for HIV in low- and middle-income countries, core contributions to UNAIDS, and the estimated share of donor government contributions to the Global Fund and Unitaid that are used for HIV. Amounts are based on analysis of data from the 34 donor government members of the Organisation for Economic Co-operation and Development (OECD) Development Assistance Committee (DAC) in 2024 who had reported Official Development Assistance (ODA). Bilateral and multilateral data were collected from multiple sources. Disaggregated bilateral and multilateral data are only available starting from 2011.

Data on gross domestic product (GDP) were obtained from the International Monetary Fund’s World Economic Outlook Database and represent current price data for 2025 (see: https://data.imf.org/en/datasets/IMF.RES:WEO).

Bilateral Funding:

Bilateral funding is defined as any earmarked (HIV-designated) amount, including earmarked non-core (“multi-bi”) contributions to multilateral organizations, such as UNAIDS. Data included in this report represent funding assistance for HIV prevention, care, treatment and support activities, but do not include funding for international HIV research conducted in donor countries (which is not considered in estimates of resource needs for service delivery of HIV-related activities).

The research team collected the latest bilateral funding data directly from twelve governments: Australia, Canada, Denmark, France, Germany, Ireland, Japan, the Netherlands, Norway, Sweden, the United Kingdom, and the United States during the first half of 2026, representing the fiscal year 2025 period. Direct data collection from these donors was desirable because they represent the preponderance of donor government assistance for HIV and the latest official statistics – from the Organisation for Economic Co-operation and Development (OECD) Creditor Reporting System (CRS) (see: http://www.oecd.org/dac/stats/data)  – are from 2024 and do not include all forms of international assistance (e.g., certain funding streams provided by donors, such as HIV components of mixed-purpose grants to non-governmental organizations). Bilateral estimates for Ireland and Japan for 2025 were not available at the time of publication. Prior year bilateral totals for these two donor governments were used as preliminary estimates that will be updated once data are available. Data for all other member governments of the OECD DAC – Austria, Belgium, the Czech Republic, the European Commission, Estonia, Finland, Greece, Hungary, Iceland, Italy, Korea, Lithuania, Luxembourg, New Zealand, Poland, Portugal, the Slovak Republic, Slovenia, Spain, and Switzerland – which collectively accounted for less than 5 percent of bilateral disbursements in each of the past several years, were obtained from the OECD CRS database and are from calendar year 2024.

In 2025, France provided data revising prior year amounts to account for “set-aside” funding (adjusted for an HIV-share) that supports Global Fund related activities. While this funding is considered part of France’s pledge to the Global Fund, it is not counted by the Global Fund as a direct contribution and is instead included under bilateral totals in this analysis. Due to this update, amounts presented in this report will differ from prior reports. The U.K. provided a revised estimate for bilateral funding in 2024 following the release of the previous report “Donor Government Funding for HIV in Low- and Middle-Income Countries in 2024”. The 2024 total for the U.K. has been adjusted in this report.

Where donor governments were members of the European Union (EU), the research team ensured that no double-counting of funds occurred between EU Member State reported amounts and European Commission (EC) reported amounts for international HIV assistance. Figures obtained directly using this approach should be considered as the upper bound estimation of financial flows in support of HIV-related activities.

Reflecting deliberate strategies of integrating HIV activities into other activity sectors, some donors use policy markers to attribute portions of mixed-purpose projects to HIV. This is done, for example, by the Netherlands and the U.K. The bilateral figures submitted by the UK Foreign, Commonwealth & Development Office (FCDO) for the financial year 2025/26 are based on an existing FCDO ‘HIV policy marker’. Denmark also attributes percentages of multipurpose projects to HIV. Canada breaks its mixed-purpose projects into components by percentage. Germany, Norway, and Sweden provided data much more conservatively, consistent with DAC constructs and purpose codes. Apart from targeted HIV/AIDS programs, bilateral health programs mainly focusing on health systems strengthening are also designed to contribute to the HIV response in partner countries.

Bilateral assistance data represent disbursements. A disbursement is the actual release of funds to, or the purchase of goods or services for, a recipient. Disbursements in any given year may include disbursements of funds committed in prior years and in some cases, not all funds committed during a government fiscal year are disbursed in that year. In addition, a disbursement by a government does not necessarily mean that the funds were provided to a country or other intended end-user.

Amounts presented are for the fiscal year period, which varies by country. The U.S. fiscal year runs from October 1-September 30. The fiscal years for Canada, Japan, and the U.K. are April 1-March 31. The Australian fiscal year runs from July 1-June 30. The European Commission, Denmark, France, Germany, Italy, Ireland, the Netherlands, Norway, and Sweden use the calendar year. The OECD uses the calendar year, so data collected from the CRS for other donor governments reflect January 1-December 31. Most UN agencies use the calendar year, and their budgets are biennial.

All data are expressed in current US dollars (USD), unless otherwise noted. Where data were provided by governments in their currencies, they were adjusted by average daily exchange rates to obtain a USD equivalent, based on foreign exchange rate historical data available from the U.S. Federal Reserve (see: http://www.federalreserve.gov/) or the OECD.

Funding totals presented in this analysis should be considered preliminary estimates based on data provided and validated by representatives of the donor governments who were contacted directly.

Multilateral Funding:

Multilateral funding includes core contributions to UNAIDS, as well as contributions to the Global Fund (see: http://www.theglobalfund.org/en/) and Unitaid (see: http://www.unitaid.org/#end). All Global Fund contributions were adjusted to represent 52% of the donor’s core contribution, reflecting the Fund’s reported grant approvals for HIV-related projects to date and includes funding for HIV/TB activities. Unitaid contributions were adjusted to represent 48% of the donor’s core contribution, reflecting Unitaid reported attribution for HIV-related projects.

Data obtained from UNAIDS, the Global Fund, and Unitaid were already adjusted to represent a USD equivalent based on date of receipts.

UNAIDS core contributions reflect amounts received in 2025. In 2024, the Netherlands provided two core contributions to UNAIDS; the first payment was provided for the 2024 contribution, while the second was a prepayment of the 2025 contribution. Global Fund and Unitaid contributions from all governments correspond to amounts received during the 2025 calendar year, regardless of which contributor’s fiscal year such disbursements pertain to.

In addition to contributions supporting the Global Fund’s and Unitaid’s core activities, some donor governments provided significant funding to these multilateral organizations for COVID-related efforts between 2020-2023. These COVID-specific contributions were not included in totals in this analysis. The U.S., for example, provided almost US$1.9 billion in such funding to the Global Fund during 2022. Other than contributions provided by governments to the Global Fund and Unitaid, un-earmarked general contributions to United Nations entities, most of which are membership contributions set by treaty or other formal agreement (e.g., the World Bank’s International Development Association or United Nations country membership assessments), are not identified as part of a donor government’s HIV assistance even if the multilateral organization in turn directs some of these funds to HIV. Rather, these would be considered as HIV funding provided by the multilateral organization, as in the case of the World Bank’s efforts, and are not considered for purposes of this report.

Donor Government Funding for HIV (current USD in millions), 2024 & 2025 (Table)
  1. Donor government disbursements are a subset of overall international assistance for HIV in low-and-middle-income countries, which also includes funding provided by other multilateral institutions, UN agencies, and foundations. ↩︎
  2. UNAIDS estimates that US$17.6 billion was available for HIV from all sources (domestic resources, donor governments, multilaterals, and philanthropic organizations) in 2025, an 18% decline compared to 2024. In addition, while the amounts presented in this analysis include donor contributions to multilateral organizations, the UNAIDS estimate of total available resources for HIV includes the actual disbursements made by multilateral organizations in 2025 rather than the donor government contributions to these entities. ↩︎
  3. Between 2020-2023, some donor governments provided COVID-specific emergency contributions to the Global Fund and UNITAID in addition to their contributions for core activities. For the purposes of this report, these COVID-specific amounts have been excluded as they cannot be attributed to a specific area, such as HIV. ↩︎
  4. Donor government disbursements are a subset of overall international assistance for HIV in low-and-middle-income countries, which also includes funding provided by other multilateral institutions, UN agencies, and foundations. ↩︎
  5. UNAIDS, direct communication, July 2026. ↩︎
  6. UNAIDS estimates that US$17.6 billion was available for HIV from all sources (domestic resources, donor governments, multilaterals, and philanthropic organizations) in 2025, an 18% decline compared to 2024. In addition, while the amounts presented in this analysis include donor contributions to multilateral organizations, the UNAIDS estimate of total available resources for HIV includes the actual disbursements made by multilateral organizations in 2025 rather than the donor government contributions to these entities. ↩︎
  7. OECD, “A historic decline in foreign aid: Preliminary 2025 ODA data”, April 2026. ↩︎
  8. Between 2020-2023, some donor governments provided COVID-specific emergency contributions to the Global Fund and UNITAID in addition to their contributions for core activities. For the purposes of this report, these COVID-specific amounts have been excluded as they cannot be attributed to a specific area, such as HIV. ↩︎
  9. U.S. totals represent funding amounts provided through regular appropriations only. In 2021, the U.S. Congress appropriated additional emergency supplemental funding for bilateral HIV activities and for the Global Fund to address the impacts of the COVID-19 pandemic. These emergency supplemental funding amounts are not included in overall U.S. totals. ↩︎
  10. In 2025, France provided data revising prior year amounts to account for “set-aside” funding (adjusted for an HIV-share) that supports Global Fund related activities. While this funding is considered part of France’s pledge to the Global Fund, it is not counted by the Global Fund as a direct contribution and is instead included under bilateral totals in this analysis. Due to this update, amounts presented in this report will differ from prior reports. ↩︎
  11. Total HIV funding from the Netherlands in 2024 includes two core contributions to UNAIDS; the first payment was provided for the 2024 contribution, while the second was a prepayment of the 2025 contribution. ↩︎
  12. KFF, “The U.S. President’s Emergency Plan for AIDS Relief (PEPFAR)”, May 2026. ↩︎
  13. U.S. totals represent funding amounts provided through regular appropriations only. In 2021, the U.S. Congress appropriated additional emergency supplemental funding for bilateral HIV activities and for the Global Fund to address the impacts of the COVID-19 pandemic. These emergency supplemental funding amounts are not included in overall U.S. totals. ↩︎
  14. Between 2020-2023, some donor governments provided COVID-specific emergency contributions to the Global Fund and UNITAID in addition to their contributions for core activities. For the purposes of this report, these COVID-specific amounts have been excluded as they cannot be attributed to a specific area, such as HIV. ↩︎
  15. In 2025, 52% of the Global Fund’s disbursements and 48% of UNITAID’s disbursements were directed to HIV activities. These percentages were applied to the full donor government contributions to these multilateral organizations to calculate the “HIV-share” (see Methodology for additional details). ↩︎
  16. The U.S. has had a long-standing legislative requirement that total U.S. contributions to the Global Fund could not exceed 33% of all contributions (see “KFF – The U.S. & The Global Fund to Fight AIDS, Tuberculosis and Malaria”), which results in year-to-year fluctuations in U.S. payouts to the Global Fund depending on when other donors provide funds. However, this requirement technically expired in March when the authorization legislation ended (see “KFF - PEPFAR Reauthorization: Side-by-Side of Legislation Over Time”). ↩︎
  17. U.S. totals represent funding amounts provided through regular appropriations only. In 2021, the U.S. Congress appropriated additional emergency supplemental funding for bilateral HIV activities and for the Global Fund to address the impacts of the COVID-19 pandemic. These emergency supplemental funding amounts are not included in overall U.S. totals. ↩︎
  18. GDP estimates are from the International Monetary Fund’s (IMF) World Economic Outlook (WEO) Database (accessed July 2026). ↩︎

News Release

Donor Government Funding for HIV Drops by $2.1 Billion in 2025 Due to Declines in Funding from the United States, Marking Largest Annual Decrease Since Scale-up for the HIV Response Began

Published: Jul 27, 2026

Donor government funding to combat HIV in low- and middle-income countries fell by $2.1 billion in 2025, a 25% decrease from the previous year, according to a new report by KFF and the Joint United Nations Programme on HIV/AIDS (UNAIDS)

Total disbursements dropped to $6.2 billion in 2025, down from $8.3 billion in 2024, marking the largest single-year decline since donor funding scale-up began and the lowest funding level since 2007, the report finds.

The 2025 decrease was driven by a decline in U.S. disbursements following the administration’s substantial cuts in global health funding, programs, and personnel.  Despite this decline, the U.S. remains the largest donor to HIV in the world.

Excluding the U.S., HIV funding from all other donor governments, while steady in 2025, has declined by half since 2011 — from $3.2 billion in 2011 to $1.6 billion in 2025 — primarily due to reduced bilateral support. As a result, the U.S. share of total donor government funding for HIV has risen — from 59% in 2011 to 74% in 2025 — making available resources increasingly vulnerable to changes by the U.S., as was seen in 2025.

Looking ahead, donor government funding for HIV in 2026 and beyond is uncertain. The U.S. Congress has approved steady funding levels for HIV, but it remains unclear if this funding will be spent by the administration, which plans to cut global health funding in the coming years as part of its America First Global Health Strategy. In addition, after a significant decline in development assistance in 2025, the Organisation for Economic Co-operation and Development has projected further declines in 2026.

The donor government findings are part of a broader UNAIDS analysis of HIV financing from all sources, including domestic, multilateral and philanthropic funding, which found that overall international assistance for HIV declined by 18% between 2024 and 2025.

How Many Uninsured Are in the Coverage Gap and How Many Could be Eligible if All States Adopted the Medicaid Expansion?

Authors: Sammy Cervantes, Clea Bell, Jennifer Tolbert, and Anthony Damico
Published: Jul 27, 2026

While millions of people have gained health coverage through Medicaid expansion under the Affordable Care Act (ACA) over the last decade, state decisions not to expand Medicaid continue to leave many without an affordable coverage option. In the 41 states including the District of Columbia that have adopted the expansion, adults with incomes up to 138% of the federal poverty level (FPL) are eligible for Medicaid. Medicaid expansion has led to significant coverage gains, particularly as more states adopted the expansion over the years. However, an estimated 1.2 million uninsured people in the ten states that have still not expanded remain ineligible for affordable coverage because they fall in the coverage gap—their incomes are too high for their states’ Medicaid program but too low to qualify for ACA Marketplace subsidies. Many adults in the coverage gap work or live with someone who works, are disproportionally people of color, and generally do not have dependent children.

The number of adults in the coverage gap is not expected to decline further as Medicaid changes in the 2025 reconciliation law make it less likely any state will newly adopt the expansion. The law eliminated the financial incentive included in the American Rescue Plan Act (ARPA) that was intended to encourage adoption of the expansion by non-expansion states and imposes new financial penalties on expansion states.

More broadly, policy changes in the 2025 reconciliation law and the expiration of enhanced Marketplace premium tax credits are expected to increase the number of uninsured people who do not fall in the coverage gap. Starting in January 2027, or earlier at state option, the 2025 reconciliation law requires all expansion states along with Georgia, Tennessee, and Wisconsin to condition Medicaid eligibility for individuals eligible through the expansion or waiver program on meeting work requirements. This new requirement is expected to result in significant coverage loss among expansion adults, with the Congressional Budget Office estimating that Medicaid work requirements will increase the number of uninsured individuals by 5.3 million over the next ten years. Yet these coverage losses will not increase the number of people in the coverage gap because adults who lose Medicaid because they do not meet or report work requirements continue to remain eligible for the program based on their income even if they lose Medicaid and become uninsured.

Using data from 2024, this brief estimates the number and characteristics of uninsured individuals in the ten non-expansion states who could gain coverage if Medicaid expansion were adopted.

How many people are in the coverage gap?

The coverage gap exists because not all states have adopted the ACA’s Medicaid expansion. The expansion extended Medicaid eligibility to adults ages 19-64 with incomes at or below 138% the federal poverty level (FPL), or $22,025 for an individual in 2026. Medicaid expansion covers both parents and adults without dependent children—who were previously not eligible for Medicaid. The “coverage gap” occurred because a 2012 Supreme Court ruling made Medicaid expansion optional for states, rather than the nationwide requirement Congress originally intended.

Status of State Action on the Medicaid Expansion Decision, as of May 2026 (Choropleth map)

Among the ten states that have yet to adopt Medicaid expansion, an estimated 1.2 million adults fall into the coverage gap because they earn too much to qualify for their state’s Medicaid program but not enough to access ACA Marketplace subsidies (Figure 2). Because the Medicaid expansion was intended to be mandatory for all states with Marketplace coverage available for individuals above the Medicaid limit, the minimum eligibility level for subsidies in the Marketplace was set at 100% FPL. When expanding Medicaid effectively became optional, poor adults living in states that decided not to expand were left without an affordable coverage option.


In states that have not expanded Medicaid, eligibility remains limited. The median income limit for parents is 40% FPL in these states, which is $10,928 per year for a family of three in 2026. Texas has the nation’s lowest eligibility threshold for parents at 15% FPL and bars Medicaid access for parents in a family of three earning more than $4,098, or $342 per month. With the exception of Wisconsin and Georgia, which offer coverage though a waiver, non-expansion states do not provide Medicaid coverage to adults under age 65 without dependent children, regardless of income, unless they qualify on the basis of disability (Figure 3). As a result, 78% of adults in the coverage gap are adults without dependent children.

Medicaid Income Eligibility Limits for Adults in States That Have Not Implemented the Medicaid Expansion (Split Bars)

States that have not expanded Medicaid have uninsured rates nearly twice as high as states that have expanded Medicaid (14.5% vs 8.0%). Adults who are uninsured have a harder time accessing care. In 2024, nearly four in ten adults (39%) without health insurance reported delaying or forgoing health care, including physical and mental health services and prescription medication, due to cost compared to 17% of adults with insurance. Uninsured individuals are also less likely than those with insurance to receive services to treat chronic conditions.

Why a Coverage Gap Does Not Exist in Georgia and Wisconsin

Although Georgia and Wisconsin have not adopted the Medicaid expansion, both states have expanded coverage to adults with income up to 100% FPL through an 1115 waiver, and therefore, a coverage gap does not exist in either state. In Georgia, the Georgia Pathways to Coverage waiver requires individuals to meet work requirements or qualify for an exemption in order to enroll. As a result, enrollment in the waiver program remains low.

Who is in the coverage gap and how many people could gain coverage if all states expanded Medicaid?

Most adults in the coverage gap work or live with someone who works, and they are disproportionately people of color. Six in ten adults in the coverage gap live in a family with a worker, and over four in ten are working themselves (Figure 4). Many are employed in low-wage jobs and often work for employers that do not offer affordable job-based coverage. Over half of workers in the coverage gap (58%) are employed in the service, retail, and construction industries, with common occupations including cashiers, servers, cooks, constructions labors, housekeepers, retails salespeople, and janitors. Because Medicaid eligibility levels for parents are so low in non-expansion states, even part-time work can make them ineligible. Additionally, Hispanic and Black adults make up over half (56%) of people in the coverage gap.

Characteristics of Adults 19-64
 in the Coverage Gap, 2024 (Grouped Bars)

If all remaining states adopted Medicaid expansion, approximately 2.4 million uninsured adults would become eligible for Medicaid. This includes 1.2 million in the coverage gap, who currently have no affordable coverage option, and 1.2 million with incomes between 100% and 138% of the FPL, who are eligible for but not enrolled in Marketplace coverage (Figure 5). For adults eligible for Marketplace coverage, Medicaid would offer an affordable alternative, generally with more comprehensive benefits and lower out-of-pocket costs. While some uninsured adults who are eligible for but not enrolled in Marketplace coverage could qualify for zero- or low-premium Marketplace coverage, the expiration of the temporary enhanced premium tax credits at the end of 2025 increased premiums for most Marketplace enrollees, and fewer adults are now eligible for zero-premium plans.

Uninsured Adults Ages 19-64 in Non-Expansion States Who Would Become Eligible for Medicaid if Their States Adopted the Medicaid Expansion, 2024 (Stacked column chart)
Uninsured Adults Ages 19-64 in Non-Expansion States Who Would Become Eligible for Medicaid if Their States Expanded, by Current Eligibility for Coverage, 2024 (Table)

How will changes in the 2025 reconciliation law affect the overall uninsured population?

Adults in the coverage gap represent a small share (4.5%) of the 26.7 million people ages 0-64 who were uninsured in 2024 (Figure 6). In the coming years, the number of adults in the coverage gap is unlikely to change substantially; however, the number of uninsured people overall is expected to increase. The Congressional Budget Office has estimated that Medicaid and Marketplace policy changes in the 2025 reconciliation law, most notably new Medicaid work requirements for adults enrolled in the Medicaid expansion, along with the expiration of the Marketplace enhanced premium tax credits, will increase the number of people who are uninsured by 14 million over the next decade. While some of the individuals who become uninsured will no longer be eligible for Medicaid or Marketplace coverage, others remain eligible but will lose coverage because they cannot meet work reporting requirements or are no longer able to afford their Marketplace premium.

Donut chart showing eligibility for health coverage among uninsured U.S. people ages 0–64 in 2024. Shares are divided among those eligible for tax credits (28.0%), Medicaid (24.2%), and those ineligible due to affordability or other factors, including 23.2% who lack affordable options, 19.4% ineligible due to immigration status, and 5.2% in the coverage gap.
Characteristics of Adults Ages 19-64 in the Coverage Gap, 2024 (Table)
Uninsured People Ages 19-64 Who Would Become Eligible if States Expanded Medicaid, by Race and Ethnicity, 2024 (Table)
Uninsured People Ages 19-64 Who Would Become Eligible if States Expanded Medicaid, by Age, 2024 (Table)
Uninsured People Ages 19-64 Who Would Become Eligible if States Expanded Medicaid, by Parental Status, 2024 (Table)
Uninsured People Ages 19-64 Who Would Be Eligible if States Expanded Medicaid, by Family Work Status, 2024 (Table)

This analysis uses data from the 2024 American Community Survey (ACS). The ACS provides socioeconomic and demographic information for the United States population and specific subpopulations. Importantly, the ACS provides detailed data on families and households, which we use to determine income and household composition for ACA eligibility purposes.

Medicaid and Marketplaces have different rules about household composition and income for eligibility. The ACS questionnaire captures the relationship between each household resident and one household reference person, but not necessarily each individual to all others. Therefore, prior to estimating eligibility, we implement a series of logical rules based on each person’s relationship to that household reference person in order to estimate the person-to-person relationships of all individuals within a respondent household to one another. We then assess income eligibility for both Medicaid and Marketplace subsidies by grouping individuals into household insurance units (HIUs) and calculate HIU income using the rules for each program. For more detail on how we construct person-to-person relationships, aggregate Medicaid and Marketplace households, and then count income, see the detailed Technical Appendix A.

Undocumented immigrants are ineligible for federally-funded Medicaid and Marketplace coverage. Since ACS data do not directly indicate whether an immigrant is lawfully present, we draw on the methods underlying the 2013 analysis by the State Health Access Data Assistance Center (SHADAC) and the recommendations made by Van Hook et. Al.1,2 This approach uses the 2023 KFF/LA Times Survey of Immigrants to develop a model that predicts immigration status for each person in the sample.  We apply the model to ACS, controlling to state-level estimates of total undocumented population as well as the undocumented population in the labor force from the Pew Research Center. For more detail on the immigration imputation used in this analysis, see the Technical Appendix B.

Individuals in tax-filing units with access to an affordable offer of Employer-Sponsored Insurance (ESI) are still potentially MAGI-eligible for Medicaid coverage, but they are ineligible for advance premium tax credits in the Health Insurance Exchanges. Since ACS data do not designate policyholders of employment-based coverage nor indicate whether workers hold an offer of ESI, we developed a model that predicts both the policyholder and the offer of ESI based on the Current Population Survey (CPS). Additionally, for families with a Marketplace eligibility level below 250% FPL, we assume any reported worker offer does not meet affordability requirements and therefore does not disqualify the family from Tax Credit eligibility on the Exchanges. For more detail on the offer imputation used in this analysis, see the Technical Appendix C.

As of January 2014, Medicaid financial eligibility for most adults ages 19-64 is based on modified adjusted gross income (MAGI). To determine whether each individual is eligible for Medicaid, we use each state’s reported eligibility levels as of April 2025, updated to reflect 2026 Federal Poverty Levels. Some adults ages 19-64 with incomes above MAGI levels may be eligible for Medicaid through other pathways; however, we only assess eligibility through the MAGI pathway.3

An individual’s income is likely to fluctuate throughout the year, impacting his or her eligibility for Medicaid. Our estimates are based on annual income and thus represent a snapshot of the number of people in the coverage gap at a given point in time. Over the course of the year, a larger number of people are likely to move in and out of the coverage gap as their income fluctuates.

Starting with our estimates of ACA eligibility in 2017, we transferred our core modeling approach from relying on the Current Population Survey (CPS) Annual Social and Economic Supplement (ASEC) to the American Community Survey (ACS). ACS includes a 1% sample of the US population and allows for precise state-level estimates as well as longer trend analyses. Since our methodology excludes a small number of individuals whose poverty status could not be determined, our ACS-based population totals appear slightly below CPS-based totals and some ACS population totals published by the Census Bureau. This difference is in large part attributable to students who reside in college dormitories. Comparing the two survey designs, CPS counts more of these individuals in the household of their parent(s) than ACS does.

Code available at https://github.com/KFFData/CPS-ACS-Analytic-Code

KFF ACA Eligibility Analysis, Technical Appendix A: Household Construction

In KFF’s estimates of eligibility for ACA coverage, income eligibility for both Medicaid and Marketplace subsidies is assessed by grouping people into “health insurance units” (HIUs) and calculating HIU income according to Medicaid and Marketplace program rules. HIUs group people according to how they are counted for eligibility for health insurance, versus grouping people according to who they live with (e.g., “households”) or are related to (e.g., “families”). HIU construction is an important step in assessing income as a share of the federal poverty line (FPL) because it impacts whose income is counted (and thus the total income for the unit) and how many people share that income (and thus the corresponding FPL to use for comparison, since FPL varies by family size). Our HIUs are designed to match ACA eligibility rules for both Medicaid and Marketplaces. Below we describe how we construct HIUs for this analysis. The programming code, written using the statistical computing package R v.4.5.2, is available at https://github.com/KFFData/CPS-ACS-Analytic-Code for people interested in replicating this approach for their own analysis.

Person to Person Relationships

We construct spousal and parent-to-child person-to-person linkage variables within each household of the microdata. The American Community Survey (ACS) includes only the relationship of each person in a household to one central reference person. Using the household reference person's known relationships to all other individuals within each household, we iterate through every pair of individuals present in each household to determine probable person to person links for possible mother, father, and spousal pairs. Our approach to determining probable family interrelationship linkages closely follows the construction documented by IPUMS-USA with the notable exception of unmarried partner relationships.4 We intentionally diverge from IPUMS-USA because the presence of an unmarried partner relationship does not impact federal program eligibility. Among individuals designated as married with a spouse present in the household, our constructed spousal pointer matches the IPUMS SPLOC variable 99% of the time in the 2013 microdata. Our construction of mother and father pointers match the IPUMS MOMLOC, POPLOC, MOMLOC2, and POPLOC2 variables for more than 99% of all person-records.

Family Aggregation

Separate from person-to-person linkage variables, we assemble individual records into family units reproducing the Census Bureau's Family Poverty Ratio (POVPIP) variable. Although the Census Bureau does not include a unique family identifier on the ACS microdata, we approximate the groupings used to generate the ACS income-to-poverty ratio variable with the following steps:

  1. Both non-relatives of the household reference person (RELP of 11-17) and all individuals in non-family households (HHT of 4-7) are categorized as single-person families.
  2. Married couples and other family households without subfamilies (PSF of 0) are categorized into single-family households.
  3. Married couples and other family households with subfamilies (PSF of 1) are categorized based on their subfamily number (SFN).

This family identifier is used in estimating family-wide statistics, such as the percent of the uninsured Americans in a family below poverty or the count of Medicaid-enrollees with one or more workers in their family. This family aggregation matches the groupings used to determine the income-to-poverty ratio variable, and estimates of health insurance presented by family poverty categories align with Census Bureau publications based on the ACS.5 Since many family members obtain health coverage separately from one another (for example, an elderly parent cohabiting with their working-age child might hold Medicare coverage and Employer Sponsored Insurance, respectively), descriptive statistics focused on family attributes rely on this family identifier but Medicaid and Marketplace eligibility determinations do not.

Overview of KFF-HIUS 

We construct two different HIUs for everyone in the sample: a Medicaid HIU and a Marketplace HIU. We use two HIUs because the rules for counting families and income differ between the two programs. For example, in Medicaid, children with unmarried parents have both parents’ income counted toward their income, whereas under Marketplace rules, only the income of the parent who claims the child on his/her taxes counts. In another example, certain tax dependents (e.g., a parent) are treated differently for Medicaid eligibility than they are for Marketplace eligibility. To account for these rules, we developed an algorithm for sorting people into HIUs. We construct HIUs and HIU incomes separately for each person in a household and take into account the family relationships and income of the other people in the person’s household. People in the same household or in the same family may not have the same HIU composition or income for determining either Medicaid eligibility or eligibility for tax credits.

In simplest terms, the HIU algorithm sorts people into tax filing units. For all people in the data set, the algorithm assesses whether they are likely to be a tax filer themselves and, if so, who they are likely to claim or, if not, who is likely to claim them. It also captures whether someone is neither a tax filer nor claimed as a dependent by someone else. Importantly, the HIU construction considers all relationships for each person within the household. This step is particularly important in correctly classifying people in non-nuclear families (e.g., households with more than one generation, with unmarried partners, or with relatives outside the nuclear family such as an aunt or uncle), which may contain either one or multiple tax filing units.

In counting income for both Medicaid and Marketplace HIUs, we use modified adjusted gross income (MAGI), corresponding to the ACA rules. MAGI differs from total income in that some sources of income (e.g., cash assistance payments from TANF or SSI) do not count toward MAGI. We calculate HIU income as a share of poverty using the Health and Human Services Poverty Guidelines.6

For a small number of people, Medicaid HIU income as a share of poverty does not match Marketplace HIU income as a share of poverty due to the different rules between the programs. This analysis first calculates Medicaid HIU and classifies anyone who meets Medicaid eligibility into that category (including most individuals below 138% FPL in the Medicaid expansion states). We then calculate Marketplace HIU; anyone meeting subsidy eligibility is grouped into that category (above Medicaid and also above 100% FPL up to 400% FPL for most individuals). This approach follows the eligibility rules in the ACA, which specify that people are eligible for tax credits only if they are ineligible for Medicaid.

Steps in Calculating KFF-HIUS

Before we group people into HIUs, we first calculate annual MAGI for each respondent. We compare each person’s income to IRS filing requirements for being a tax filer7 and for being a qualifying relative claimed by someone else.8

We then group people into HIUs. We begin this process by grouping everyone within a household who is related into “cohabitating families.” Cohabitating families include all family relations; they also include unmarried cohabitating partners and relatives of each cohabitating partner.

Within each cohabitating family, we assess whether any individual is eligible to claim any other individual as a tax dependent. People are eligible to claim others as tax dependents if their income is above the IRS filing threshold for a head of household or, if married, for a married couple. People are eligible to be claimed by others if (a) they are a child (under age 19 or, for tax credits, 23 if a full-time student), and someone else in the cohabitating family has at least twice their income, or (b) they are below the limit to be a tax filer, have income below the qualifying relative limit, and someone else in the cohabitating family has at least twice their income. Within each cohabitating family, we assess who is likely to claim whom, using the assumptions that:

  • People who are claimed by others are more likely to be claimed by close relatives (e.g., a parent) than by others (e.g., a grandparent).
  • Married couples (who file) file jointly
  • If more than one person in a cohabitating family is eligible to claim others within that cohabitating family, the wealthiest person claims the eligible dependents.

Once we determine who within the cohabitating family is likely to claim each other, we know the HIU size and are able to apply income rules for the HIU. We apply Medicaid and Marketplace rules for whose income counts in calculating Medicaid HIUs and Marketplace HIUs, respectively.9 People who are filers but are not eligible to claim someone else or to be claimed by someone else are an HIU of 1. People who are not filers and are not claimed by filers have their HIU size and income counted according to Medicaid non-filer rules.10

Inflation Factors

In order to determine ACA eligibility during calendar year 2024, we compared tax filing unit income against the most current premiums available, for open enrollment 2026.11 We relied on the Bureau of Labor Statistics Employment Cost Index (ECI), Private Wages and Salaries to inflate the income of each HIU by approximately 7.0% to align 2024 incomes to 2026 premiums.12 Since most state Medicaid eligibility determinations through the MAGI pathway are calculated as a percent of HHS Poverty Guidelines for that year and not a fixed dollar amount, inflation was not necessary to assess the Medicaid eligibility of individuals.

After inflating 2024 tax filing unit incomes to match 2026 premiums, we similarly inflated 2024 IRS thresholds for both filing requirements13 and for qualifying relative tests14 by the same factor so that these thresholds aligned with the inflated income amounts.

Limitations

As with any analysis, there are some limitations to our approach due to the level of detail that we can obtain from available survey data. Key limitations to bear in mind include:

  • We currently are not able to appropriately group anyone who lives outside the household with a household that claims them as a tax dependent. For example, we are not able to connect students living away from home or children with a non-custodial parent with the people who may be claiming them (and whose income should count to their HIU). We are also not able to determine married people who file separately.
  • To group people into tax filing units, we have to make assumptions about how people are likely to file their taxes. We assume that tax filers claim qualifying relatives they are able to claim. We make this assumption based on the fact that Medicaid and Marketplace eligibility rules are determined not by who is actually claimed on the tax return but by who is allowed to be claimed. However, people may sort themselves into different tax filing units than we estimate.

KFF ACA Eligibility Analysis, Technical Appendix B: Immigration Status Imputation

To impute documentation status, we draw on the methods underlying the 2013 analysis by the State Health Access Data Assistance Center (SHADAC) and the recommendations made by Van Hook et. al..15,16 This approach uses the 2023 KFF/LA Times Survey of Immigrants to develop a model that predicts immigration status for each person in the sample.17 We apply the model to a second data source, controlling to state-level estimates of total undocumented population as well as the undocumented population in the labor force from the Pew Research Center.18 Below we describe how we developed the regression model and applied it to the American Community Survey (ACS). We also describe how the model may be applied to other data sets. The programming code, written using the statistical computing package R v.4.5.2, is available at https://github.com/KFFData/CPS-ACS-Analytic-Code for people interested in replicating this approach for their own analysis.

Data Sources

We used the 2023 KFF/LA Times Survey of Immigrants data to build the regression model. The 2023 Survey of Immigrants dataset contains questions on citizenship and legal status at the person level. The KFF/LA Time Survey of Immigrants19 is a probability-based survey exploring the immigrant experience in the U.S. and draws on three different sampling frames including an address-based sample (ABS), a random digit dial (RDD) sample of pre-paid cell phone numbers, and callbacks to an RDD sample in which the individual did not speak English or Spanish. The survey includes interviews with 3,358 immigrant adults and was offered in ten different languages.

The regression model is designed to be applied to other datasets in order to impute legal immigration status in surveys that do not ask about migration status. The code mentioned above includes programming to apply the model to either the Survey of Income and Program Participation (SIPP) Core files, ACS, or the Current Population Survey (CPS). Because the SIPP Core file contains different survey questions and variable specifications from the ACS and CPS, we create unique regression models to apply the model to each dataset. For the analysis underlying this brief and other KFF estimates of eligibility for ACA coverage, we apply the regression model to the 2013 ACS and then each subsequent year of the ACS.

Due to underreporting of legal immigration status in survey datasets, in imputing immigration status we control to state and national-level estimates of the total undocumented population and also the undocumented population in the labor force from the Pew Research Center. Pew reports these estimates for all states and the District of Columbia.20

Construction of Regression Model

We use the 2023 Survey of Immigrants to create a binomial, dependent variable that identifies a respondent as a potential unauthorized immigrant. The dependent variable is constructed based on the following factors:

  1. Respondent was not a United States (US) citizen,
  2. Respondent did not have permanent resident status or a valid work or student visa, , and
  3. Respondent does not have other indicators that imply legal status.21

We use the following independent variables to predict unauthorized immigrant status:

  1. Year of US entry,
  2. Job industry classification,
  3. State of residence,
  4. Household Income,
  5. Ownership or rental of residence,
  6. Number of occupants in the household (< or >= six occupants),
  7. Whether all household occupants are related,
  8. Health insurance coverage status,
  9. Country of birth,
  10. Sex, and
  11. Ethnicity.

The regression model was sub-populated to remove respondents who could not be considered unauthorized. People who could not be considered unauthorized include people who are US citizens or have other indicators that imply legal status.

Imputing Unauthorized Immigrants in Other Datasets

We use the Pew estimates as targets for the total number of unauthorized immigrants that the imputation generates. We first apply this strategy to the 2013 ACS, which contains health insurance information prior to the ACA's coverage expansions. We stratify the targets by state and the District of Columbia and by participation in the labor force. We impute immigration status within each of these 102 strata.22

To generate the imputed immigration status variable, we first calculated the probability that each person in the dataset was unauthorized based on the 2023 Survey of Immigrants regression model. Next, we isolated the dataset to each individual stratum described above. Within each stratum, we sampled the data using the probability of being unauthorized for each person. After sampling, we summed the person weights until reaching the Pew population estimate for each stratum. The records that fell within the Pew population estimate were considered to be unauthorized immigrants. We repeated the process of sampling using the probability of being unauthorized and subsequently summing the person weights to reach Pew targets five times, creating five different unauthorized variables per record. These five imputed authorization status variables were then incorporated into a standard multiple imputation algorithm, closely matching the imputed variable analysis techniques used by the Centers for Disease Control and Prevention for the National Health Interview Survey.23

To easily apply the regression model to other data sets, we created a function that applies this approach to a chosen data set. The function first loads the dataset of choice, then standardizes the data to match the independent variables from the 2023 Survey of Immigrants regression model, and finally applies the multiple imputation to generate a variable for legal immigration status.

KFF ACA Eligibility Analysis, Technical Appendix C: Imputation of Offer of Employer-Sponsored Insurance

An integral part of determining ACA eligibility is assessing whether workers without employer-sponsored insurance (ESI) hold an offer through their workplace that they decline to take up. In most cases, an affordable offer of ESI disqualifies members of the tax filing unit of the worker from receiving subsidized coverage on the ACA Health Insurance Marketplace. The American Community Survey (ACS) does not ask about employer offers of ESI; however, the Current Population Survey Annual Social and Economic Supplement (CPS-ASEC) includes questions about whether each worker received an offer of ESI from his or her employer at the time of interview. We use the CPS-ASEC offer of ESI variable to inform a regression-based multiple imputation of whether each tax filing unit constructed in the ACS had at least one offer at work, and also assess affordability for the employee and, separately, for any potential dependents within the unit. Since the health insurance coverage variables available in the CPS-ASEC 2025 capture sources of coverage at any point during calendar year 2024 (versus at the time of survey, as with the offer rate variable), a subset of sampled individuals had a change in their employer-based coverage status across the two distinct time periods.24 Therefore, among workers who potentially experienced a shift in offer status across the two time periods, we recoded or imputed offer rates in 2024 using the offer status in 2025. After constructing this revised offer variable for workers in CPS, we aggregated the results at the tax filing unit level to create a prediction model to apply to the ACS. Below we describe these recodes and imputation. The programming code, written using the statistical computing package R v.4.5.2, is available at https://github.com/KFFData/CPS-ACS-Analytic-Code for people interested in replicating this approach for their own analysis.

Recoding and Imputing Offer Rate Data in the CPS

As a first step in our analysis, we divided CPS-ASEC survey respondents into five distinct groups:

  1. All individuals who did not work during 2024 and also did not hold an offer of ESI in 2025 were assumed not to have an offer in 2024.
  2. All individuals who reported being an ESI policyholder (that is, anyone reporting having taken-up their offer of ESI) during 2023 and also reported holding an offer of ESI during early 2025 were assumed to have an offer in 2024.
  3. All workers in 2024 who held their own ESI policies during 2023 but then reported not holding an offer during 2025 were re-coded as holding an offer of ESI in 2024.
  4. All non-workers during 2024 who reported holding an offer during 2024 were re-coded as not holding an offer of ESI in 2024.
  5. Some workers during 2024 who did not report being ESI policyholders but did report holding an offer of ESI during early 2025 were imputed to not have an offer of ESI during 2024.

For many groups, including those in groups (1) and (2) listed above, the offer status did not change across the two time periods. In contrast, we recoded offer status for people in groups (3) and (4): every non-offered worker in group (3), which includes people who held ESI policies in their own name in 2024, were considered to have an offer of ESI in 2024, and offered workers in group (4), which includes people who did not work themselves in 2024, were considered to not have their offer of ESI in 2024. Last, we implemented a probability-based random sample imputation of offers of ESI for people in group (5), described in more detail below. Only a subset of the group was re-coded from holding an offer in 2025 to not holding an offer in 2024.The number of workers selected from this population was equal to the population size of (3) subtracted by the population size of (4), thereby assuming an unchanging offer rate for the total worker population across the period.

Imputing Offer Rates for CPS Respondents with Ambiguous Offer Rate Status

The CPS-ASEC worker-level regression model was designed to be applied to a single dataset where ESI offer status is known at one point in time but not another. The code mentioned above includes programming to apply the model to the Current Population Survey (CPS-ASEC) (for years 2014 on). For the analysis underlying KFF’s current estimates of ACA eligibility, we apply the regression model to workers in the 2025 CPS-ASEC.

  • We use the 2025 point-in-time worker offer variable provided by the US Census Bureau25 to create a binomial, dependent variable that identifies a respondent as a recipient of an offer of employer-sponsored insurance at his or her workplace in early 2025. The dependent variable was constructed at the worker-level based on individuals not holding their own ESI policy at time of interview and also reporting an ESI offer or eligibility to be covered that was then voluntarily declined.

We use the following independent variables to predict offer status in 2024 among workers not covered by their own ESI during both 2024 and early 2025 but potentially holding an offer of ESI in 2024:

  • Any public coverage,
  • Any nongroup coverage,
  • Worker earnings among all jobs,
  • Full-time versus part-time status,
  • Age of worker,
  • Work within the construction industry.

The regression model was sub-populated to remove respondents already covered by their own ESI and also to remove non-workers. Since this imputation does not account for the affordability of the offer or whether it meets the minimum value test, we included an assumption that workers in tax filing units with a MAGI below 250% FPL do not hold affordable offers of ESI and therefore might be eligible to purchase subsidized coverage on the Exchanges.26

As mentioned above, we assume an unchanging offer rate for the total worker population across the two time periods. We determined the needed size of the population to impute by subtracting the population of (4) from the population of (3) to ensure an equivalent number of offers were gained and lost. This left only workers who reported holding an offer of ESI during early 2025, since (3) represented a larger count of workers than (4). We then calculated the probability that each worker in the dataset was offered ESI during calendar year 2024 based on our 2025 CPS-ASEC regression model. Next, we selected workers within the potential population (5) using the sampling probabilities resultant from our model.

Construction and Application of ACS Regression Model

For the analysis underlying KFF estimates of ACA eligibility, we construct a prediction model of having an offer of ESI using the 2025 CPS-ASEC and then apply this regression to tax filing units in the 2024 ACS to estimate who has an ESI offer in ACS.

We aggregate the worker offer variables constructed the 2025 CPS-ASEC as described above to create a binomial, dependent variable that identifies each tax filing unit as either holding or not holding an affordable offer of employer-sponsored insurance.

We use the following independent variables to predict offer status among tax filing units:

  • Any senior citizen in the household,
  • Oldest member of the tax-filing unit,
  • Any member of the tax-filing unit has employer-sponsored insurance coverage,
  • Any member of the tax-filing unit has nongroup coverage,
  • Any uninsured individuals in the tax filing unit,
  • Share of adults working full-time and part-time, and
  • Highest worker earnings.

Since the imputation of documentation status (discussed in Technical Appendix B) required a multiply-imputed approach, this secondary imputation and subsequent worker sampling was only conducted once per implicate, keeping the number of ACS implicates to five.

  1. State Health Access Data Assistance Center. 2013. “State Estimates of the Low-income Uninsured Not Eligible for the ACA Medicaid Expansion.” Issue Brief #35. Minneapolis, MN: University of Minnesota. Available at: http://www.rwjf.org/content/dam/farm/reports/issue_briefs/2013/rwjf404825. ↩︎
  2. Van Hook, J., Bachmeier, J., Coffman, D., and Harel, O. 2015. “Can We Spin Straw into Gold? An Evaluation of Immigrant Legal Status Imputation Approaches” Demography. 52(1):329-54. ↩︎
  3. Non-MAGI pathways for nonelderly adults include disability-related pathways, such as SSI beneficiary; Qualified Severely Impaired Individuals; Working Disabled; and Medically Needy. We are unable to assess disability status in the ACS sufficiently to model eligibility under these pathways. However, previous research indicates high current participation rates among individuals with disabilities (largely due to the automatic link between SSI and Medicaid in most states, see Kenney GM, V Lynch, J Haley, and M Huntress. “Variation in Medicaid Eligibility and Participation among Adults: Implications for the Affordable Care Act.” Inquiry. 49:231-53 (Fall 2012)), indicating that there may be a small number of eligible uninsured individuals in this group. Further, many of these pathways (with the exception of SSI, which automatically links an individual to Medicaid in most states) are optional for states, and eligibility in states not implementing the ACA expansion is limited. ↩︎
  4. Steven Ruggles, Sarah Flood, Ronald Goeken, Josiah Grover, Erin Meyer, Jose Pacas, and Matthew Sobek. IPUMS USA: Version 8.0 [dataset]. Minneapolis, MN: IPUMS, 2018. https://doi.org/10.18128/D010.V8.0 For a detailed description of how IPUMS constructs family interrelationships variables, see https://usa.ipums.org/usa/chapter5/chapter5.shtml ↩︎
  5. According to the Public Use Microdata Sample (PUMS) documentation, "Estimates generated with PUMS microdata will be slightly different from the pretabulated estimates for the same characteristics published on data.census.gov. These differences are due to the fact that the PUMS files include only about two-thirds of the cases that were used to produce estimates on data.census.gov, as well as additional PUMS edits." ↩︎
  6. Medicaid eligibility in 2026 is based on 2026 poverty guidelines, available at: U.S. Department of Health and Human Services, Office of The Assistant Secretary for Planning and Evaluation, Poverty Guidelines. https://aspe.hhs.gov/topics/poverty-economic-mobility/poverty-guidelines. Tax credit eligibility in 2026 is based on 2025 poverty guidelines, available at: U.S. Department of Health and Human Services, Office of The Assistant Secretary for Planning and Evaluation, 2025 Poverty Guidelines https://aspe.hhs.gov/topics/poverty-economic-mobility/poverty-guidelines/prior-hhs-poverty-guidelines-federal-register-references↩︎
  7. See Internal Revenue Service, Publication 501, Table 1.2024: Filing Requirements Chart for Most Taxpayers. Available at: https://www.irs.gov/pub/irs-prior/p501--2024.pdf. ↩︎
  8. See Internal Revenue Service, Publication 501, Qualifying Relative. Available at: https://www.irs.gov/pub/irs-prior/p501--2024.pdf. ↩︎
  9. A detailed explanation of Medicaid and Marketplace income counting rules can be found in Center on Budget and Policy Priorities webinar available at: http://www.healthreformbeyondthebasics.org/wp-content/uploads/2013/08/Income-Definitions-Webinar-Aug-28.pdf. ↩︎
  10. A detailed explanation of Medicaid and Marketplace HIU size calculations can be found in the Center on Budget and Policy Priorities webinar available at http://www.healthreformbeyondthebasics.org/wp-content/uploads/2013/08/Household-Definitions-Webinar-7Aug13.pdf. ↩︎
  11. This is the same underlying data as the 2026 Health Insurance Marketplace Calculator. Available at: https://www.kff.org/interactive/subsidy-calculator/. ↩︎
  12. See Congressional Budget Office, Economic Projections. Available at: https://www.cbo.gov/system/files/2025-09/51135-2025-09-Economic-Projections.xlsx. ↩︎
  13. See Internal Revenue Service, Publication 501, Table 1.2024: Filing Requirements Chart for Most Taxpayers. Available at: https://www.irs.gov/pub/irs-prior/p501--2024.pdf. ↩︎
  14. See Internal Revenue Service, Publication 501, Qualifying Relative. Available at: https://www.irs.gov/pub/irs-prior/p501--2024.pdf. ↩︎
  15. State Health Access Data Assistance Center. 2013. “State Estimates of the Low-income Uninsured Not Eligible for the ACA Medicaid Expansion.” Issue Brief #35. Minneapolis, MN: University of Minnesota. Available at: http://www.rwjf.org/content/dam/farm/reports/issue_briefs/2013/rwjf404825. ↩︎
  16. Van Hook, J., Bachmeier, J., Coffman, D., and Harel, O. 2015. “Can We Spin Straw into Gold? An Evaluation of Immigrant Legal Status Imputation Approaches” Demography. 52(1):329-54. ↩︎
  17. This data source is a change from previous KFF analyses, which used microdata from the 2008 Panel of the Survey of Income and Program Participation (SIPP) ↩︎
  18. This data source is a change from previous KFF analyses, which used estimates from the Department of Homeland Security. ↩︎
  19. More information about the survey methods is available at https://www.kff.org/report-section/understanding-the-u-s-immigrant-experience-the-2023-kff-la-times-survey-of-immigrants-methodology/ ↩︎
  20. Pew updates these estimates periodically. We use the most recent estimates available at the time of our analysis, and in some cases incorporate estimates received from correspondence with researchers at Pew prior to their publication - however we do not release these numbers ourselves. We draw on Pew directly for all published data and interpolate years missing from their trend. Our analysis uses the year applicable to the year for the data sets to which we apply the regression model. The most recent estimates as of the time of our analysis were: J Passel, J Krogstad. U.S. Unauthorized Immigrant Population Reached a Record 14 Million in 2023. (Pew Research Center), August 2025. Available at: https://www.pewresearch.org/race-and-ethnicity/2025/08/21/u-s-unauthorized-immigrant-population-reached-a-record-14-million-in-2023/. ↩︎
  21. Indicators that imply legal status include: (i) respondent entered the US prior to 2000, (ii) respondent is enrolled in Medicare or military health insurance, or (iii) respondent reports Medicaid coverage but resides in a state that does not offer coverage to the undocumented population beyond CHIP’s From-Conception-to-End-of-Pregnancy (FCEP) option. ↩︎
  22. For more information, see SHADAC 2013, footnote 1. The table created for this function contains estimates of the undocumented across 2013, 2023, and 2024. ↩︎
  23. For more detail, see documentation available at: National Health Interview Survey. 2024 Imputed income technical document. Available at: https://www.cdc.gov/nchs/nhis/documentation/2024-nhis.html. ↩︎
  24. For example, anyone who did not work during 2024 who then held an offer of ESI in early 2025 would appear incongruous in our CPS-based eligibility model.  In the other direction, workers covered by health insurance through their own employer in 2024 who lost their offer of ESI during the early months of 2025 (perhaps due to a job change) would also appear incongruous due to the discrepancy across the two time periods. ↩︎
  25. Available at: https://www.census.gov/data/datasets/time-series/demo/health-insurance/cps-asec-research-files.html. For more detail about these microdata, see: J. Abramowitz, B. O'Hara.  New Estimates of Offer and Take-up of Employer-Sponsored Insurance (US Census Bureau), 2016.  Available at: https://www.census.gov/library/working-papers/2016/demo/Abramowitz-2016.html. ↩︎
  26. For an explanation of affordability, see: KFF. Employer Responsibility Under the Affordable Care Act. February 2024. Available at: https://www.kff.org/infographic/employer-responsibility-under-the-affordable-care-act/. ↩︎