KFF Health Tracking Poll: Health Care Costs and the Midterms
Findings
Key Takeaways
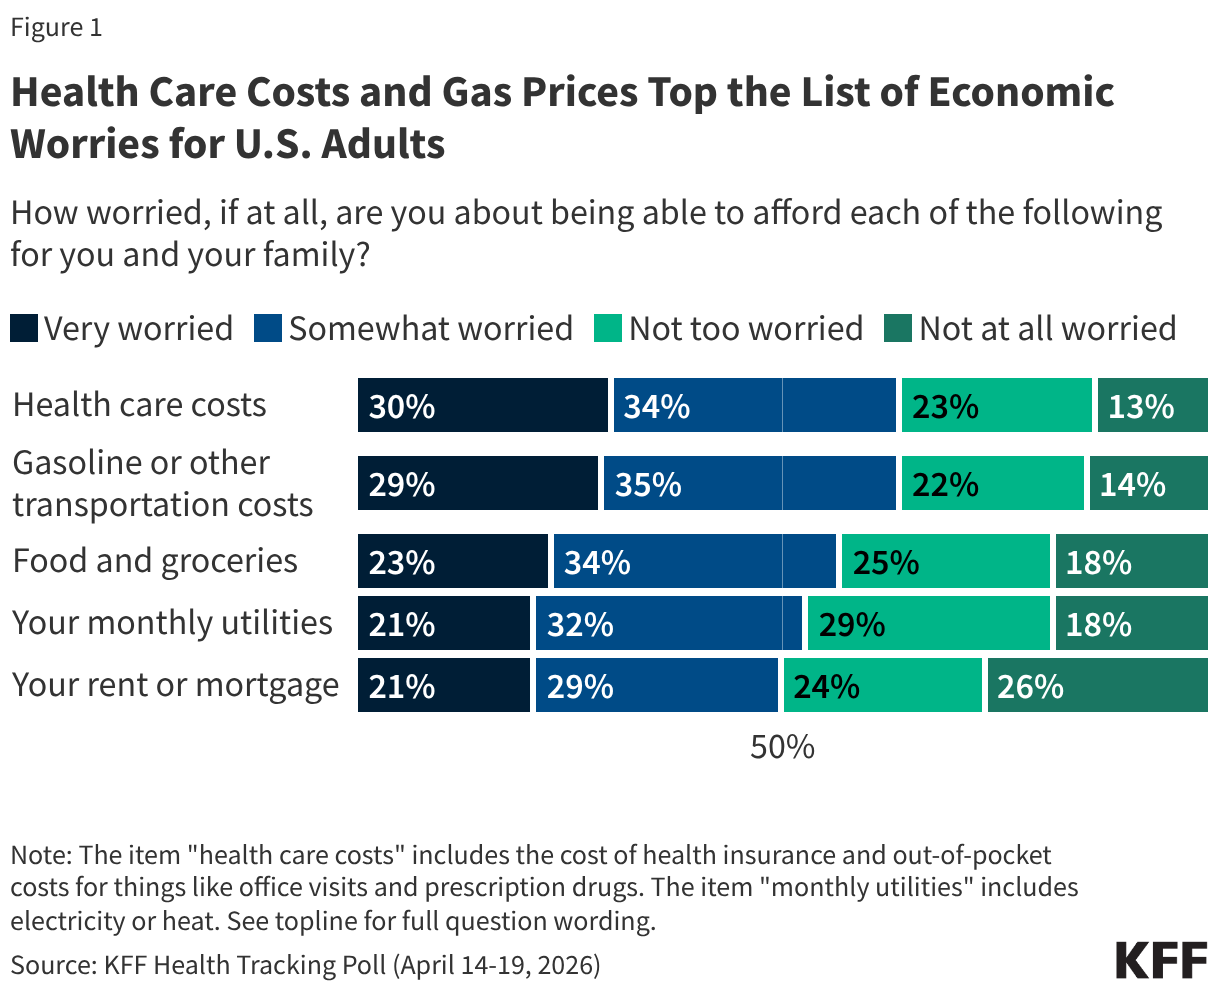
- Health costs continue to top the public’s list of affordability worries, even as concerns about gas prices have risen in recent weeks. Nearly two-thirds (64%) of adults are worried about being able to afford health care costs, on par with the share who now worry about gas and transportation costs (64%) and outranking other economic concerns. In January 2026, prior to the start of the U.S. conflict with Iran, gasoline and transportation costs ranked at the bottom of household financial worries. Now, gas prices share the top spot with health care costs as the biggest financial worry adults face for themselves and their families.
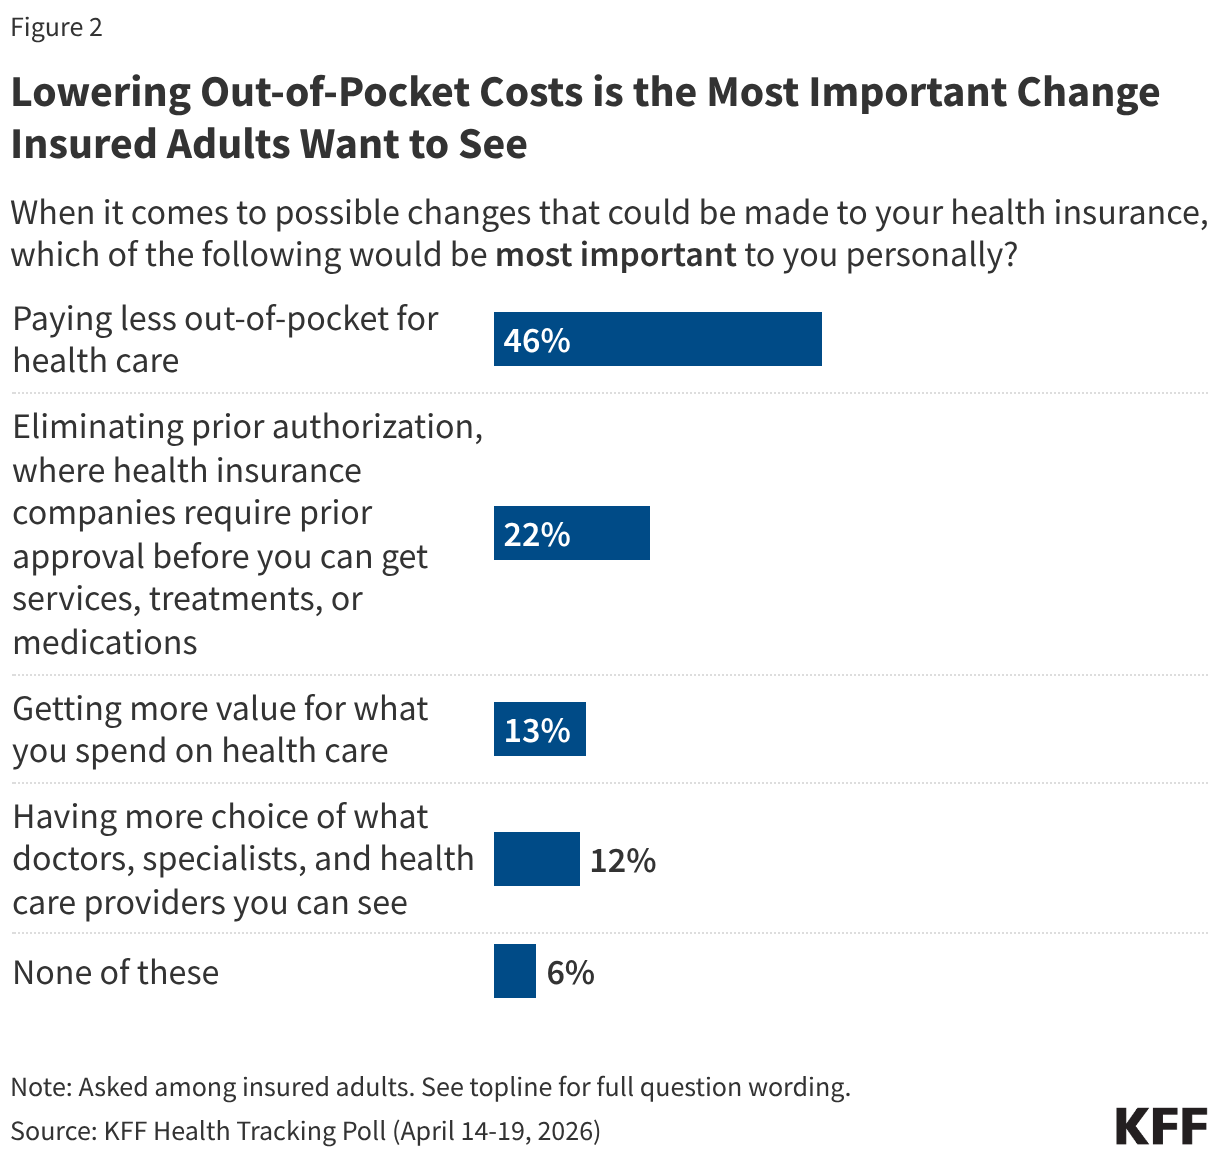
- Lowering out-of-pocket costs ranks as the most important change insured adults say they would like to see from their health insurance. When given a list of possible changes that could be made to their health insurance, half (46%) of insured adults choose lowering their out-of-pocket costs as most important, more than twice the share who cite eliminating prior authorization (22%). Fewer say other possible changes such as getting more value for what they spend (13%) and having more choice in providers (12%) would be most important to them.
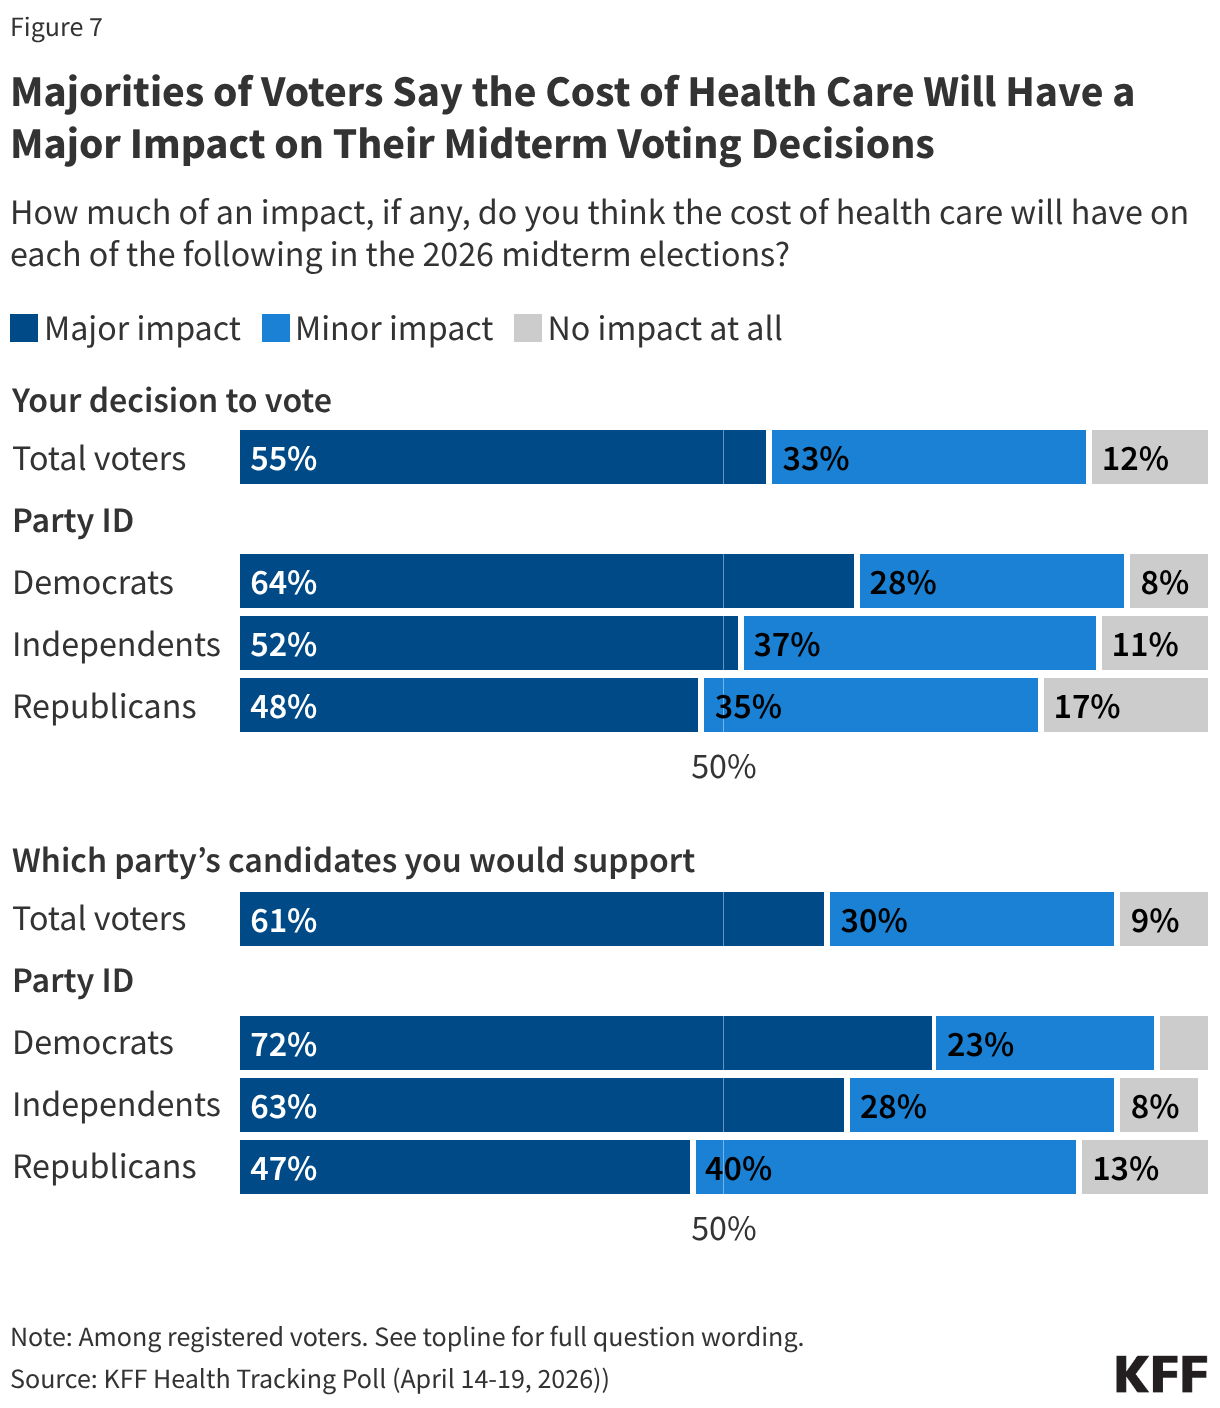
- Health costs also loom large in the upcoming midterm elections. About nine in ten voters say the issue will influence their decision to vote and who to vote for in the 2026 midterm elections, with majorities saying it will have a “major impact” on both areas (55% and 61%). While majorities of voters across partisans say health care costs will impact their vote in November, the issue is more salient among Democratic and independent voters. About seven in ten Democratic voters (72%) and nearly two-thirds of independent voters (63%) say health care costs will impact which party’s candidate they would support in the election, compared to about half of Republican voters (47%) who say the same.
- While both political parties have made recent announcements about their own plans to bring down health costs, the latest polling shows the Democrats currently have the edge among voters. Voters give the Trump administration low approval ratings on its handling of the cost of health care and are more likely to trust the Democratic Party (37%) over the Republican Party (26%) on addressing this issue. Fewer than half of voters approve of the administration’s handling of cost of health care (33%) and the cost of prescription drugs (41%).
- The Republican Party holds an advantage on addressing fraud and waste in government health care programs, which has been a key messaging strategy during the second Trump administration. One-third of voters say they trust Republicans on this issue compared to a quarter who say they trust Democrats. Notably, on most issues asked about, sizable shares of voters say they trust neither party.
Health Care Costs Are a Top Concern for the Public and Voters
Health care costs remain a primary economic concern for the public and voters’ top health concern heading into the 2026 midterm elections. The latest KFF Health Tracking Poll finds health care costs remain at the top of the list of what the public worries about being able to afford for themselves and their family, now tied with gasoline and transportation costs amid rising fuel prices. Nearly two-thirds of the public (64%) say they are at least somewhat worried about affording health care costs including the cost of health insurance and out-of-pocket costs such as for office visits and prescription drugs. This includes three in ten adults overall (30%) and voters (30%) who say they are “very worried” about paying for health care. A similar share of adults is “very worried” about affording gas and transportation costs (29%), up from about one in six (17%) in January. This comes as the national average for gasoline has risen to over $4 per gallon, up roughly 38% since the conflict with Iran began. About one in five adults say they are “very worried” about affording food and groceries (23%), rent or mortgage (21%) or monthly utilities (21%).
Even among adults with health insurance coverage, lowering health care costs is a top concern. When asked about possible changes that could be made to their health insurance, about half of insured adults say “paying less out-of-pocket for health care” (46%) is most important, more than twice the share who choose “eliminating prior authorization” (22%), an area that previous KFF polls have identified as the most significant pain point for health care consumers aside from costs. Fewer insured adults say getting more value out of their care (13%) or having more choice of which health care providers they can see (12%) are the most important changes they’d like to see.
Voters’ Approval of the Trump Administration and Party Preference on Health Care Issues
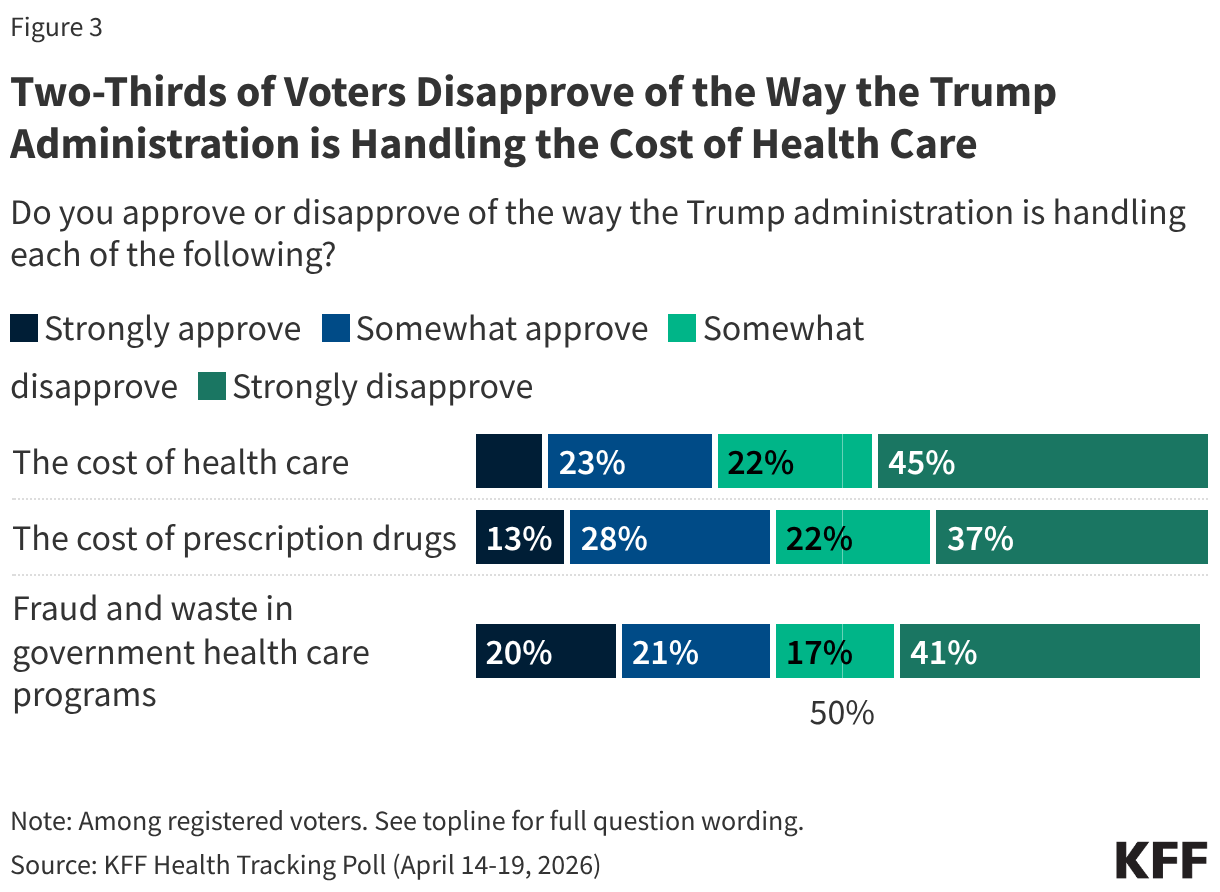
With about six months to go before the midterm elections, most voters disapprove of how the Trump administration is handling issues related to health care costs. One-third of voters (33%) approve of the administration’s handling of the cost of health care while two-thirds (67%) say they disapprove – including 45% who say they “strongly disapprove.” Several months after the unveiling of TrumpRx, about four in ten voters (41%) approve of the administration’s handling of prescription drug costs. Following a recent announcement by the Trump administration of increased efforts to crack down on health care fraud, about four in ten voters (42%) say they approve of the way the administration is handling fraud and waste in government health programs, while a majority (58%) say they disapprove.
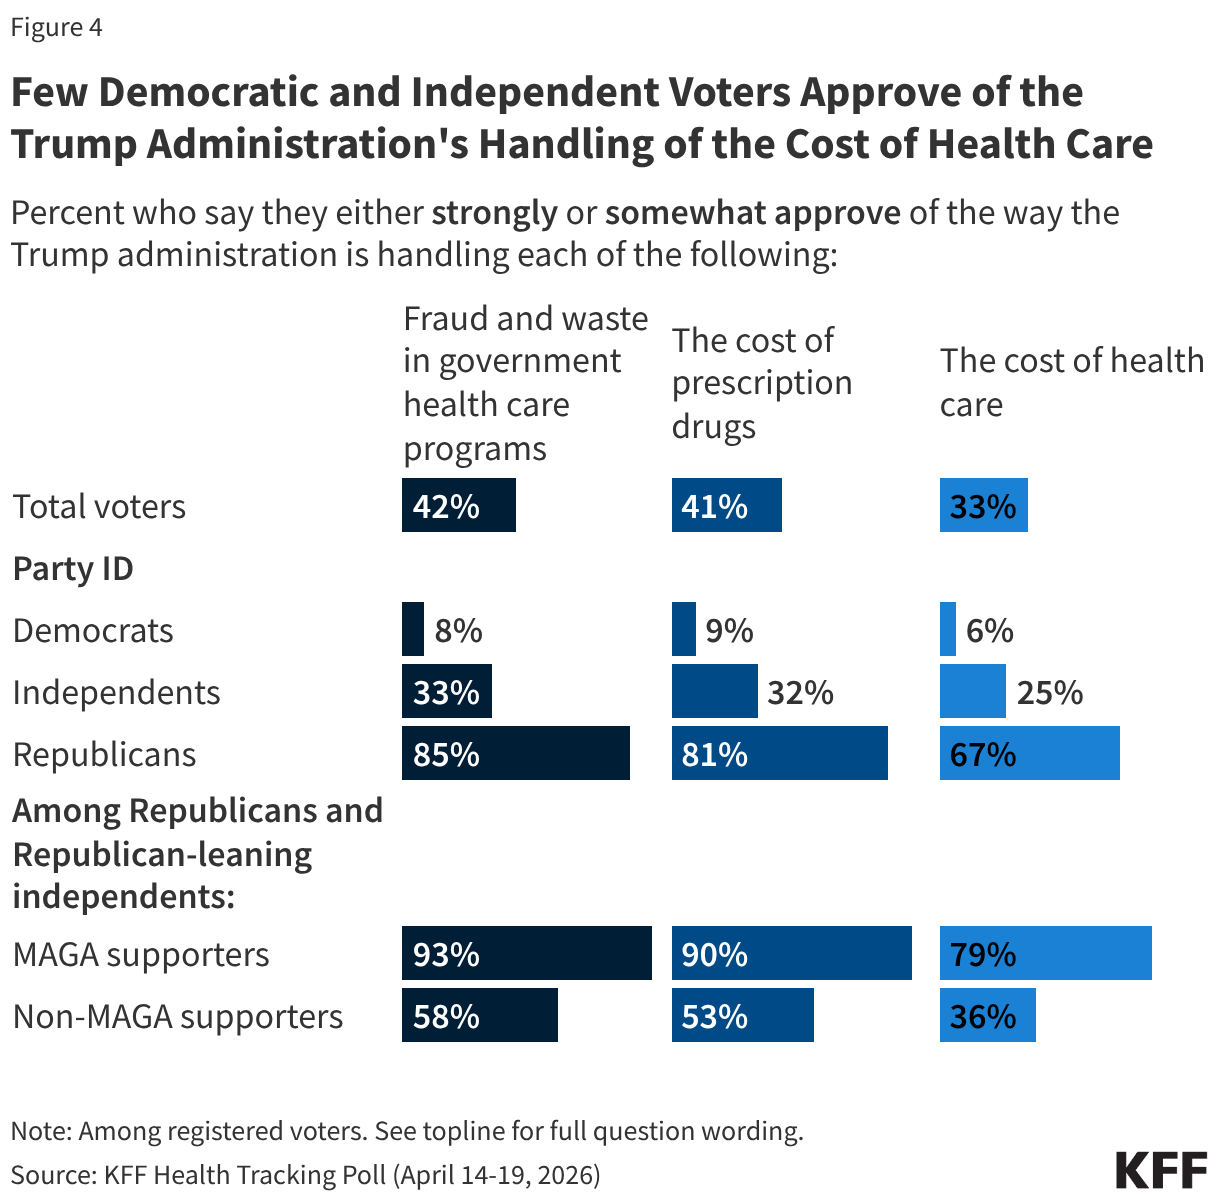
Unsurprisingly, voters are split along partisan lines with the Trump administration receiving high approval ratings from Republicans overall, and most Democrats disapproving of the administration. Among independent voters, about a third say they approve of the Trump administration’s handling of fraud and waste in government health programs (33%) and its handling of the cost of prescription drugs (32%). Fewer independents (25%) say they approve of the administration’s handling of the cost of health care.
Notably, while two-thirds of Republican voters approve of the administration’s handling of health care costs (67%), there is some nuance within the Republican coalition. Among the two-thirds of Republicans and Republican-leaning voters who identify as MAGA supporters, about eight in ten (79%) approve of the administration’s handling of health care costs. However, Republican voters who do not support the MAGA movement are less approving of the administration with just over one-third (36%) of non-MAGA Republicans approving of the administration’s actions on health costs while 64% disapprove. Additionally, non-MAGA Republicans and Republican-leaning independents are much less likely than their MAGA counterparts to say they approve of the Trump administration's handling of the cost of prescription drugs (53% vs. 90%) and their handling of fraud and waste in government health programs (58% vs. 93%).
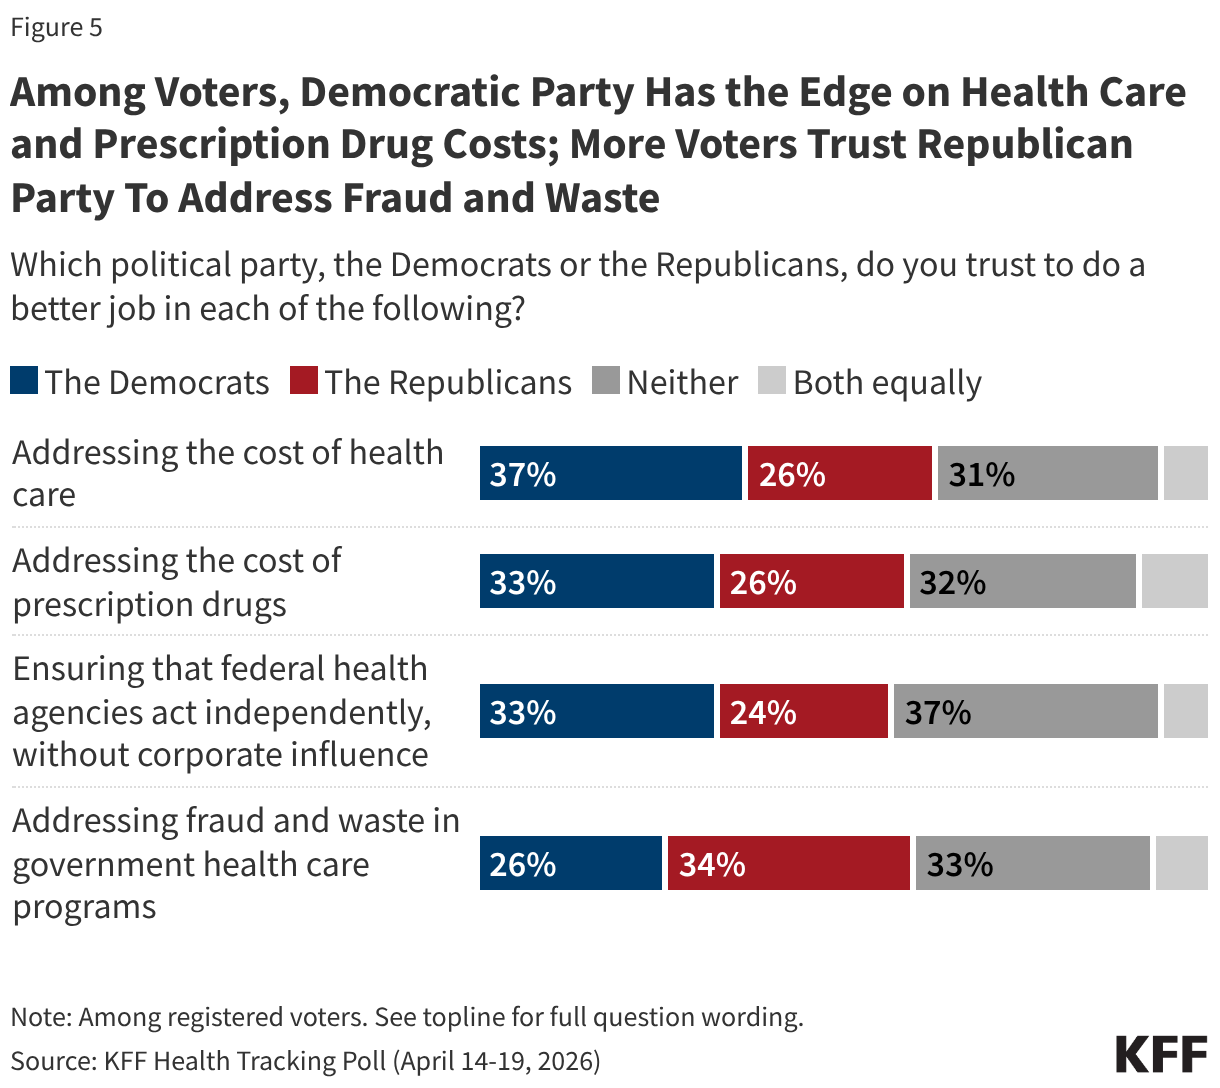
As voters evaluate congressional candidates ahead of the midterm elections, the Democratic Party has an edge over the Republican Party when it comes to addressing the cost of health care, while the Republican Party has the edge on addressing fraud and waste in government health care programs. Democrats have a double-digit advantage over Republicans when it comes to who voters trust to address the cost of health care (37% vs. 26%) and continue to hold a narrow edge among voters when it comes to addressing the cost of prescription drugs (33% vs. 26%).
Voters are more likely to trust the Republican Party (34%) than the Democratic Party (26%) when it comes to addressing fraud and waste in government health care programs, an area the Trump administration has focused heavily on recently. About one-third (33%) say they trust neither party to handle this issue.
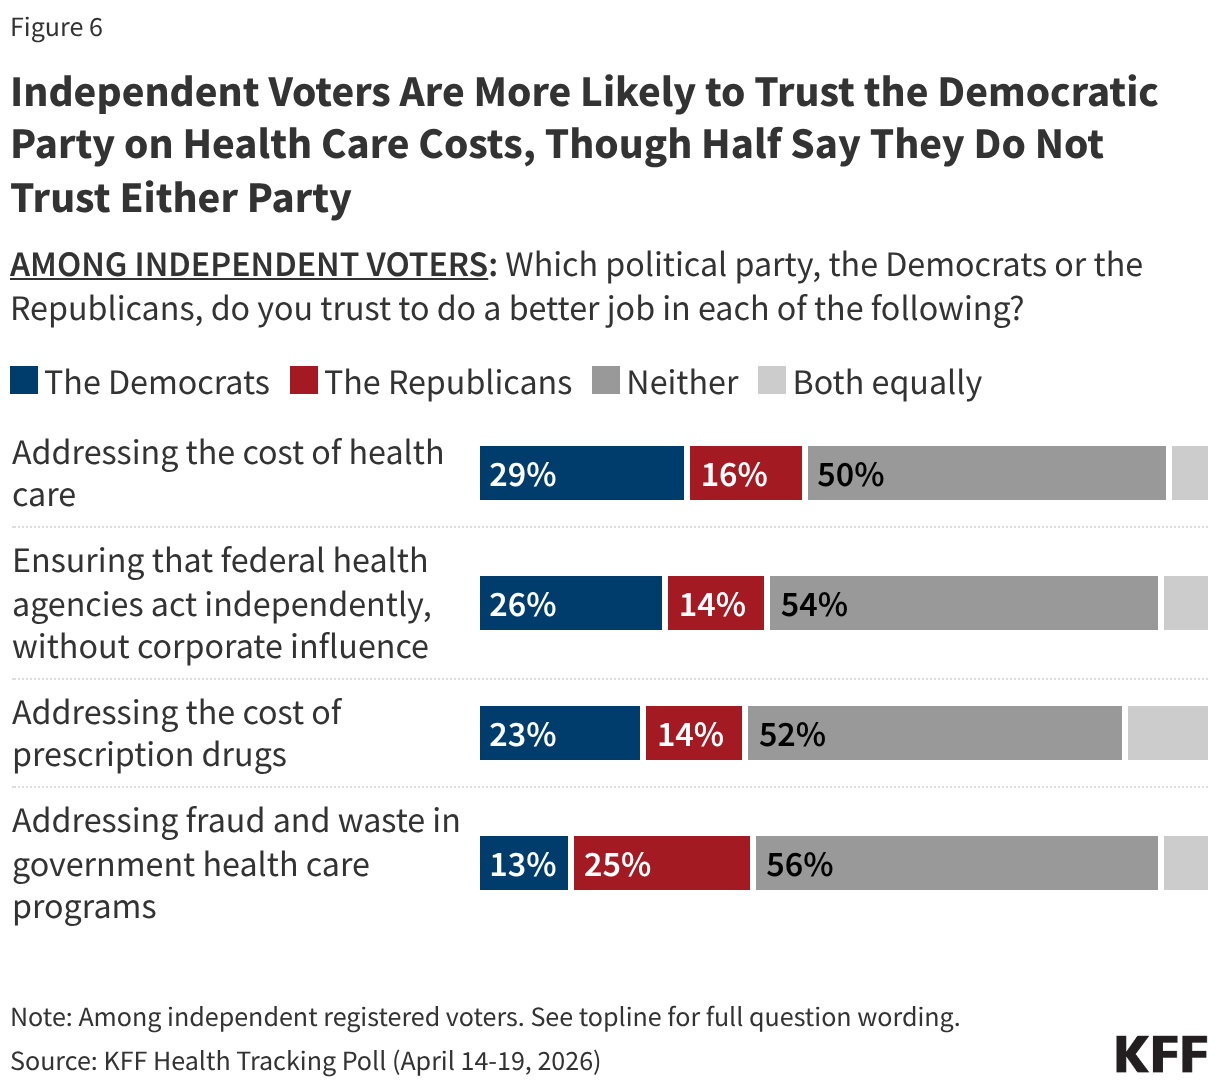
Among independent voters, the Democratic Party has a double-digit advantage over the Republican Party when it comes to addressing the cost of health care (29% vs. 16%), while the Republican Party holds the advantage when it comes to addressing fraud and waste in government health care programs (25% vs. 13%). Yet notably, at least half of independent voters say they trust neither party to address each of these issues.
In addition to ranking as a top economic concern for the public, majorities of voters say health care costs will have a “major impact” on their decision to vote (55%) and which party’s candidate they would support (61%) in the upcoming midterms. The issue of health costs is more salient for Democratic voters compared to Republicans. More than six in ten Democratic voters say the cost of health care will have a major impact on their decision to vote (64%) and which party’s candidate they support (72%). About half of Republican voters say the issue of health costs will majorly impact whether they vote (48%) and what candidate they will support (47%). About half of independent voters say the cost of health care will majorly impact their decision to vote (52%) and six in ten say this issue will majorly impact the party’s candidate they support (63%).
Methodology
This KFF Health Tracking Poll was designed and analyzed by public opinion researchers at KFF. The survey was conducted April 14 – April 19, 2026, online and by telephone among a nationally representative sample of 1,343 U.S. adults in English (n=1,251) and in Spanish (n=92). The sample includes 1,023 adults (n=81 in Spanish) reached through the SSRS Opinion Panel either online (n=999) or over the phone (n=24). The SSRS Opinion Panel is a nationally representative probability-based panel where panel members are recruited randomly in one of two ways: (a) Through invitations mailed to respondents randomly sampled from an Address-Based Sample (ABS) provided by Marketing Systems Groups (MSG) through the U.S. Postal Service’s Computerized Delivery Sequence (CDS); (b) from a dual-frame random digit dial (RDD) sample provided by MSG. For the online panel component, invitations were sent to panel members by email followed by up to three reminder emails.
Another 320 (n=11 in Spanish) adults were reached through random digit dial telephone sample of prepaid cell phone numbers obtained through MSG. Phone numbers used for the prepaid cell phone component were randomly generated from a cell phone sampling frame with disproportionate stratification aimed at reaching Hispanic and non-Hispanic Black respondents. Stratification was based on incidence of the race/ethnicity groups within each frame. Among this prepaid cell phone component, 140 were interviewed by phone and 180 were invited to the web survey via short message service (SMS).
Respondents in the prepaid cell phone sample who were interviewed by phone received a $15 incentive via a check received by mail or an electronic gift card incentive. Respondents in the prepaid cell phone sample reached via SMS received a $10 electronic gift card incentive. SSRS Opinion Panel respondents received a $5 electronic gift card incentive (some harder-to-reach groups received a $10 electronic gift card). In order to ensure data quality, cases were removed if they failed two or more quality checks: (1) attention check questions in the online version of the questionnaire, (2) had over 30% item non-response, or (3) had a length less than one quarter of the mean length by mode. Based on this criterion, no cases were removed.
The combined cell phone and panel samples were weighted to match the sample’s demographics to the national U.S. adult population using data from the Census Bureau’s 2024 Current Population Survey (CPS), September 2023 Volunteering and Civic Life Supplement data from the CPS, and the 2025 KFF Benchmarking Survey with ABS and prepaid cell phone samples. The demographic variables included in weighting for the general population sample are gender, age, education, race/ethnicity, region, civic engagement, frequency of internet use and political party identification. The weights account for differences in the probability of selection for each sample type (prepaid cell phone and panel). This includes adjustment for the sample design and geographic stratification of the cell phone sample, within household probability of selection, and the design of the panel-recruitment procedure.
The margin of sampling error including the design effect for the full sample is plus or minus 3 percentage points. Numbers of respondents and margins of sampling error for key subgroups are shown in the table below. For results based on other subgroups, the margin of sampling error may be higher. Sample sizes and margins of sampling error for other subgroups are available on request. Sampling error is only one of many potential sources of error and there may be other unmeasured error in this or any other public opinion poll. KFF public opinion and survey research is a charter member of the Transparency Initiative of the American Association for Public Opinion Research.
| Group | N (unweighted) | M.O.S.E. |
|---|---|---|
| Total | 1,343 | ± 3 percentage points |
| Registered voters | 1,107 | ± 4 percentage points |
| Party ID | ||
| Democrats | 420 | ± 6 percentage points |
| Independents | 450 | ± 6 percentage points |
| Republicans | 372 | ± 6 percentage points |