Opioid Deaths Fell in Mid-2023, But Progress Is Uneven and Future Trends are Uncertain

Authors: Heather Saunders, Nirmita Panchal, and Sasha Zitter
Published: Sep 23, 2024

Since the opioid epidemic was declared a public health emergency in 2017, it has claimed 454,464 lives, with opioid-related deaths rising by 67% between 2017 and 2023. Initially driven by prescription opioids and heroin, the epidemic has shifted in recent years, with illicit synthetic fentanyl—a substance 100 times more potent than morphine—now dominating most markets. Even a small amount of fentanyl can be lethal, and in 2023, 7 in 10 counterfeit opioid pills contained a deadly dose.

Although provisional CDC data show a decline in opioid deaths in 2023, the death toll remains much higher than just a few years ago, keeping this issue in the spotlight. Both former President Trump and Vice President Harris have records related to addressing the opioid epidemic, but they also have proposed different approaches to ongoing and future efforts to address the issue. Trump’s 2024 campaign emphasizes a stricter law enforcement strategy aimed at reducing trafficking, primarily through reinstating and tightening border policies and tougher punishment, including the death penalty for “traffickers and drug smugglers.” In contrast, the Biden-Harris administration’s multi-pronged strategy includes reducing supply, expanding harm reduction, and improving access to treatment, with Harris placing a stronger emphasis on increasing fentanyl seizures through enhanced detection technology at the border and ports. Along with the 1 in 3 adults who report in a KFF survey that they or a family member have been addicted to opioids (29%) or illegal drugs (27%), both President Biden and Vice-Presidential hopeful J.D. Vance have close family members who have experienced addiction.

This analysis examines opioid overdose deaths from the last two decades (2003-2023), with a particular focus on the decline in deaths observed in the last six months of 2023. Opioid overdose deaths include fatalities from intentional acts (suicide or homicide), unintentional acts (poisoning or drug assault), or cases of unknown intent. Regardless of other substances involved, any death with opioid involvement is classified as an opioid overdose death. According to provisional 2023 CDC WONDER data, fewer than 1% of deaths remain undetermined. Key takeaways from this analysis include the following:

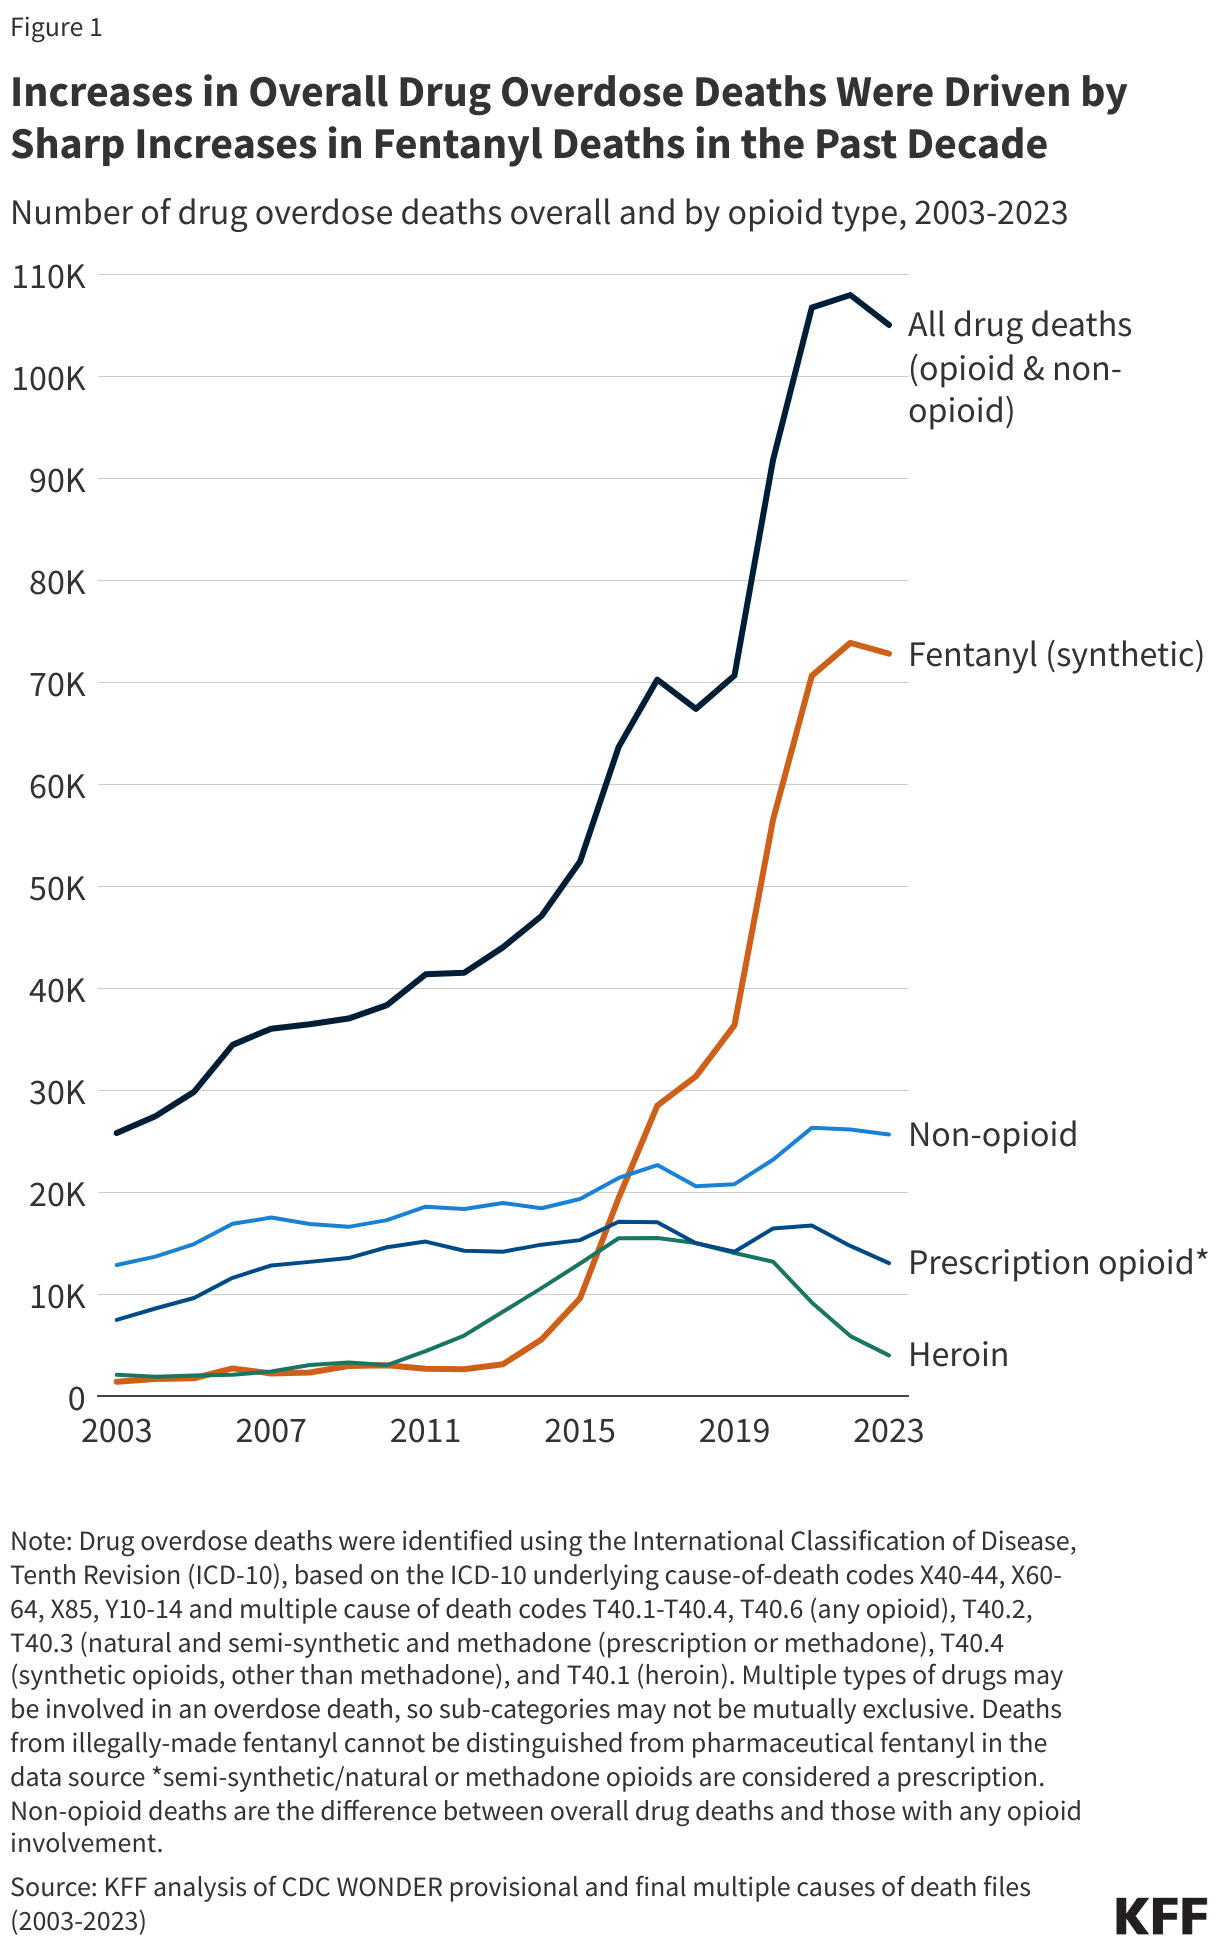
  • Fentanyl-involved opioid deaths drove rises in overall overdose deaths, by over 23-fold from 2013 to 2023, while prescription opioid deaths stayed steady and heroin deaths declined.
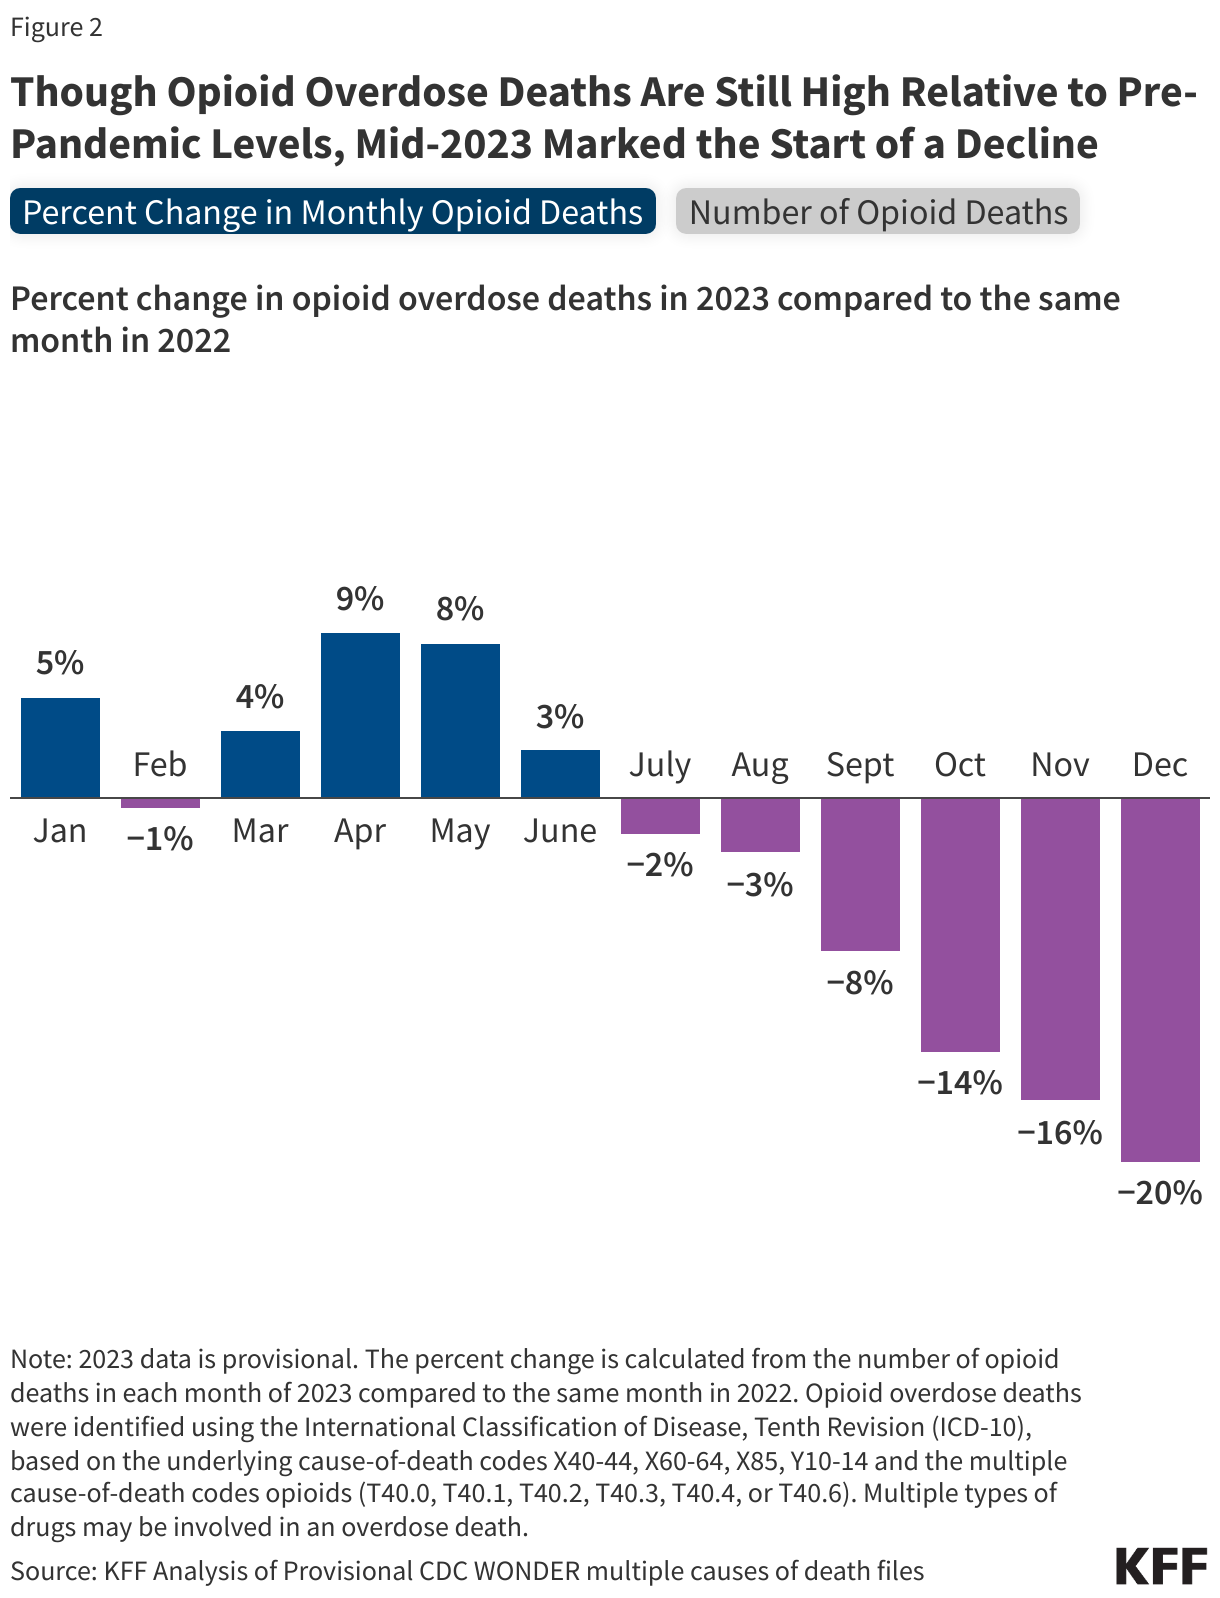
  • In the second half of 2023, opioid overdose deaths started to decline, and by December 2023, they were 20% fewer than there were in December 2022. While it is unclear how much any specific policy may have contributed to the decline, a number of policies were implemented, including those focused on reducing supply of fentanyl, increasing treatment, and improving access to harm reduction supplies—such as opioid overdose reversal medication.
  • Opioid death rates varied widely by race, ethnicity, age, and sex. In the second half of 2023, White people saw the largest decline (-14%) while declines in other racial and ethnic groups were much smaller. Opioid deaths increased for people 65+, while falling in all other age groups.
  • In 2023, opioid death rates were the highest in WV, DC, and DE (71.4, 49.9, and 47.5/100,000, respectively), while states with the lowest opioid death rates included NE, SD, and IA (4.3, 5.7, and 8.4/100,000, respectively). In three-quarters of states, opioid deaths declined in the last six months of 2023 compared to the same period in 2022.

The sharp rise in drug deaths in recent years was driven by fentanyl deaths. Fentanyl-involved opioid deaths surged more than 23-fold over the last decade, while prescription opioid deaths remained steady and heroin deaths declined. Fentanyl deaths more than doubled during the pandemic, increasing from 36,359 in 2019 to 73,838 in 2022 (Figure 1). Illicit synthetic fentanyl (referred to as fentanyl for simplicity) is inexpensive to produce and often mixed into other drug supplies, such as methamphetamine and cocaine. In addition to increases in fentanyl supply, other factors, such as pandemic-related stressors, disruptions in treatment, and other life challenges, as well as insufficient treatment infrastructure and a shortage of skilled providers, may have contributed to rises in opioid deaths.

Increases in Overall Drug Overdose Deaths Were Driven by Sharp Increases in Fentanyl Deaths in the Past Decade

In the second half of 2023, opioid overdose deaths began to decline and continued to fall through the end of the year. In July 2023, deaths were 2% lower than in July 2022, and by December, they were 20% lower compared to December 2022. Looking at 2023 alone, opioid deaths dropped from 6,928 in July to 5,841 in December, a decrease of over 1,000 deaths (Figure 2). Early provisional and partial data for the first quarter of 2024 point to a continuation of this downward trend through early 2024.

Though Opioid Overdose Deaths Are Still High Relative to Pre-Pandemic Levels, Mid-2023 Marked the Start of a Decline

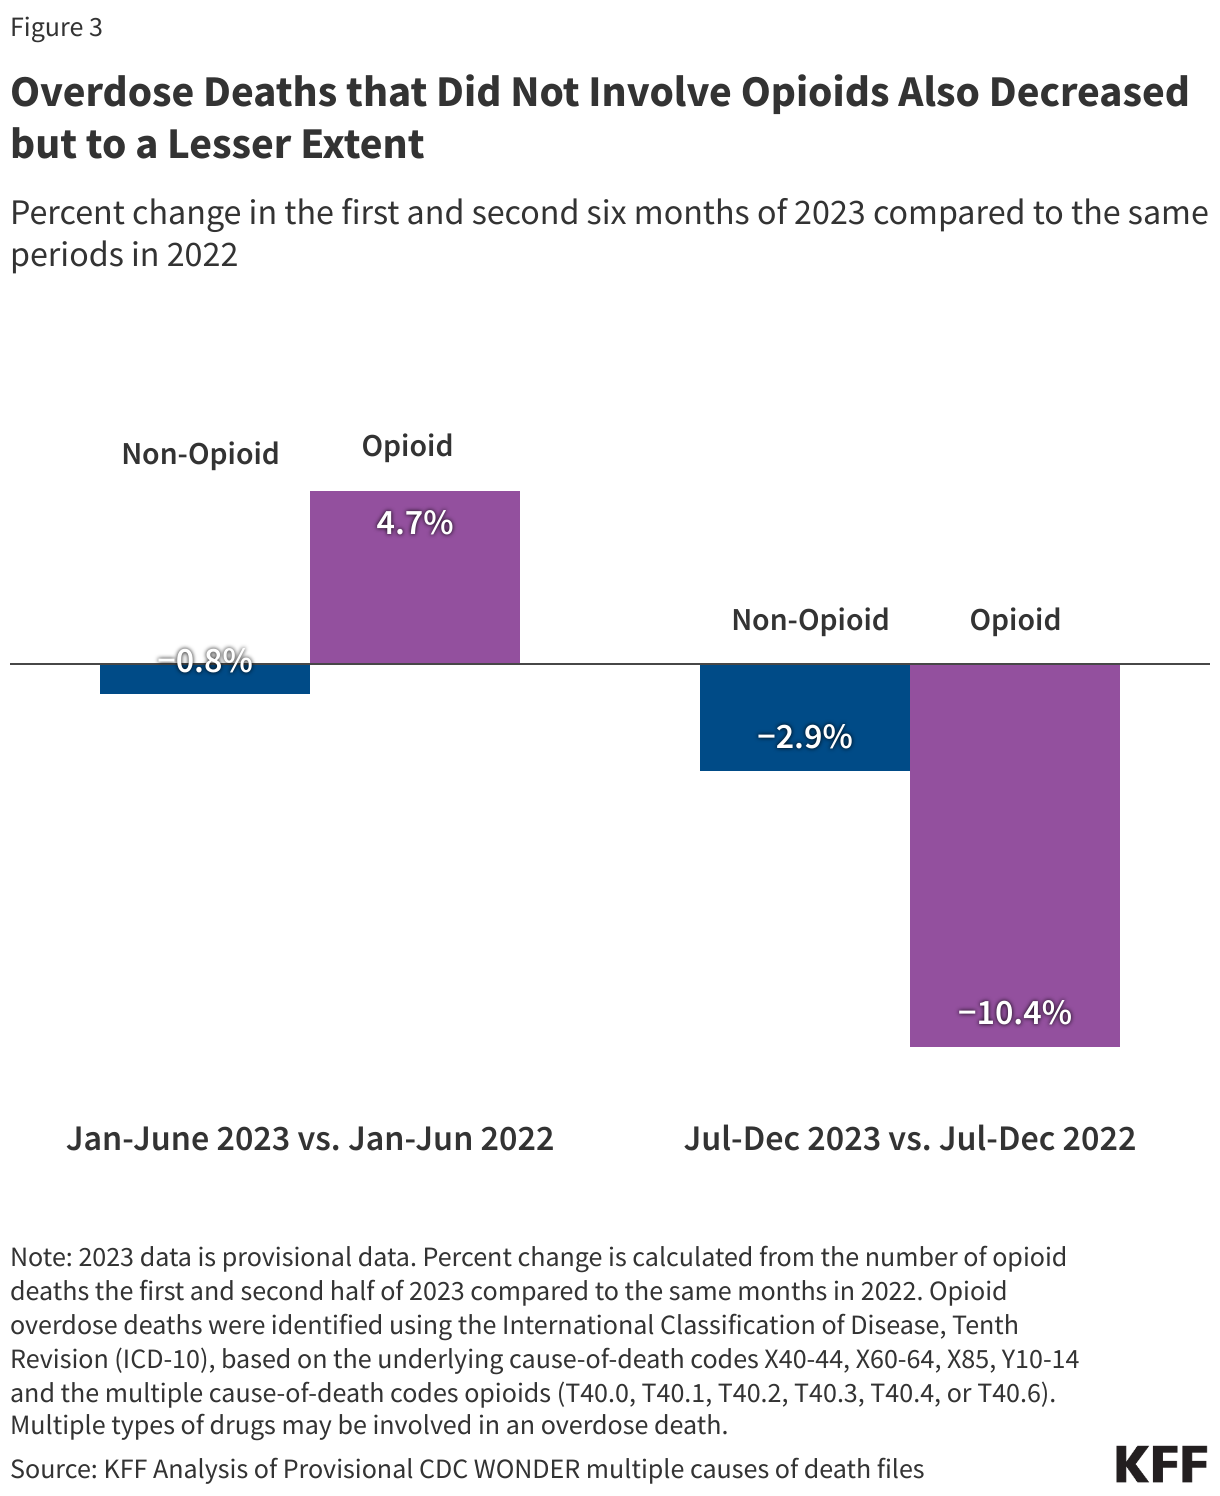
Non-opioid overdose deaths also fell in the last half of 2023 compared to the previous year, though the decline was smaller (-3% vs. -10% for opioid deaths) (Figure 3). Non-opioid deaths refer to drug overdose deaths that did not involve opioids, such as those involving only non-opioid drugs, like cocaine or methamphetamine. Non-opioid deaths account for a much smaller share, about one-third, of overall drug overdose deaths.

Overdose Deaths that Did Not Involve Opioids Also Decreased but to a Lesser Extent

While it is too early to determine if the decline in opioid overdose deaths will continue, several federal policies aimed at reducing deaths may have played a role. The Biden-Harris administration’s strategy for the opioid epidemic focuses three key areas: expanding harm reduction and public awareness, improving access to treatment and supports, and reducing the supply and spread of illicit drugs, particularly fentanyl. FDA’s approval of the first over the counter opioid overdose medication likely increased public access to the medication. Federal opioid response grants and settlement funds supported low-barrier distribution of naloxone and other harm reduction tools, like fentanyl test strips, while campaigns like the DEA’s “One Pill Can Kill,” raised public awareness of fentanyl risks. Federal policies extended or permanently relaxed in-person requirements for methadone and buprenorphine treatment. Federal investments in the broader mental health services, such as 988 and mobile crisis, may have also contributed, perhaps through connections to care. Efforts to reduce fentanyl supply are also ongoing, with increased seizures at U.S. borders and ports of entry.

How do opioid death rates vary across demographics groups?

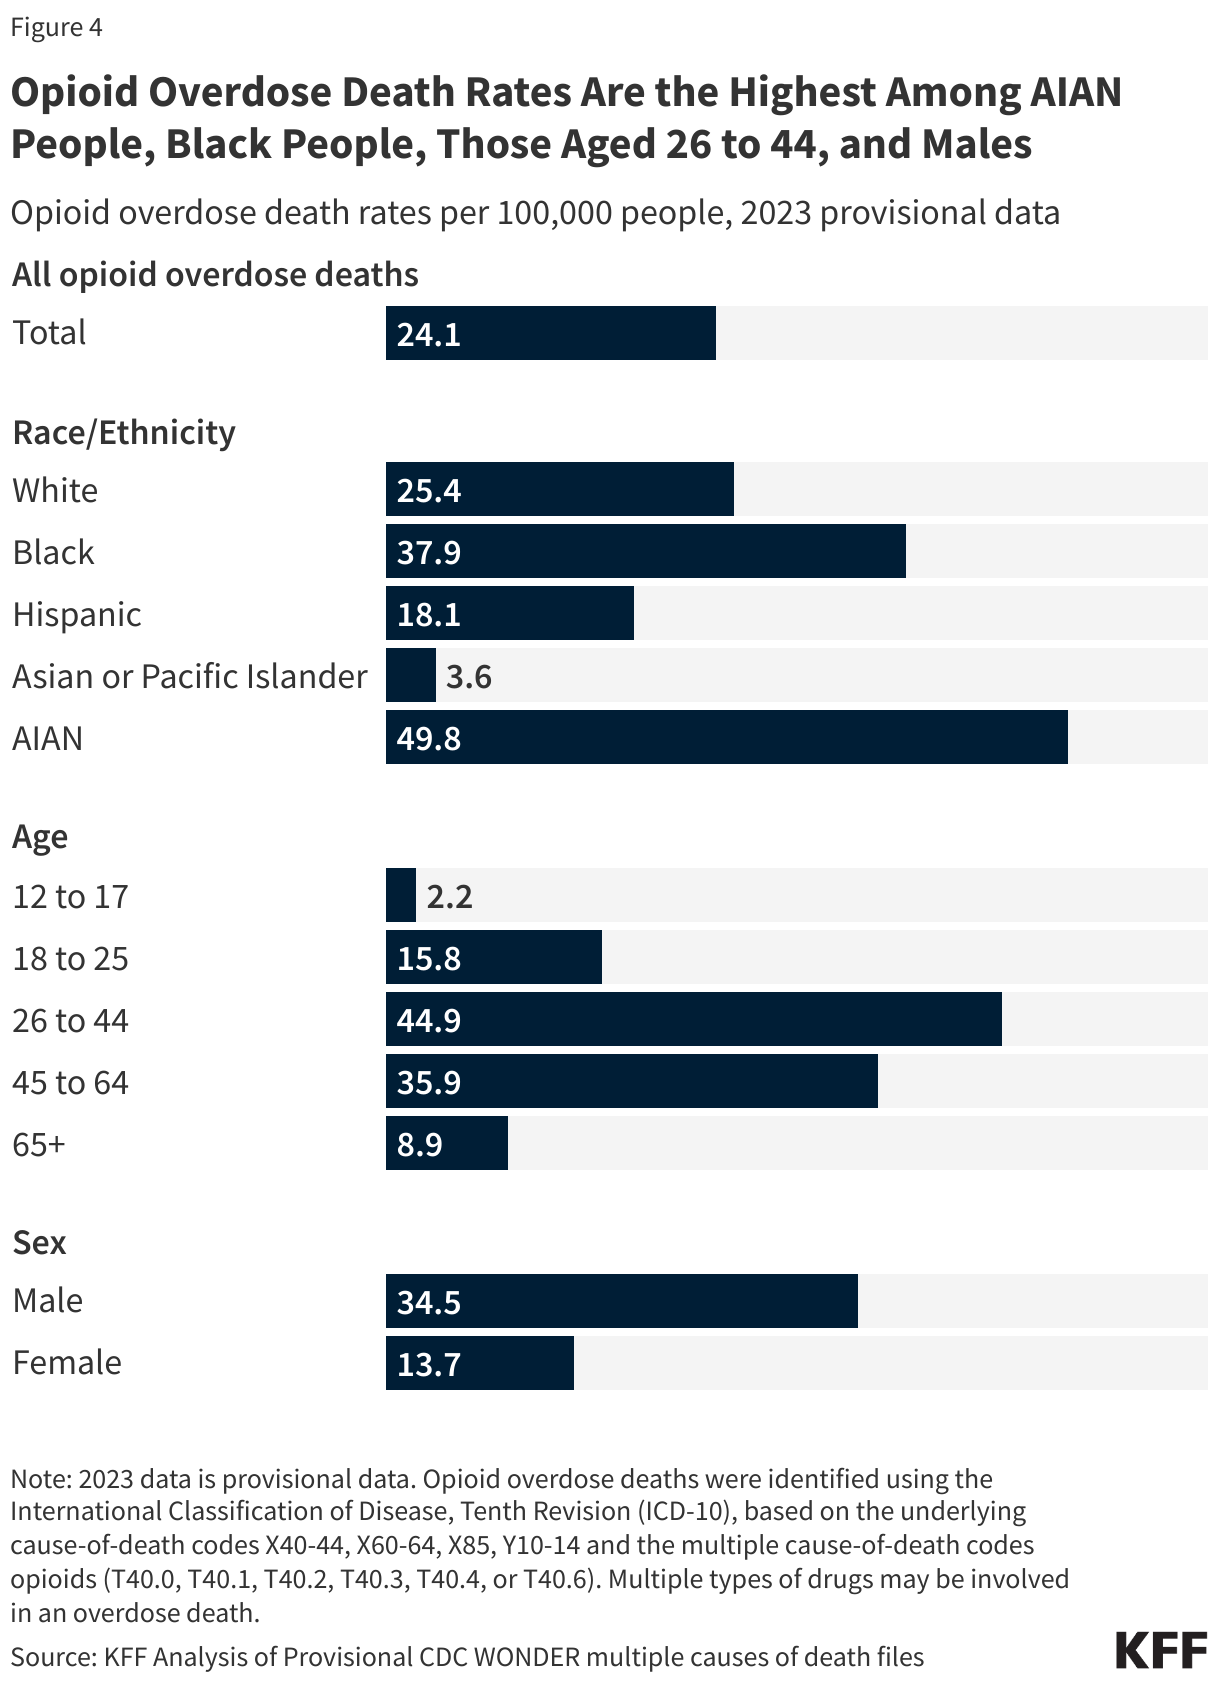
In 2023, opioid death rates were highest among American Indian/Alaska Native (AIAN) and Black people, individuals aged 26 to 44, and males (Figure 4). AIAN and Black people had the highest death rates across race and ethnicity, at 49.8 and 37.9 per 100,000, respectively. Earlier in the opioid epidemic, overdose rates were highest among White people, but this trend shifted with opioid death rates for Black people surging over 700%, compared to a 140% rise for White people in the past decade. The high rates of opioid deaths among American Indian and Alaska Native (AIAN) people mirrors broader worsening trends in behavioral health, including the highest and fastest-growing suicide and overall drug overdose rates. Among age groups, those aged 26 to 44 had the highest death rates, followed by those aged 45 to 64. Although people aged 12-17 and 65+ have lower overall rates, these groups have seen substantial increases in recent years. In 2023, opioid death rates among males were more than double those of females, with males also experiencing the largest increase over the past decade, rising 238%.

Opioid overdose death rates are the highest among AIAN people, Black people, those aged 26 to 44, and males

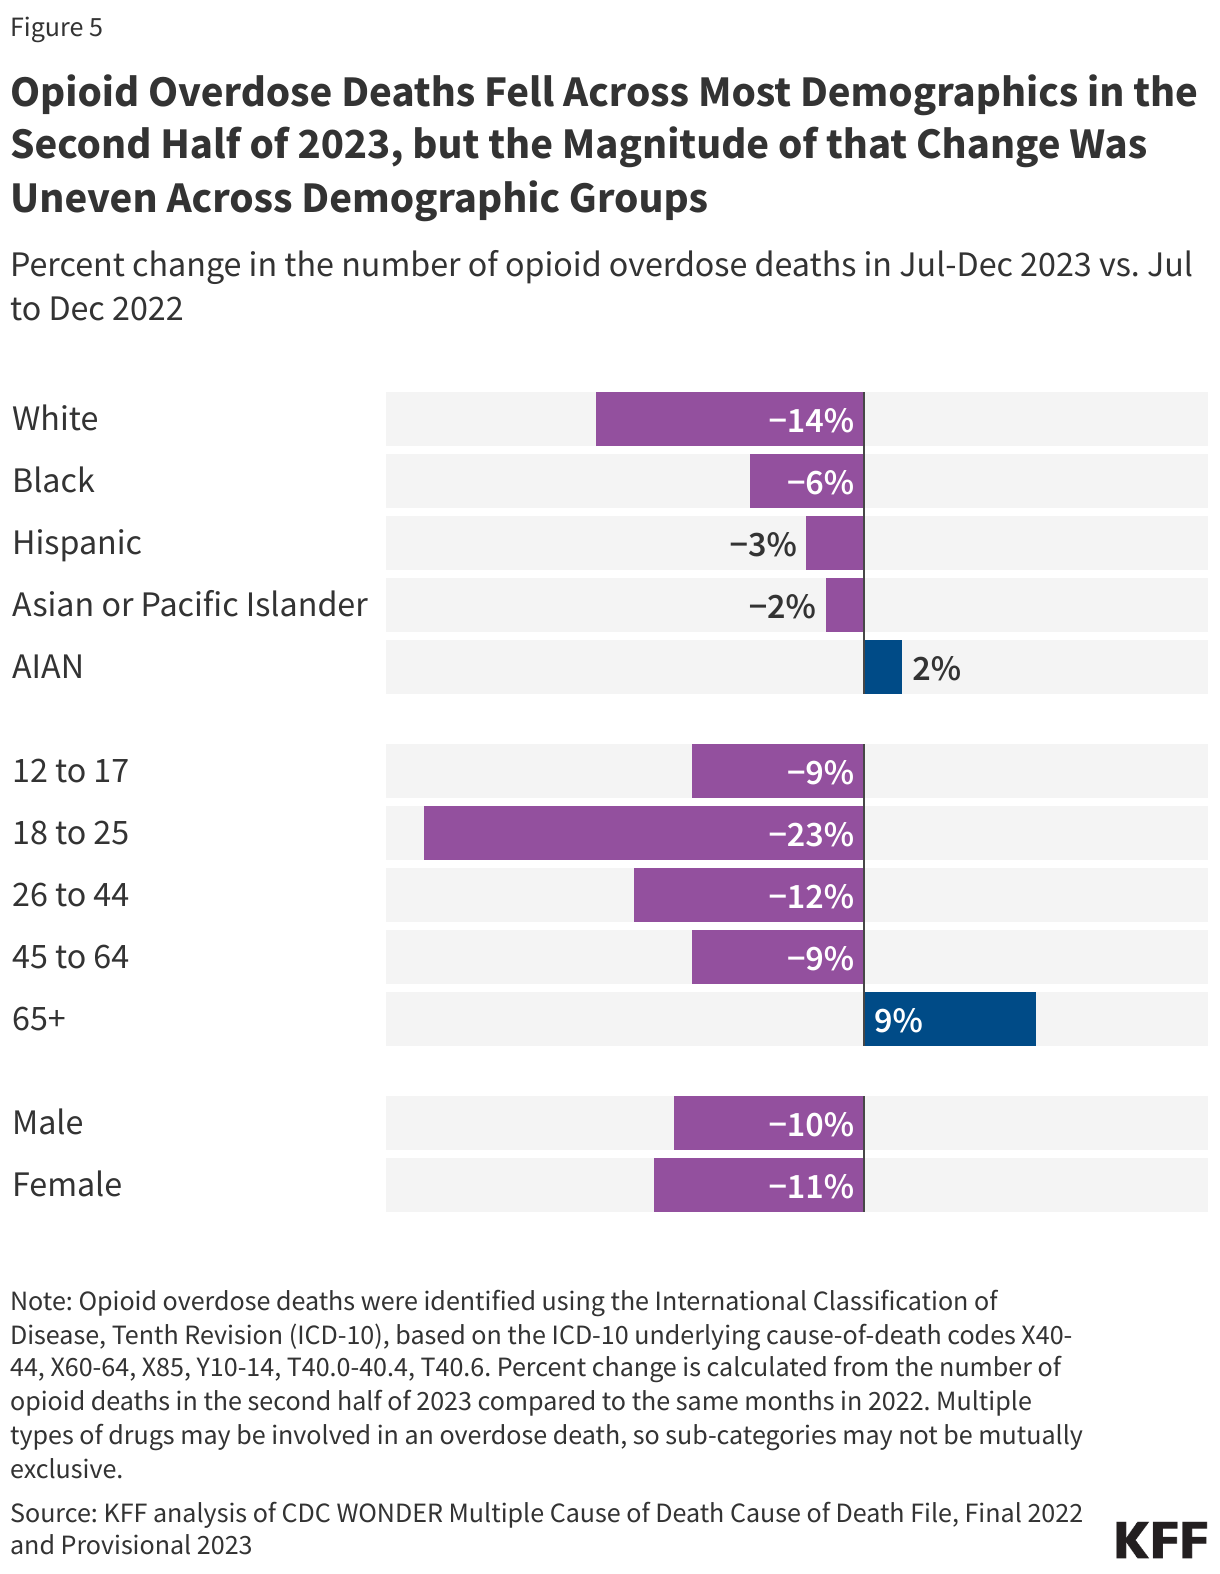
Opioid overdose deaths decreased across most racial and ethnic groups from the last 6 months of 2023 compared to the same period in 2022, but drops were greater among White people (-14%) compared to other racial and ethnic groups (-2 to -6%, Figure 5). The larger decline in these deaths among White people may reflect racial disparities in access to OUD treatment. Prior KFF analyses found that White people were more likely to have access to medications used to treat OUD compared to Black and Hispanic people. The uptake of medication treatment services is also low among AIAN people.

While opioid overdose deaths decreased for all non-elderly age groups in the last six months of 2023, they increased for elderly adults (65+). Young adults saw the largest decline (-23%) in opioid deaths from the second half of 2023 compared to the second half of 2022. The rise in overdose deaths among elderly adults (9%) during the same period may be linked to challenges in detecting and treating substance use disorder (SUD) in this group, as symptoms can be mistaken for age-related decline. When a SUD is identified, stigma, decreased social support, transportation, and physical comorbidities can complicate access to treatment services—along with few SUD treatment programs that are designed for geriatric adults. Older adults have higher rates of opioid prescriptions, but co-prescribing of overdose reversal medication is low.

Opioid Overdose Deaths Fell Across Most Demographics in the Second Half of 2023, but the Magnitude of that Change Was Uneven Across Demographic Groups

How do opioid death rates vary across states and how have they changed?

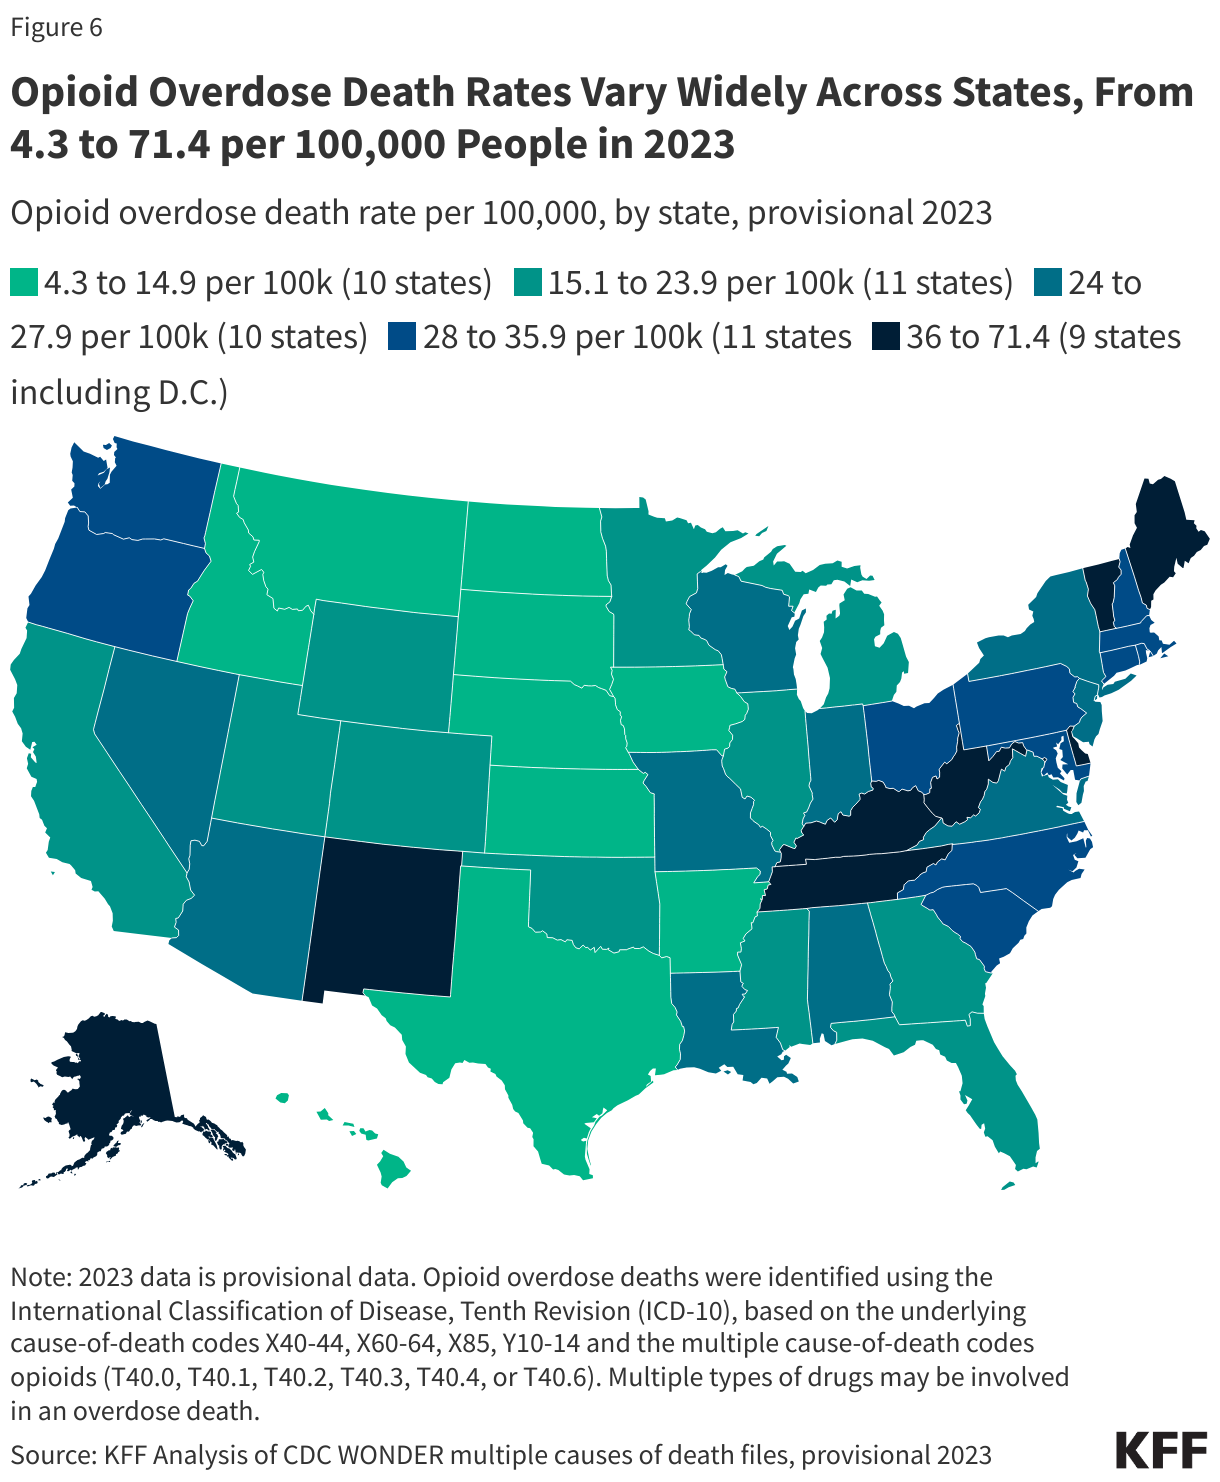
Opioid overdose death rates varied widely across states in 2023, from 4.3 per 100,000 in Nebraska to 71.4 per 100,000 in West Virginia (Figure 6). Nebraska, South Dakota, and Iowa had the lowest rates, with 4.3, 5.7, and 8.4 deaths per 100,000 people, respectively. West Virginia had the highest rate at 71.4 per 100,000—over 40% higher than the next highest rate in D.C., which was 49.9 per 100,000. The national opioid death rate was 24.1 per 100,000, with 33 states having rates within 10 deaths per 100,000 of the national death rate (Figure 5).

Opioid overdose death rates vary widely across states, from 4.3 to 71.4 per 100,000 people in 2023

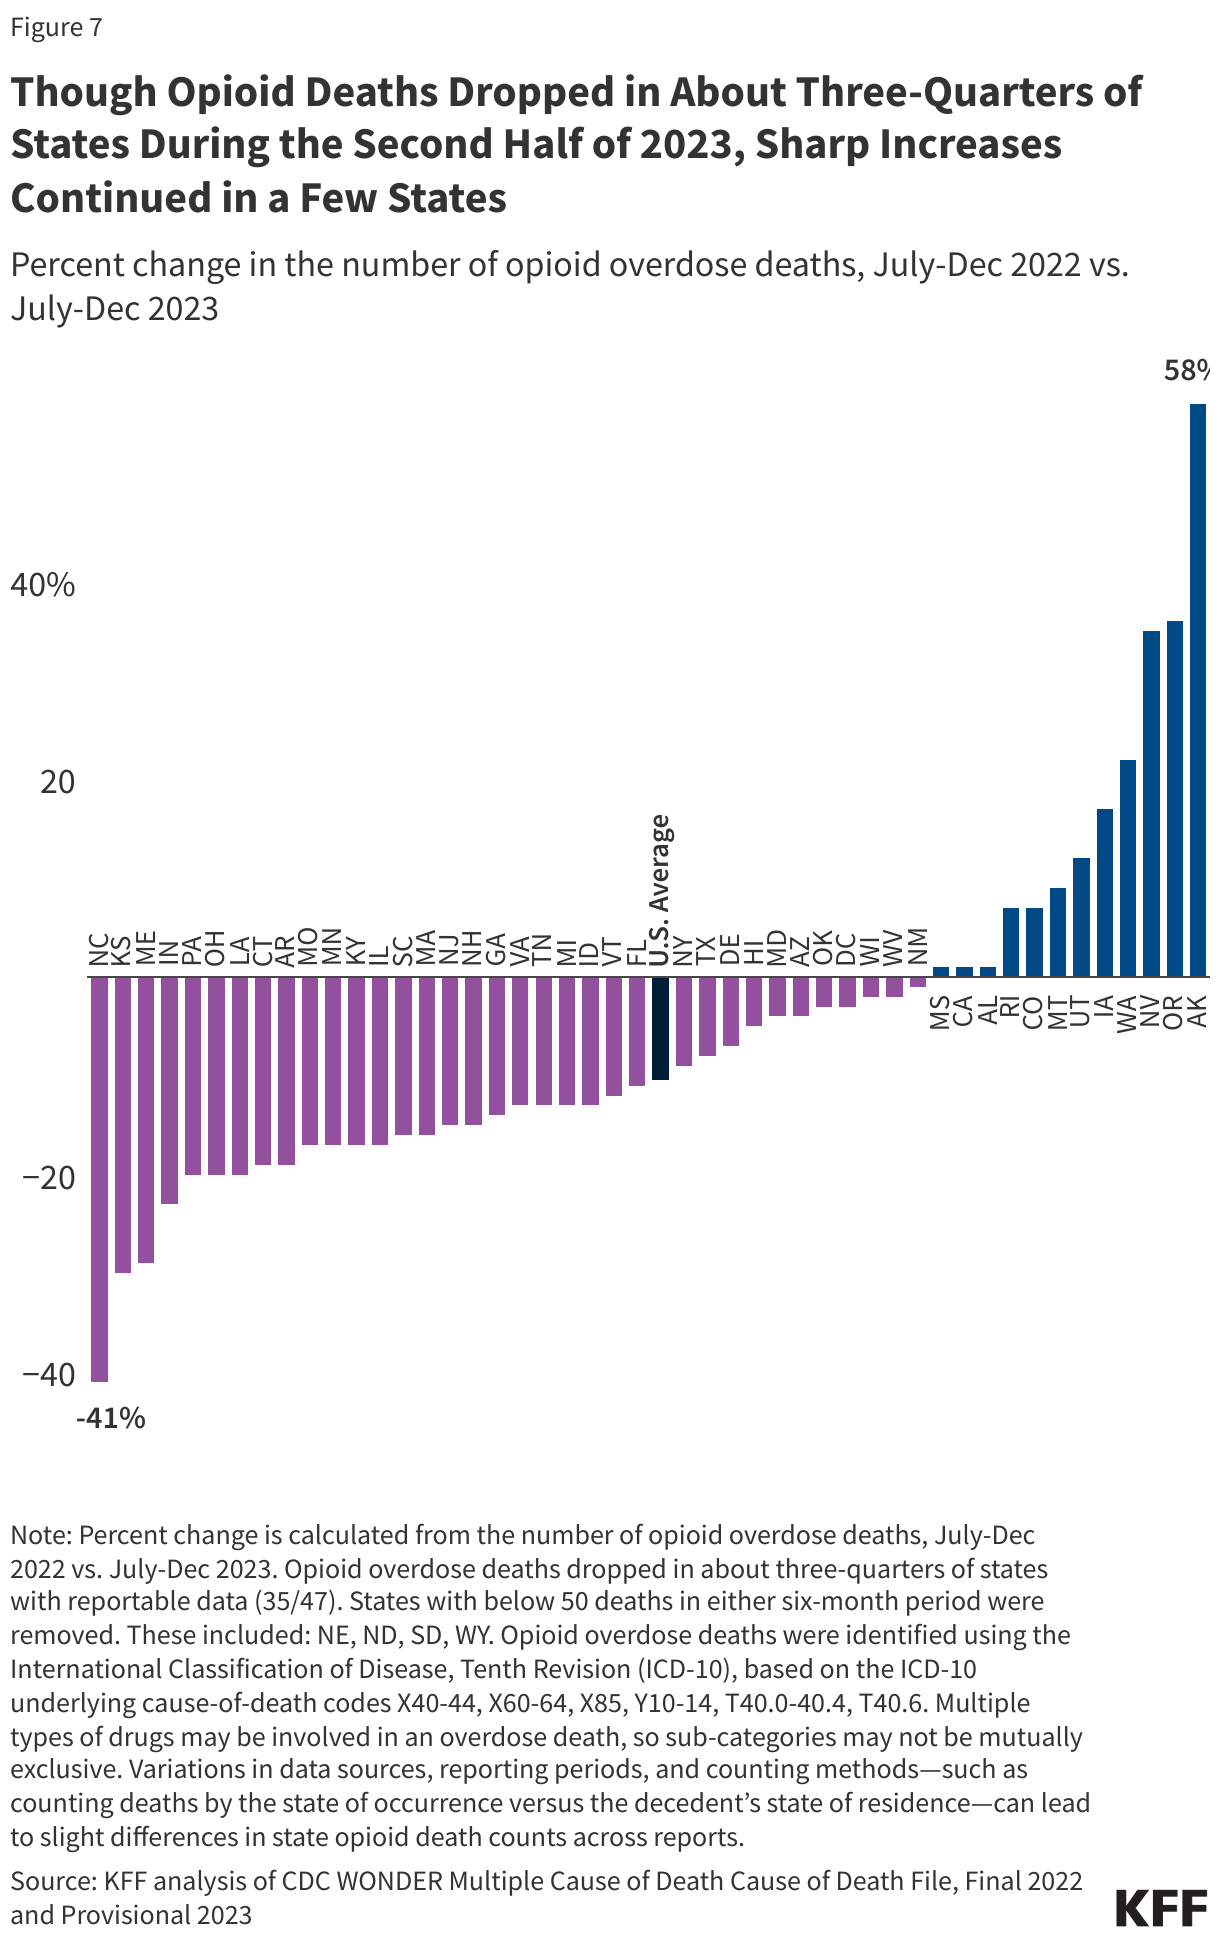
The last 6 months of 2023 brought drops in opioid deaths nationally and in about three quarters of states, compared to the same months in 2022 (Figure 7). Over this period, opioid overdose deaths decreased the most in North Carolina (-41%), remained relatively steady in New Mexico and Mississippi (-1%, +1%, respectively), and increased the most in Alaska (+58%).

Though Opioid Deaths Dropped in About Three-Quarters of States During the Second Half of 2023, Sharp Increases Continued in a Few States

States can develop their own approaches to addressing the opioid epidemic or build on federal initiatives, but state actions vary. State decisions about allocation of state opioid response grants and settlement funds for low barrier access to naloxone and other harm reduction tools, as well as efforts to ease access to treatment vary by state and may impact outcomes. Some states, like Virginia, have invested in campaigns to expand awareness about fentanyl in drug supplies, building on federal messaging campaigns like the DEA’s “One Pill Can Kill.” State decisions on Medicaid coverage and limits for certain populations and substance use services, along with whether to adopt federal opportunities that expand treatment and health coverage to high-risk groups, such as incarcerated individuals nearing release, may also influence outcomes.

A Snapshot of Sources of Coverage Among Medicare Beneficiaries

Published: Sep 23, 2024

Health care affordability has been a longstanding concern in the U.S., including among older adults, many of whom have relatively low incomes and modest assets to help pay medical bills. Medicare offers important financial protection by providing health insurance coverage to 67 million people in the U.S., including adults age 65 or older and younger adults with long-term disabilities. Coverage of Medicare benefits is provided through either traditional Medicare or Medicare Advantage private plans. Enrollment in Medicare Advantage plans has grown rapidly in recent years, partly because most Medicare Advantage plans charge no premium (other than the Part B premium) and offer extra benefits not available in traditional Medicare such as dental, vision, and hearing benefits. Most people with Medicare also have other coverage, such as Medicaid, Medigap, and employer coverage, which may pay some or all of their Medicare cost-sharing requirements and may also provide benefits that Medicare does not cover.

This brief analyzes the different types of coverage that people with Medicare have and the demographic characteristics of Medicare beneficiaries with different types of coverage, based on the Centers for Medicare & Medicaid Services Medicare Current Beneficiary Survey, 2022 Survey file data (MCBS) (the most recent year of data available, see Methods for details).

Key highlights:

  • In 2022, Medicare enrollment was split equally between Medicare Advantage and traditional Medicare. Overall, more than 4 in 10 Medicare beneficiaries (44%), including beneficiaries in traditional Medicare and Medicare Advantage, had additional coverage from an employer or union sponsored plan (24%) or Medicaid (19%).
  • Nearly 90% of people in traditional Medicare had some form of additional coverage, such as Medigap (42%), employer or union-sponsored retiree health benefits (31%), or Medicaid (16%), but 11% (three million Medicare beneficiaries) had no additional coverage.
  • More than 40% of all Medicare Advantage enrollees also had some form of coverage from Medicaid (23%) or a union/employer sponsored retiree health plan (18%) in 2022.
  • Beneficiaries in traditional Medicare with Medigap and employer-sponsored insurance had higher incomes, were in relatively good health, had more years of education, and were less likely to be under age 65 with disabilities than all traditional Medicare beneficiaries.
  • As more beneficiaries have shifted to Medicare Advantage plans, the number of Medicare beneficiaries in traditional Medicare with no additional coverage has declined from 5.6 million in 2018 to 3.2 million in 2022. Traditional Medicare beneficiaries with no supplemental coverage were more likely to be under the age of 65 and have relatively lower incomes compared to traditional Medicare beneficiaries overall.
  • Medicare Advantage enrollees were more likely to be Black or Hispanic, self-report relatively poor health, have incomes below $20,000 per person, and have lower levels of education, compared to traditional Medicare beneficiaries in 2022.
  • Dual-eligible individuals accounted for a larger number and share of Medicare Advantage enrollees (7.0 million; 23%) than traditional Medicare beneficiaries (4.6 million; 16%) in 2022. Dual-eligible individuals in both traditional Medicare and Medicare Advantage were more likely to have lower incomes, self-report relatively poor health, identify as Black or Hispanic, and be under age 65 with disabilities than the overall Medicare population. 

Sources of Coverage

Among the 59.6 million people enrolled in both Medicare Part A and Part B in 2022, enrollment was split equally between Medicare Advantage and traditional Medicare (Figure 1). Most people in traditional Medicare had some form of additional coverage, such as Medicaid, retiree health benefits through an employer or Medigap, but three million Medicare beneficiaries (5%) had no additional coverage. While Medicare Advantage enrollment has surpassed 50% of total Medicare enrollment as of 2024, MCBS data beyond 2022 is not yet available.

Nearly all People with Medicare Had Coverage Either Through Medicare Advantage Plans or Traditional Medicare Coupled with Some Other Type of Coverage in 2022

Characteristics of Medicare Beneficiaries, By Source of Coverage

Traditional Medicare

Among the 29.7 million Medicare beneficiaries in traditional Medicare in 2022, most (89%) had some type of additional coverage, either through Medigap (42%), employer coverage (31%), Medicaid (16%), or another source (1%). But 1 in 10 (11%) of Medicare beneficiaries in traditional Medicare had no additional coverage (Figure 1, Appendix Table 1). A more detailed discussion of these types of coverage and the characteristics of people in each category is below.

The Characteristics of Traditional Medicare Beneficiaries Vary Widely by Source of Additional Coverage

Medigap

Medicare supplement insurance, also known as Medigap, covered 2 in 10 (21%) Medicare beneficiaries overall, or 42% of those in traditional Medicare (12.5 million beneficiaries) in 2022. Medigap policies, sold by private insurance companies, fully or partially cover Medicare Part A and Part B cost-sharing requirements, including deductibles, copayments, and coinsurance. Medigap limits the financial exposure of Medicare beneficiaries and provides protection against catastrophic medical expenses. For example, a previous KFF report found that a smaller share of traditional Medicare with additional sources of coverage, such as Medigap, reported cost-related problems than Medicare Advantage enrollees or traditional Medicare beneficiaries without additional coverage. However, Medigap premiums can be costly for beneficiaries living on modest incomes and can rise with age, among other factors, depending on the state in which they are regulated.

Compared to all traditional Medicare beneficiaries in 2022, beneficiaries with Medigap were more likely to be White, have higher annual incomes (above $20,000 per person), self-report excellent, very good, or good health, and have a bachelor’s degree or higher (Figure 2, Appendix Table 1).

In contrast, a smaller share of traditional Medicare beneficiaries under age 65 have a Medigap policy than traditional Medicare beneficiaries ages 65 and older (2% versus 11%). Federal law provides a 6-month guarantee issue protection for adults ages 65 and older when they first enroll in Medicare Part B if they want to purchase a supplemental Medigap policy, but these protections do not extend to adults under the age of 65, who qualify for Medicare due to having a long-term disability. Most states do not require insurers to issue Medigap policies to beneficiaries under age 65, and most do not extend guarantee issue protections to people over age 65 beyond the one-time Medigap open enrollment period.

Employer Coverage

In total, 14.5 million Medicare beneficiaries – a quarter (24%) of Medicare beneficiaries overall – also had some form of employer or union-sponsored health insurance coverage in 2022 in addition to Medicare Part A and Part B. Of this total, 9.1 million beneficiaries had employer coverage in addition to traditional Medicare (31% of beneficiaries in traditional Medicare), while 5.4 million beneficiaries were enrolled in Medicare Advantage employer group plans (see Medicare Advantage section below; estimates do not sum to total due to rounding). People with both Medicare Part A and Part B and employer- or union-sponsored coverage are likely to be retirees for whom Medicare is primary.

Compared to traditional Medicare beneficiaries overall in 2022, beneficiaries with employer or union-sponsored coverage in addition to traditional Medicare were more likely to have higher incomes ($40,000 or greater per person), a bachelor’s degree or higher, self-report excellent or good health, have no limitations in activities of daily living (ADLs), and were less likely to be under age 65 (Figure 2, Appendix Table 1).

Separately, in 2022, an estimated 5.6 million Medicare beneficiaries had Part A only, a group that primarily includes people who were active workers (either themselves or their spouses) and had primary coverage from an employer plan and Medicare as a secondary payer. People with Part A only cannot enroll in a Medicare Advantage plan, so people with coverage through Medicare Advantage employer group plans are likely to be retired.

Medicaid

Medicaid, the federal-state program that provides health and long-term services and supports coverage to low-income people, was a source of supplemental coverage for 11.6 million Medicare beneficiaries with low incomes and modest assets in 2022, or 19% of all Medicare beneficiaries. A larger number of Medicare beneficiaries with Medicaid (known as dual-eligible individuals) were enrolled in a Medicare Advantage plan (7.0 million) than in traditional Medicare (4.6 million people) (see Medicare Advantage section below) (Appendix Table 1). For these beneficiaries, Medicaid typically pays the Medicare Part B premium and may also pay a portion of Medicare deductibles and other cost-sharing requirements. Most dual-eligible individuals are also eligible for full Medicaid benefits, including long-term services and supports. Dual-eligible individuals who are not eligible for full Medicaid benefits receive partial benefits, including assistance with Medicare premiums and, in many but not all cases, Medicare cost-sharing requirements.

Compared to traditional Medicare beneficiaries overall in 2022, dual-eligible individuals were more likely to have low incomes and relatively low education levels, self-report fair or poor health, identify as Black or Hispanic, and be under the age of 65 (Figure 2, Appendix Table 1).

(Estimates of the number of dual-eligible beneficiaries in this analysis may differ from other KFF estimates due to different data sources and methods used; see methods below for details.)

No additional coverage

In 2022, more than 3 million Medicare beneficiaries overall (5%) – 11% of all beneficiaries in traditional Medicare – had no other insurance coverage. Traditional Medicare beneficiaries with no additional coverage are fully exposed to Medicare’s cost-sharing requirements, which would mean paying a $1,632 deductible for a hospital stay in 2024, daily copayments for extended hospital and skilled nursing facility stays, and a $240 deductible plus 20% coinsurance for physician visits and other outpatient services. (These costs are in addition to $174.70 per month (around $2,000 per year) for the standard Part B premium for all of 2024). Beneficiaries in traditional Medicare without additional coverage also face the risk of high annual out-of-pocket costs because there is no cap on out-of-pocket spending for Part A and B services in traditional Medicare, unlike in Medicare Advantage plans.

Beneficiaries in traditional Medicare without any form of additional coverage were more likely to have low and modest incomes (between $10,000 and $40,000 per person) compared to all traditional Medicare beneficiaries in 2022, and include a relatively large share of people on Medicare with disabilities who are under the age of 65 (Figure 2, Appendix Table 1). Medicare beneficiaries with annual incomes between $10,000 and $40,000 per person have limited ability to afford Medigap premiums and are unlikely to qualify for Medicaid because their income and assets are not low enough to meet eligibility guidelines. Further, because they are more likely to self-report fair or poor health than beneficiaries with incomes of $40,000 or more, they may be more likely to have higher out-of-pocket expenses, further exacerbated by the lack of an out-of-pocket limit in traditional Medicare.

The number and share of traditional Medicare beneficiaries without any form of supplemental coverage has steadily declined in recent years. Between 2018 and 2022, the number of traditional Medicare beneficiaries without supplemental coverage declined from 5.6 million beneficiaries (10% of the total Medicare population, or 17% of those in traditional Medicare) to 3.2 million (5% of the total Medicare population, or 11% of those in traditional Medicare). This decline likely reflects the increase in Medicare Advantage enrollment over time, which has increased from 20 million in 2018 to 33 million in 2024.

Medicare Advantage

In 2022, Medicare Advantage covered half of all Medicare beneficiaries (50%), or 29.9 million people with Medicare. (Medicare Advantage enrollment in 2024 now totals 33 million, or 54% of all eligible beneficiaries.)

Of the total number of Medicare Advantage enrollees in 2022, most (59%) were enrolled in plans available to all Medicare beneficiaries, but 5.4 million (18%) were enrolled in employer- or union-sponsored group plans. Under these arrangements, employers or unions contract with an insurer and Medicare pays the insurer a fixed amount per enrollee to provide benefits covered by Medicare. A growing share of large employers with retiree health obligations are offering these benefits through Medicare Advantage plans.

Another 7.0 million Medicare Advantage enrollees in 2022 (23%) also had Medicaid coverage, and were enrolled in either a Special Needs Plan (SNP) or a Medicare Advantage plan generally available to all Medicare beneficiaries. SNPs restrict enrollment to specific types of beneficiaries with significant or relatively specialized care needs, including beneficiaries dually eligible for Medicare and Medicaid (D-SNPs), people with severe chronic or disabling conditions (C-SNPs), and beneficiaries requiring a nursing home or institutional level of care (I-SNPs).

Compared to traditional Medicare beneficiaries in 2022, Medicare Advantage enrollees were more likely to be Black or Hispanic, have incomes below $20,000 per person, live in urban areas, and have lower levels of education (Figure 3, Appendix Table 1). In addition, dual-eligible individuals account for a larger share of Medicare Advantage enrollees (23%) than traditional Medicare beneficiaries (16%).

Medicare Advantage Enrollees Were More Likely Than Those in Traditional Medicare To Be Black or Hispanic, Low-Income, Have Relatively Low Levels of Education, and Reside in Urban Areas

Methods

This analysis is based on the Centers for Medicare & Medicaid Services Medicare Current Beneficiary Survey (MCBS) 2022 Survey file data (the most recent year available), a nationally representative survey of Medicare beneficiaries. Sources of coverage are determined based on the source of coverage held for the most months of Medicare enrollment in 2022. The analysis includes 59.6 million people with Medicare in 2022 (weighted), including beneficiaries living in the community and in facilities, excluding beneficiaries who were enrolled in Part A only or Part B only for most of their Medicare enrollment in 2022 (weighted n=5.0 million) and beneficiaries who had Medicare as a secondary payer (weighted n=1.6 million). The analysis also focuses only on coverage for Part A and Part B benefits, not Part D. This analysis of the MCBS accounted for the complex sampling design of the survey.

The number of beneficiaries enrolled in both Medicare and Medicaid (or dual-eligible individuals) (11.6 million) in this brief does not align with other KFF estimates due to differences in data sources and methods used. The KFF estimates published elsewhere are based on a 100% sample of data from the Chronic Condition Warehouse (CCW) and include dual-eligible individuals with at least one month of enrollment in Medicare Part A or Part B. The analysis in this brief is based on the MCBS because this data source provides a wider array of demographic and health status indicators than CCW. This analysis excludes beneficiaries in Part A or Part B only and assigns beneficiaries to the type of coverage held for the most months of the year.

All reported differences in the text are statistically significant; results from all statistical tests are reported with p<0.05 considered statistically significant. Because estimates reported in the text and figures are rounded to the nearest whole number, some estimates may not sum to overall totals due to rounding.

Sources of Coverage Among Medicare Beneficiaries, 2022

Key Facts on Health Care Use and Costs Among Immigrants

Published: Sep 23, 2024

Immigrant adults are a diverse population who make up 16% of adults in the United States and play a significant role in the nation’s workforce and communities. Leading up to the 2024 election, there has been an increase in anti-immigrant rhetoric and immigration has been a central talking point for candidates. The Trump campaign has repeatedly described immigrants as a source of crime, a burden for taxpayers, and a drain on government programs like Medicare and Social Security. The Harris campaign has also focused on immigration, emphasizing her tough on crime stance as a former attorney general of a border state, while also highlighting her family’s immigrant roots. Some states have also taken restrictive actions focused on immigrants, including requiring hospitals to collect patient immigration status.

Amid this rhetoric and these recent state actions, data on immigrants’ health care use and costs as well as their contributions to the economy and workforce, including in the health care sector, can be informative. This brief provides key data on these topics drawing on KFF analysis across a range of data sources, including the KFF/LA Times Survey of Immigrants, the largest nationally representative survey of immigrants conducted to date, and other research.

Immigrants are not more likely than U.S.-born citizens to report using government assistance for food, housing, or health care, and undocumented immigrants remain ineligible for federally funded assistance.

The 2023 KFF/LA Times Survey of Immigrants shows that, despite having lower household incomes and facing financial challenges, immigrant adults are no more likely than U.S.-born adults to say that they or someone living with them received government assistance with food, housing, or health care in the past year. Overall, about a quarter (28%) of both immigrant adults and U.S.-born citizen adults say they received this type of assistance in the past 12 months (Figure 1).

Lawfully present immigrants face eligibility restrictions for federal programs, including Medicaid and the Children’s Health Insurance Program (CHIP). In general, lawfully present immigrants must have a “qualified status” to be eligible for Medicaid or CHIP, and many, including most lawful permanent residents or “green card” holders, must wait five years after obtaining qualified status before they may enroll even if they meet other eligibility requirements. Some lawfully present immigrants, such as refugees and asylees, are exempt from the five-year waiting period. States can also expand coverage to lawfully residing immigrant pregnant people and children without a five year wait. Lawfully present immigrants can purchase Affordable Care Act (ACA) Marketplace coverage and receive tax credits to offset the cost of that coverage without a five-year wait. Lawfully present immigrants can also qualify for Medicare but must have sufficient work history. If they do not have this work history, they can purchase Medicare Part A after residing legally in the U.S. for five years continuously.

Undocumented immigrants are not eligible to enroll in federally funded coverage including Medicaid, CHIP, or Medicare, or to purchase coverage through the ACA Marketplaces. Medicaid payments for emergency services may be made to hospitals or other providers on behalf of individuals who are otherwise eligible for Medicaid but for their immigration status. Emergency conditions include those that place an individuals’ health in serious jeopardy or cause serious bodily impairment or dysfunction, although states have discretion to determine what services can be reimbursed through Emergency Medicaid.

Some states have established fully state-funded programs to provide coverage to immigrants regardless of immigration status, although they vary in eligibility and scope of benefits provided. Research suggests that expanding health coverage for immigrants can reduce uninsurance rates, increase health care use, lower costs, and improve health outcomes.

Similar Shares of Immigrant and U.S.-Born Adults Say They Have Received Government Assistance with Food, Housing, or Health Care in the Past Year

Immigrants, particularly those who are undocumented, use less health care, including emergency room care, than people born in the U.S.

Overall, research shows that immigrants, including lawfully present and undocumented immigrants, use less health care than U.S.-born citizens. Moreover, the KFF/LA Times Survey of Immigrants shows that among immigrant adults, likely undocumented immigrants are less likely than lawfully present immigrants and naturalized citizens to report seeking or receiving care in the U.S. or having a health care visit in the past year. About six in ten (63%) likely undocumented immigrant adults report a health care visit in the past year compared with 74% of lawfully present immigrant adults and 82% of naturalized citizen adults.

Lower use of health care among immigrants likely reflects a combination of them being younger and healthier than their U.S.-born counterparts as well as them facing increased barriers to care, including language access challenges, confusion, and immigration-related fears. Prior KFF analysis found that Trump-era policies amplified these fears and contributed to greater reluctance to access care.

Likely Undocumented Immigrant Adults are Significantly Less Likely to Receive Health Care Services Than Naturalized Citizens and Lawfully Present Immigrants

Immigrants have lower health care costs than U.S.- born people.

Reflecting their lower use of health care, immigrants have lower health care expenditures than their U.S.-born counterparts. KFF analysis of 2021 medical expenditure data shows that, on average, annual per capita health care expenditures for immigrants are about two-thirds those of U.S.-born citizens ($4,875 vs. $7,277) (Figure 3). This reflects lower spending for most types of health care, including office-based visits, prescription drugs, inpatient care, outpatient care, and dental care. These findings are consistent with other research which shows that immigrants’ overall health expenditures are one-half to two-thirds of those of U.S.-born individuals, regardless of status, and that per capita expenditures from private and public insurance sources are lower for immigrants, particularly for undocumented immigrants. For example, one study found that undocumented immigrants are more likely to be uninsured and have significantly lower health care expenditures than U.S.-born individuals per year, and that despite differences in the likelihood of being uninsured, there are no significant differences in rates of uncompensated care between undocumented immigrants and U.S.-born individuals.

Immigrants Have Two-Thirds the Per Capita Health Care Expenditures of U.S.-Born People

Immigrants contribute to the economy through their role in the workforce and tax payments, with research showing that they help subsidize health care for U.S.- born people and stabilize Medicare and Social Security.

Immigrants support the nation’s workforce by filling unmet labor market needs, and research suggests that they do not take jobs away from U.S.-born people. They play a disproportionate role filling jobs in essential industries such as construction and agriculture that are at increased risk of adverse health outcomes and injuries, including climate-related health hazards. In addition, immigrants as well as the adult children of immigrants play outsized roles in the health care workforce as physicians, surgeons, nurses, and long-term care workers (Figure 4). As health care workforce shortages are projected to continue and the U.S. 65 and older population grows, immigrants could help mitigate these shortages.

Analysis shows that undocumented immigrants contribute billions in federal, state, and local taxes each year. It is estimated that more than a third of their tax dollars are payroll taxes that fund programs they cannot access, including Social Security, Medicare, and the federal share of unemployment insurance. Research further finds that immigrants pay more into the health care system through taxes and health insurance premiums than they utilize, helping to subsidize health care for U.S.-born citizens. Earlier research found that without the contributions undocumented immigrants make to the Medicare Trust Fund, it would reach insolvency earlier, and that undocumented immigrants result in a net positive effect on the financial status of Social Security.

Immigrants and Adult Children of Immigrants Play an Outsized Role in the Health Care Workforce

North Carolina’s Effort to Relieve Medical Debt

Published: Sep 20, 2024

On July 26, 2024, CMS approved North Carolina’s plan to incentivize hospitals with enhanced Medicaid payments to relieve up to $4 billion in existing medical debt for nearly 2 million people and to implement policies designed to prevent future medical debt. The state aims to improve the health and well-being of North Carolinians while supporting the financial sustainability of its hospitals. Many people face difficulties affording medical care and prescription drugs in the U.S., even those with insurance. Four in ten U.S. adults have debt due to medical bills. People with disabilities or in worse health, people with lower incomes, and people who are uninsured are more likely to have medical debt. A KFF poll suggests that people with medical debt are more likely to delay or skip needed care to avoid incurring more debt, cut back on other basic household expenses, take money out of retirement or college savings, or increase credit card debt. People with medical debt are also more likely to have other forms of financial distress. In September 2024, the Census Bureau released poverty measure estimates for 2023, including changes in poverty after accounting for certain “elements” (e.g., certain federal assistance or certain expenses). Among the elements included, “medical expenses” had the greatest effect on increasing the number of people in poverty in 2023—by an estimated 7.4 million.

Vice President Harris has supported efforts to address medical debt. In June 2024, Harris announced a proposal to remove medical debt from most credit reports and to prohibit lenders from using medical debt information to make credit eligibility determinations. Under the Biden-Harris administration, state and local governments have leveraged economic relief funds (from the American Rescue Plan Act) to cancel an estimated $7 billion in medical debt for up to nearly 3 million Americans. Building on these efforts, Harris has proposed to work with states to cancel medical debt for millions of Americans and to help them avoid accumulating medical debt in the future if she is elected president. This policy watch examines medical debt in North Carolina and the state’s new plan to leverage the state Medicaid program to address medical debt.

What is the burden of medical debt in North Carolina?

North Carolina was among the states with the highest reported share of adults (13.4%) with medical debt (2019-2021, pre- Medicaid expansion). The share of adults with medical debt varies considerably across the U.S. The national annual average (2019-2021) was 8.6%. The share of adults with medical debt is likely higher in the South because 7 states in the South (of 16) have not adopted the ACA Medicaid expansion, and the region has higher uninsured rates compared to other regions. In December 2023, North Carolina became the latest state to implement the expansion, reducing the number of low-income uninsured people without access to Medicaid.

According to KFF Health News reporting, many hospitals engage in aggressive collection practices that can have significant financial consequences for patients. However, little is known about hospital debt collection practices across the country and the medical debt carried by their patients. A 2023 report from Duke University and the North Carolina Office of State Treasurer found North Carolina hospitals sued thousands of patients from January 2017 through June 2022, generating millions of dollars in judgments for hospitals. Interest charges and other additional fees accounted for about a third of the total judgments against patients. Patients who had been sued by North Carolina hospitals described in interviews financial stress from the lawsuits, negative impacts on their physical health, and fear of seeking future health care.

How is North Carolina leveraging the state’s Medicaid program to provide medical debt relief?

The state is using its Medicaid program to incentivize hospitals to relieve medical debt for eligible North Carolinians and to prevent the accumulation of medical debt going forward. States are generally prohibited from directing how Medicaid managed care plans pay providers; however, states may implement certain “state directed payments” that require plans to adopt minimum or maximum provider payment fee schedules or provide uniform dollar or percentage increases (above negotiated base payment rates) to network providers (also see Box 1). When North Carolina implemented the ACA Medicaid expansion in 2023, the state also began the Healthcare Access and Stabilization Program (HASP), a state directed payment program for hospitals, as part of a broader strategy to support access to care for low-income North Carolinians. To incentivize hospitals to relieve medical debt (and prevent the future accumulation of debt), the state amended “HASP” to increase hospital state directed payments (to average commercial rates) for inpatient and outpatient hospital services for hospitals that agree to certain conditions (see Table 1). All of North Carolina’s eligible hospitals (99 hospitals) have committed to participating in the debt relief program (as of August 2024), which the state estimates may relieve up to $4 billion in existing medical debt for nearly 2 million low- and middle-income North Carolinians.

North Carolina’s Medical Debt Relief Policies

Box 1: State Directed Payments

States are generally prohibited from directing how a managed care plan pays its providers except for certain “state directed payments” that have been approved and reviewed by CMS.

State directed payments include:

  • minimum or maximum provider payment fee schedules (e.g., tied to Medicaid FFS rates),
  • uniform dollar or percentage increases (i.e., payment above negotiated base payment rates), and
  • value-based payment arrangements.

State directed payments must be based on utilization and delivery of services covered under the managed care plan contract and must be reflected in capitation rate development and certification.

Most directed payments and directed payment spending are for uniform rate increases, most commonly for hospitals.

New managed care rules establish a payment ceiling for certain state directed payments. Provider payment levels for directed payments for hospital services, nursing facility services, and professional services at academic medical centers may not exceed the average commercial rate.

Recent reports indicate state directed payments have been a major factor in Medicaid expenditure growth in recent years, and the recently revised CBO Medicaid spending projections for 2025-2034 reflect a 4% (or $267 billion) increase, attributing half of the increase to expected growth in directed payments in Medicaid managed care.

News Release

As Medicaid Unwinding Concludes in Most States, KFF Finds 25 Million Lost Medicaid Coverage but Enrollment is 10 Million Higher Than Pre-Pandemic Levels

Despite increases in Medicaid/CHIP enrollment overall in most states, 12 states saw child enrollment fall

Published: Sep 18, 2024

Over 25 million people were disenrolled from Medicaid and over 56 million had their coverage renewed, according to KFF’s analysis of the outcomes of the Medicaid unwinding, which nearly all states have now completed.Despite these millions of disenrollments, 10 million more people are currently enrolled in Medicaid and the Children’s Health Insurance Program (CHIP) nationally than at the start of the pandemic. Most states ended the unwinding with higher total Medicaid and CHIP enrollment than they began with in February 2020, including seven states where enrollment levels were at least 30% higher.During the COVID-19 pandemic, states kept people continuously enrolled in Medicaid in exchange for enhanced federal funding, leading to record growth in Medicaid enrollment. After the continuous enrollment policy ended on March 31, 2023 and under the process referred to as “unwinding,” states were required to complete eligibility renewals for all Medicaid enrollees.There have always been people eligible for Medicaid but not enrolled, as well as people who get dropped from Medicaid for failing to complete regular renewal processes. During the unwinding period, many states took steps to improve their renewal systems, leading to fewer people getting dropped even though they remain eligible. Five states — Missouri, Nebraska, North Carolina, Oklahoma, and South Dakota – have also adopted Medicaid expansion since the onset of the pandemic, and several states expanded eligibility for other groups, including children. The net effect is that Medicaid enrollment is higher than it was before the pandemic.However, enrollment among children has nearly returned to pre-pandemic levels (at only five percent higher.) Twelve states saw drops in child enrollment and three states saw enrollment fall for both children and adults relative to pre-pandemic levels.

Because Medicaid eligibility levels are more generous for children, these drops in child enrollment – coupled with an increase in the 2023 child uninsured rate – suggest some children may have lost coverage despite being eligible.Overall, 31% of people whose Medicaid coverage was redetermined during the unwinding were disenrolled, with wide differences across states. Five states had disenrollment rates of more than 50% (Montana, Utah, Idaho, Oklahoma, and Texas), while five states had rates under 20% (North Carolina, Maine, Oregon, California, and Connecticut).

This analysis marks the end of KFF’s independent effort to monitor the Medicaid unwinding using state and federal data. Going forward, the KFF Medicaid Enrollment and Unwinding Tracker will use data from the Centers for Medicare and Medicaid Services to track monthly Medicaid enrollment.

An Examination of Medicaid Renewal Outcomes and Enrollment Changes at the End of the Unwinding

Authors: Jennifer Tolbert and Bradley Corallo
Published: Sep 18, 2024

In April 2023, states began the process of unwinding the Medicaid continuous enrollment provision, a pandemic-era policy that protected Medicaid coverage for millions of enrollees. During the unwinding, states redetermined eligibility for everyone on the program and disenrolled those who were no longer eligible or who did not complete the renewal process. Before the start of the coronavirus pandemic in February 2020, there were 71 million people enrolled in Medicaid and CHIP. After the three-year pause in disenrollments, that number grew to a record high of 94 million people by April 2023, the month after the end of continuous enrollment. From the outset of the unwinding, there were major questions related to how many people would be disenrolled versus retain coverage and how that would affect overall Medicaid enrollment. Now that nearly all states have completed the unwinding of the Medicaid continuous enrollment provision, it is possible to take stock of overall renewal outcomes as well as where Medicaid enrollment stands and how current enrollment compares to pre-pandemic levels, nationally and across states. The Medicaid and CHIP enrollment data show more recent changes in enrollment that are not reflected in national survey data that report the overall uninsured rate in 2023 did not change from 2022, although there was an increase in the uninsured rate for children in 2023.

Using data from the KFF Medicaid Enrollment and Unwinding Tracker, this analysis reports data on unwinding renewal outcomes through June 2024 and examines Medicaid enrollment changes from February 2020 through May 2024, the most recent federal enrollment data available, nationally and across states. While the available data provide a nearly complete picture of renewals and disenrollments during the unwinding period, some data are preliminary with cases still pending in some states. These data mark the end of KFF’s independent effort to use state and federal data to monitor the Medicaid unwinding. Going forward, KFF will continue to track monthly Medicaid enrollment data reported by the Centers for Medicare and Medicaid Services (CMS).

Key Takeaways

  • During the unwinding of the Medicaid continuous enrollment provision, over 25 million people were disenrolled and over 56 million had their coverage renewed. Overall, 31% of people whose coverage was redetermined during the unwinding were disenrolled, but that share ranged widely across states. For example, five states—Montana, Utah, Idaho, Oklahoma, and Texas—have disenrollment rates over 50%, while five states—North Carolina, Maine, Oregon, California, and Connecticut—have disenrollment rates under 20%.
  • Despite millions of disenrollments during the unwinding, nationally, nearly 10 million more people are currently enrolled in Medicaid/CHIP than at the start of the pandemic. While enrollment among adults is over 20% higher than in February 2020, child enrollment has nearly returned to pre-pandemic levels and is only 5% higher.
  • Several factors likely explain the net growth in Medicaid enrollment. The pandemic may have encouraged some people who were previously eligible for Medicaid but not enrolled to newly enroll, and during the unwinding, many states took steps to improve their renewal processes to reduce the number of people who were disenrolled despite remaining eligible. In addition, several states expanded eligibility for certain groups, including five states that adopted Medicaid expansion since the onset of the pandemic.
  • Similar to the national trend, Medicaid/CHIP enrollment in most states is higher than it was in February 2020; however, total Medicaid/CHIP enrollment has fallen below pre-pandemic enrollment in three states, Montana, Colorado, and Arkansas, and child enrollment is lower in 12 states.

A look back on both the period of continuous enrollment and the unwinding period provides numerous potential lessons for Medicaid policy:

The growth in Medicaid enrollment during the pandemic demonstrated that continuous enrollment can stabilize coverage by reducing churn in the program that occurs when eligible people are disenrolled and then reenroll within a short period of time. Beginning January 2024, states are required to provide 12 months of continuous eligibility for children (previously 12-month continuous eligibility for children was optional for states). Many states are expanding on that policy to provide multi-year continuous eligibility for young children, and in some cases, two-year eligibility for older children and adults even though these policies will likely increase state and federal Medicaid spending.

At the same time, providing continuous coverage increases spending and results in people being enrolled who are not necessarily eligible based on their current circumstances. Federal Medicaid spending increased with rising enrollment during the pandemic, but enhanced federal matching payments to states stabilized state Medicaid costs despite large gains in enrollment.

In addition, streamlining renewal policies and procedures, particularly increasing ex parte or automated renewal rates, can improve coverage retention, but eligibility system capacity and functionality also plays a role.

And, finally, having timely and reliable data on renewal outcomes and enrollment enables closer monitoring of state Medicaid programs to identify problems but also to inform the strategies and flexibilities that can help states improve their processes. In May, CMS extended monthly reporting of renewal outcomes data required during the unwinding period to allow for continued monitoring of state programs.

Renewal Outcomes During the Unwinding

At the end of the unwinding of the Medicaid continuous enrollment provision in most states, over 56 million people had their coverage renewed and over 25 million people have been disenrolled (Figure 1). Although some cases remain pending across states, the overall disenrollment rate during the unwinding was 31%. This rate is somewhat higher than KFF and other groups had estimated before the unwinding began and contributed to more people being disenrolled during the unwinding than had been predicted. Among those who were disenrolled, 69% were terminated for paperwork or procedural reasons. Despite efforts by states to reduce the procedural disenrollment rate by conducting additional outreach or pausing disenrollments altogether, the rate remained high throughout the unwinding. In a more positive development, among those who retained coverage, over six in ten (61%) were renewed through ex parte, or automated processes. These automated renewals reduce the paperwork burden on both enrollees and state workers and make it easier for eligible individuals to retain coverage.

There is significant variation in renewal outcome metrics across states (Figure 1). For example, five states—Montana, Utah, Idaho, Oklahoma, and Texas—have disenrollment rates over 50%, with Montana the highest at 57%, while five states—North Carolina, Maine, Oregon, California, and Connecticut—have disenrollment rates under 20%. The differences result from a variety of factors, including state renewal policies and procedures, system capacity, and the extent to which states adopted flexibilities designed to maintain coverage for eligible enrollees. The share of renewals completed on an ex parte basis may also play a role. The ex parte renewal rates range from a high of 90% or more in Arizona, North Carolina, and Rhode Island to a low of 11% or less in Pennsylvania and Texas.

The Share of People Who Were Disenrolled from Medicaid or had Coverage Renewed During the Unwinding

As of May 2024, 81 million people were enrolled in Medicaid, an increase of about 10 million compared to pre-pandemic enrollment (Figure 2). During the pandemic, Medicaid enrollment increased by 32% or 23 million people. Since the start of the unwinding, enrollment has dropped by about 13 million, wiping out over half of the pandemic-era enrollment gains. As a result, enrollment remains about 13% higher than it was before the start of the pandemic.

Total Medicaid/CHIP Enrollment, February 2020 through May 2024

Adult enrollment in Medicaid/CHIP remains well above pre-pandemic enrollment; however, enrollment among children has nearly returned to pre-pandemic levels. While adult enrollment is still over 20% above enrollment in February 2020, child enrollment is only about 5% higher. Adults experienced much higher enrollment growth during the pandemic than children. From February 2020 to April 2023, enrollment among adults grew by 45% while child enrollment increased by a more modest 20%. With the downturn in the economy in the early months of the pandemic, more adults enrolled in Medicaid and then were not disenrolled even if their circumstances subsequently changed. Additionally, several states adopted Medicaid expansion, increasing eligibility for adults, either just before or during the pandemic, including Utah and Nebraska in 2020, Missouri and Oklahoma in 2021, and North Carolina and South Dakota in 2023. Although the rate of enrollment decline has been steeper for adults during the unwinding period compared to children, enrollment gains for adults remain higher than those for children.

Cumulative Percent Change in Medicaid/CHIP Enrollment Since February 2020, Among Children and Adults

During the unwinding, Medicaid/CHIP enrollment declined in all but two states—North Carolina and Oregon (Figure 4). While enrollment dropped about 14% nationally from March 2023 to May 2024, across states where enrollment declined, the drop varied widely from 2% in Maine to over 30% in Montana, Utah and Colorado. In most states, the net decrease in enrollment was higher for adults than children, but, in general, states with the largest net decline in enrollment for adults also experienced the largest net decline in child enrollment.

Cumulative Percent Change in Total Medicaid/CHIP Enrollment from March 2023 through May 2024

Compared to pre-pandemic levels, total Medicaid/CHIP enrollment remains higher in all but four states, and in seven states enrollment is 30% or more higher (Figure 5). Enrollment has dropped below pre-pandemic levels by 10% in Colorado, 9% in Montana, 2% in Arkansas, less than 1% in Tennessee, and remains essentially flat in Iowa. In these states, relatively moderate enrollment growth during the pandemic was offset by high disenrollment rates during the unwinding, though it is unclear what factors drove the higher disenrollment rates. In contrast, enrollment is 52% higher in Missouri and 50% higher in North Carolina. Among the ten states with the largest net increase in enrollment from February 2020 to May 2024, the increase has been driven by eligibility expansions during the unwinding in five of the states—the adoption of Medicaid expansion in Missouri, Nebraska, North Carolina, and Oklahoma, and a large increase in the eligibility level for children in Maine. The remaining five states—Hawaii, Indiana, Nevada, Oregon, and Virginia—all experienced large enrollment increases during the pandemic and retained much of the increased enrollment through the unwinding.

Cumulative Percent Change in Total Medicaid/CHIP Enrollment from February 2020 through May 2024

Children’s enrollment is below the pre-pandemic levels in 12 states as of May 2024, while adult enrollment is below pre-pandemic levels in four states. Enrollment in Medicaid/CHIP among children is down over 14% in Montana, between 6% and 10% in Colorado, Idaho, and Utah, and 3% or less in the remaining eight states. Enrollment is below pre-pandemic levels for both children and adults in Montana, Colorado, and Arkansas. In Tennessee, adult enrollment dropped below pre-pandemic enrollment, but child enrollment is slightly above the earlier level. Generally, it was expected that a greater share of children than adults would remain eligible and enrolled. However, the drop in child enrollment below pre-pandemic levels in so many states coupled with an increase in the child uninsured rate in 2023 suggests that that some children may have lost coverage despite still being eligible.

Poll Finding

Health and Health Care Among Adults with Previous Experiences of Homelessness: Findings from the KFF Survey on Racism, Discrimination, and Health

Published: Sep 13, 2024

Findings

Homelessness in the U.S. is a serious problem that touches the lives of millions of individuals and families across urban, suburban, and rural areas. According to the U.S. Department of Housing and Urban Development, more than 650,000 people were experiencing homelessness on a single night in January 2023, a 12% increase from 2022. The links between homelessness and health are complex. Health problems can be a causal factor in homelessness, and being unhoused may worsen health problems or cause new ones, as well as making it difficult for individuals to access health care services and heal or recover from illness.

This report, based on analysis of KFF’s 2023 Racism, Discrimination, and Health Survey, examines the socioeconomic circumstances and health needs of adults who report experiencing homelessness at some point in their lives.1  This survey, designed for a different purpose than surveys that attempt to capture the experiences of individuals who are currently unhoused, is most likely to be sampling those who have experienced shorter term and episodic homelessness rather than those who have experienced chronic homelessness. Still, while not a measure of the population that is currently experiencing homelessness (and while causality cannot be shown between experiences of homelessness and the measures reported here), these data provide insights that might help direct efforts to address the needs of this population.

Overall, people with prior experiences of homelessness have disproportionate physical and mental health needs and face greater socioeconomic challenges compared to those who have never experienced homelessness. Among those with prior homelessness experience, women and those with lower incomes report even greater challenges on several measures. People who have experienced homelessness are disproportionately lower income, and the experiences they report could be a result of financial distress, lack of housing, or a combination of both. Despite these challenges, however, most adults who have been homeless at some point in their lives say their health care providers rarely or never ask them about their work, housing, or access to food or transportation, highlighting an opportunity to help improve health by identifying social and economic needs and facilitating access to services during health care visits.

Who Reports Experiences with Homelessness?

One in eight adults say they have personally experienced homelessness at some point in their lives, rising to one in five among Black adults and American Indian or Alaska Native (AIAN) adults. One in ten Hispanic (10%) and White (11%) adults report past experiences of homelessness, as do one in twenty Asian adults (5%). Some adults also report having close family members who have experienced homelessness. In total, one in five adults overall (19%) say they or a close family member have experienced homelessness, rising to one-third (34%) of AIAN adults and three in ten Black adults (30%).

Adults ages 18-64 are about twice as likely as those ages 65 and over to say they have personally experienced homelessness (13% vs. 6%) as are LGBT adults compared to non-LGBT adults (22% vs. 11%). For more on the experiences of LGBT adults, see this report.

Black and AIAN Adults Are More Likely Than White Adults to Report Past Experiences with Homelessness

Income and Economic Circumstances

Adults who have experienced homelessness are disproportionately low-income and face substantial financial challenges. About a third (35%) of adults who have past experiences of homelessness have family incomes below $20,000, roughly equivalent to the U.S. federal poverty level for a family of two. Just one in ten (11%) people with past experiences of homelessness have household incomes of $75,000 or more, compared to four in ten (39%) of those without such experiences.

Reflecting their lower incomes, one-third (34%) of adults who have experienced homelessness say they have difficulty affording their bills each month, and four in ten (41%) say they are just able to afford their monthly bills. Just one quarter (24%) say they are able to pay all their bills and have some money left over, compared to about six in ten (58%) of those with no prior experience of homelessness.

Adults Who Have Experienced Homelessness Are Disproportionately Lower Income
Adults Who Have Experienced Homelessness Report Difficulty Paying Monthly Bills

Two-thirds (65%) of adults with prior experiences of homelessness say they have had problems paying for necessities in the past 12 months, and nearly four in ten (37%) say someone in their household has had problems getting or keeping a job. While these challenges reflect the lower incomes of people who have experienced homelessness, disparities exist even when controlling for income. For example, among those with incomes below $20,000 a year, people who have experienced homelessness are significantly more likely than those without such experiences to report problems affording necessities (75% vs. 45%) and getting or keeping a job (45% vs. 27%).

Across Income Groups, Adults Who Have Experienced Homelessness Are More Likely Than Those Who Have Not to Report Economic and Employment Challenges

Across income levels, home ownership rates are lower among those with prior experiences of homelessness compared to those without. Four in ten adults who have experienced homelessness say they own their current home compared with seven in ten (71%) of those without such experience. Home ownership increases with income, but the share who report being homeowners is about 20 to 30 percentage points higher among those who have never experienced homelessness across income levels. In addition, three in ten (31%) adults who have experienced homelessness also say they have been evicted or denied housing at some point, rising to almost four in ten (37%) among those with incomes under $20,000.

Across Income Groups, Adults Who Have Experienced Homelessness Report Lower Rates of Home Ownership and Are More Likely Than Those Who Have Not to Have Been Evicted or Denied Housing

Health, Well-Being, and Social Supports

In addition to financial challenges, individuals who have experienced homelessness report substantial needs related to their physical and mental health.

Over one-third (36%) of adults who have experienced homelessness report being in fair or poor physical health, and nearly half (46%) say they have a health condition or disability that keeps them from participating fully in work or other activities. These shares are even higher among adults with prior experience of homelessness who are ages 50 and older (48% and 60%, respectively) or have a household income under $20,000 (46% and 65%, respectively). By comparison, 17% of adults who have not experienced homelessness describe their physical health as fair or poor and the same share (17%) report having a debilitating condition.

Over One in Three Adults Who Have Experienced Homelessness Report Fair or Poor Health and Nearly Half Say They Have a Debilitating Condition

Adults who have experienced homelessness are at least twice as likely as their counterparts to report their mental health and well-being as fair or poor (36% vs. 15%) and to say they always or often feel anxious (46% vs. 22%) or depressed (34% vs. 12%). These shares are even higher among women, with about half of women with past experiences of homelessness reporting fair or poor mental health (48%) and frequent feelings of depression (46%) and almost six in ten reporting frequent feelings of anxiety (57%). The share reporting fair or poor mental health is also higher among people with prior homelessness experience and low incomes (47% of those with incomes under $20,000), but there are no significant differences by income in the share reporting feelings of anxiety and depression.

Adults Who Have Experienced Homelessness Are Over Twice as Likely as Those Who Have Not to Report Worse Mental Health, Feeling Anxious, and Feeling Depressed
Among Those Who Have Experienced Homelessness, Women and Those with Lower Incomes Report Higher Rates of Mental Health Challenges

One-third of adults who have experienced homelessness say they are always or often lonely, and two-thirds say they have just a few or no friends and family members living nearby who they can ask for help or support. By comparison, 13% of adults with no prior experience of homelessness say they always or often feel lonely, and fewer than half (45%) say they have just a few or no friends and family nearby for support. Adults who report mental health challenges may be most in need of nearby social supports. However, it’s notable that among those in worse mental health who also report past experiences with homelessness, half (51%) say they are frequently lonely, and the share lacking a robust support network rises to more than eight in ten (84%).

One in Three Adults Who Have Experienced Homelessness Report Feeling Lonely and Over Two Thirds Report Lacking Social Support

Health care coverage, access, and experiences

Medicaid is a key source of coverage for people who have experienced homelessness, although about one in six reports being uninsured, and a quarter (26%) indicate they have been uninsured at some point in the past year. Reflecting their lower incomes, one-third (33%) of adults with prior experiences of homelessness report being covered by Medicaid, more than twice the share among those who have never experienced homelessness (13%). Also consistent with their lower incomes, one-quarter (26%) of adults who have experienced homelessness say there was a time in the past year when they were uninsured, including 17% who say they currently lack health insurance.

Adults Who Have Experienced Homelessness Are More Likely to Report Medicaid Coverage or Being Uninsured

Despite reporting substantial health needs, three in ten adults who have experienced homelessness say they rely on an emergency room or have no regular place to go when they are sick or need advice about their health. The share who lacks a usual source of care is similar among those who report being in fair or poor physical health (30%) and fair or poor mental health (36%), groups that may be most in need of regular access to health services. The share also rises to four in ten among Black adults (41%) and low-income adults (39% of those with incomes under $20,000) who have experienced homelessness.

Three in Ten Adults Who Have Experienced Homelessness Have No Usual Source of Care Other Than Emergency Room

More than half of adults who have experienced homelessness report skipping or postponing health care in the past year, including three in ten who say their health got worse as a result. Specifically, about four in ten (38%) say they skipped or postponed care they needed because of the cost, about a quarter (23%) tried to get care but couldn’t find a doctor with available appointments, and three in ten (31%) say they skipped or postponed care for some other reason. Reflecting their greater health needs and lower rates of insurance coverage, these shares are significantly higher among those who have experienced homelessness compared to those who have not. Among those who have experienced homelessness, the share who report skipping or postponing care for any reason is similar among those who report being in fair or poor physical health (55%) and is significantly higher among women than men (65% vs. 45%).

In addition to unmet needs for health care, about four in ten (38%) of those who have experienced homelessness say they or someone in their household had problems paying for health care in the past year, nearly twice the share among those with no prior experience of homelessness (22%).

More Than Half of Adults Who Have Experienced Homelessness Report Skipping or Postponing Health Care, With Three in Ten Reporting Health Worsened as a Result

Four in ten adults with prior experience of homelessness report going without needed mental health services in the past three years, including larger shares of younger adults, women, and those with worse mental health. Reflecting their greater mental health needs, adults who have experienced homelessness are about twice as likely as those who haven’t to say there was a time in the past three years when they thought they might need mental health services or medication but did not get them (40% vs. 19%). Among those with prior experience of homelessness, the share who report unmet needs for mental health care rises to more than half (56%) of those who describe their mental health as fair or poor and nearly half of those under age 50 (47%) and women (46%).

While there may be many barriers to receiving mental health services among this population, it’s notable that about half of adults with prior homelessness experience who either sought or received mental health services say it was difficult to find a mental health provider who could understand their background and experience (50%) or one who could see them in a timely manner (46%), and four in ten say it was difficult to find a provider they could afford (39%).

Four in Ten Adults Who Have Experienced Homelessness Report Going Without Needed Mental Health Services in the Past Three Years

Despite substantial health needs and socioeconomic challenges, most adults who have experienced homelessness say their health care providers rarely or never ask them about their work, housing, or access to food or transportation during visits. Among adults with prior homelessness experience who had at least one health care visit in the past three years, just about a quarter (26%) say their providers asked them about these social and economic factors every time or most of the time, and more than half (54%) say their providers rarely or never asked about these things. Notably, even among low-income adults with prior experiences of homelessness, half say their providers rarely or never ask about these social and economic factors during visits.

Most Adults Who Have Experienced Homelessness Report Their Health Care Providers Rarely or Never Ask About Social or Economic Needs

Methodology

The Survey on Racism, Discrimination, and Health was designed and analyzed by researchers at KFF. The survey was conducted June 6 – August 14, 2023, online and by telephone among a nationally representative sample of 6,292 U.S. adults in English (5,706), Spanish (520), Chinese (37), Korean (16), and Vietnamese (13).

The sample includes 5,073 adults who were reached through an address-based sample (ABS) and completed the survey online (4,529) or over the phone (544). An additional 1,219 adults were reached through a random digit dial telephone (RDD) sample of prepaid (pay-as-you-go) cell phone numbers. Marketing Systems Groups (MSG) provided both the ABS and RDD sample. All fieldwork was managed by SSRS of Glen Mills, PA; sampling design and weighting was done in collaboration with KFF.

Sampling strategy:

The project was designed to reach a large sample of Black adults, Hispanic adults, and Asian adults. To accomplish this, the sampling strategy included increased efforts to reach geographic areas with larger shares of the population having less than a college education and larger shares of households with a Hispanic, Black, and/or Asian resident within the ABS sample, and geographic areas with larger shares of Hispanic and non-Hispanic Black adults within the RDD sample.

The ABS was divided into areas (strata) based on the share of households with a Hispanic, Black, and/or Asian resident, as well as the share of the population with a college degree within each Census block group. To increase the likelihood of reaching the populations of interest, strata with higher incidence of Hispanic, Black, and Asian households, and with lower educational attainment, were oversampled in the ABS design. The RDD sample of prepaid (pay-as-you-go) cell phone numbers was disproportionately stratified to reach Hispanic and non-Hispanic Black respondents based on incidence of these populations at the county level.

Incentives:

Respondents received a $10 incentive for their participation, with interviews completed by phone receiving a mailed check and web respondents receiving a $10 electronic gift card incentive to their choice of six companies, a Visa gift card, or a CharityChoice donation.

Community and expert input:

Input from organizations and individuals that directly serve or have expertise in issues facing historically underserved or marginalized populations helped shape the questionnaire and reporting. These community representatives were offered a modest honorarium for their time and effort to provide input, attend meetings, and offer their expertise on dissemination of findings.

Translation:

After the content of the questionnaire was largely finalized, SSRS conducted a telephone pretest in English and adjustments were made to the questionnaire. Following the English pretest, Cetra Language Solutions translated the survey instrument from English into the four languages outlined above and checked the CATI and web programming to ensure translations were properly overlayed. Additionally, phone interviewing supervisors fluent in each language reviewed the final programmed survey to ensure all translations were accurate and reflected the same meaning as the English version of the survey.

Data quality check:

A series of data quality checks were run on the final data. The online questionnaire included two questions designed to establish that respondents were paying attention and cases were monitored for data quality including item non-response, mean length, and straight lining. Cases were removed from the data if they failed two or more of these quality checks. Based on this criterion, 4 cases were removed.

Weighting:

The combined cell phone and ABS samples were weighted to match the sample’s demographics to the national U.S. adult population using data from the Census Bureau’s 2021 Current Population Survey (CPS). The combined sample was divided into five groups based on race or ethnicity (White alone, non-Hispanic; Hispanic; Black alone, non-Hispanic; Asian alone, non-Hispanic; and other race or multi-racial, non-Hispanic) and each group was weighted separately. Within each group, the weighting parameters included sex, age, education, nativity, citizenship, census region, urbanicity, and household tenure. For the Hispanic and Asian groups, English language proficiency and country of origin were also included in the weighting adjustment. The general population weight combines the five groups and weights them proportionally to their population size.

A separate weight was created for the American Indian and Alaska Native (AIAN) sample using data from the Census Bureau’s 2022 American Community Survey (ACS). The weighting parameters for this group included sex, education, race and ethnicity, region, nativity, and citizenship. For more information on the AIAN sample including some limitations, adjustments made to make the sample more representative, and considerations for data interpretation, see Appendix 2.

All weights also take into account differences in the probability of selection for each sample type (ABS and prepaid cell phone). This includes adjustment for the sample design and geographic stratification of the samples, and within household probability of selection.

The margin of sampling error including the design effect for the full sample is plus or minus 2 percentage points. Numbers of respondents and margins of sampling error for key subgroups are shown in the table below. Appendix 1 provides more detail on how race and ethnicity was measured in this survey and the coding of the analysis groups. For results based on other subgroups, the margin of sampling error may be higher. All tests of statistical significance account for the design effect due to weighting. Dependent t-tests were used to test for statistical significance across the overlapping groups.

Sample sizes and margins of sampling error for other subgroups are available by request. Sampling error is only one of many potential sources of error and there may be other unmeasured error in this or any other public opinion poll. KFF public opinion and survey research is a charter member of the Transparency Initiative of the American Association for Public Opinion Research.

GroupN (unweighted)M.O.S.E.
Total6,292± 2 percentage points
Experiences with homelessness
Adults who have experienced homelessness811± 6 percentage points
Adults who have not experienced homelessness5468± 2 percentage points

Endnotes

  1. The survey question used to define this group is: u201cHave you or any of your close family members ever experienced homelessness?u201d Including those who answered u201cYes, myselfu201d or u201cYes, both myself and a close family member.u201d This definition may differ from other measures of homelessness since it is a self-reported measure is likely to include a mix of experiences in terms of duration and severity of experiences with being unhoused. ↩︎

What is Medicaid Estate Recovery?

Authors: Alice Burns, Maiss Mohamed, and Molly O’Malley Watts
Published: Sep 13, 2024

Issue Brief

Established to provide another source of Medicaid funding and promote program integrity, the recovery of certain Medicaid costs after an enrollee dies (estate recovery) has been criticized for several reasons, including that it falls primarily on individuals with limited incomes, raises little revenue, and is applied very unevenly across the states. Family members may be unaware of the policy at the time of enrollment and only learn that the family home may be repossessed after the death of a loved one. Such criticisms have led to proposals (Box 1) that would modify or reduce the practice of estate recovery by Democrats, Republicans, and the Medicaid and CHIP Payment and Access Commission (MACPAC).

Estate recovery is a process that primarily affects older Medicaid enrollees who use long-term services and supports (LTSS). To be eligible for Medicaid coverage of LTSS, people must usually demonstrate having limited incomes (typically below $3,000 per month in 2024 for an individual) and financial resources (often below $2,000 for an individual), but some assets, including their home, are excluded from the calculation of financial resources. Many people only qualify after spending their assets on the out-of-pocket costs for LTSS, which may easily exceed $100,000 per year. The 1993 Omnibus Budget Reconciliation Act required state Medicaid programs to recover the costs of certain Medicaid benefits through a process called estate recovery. Specifically, states are required to recover the costs of LTSS and related hospital and prescription drug services for Medicaid enrollees ages 55 and older; and have the option to recover the costs for other services and populations. States may not take the family home if it is occupied by a spouse, child under the age of 21, child who is blind or has a disability, or a sibling with an equity interest in the home, but they may place a lien on real property for individuals who are alive but permanently institutionalized.

This issue brief sheds light on states’ policies towards estate recovery, drawing from KFF’s Survey of Medicaid Financial Eligibility & Enrollment Policies for Seniors & People with Disabilities which was conducted in March 2024 by KFF and Watts Health Policy Consulting. Overall, 49 states and the District of Columbia (hereafter referred to as a state) responded to the survey, though response rates to specific questions varied (Florida was the only state that did not respond).

Key takeaways include:

  • Over half of states reported using estate recovery for the costs of populations and services for which federal law does not require estate recovery, with 28 states reporting estate recovery for some individuals under age 55 and 32 states reporting estate recovery for the costs of all Medicaid benefits for individuals ages 55 and older, and an additional 5 states reporting estate recovery for some optional benefits (Figure 1).
  • Over half of states (30) reported using estate recovery to recoup the costs of premiums paid to managed care organizations on behalf of Medicaid enrollees.
  • Federal law requires states to establish procedures for waiving estate recovery when recovery would cause hardships, but there are no specific procedures required. States reported waiving estate recovery under the following conditions: when the individual meets state-defined hardship requirements (49 states), if the estate is the sole income-producing asset of survivors (35 states), and when the home is of modest value (15 states). (The definition of “modest value” varies by state and may reflect dollar values, market value relative to local property values, or other measures.)

State Policies Surrounding Medicaid Estate Recovery

Why was estate recovery established and why is it a source of concern for policymakers?

Estate recovery was established as a tool to promote program integrity and ensure that people contribute to the costs of their health care. People must generally have very limited income and assets to qualify for Medicaid, but the value of the home is not counted towards the initial eligibility determination. Most eligibility pathways for people who use LTSS require people to have incomes under $3,000 each month and only $2,000 of savings for an individual or $3,000 for a couple. Despite stringent financial eligibility levels, some people with moderate incomes during their working years may become eligible for Medicaid during their retirement years if they need LTSS. Most Medicare beneficiaries live on fixed incomes, with half living on incomes below $36,000 per year and half having savings below $103,800 in 2023. The high costs of LTSS, easily exceeding $100,000 per year, may cause people to qualify for Medicaid after exhausting their savings even if they live in a home of some value. Proponents of estate recovery have indicated that it ensures Medicaid funding is used for the most needy, prevents people from relying on Medicaid instead of using their personal resources to pay for LTSS, and allows states to spend more on other Medicaid expenses. States are also required to establish a cost-effectiveness threshold, which determines whether the value of the estate is cost effective relative to the administrative costs of recovery; and is intended to preclude states from pursuing small estates.

Estate recovery is a source of concern to some policymakers because it disproportionately affects low-income families, creates high administrative costs relative to the revenue generated, and may deter eligible people from applying for Medicaid. A 2021 report to Congress by MACPAC summarizes those concerns, which include:

  • Medicaid enrollees are generally low-income and estate recovery may perpetuate intergenerational poverty.
  • Individuals with greater awareness of estate recovery and resources are often able to leverage legal mechanisms allowing them to bypass Medicaid estate recovery but preserve Medicaid eligibility. Individuals with fewer resources or only a family home often don’t have the income to hire an attorney to help implement such strategies.
  • Estate recovery results in administrative costs to states that could exceed the value of the collections.
  • Estate recovery raises relatively few revenues: $733 million in 2019, which offset 0.1% of the over $600 billion that Medicaid spent in 2019. Even in states with the highest relative recovery revenues, those revenues offset less than 1.0% of the states’ Medicaid spending.
  • Estate recovery may deter some people from applying to Medicaid who are eligible even if they would not be subject to estate recovery. For example, Medicare beneficiaries who are only eligible for Medicaid coverage of Medicare premiums and cost sharing would not be subject to estate recovery, but limited understanding of the program may prevent them from applying.

States’ use of estate recovery varies considerably, with a small number of states accounting for most of the collections. Five states (Massachusetts, New York, Pennsylvania, Ohio, and Wisconsin) with the largest estate recoveries accounted for nearly 40% of all collections in FY 2019, the most recent year for which data are publicly available about all states’ collections. The same report showed survey data for 10 states, with those states reporting varying numbers of estates pursued, estates recovered, and the amounts recovered per state. Alaska pursued the fewest estates of the responding states (under 500 per year). At the other end of the spectrum were Iowa (pursuing over 15,000 estates each year) and New York (pursuing around 30,000 per year). The average amount recovered per estate ranged from around $5,000 or less in Missouri and Wisconsin to $30,000 per year or more in Alaska and Georgia.

Box 1: What are the current policy proposals to eliminate or reduce states’ use of estate recovery?

Democrats, Republicans, and the Medicaid and CHIP Payment and Access Commission (MACPAC) have all proposed changes to the estate recovery program. Such proposals include the following:

H.R. 7573 – Stop Unfair Medicaid Recoveries Act: H.R. 7573 would eliminate estate recovery programs entirely.

H.R. 8094 – To amend title XIX of the Social Security Act to modify certain asset recovery rules: H.R. 8094 would prohibit states from conducting estate recovery in cases where the family home is transferred to another person who is eligible for Medicaid or has income below 138% of the federal poverty level.

MACPAC – Medicaid Estate Recovery: Improving Policy and Promoting Equity: MACPAC recommended three legislative changes to Title XIX of the Social Security Act. Those changes include making estate recovery optional for states, allowing states that provide long-term services and supports (LTSS) through managed care plans to recover the costs of services used rather than the costs of the premiums the state paid, and directing the Department of Health and Human Services to establish minimum standards for hardship waivers. Minimum standards for hardship waivers would prevent states from pursuing recovery for assets that are the sole income-producing asset of survivors, homes of modest value, and estates valued under a certain threshold.

When does Medicaid estate recovery apply?

States must conduct estate recovery for some services and enrollees but may choose to apply estate recovery in additional circumstances, which contributes to the variation in how many estates are pursued and the amount states are recovering. Estate recovery is required for enrollees ages 55 and older who use LTSS, including enrollees eligible for Medicaid through the Affordable Care Act’s Medicaid expansion. For people ages 55 and older who use LTSS, states must recover the costs of nursing facility services, home- and community-based services (HCBS), and related hospital and prescription drug services (defined as those services provided during a nursing facility stay or while receiving HCBS). States may elect to recover the costs of all Medicaid-covered services. They may also elect to conduct estate recovery for individuals who are under the age of 55 if they have been determined to be permanently institutionalized.

Most states apply estate recovery beyond the federally-required circumstances: 37 states apply estate recovery to services for which it is optional and 28 determine permanent institutional status for individuals under age 55 (Appendix Table). For individuals under age 55, estate recovery most frequently applies to people in nursing facilities and in intermediate care facilities for individuals with intellectual disabilities. Among the states applying estate recovery for optional services, 5 states reported applying it to some optional services and 32 states reported applying it to all Medicaid-covered services, but several states noted that recovery could only occur if LTSS services were also rendered.

For people enrolled in managed care, estate recovery is based on the premium payments states make rather than on the services people use, which means some people are subject to estate recovery despite not using applicable services. When states provide benefits through managed care, states are required to seek recovery for the premiums paid if the enrollee would have been subject to estate recovery under a fee-for-service system. If the state recovers the costs of all Medicaid services, estate recovery must apply to the full Medicaid premium. If the state only recovers the costs of a subset of benefits, estate recovery must apply to the portion of the premium attributable to those benefits.

Over half of states apply estate recovery to the costs of managed care premiums. Among the 27 states with capitated managed care that includes LTSS, 11 states pursue estate recovery for the entire premium for people who use LTSS, and 10 states recover the entire premium for everyone enrolled in the plan. Fewer states (5) pursue only the premium attributable to LTSS used. Pennsylvania reported a unique approach, taking the smaller of the premium or the amount of claim spending on LTSS and related services each month. There is no recovery for months without LTSS spending. Among states with stand-alone LTSS managed care plans, 8 states recover the entire premium but only for people who use LTSS and 5 states recover the entire premium for everyone enrolled in the plan. Indiana’s managed LTSS program began in July 2024 and the state will pursue recovery for the entire capitation and any other amounts paid.

When do states waive estate recovery requirements?

Federal law requires states to waive estate recovery requirements when they impose “undue hardships,” but does not specify what constitutes a hardship, leading to significant variation in when states waive estate recovery. Guidance from the Centers for Medicare and Medicaid Services (CMS) provides three examples of potential hardships which include:

  • Estate is sole income-producing asset of survivors such as a family farm;
  • Home is of modest value, defined as roughly half the average home value in the county; or
  • Other compelling circumstances.

The variable approach to hardship waivers has raised equity concerns because the ease with which they are granted varies across states. In some states, securing a hardship waiver may require an attorney, and the families with the fewest resources are least likely to be able to afford such services. In the 10 states included in MACPAC’s survey, the percentage of hardship applications granted in 2019 ranged from 29% in New York to 95% in Iowa.

In KFF’s survey, nearly all states (49) reported adopting at least one of the three potential hardship exemptions in CMS guidance, with the most common being to waiver the estate if it was the sole income-producing asset of survivors (Appendix Table). Specifically, 35 states reported using the income-producing asset criteria, although Arizona also required that the heir must own a business located on real property that is part of the estate and Georgia limits the hardship to farms with annual income of $25,000 or less. Washington does not waive recovery, only delays, when hardship exists. Criteria for delaying recovery include estates that are the sole income-producing property of survivors, when recovery would deprive the heir of shelter and they cannot afford alternative shelter, and when the survivor is a state-registered domestic partner.

Only 15 states reported waiving estate recovery for homes of modest value but the definition of “modest” was unclear in many cases. Only four states reported dollar thresholds to define “modest,” including: West Virginia $50,000 or less; Texas less than $10,000; Mississippi and North Dakota, less than $5,000. Seven states (California, Louisiana, Michigan, New Mexico, New York, South Carolina, and Virginia) defined modest value as one whose market value is 50% or less than the average or median price of homes in a county. Other states used more varied approaches including the following.

  • Two states (Arkansas and Maine) waive estate recovery when it is not cost effective but did not provide another definition for homes of modest value.
  • In some cases, states reported exempting portions of the home for all descendants. For example, Louisiana exempts either the first $15,000 or half of the median value of a home within the parish from the homestead and South Carolina exempts 50% or less of the average home price within a county from the home’s value. Such exemptions would also preclude estate recovery for homes under those exemption levels.
  • Hawaii and Vermont did not describe general definitions of modest value, but both have exemptions that reflect the value of the home in circumstances when heirs cared for the descendent prior to their death.

Most states (40) described other circumstances that would trigger a hardship exemption. Many of those circumstances related to federal policies such as exempting homes that were occupied by surviving minors and when the estate is the sole income-producing asset of a family business. The most common other exemptions included those for heirs who had provided care in the home for enrollees prior to their death and exemptions that considered the income and resources of the heir. Idaho, Ohio, and Wisconsin waive estate recovery when it would result in the survivor becoming eligible for Medicaid or other public assistance.

This work was supported in part by Arnold Ventures. KFF maintains full editorial control over all of its policy analysis, polling, and journalism activities.

Appendix

State Policies Surrounding Medicaid Estate Recovery
Poll Finding

KFF Health Tracking Poll September 2024: Support for Reducing Prescription Drug Prices Remains High, Even As Awareness of IRA Provisions Lags

Published: Sep 13, 2024

Findings

Key Takeaways

  • The Biden administration recently announced a projected reduction of out-of-pocket costs for seniors as part of the Medicare drug negotiations, yet large majorities of voters have not heard about these savings, with almost half (45%) who say they have heard “nothing at all,” while a quarter have heard “a lot” or “some.” Larger shares of older voters, those ages 65 and older, say they’ve heard “a lot” or “some” about these savings, with a third (32%) who say so, compared to two in ten (22%) of those under age 65. Most voters continue to be unaware of the Medicare drug pricing provisions in the Inflation Reduction Act, or IRA, that was passed by Congress and signed into law by President Biden more than two years ago, though awareness of some of the provisions is higher among older voters – the group most impacted by the provisions.
  • While awareness of Medicare drug negotiations continues to lag, KFF finds widespread support for this policy. Majorities of voters support authorizing the federal government to negotiate drug prices, while one in seven (14%) oppose. This provision is supported by nine in ten Democrats and independent voters (92% and 89%, respectively) and three-quarters of Republican voters (77%). It is also supported by 88% of older adults, those ages 65 and over, including majorities across partisans.
  • Voters’ views of who is responsible for the legislation as well as the expected savings from the negotiations are largely partisan. Overall, a slight majority (55%) of voters ages 65 and older think Medicare negotiating will lower their own prescription drug costs, but the share who expect to see savings increases to nearly two-thirds (64%) of older Democratic and Democratic-leaning voters. On the other hand, about half (52%) of older Republican and Republican-leaning voters say they don’t expect the negotiations to have any impact on their drug costs. In addition, voters are also more likely to give their own party leaders credit for passing legislation aimed at lowering the price of prescription drugs for people on Medicare, though Republican voters are less enthusiastic about their party leaders’ roles. Larger shares of Democratic voters than Republican voters say President Biden, Vice President Harris, and the Democrats in Congress played a “major” or “minor” role in passing legislation for lowering drug prices for people on Medicare, while Republican voters are more likely than Democratic voters to say the same about Republicans in Congress. A similar share of Republican voters give former President Trump credit for passing the legislation as give credit to President Biden.
  • Vice President Harris’ campaign has announced proposals for expanding some of the IRA provisions beyond those with Medicare coverage. Majorities of voters, overall and across partisanship, support these proposed provisions, though smaller shares of Republicans are on board. Three-quarters (77%) of voters support the proposal to expand the $35 cap on out-of-pocket costs for insulin beyond those with Medicare, including majorities of Democratic voters (84%), independent voters (79%), and Republican voters (70%). Seven in ten (69%) voters support the proposal to expand the $2,000 annual limit on out-of-pocket prescription drug costs beyond those with Medicare, including 83% of Democrats, 70% of independents, and 58% of Republicans.

Most Voters Continue to Be Unaware of IRA Provisions to Reduce Prescription Drug Prices

Most voters continue to be unaware of the Medicare drug pricing provisions in the Inflation Reduction Act, or IRA, that was passed by Congress and signed into law by President Biden more than two years ago, though awareness of some of the provisions is higher among older voters – the group most impacted by the provisions.

Four in ten voters are now aware there is a federal law in place that caps the cost of insulin for people with Medicare at $35 per month, while another third (35%) are aware of the law that requires the federal government to negotiate the price of some prescription drugs for people with Medicare. A quarter of voters (27%) are aware of the federal law that places a limit on out-of-pocket prescription drug costs for people with Medicare, and one in eight (12%) are aware that there is a law in place that penalizes drug companies for increasing prices faster than the rate of inflation for people with Medicare.

Larger shares of voters ages 65 and older are aware of some of these drug pricing provisions of the IRA. For example, six in ten (61%) voters ages 65 and older are aware of the law that caps the cost of insulin for people with Medicare and about a third (34%) of older voters are aware of the provision that places an out-of-pocket limit on prescription drug costs. Similar shares of older voters compared to younger voters are aware of the provision that requires the government to negotiate the price of some prescription drugs and that penalizes drug companies for increasing prices faster than the rate of inflation for people with Medicare.

Voters Ages 65 and Older Are More Likely to Know That Federal Law Caps the Cost of Insulin for People With Medicare

While awareness of the Medicare drug pricing provisions increased, especially among older voters, from November 2023 to May 2024, awareness has remained steady over the past several months.

Voters Remain Unaware of Impact of Medicare Drug Negotiations, Older Adults Are Unclear if It Will Reduce Their Prescription Costs

The Biden administration recently announced that the lower prices negotiated for some prescription drugs would have saved the federal government $6 billion in 2023 with an estimated $1.5 billion reduction in out-of-pocket costs for older adults when lower prices take effect in 2026. Large majorities of voters have not heard about these projected savings, with almost half (45%) who say they have heard “nothing at all” about the negotiations, while a quarter (25%) have heard “a lot” or “some.” Another three in ten (30%) have heard “a little” about the negotiations.

Larger shares of older voters, those ages 65 and over, say they’ve heard “a lot” or “some” about these savings, with a third (32%) who say so, compared to one in five (22%) of those under age 65.

Similarly, larger shares of Democratic and independent voters have heard about the projected savings, with about a third (34%) of Democrats and a quarter (27%) of independents who have heard at least “some,” compared to about one in six (16%) Republican voters.

Very Few Voters Have Heard of Savings From Drug Price Negotiations, With Larger Shares of Democrats, Older Adults Who Have

Overall, almost nine in ten (85%) voters support authorizing the federal government to negotiate drug prices, while one in seven (14%) oppose. This provision is supported by 92% of Democratic voters, 89% of independent voters, and 77% of Republican voters. While support for the law is lower among Republicans, most Republican voters support it.

Majorities Across Partisanship Support Portion of the Inflation Reduction Act That Authorizes the Federal Government to Negotiate the Price of Prescription Medication

In addition to supporting the federal government negotiations, a slight majority (55%) of voters ages 65 and older think Medicare negotiations will lower their own prescription drug costs, while four in ten (43%) older voters think negotiating won’t have any impact on their prescription drug costs. Expectations that Medicare negotiations won’t lower drug costs seem to be partisan, with two-thirds (64%) of older Democratic and Democratic-leaning voters thinking it will lower their drug costs, while about half (52%) of older Republican and Republican-leaning voters thinking it won’t have any impact on their drug costs.

Over Half of Older Voters Say Authorizing the Government to Negotiate With Pharmaceutical Companies Will Lower Their Prescription Drug Costs

The Inflation Reduction Act was enacted under President Biden without any Republican support in Congress. Six in ten voters say President Biden had a “major” or “minor” role in passing the recent law aimed at lowering drug prices for people on Medicare, including four in ten (37%) who say he had a “major” role. Similar shares of voters say the same about Democrats in Congress, with six in ten (60%) who say they played a “major” or “minor” role. Another four in ten (42%) voters say Vice President Harris played a role. Credit for the recent law could be key as she picks up these issues on her own platform for president.

Almost half (46%) of voters think that Republicans in Congress played a role in passing the recent law, with a small share saying they played a “major” role (14%). About a quarter of voters credit former President Trump for the passage of the law aimed at lowering drug prices for those on Medicare, with a quarter (28%) who say he played a “major” or “minor” role, while 41% say he had no role in passing the recent law. Between a quarter and a third of voters aren’t sure how big of a role these groups played in the health care legislation.

Large Shares of Voters See Biden, Democrats in Congress as Having a Role in Passing Law Aimed at Lowering Drug Prices for People on Medicare

Partisans are more likely to give their own party leaders credit for passing legislation aimed at lowering the price of prescription drugs for people on Medicare, though Republican voters are less enthusiastic about their party leaders’ roles. Larger shares of Democratic voters than Republican voters say President Biden, Vice President Harris, and the Democrats in Congress played a “major” or “minor” role in passing legislation for lowering drug prices for people on Medicare. While Republican voters are more likely than Democratic voters to say former President Trump and the Republicans in Congress played a role, only about a quarter of Republican voters said either (23% and 24%, respectively) played a “major role.” In fact, a similar share of Republican voters give former President Trump credit for passing the legislation as give credit to President Biden.

Overall, eight in ten (81%) Democratic voters say Biden played a role in passing the legislation, four in ten (39%) of Republican voters say the same about Trump. Another eight in ten Democratic voters say Democrats in Congress played a “major” or “minor” role in passing the legislation, while over half (54%) of Republicans say the same about Republicans in Congress.

Democratic Voters Are More Likely to Say Democrats Had a Role in Passing Drug Pricing Law Than Republican Voters Are About Republicans in Congress

Voters Support Expanding on IRA Provisions

Vice President Harris’ campaign has announced that, if elected, her administration hopes to expand some of the drug pricing legislation beyond just those with Medicare, allowing others to benefit from the cap on monthly out-of-pocket costs for those with insulin and the annual limit on out-of-pocket prescription drug costs. Former President Trump has remained silent on some of these issues, though his administration implemented a program under which Medicare plans voluntarily lowered insulin copays to $35 per month. Majorities of voters, overall and across partisanship, support these proposed provisions, though smaller shares of Republicans are on board. Three-quarters (77%) of voters support the proposal to expand the $35 cap on out-of-pocket costs for insulin beyond those with Medicare, including majorities of Democratic voters (84%), independent voters (79%), and Republican voters (70%). Seven in ten (69%) voters support the proposal to expand the $2,000 annual limit on out-of-pocket prescription drug costs beyond those with Medicare, including 83% of Democrats, 70% of independents, and 58% of Republicans.

Majorities of Voters Across Partisanship Support Proposals to Expand IRA Provisions Beyond Those With Medicare

Methodology

This KFF Health Tracking Poll/Health Misinformation Tracking Poll was designed and analyzed by public opinion researchers at KFF. The survey was conducted August 26-September 4, 2024, online and by telephone among a nationally representative sample of 1,312 U.S. adults in English (1,244) and in Spanish (68). The sample includes 1,028 adults (n=53 in Spanish) reached through the SSRS Opinion Panel either online (n=1,018) or over the phone (n=18). The SSRS Opinion Panel is a nationally representative probability-based panel where panel members are recruited randomly in one of two ways: (a) Through invitations mailed to respondents randomly sampled from an Address-Based Sample (ABS) provided by Marketing Systems Groups (MSG) through the U.S. Postal Service’s Computerized Delivery Sequence (CDS); (b) from a dual-frame random digit dial (RDD) sample provided by MSG. For the online panel component, invitations were sent to panel members by email followed by up to three reminder emails.

Another 284 (n=15 in Spanish) interviews were conducted from a random digit dial telephone sample of prepaid cell phone numbers obtained through MSG. Phone numbers used for the prepaid cell phone component were randomly generated from a cell phone sampling frame with disproportionate stratification aimed at reaching Hispanic and non-Hispanic Black respondents. Stratification was based on incidence of the race/ethnicity groups within each frame.

Respondents in the phone samples received a $15 incentive via a check received by mail, and web respondents received a $5 electronic gift card incentive (some harder-to-reach groups received a $10 electronic gift card). In order to ensure data quality, cases were removed if they failed two or more quality checks: (1) attention check questions in the online version of the questionnaire, (2) had over 30% item non-response, or (3) had a length less than one quarter of the mean length by mode. Based on this criterion, no cases were removed.

The combined cell phone and panel samples were weighted to match the sample’s demographics to the national U.S. adult population using data from the Census Bureau’s 2022 Current Population Survey (CPS), September 2021 Volunteering and Civic Life Supplement data from the CPS, and the 2024 KFF Benchmarking Survey with ABS and prepaid cell phone samples. The demographic variables included in weighting for the general population sample are gender, age, education, race/ethnicity, region, civic engagement, frequency of internet use, political party identification by race/ethnicity, and education. The sample of registered voters was weighted separately to match the U.S. registered voter population using the same parameters above derived from the 2024 KFF Benchmarking Survey. Both weights account for differences in the probability of selection for each sample type (prepaid cell phone and panel). This includes adjustment for the sample design and geographic stratification of the cell phone sample, within household probability of selection, and the design of the panel-recruitment procedure.

The margin of sampling error including the design effect for the full sample is plus or minus 4 percentage points and is plus or minus 4 percentage points for registered voters. Numbers of respondents and margins of sampling error for key subgroups are shown in the table below. For results based on other subgroups, the margin of sampling error may be higher. Sample sizes and margins of sampling error for other subgroups are available by request. Sampling error is only one of many potential sources of error and there may be other unmeasured error in this or any other public opinion poll. KFF public opinion and survey research is a charter member of the Transparency Initiative of the American Association for Public Opinion Research.

GroupN (unweighted)M.O.S.E.
Total1,312± 4 percentage points
Total registered voters1,084± 4 percentage points
Democratic registered voters377± 7 percentage points
Independent registered voters335± 7 percentage points
Republican registered voters332± 7 percentage points
News Release

Allowing Medicare to Negotiate Drug Prices Remains Broadly Popular Among Voters, Though Most Are Unaware of the Law and Its Projected Savings

Published: Sep 13, 2024

Allowing Medicare to negotiate drug prices on behalf of older Americans remains broadly popular across partisans, though many voters are unaware of the new law and the billions of dollars it is expected to save in 2026, a new KFF Health Tracking Poll finds.A large majority (85%) of voters say they support allowing the federal government to negotiate the price of some prescription drugs for people with Medicare. This includes at least three quarters of Republican (77%), independent (89%) and Democratic (92%) voters.

The Inflation Reduction Act of 2022 authorized such negotiations, and the Biden administration recently completed the first round of negotiations on 10 drugs, resulting in an estimated $1.5 billion in lower out-of-pocket costs for Medicare beneficiaries in 2026.The poll shows that nearly two thirds (65%) of voters are unaware or unsure that there is a law allowing Medicare drug-price negotiations. The share (62%) is similar among older voters (ages 65+) who are generally covered by Medicare.A large majority (75%) of voters also say they have not heard much about the savings resulting from the first round of price negotiations, including almost half (45%) who say they have heard “nothing at all.” One in four say they have heard “a lot” (4%) or “some” (21%) about the savings. Older voters are somewhat more likely to have heard either “a lot” (7%) or “some” (26%) about the savings.Other findings include:

  • Most (55%) voters ages 65 and older expect that Medicare drug-price negotiations will lower their own prescription costs, with 43% saying it will not have any impact. Older Democratic and Democratic-leaning independent voters are more likely than older Republicans and Republican-leaning independent voters to expect savings (64% vs. 45%). 
  • Minorities of voters are aware of other Medicare drug-price provisions in the Inflation Reduction Act, including the $35 cap on out-of-pocket costs for insulin (40%) and limiting annual out-of-pocket prescription drug costs (27%). Older voters are more likely than younger voters to know about both of these provisions. 
  • While the Inflation Reduction Act was enacted under President Biden without any Republican support in Congress, partisans are divided on who deserves credit for the law’s Medicare drug price provisions. Substantial shares of GOP voters say that Republicans in Congress (54%) and President Trump (39%) had either a “major” or “minor” role in enacting those provisions. Larger shares of Democratic voters say that Democrats in Congress (80%), President Biden (81%), and Vice President Harris (69%) had a role. 
  • Most voters say they would be in favor of extending Medicare’s $35 cap on monthly insulin costs (77%) and the $2,000 limit on out-of-pocket drug spending (69%) beyond people with Medicare, as Vice President Harris has proposed. Majorities of Democrats, Republicans and independent voters support extending each of the two provisions. 

Designed and analyzed by public opinion researchers at KFF, the survey was conducted August 26-Sept. 4, 2024, online and by telephone among a nationally representative sample of 1,312 U.S. adults, including 1,084 registered voters, in English and in Spanish. The margin of sampling error is plus or minus 4 percentage points for the full sample and among registered voters. For results based on other subgroups, the margin of sampling error may be higher.