What to Know About the BALANCE Model for GLP-1s in Medicare and Medicaid and the Medicare GLP-1 Bridge
Editorial Note
This brief was updated on May 11, 2026 to reflect changes in the Trump administration’s plans for implementation of the BALANCE Model in Medicare and an extension of the Medicare GLP-1 Bridge program through 2027.
GLP-1s, a class of drugs used to treat type 2 diabetes, obesity, cardiovascular disease, and other conditions, have exploded in popularity in recent years due to their demonstrated effectiveness, but are often not covered by insurance, particularly for the treatment of obesity. According to KFF polling, about half (56%) of GLP-1 users say these drugs were difficult to afford, including one in four who say they were “very difficult” to afford. The Trump administration is pursuing various approaches to lowering the cost and expanding coverage of these medications. These approaches include striking “most-favored nation” deals with GLP-1 manufacturers Novo Nordisk and Eli Lilly, providing access to discounted prices for GLP-1s through TrumpRx, and proposing to implement a new demonstration program called the BALANCE (Better Approaches to Lifestyle and Nutrition for Comprehensive hEalth) Model to expand Medicare and Medicaid coverage of GLPs for obesity, which is currently subject to statutory limitations (prohibited in Medicare, permissible but not required in Medicaid). In addition, the GLP-1 drug semaglutide (branded as Ozempic, Wegovy, and Rybelsus) was selected for Medicare drug price negotiation in 2025, with a negotiated price set to take effect in 2027.
This brief describes current coverage of GLP-1s in Medicare and Medicaid, the Centers for Medicare & Medicaid Services’ (CMS) efforts to expand access and lower costs for GLP-1s through temporary demonstration programs, and potential impacts on beneficiaries and program budgets. It also describes recent changes to the administration’s plans for temporary coverage of GLP-1s in Medicare, including an indefinite delay in implementation of the BALANCE Model in Part D and an extension of a separate short-term program, called the Medicare GLP-1 Bridge, which was originally scheduled to run from July-December 2026 but will now run through the end of 2027.
Current law prohibits Medicare from covering obesity drugs and gives states flexibility to cover weight loss drugs under Medicaid
Limitations on coverage for obesity drugs in Medicare and Medicaid mean that millions of people who have obesity and might benefit from taking GLP-1s may be unable to access them unless they are able to pay the full cash price out of their own pockets, which would likely be prohibitive for people with Medicaid who must have low incomes to qualify for the program, as well as for many people on Medicare with low and modest incomes. Under the Medicare Part D outpatient prescription drug benefit program, Part D plans are required to cover a minimum of two drugs in each therapeutic category and class, but from the outset, Medicare has been prohibited by law from covering medications when used specifically for weight loss. People on Medicare can get GLP-1s covered by Part D plans only if they are used for a medically accepted FDA-approved indication other than obesity, like type 2 diabetes, cardiovascular disease risk reduction, or sleep apnea.
Under the Medicaid Drug Rebate Program (MDRP), state Medicaid programs must cover nearly all of a participating manufacturer’s FDA-approved drugs for medically accepted indications. However, federal law gives states the option whether to cover drugs used for weight loss. As a result, GLP-1 coverage for medically accepted FDA-approved indications other than obesity is required while access to GLP-1s to treat obesity under Medicaid is currently limited. Only 13 states provided coverage as of January 2026, down from 16 states in 2025, likely reflecting the significant costs of coverage and recent state budget challenges and federal funding cuts.
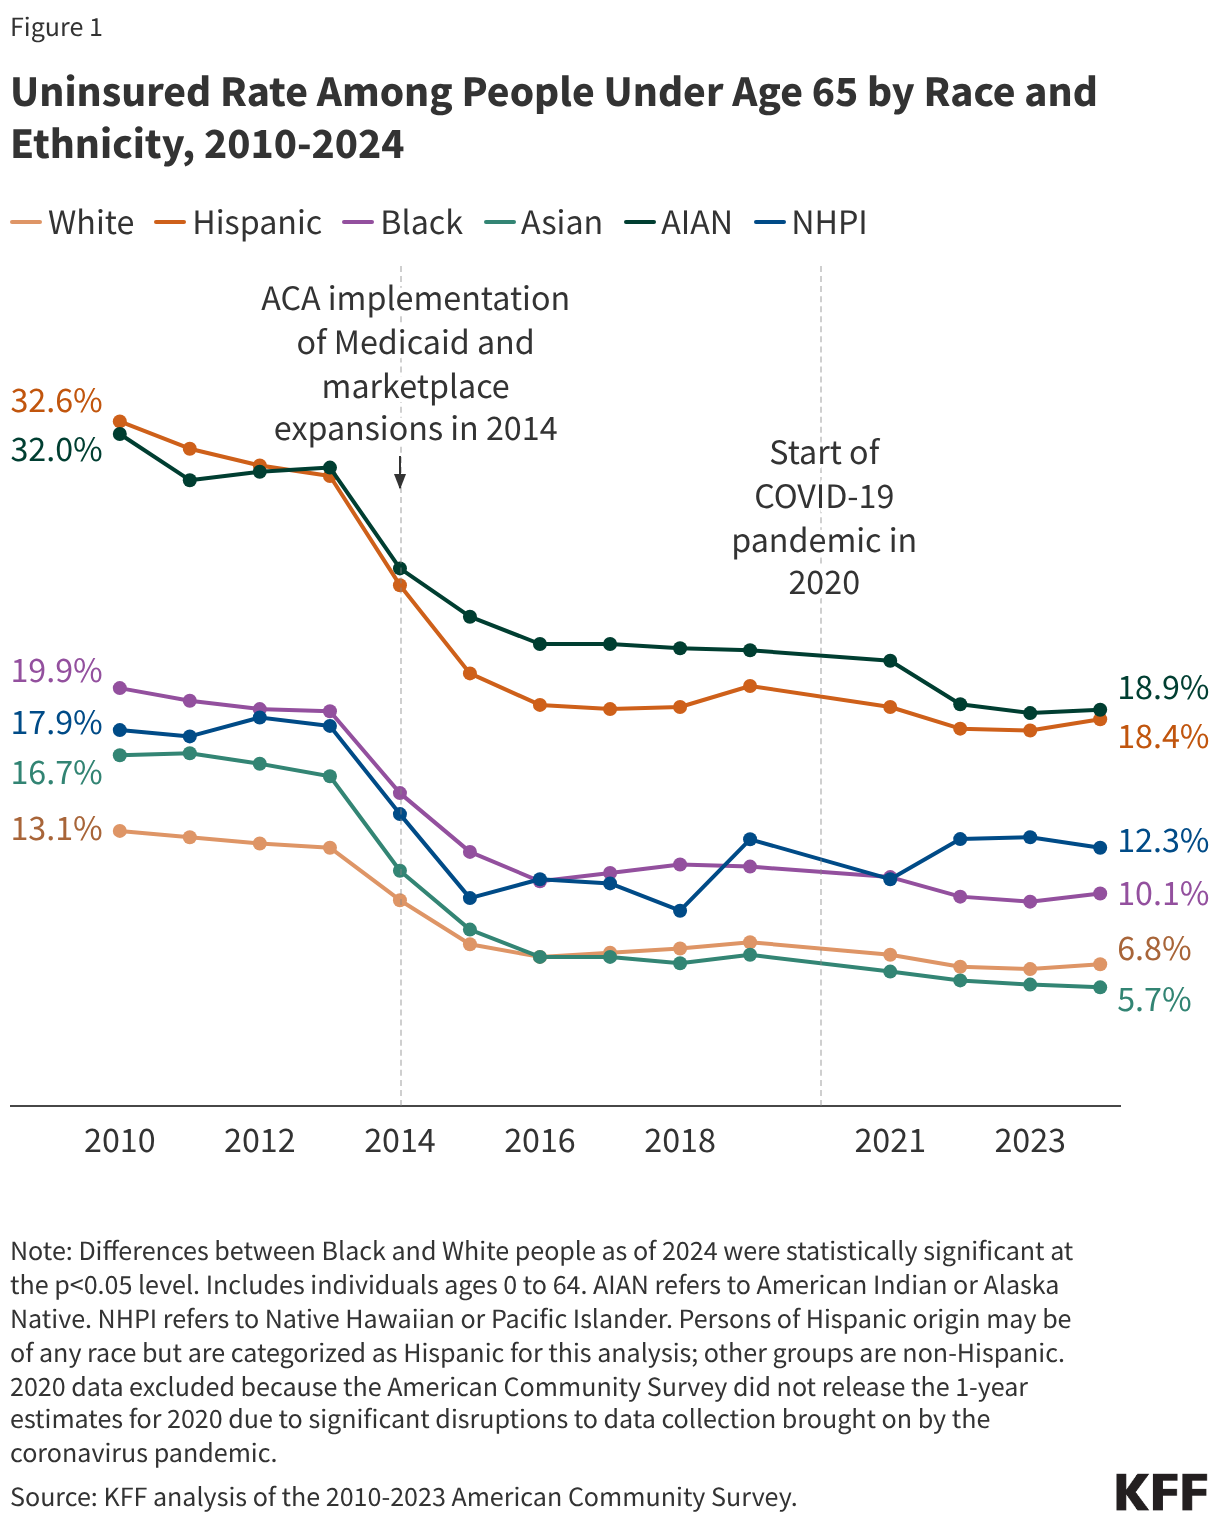
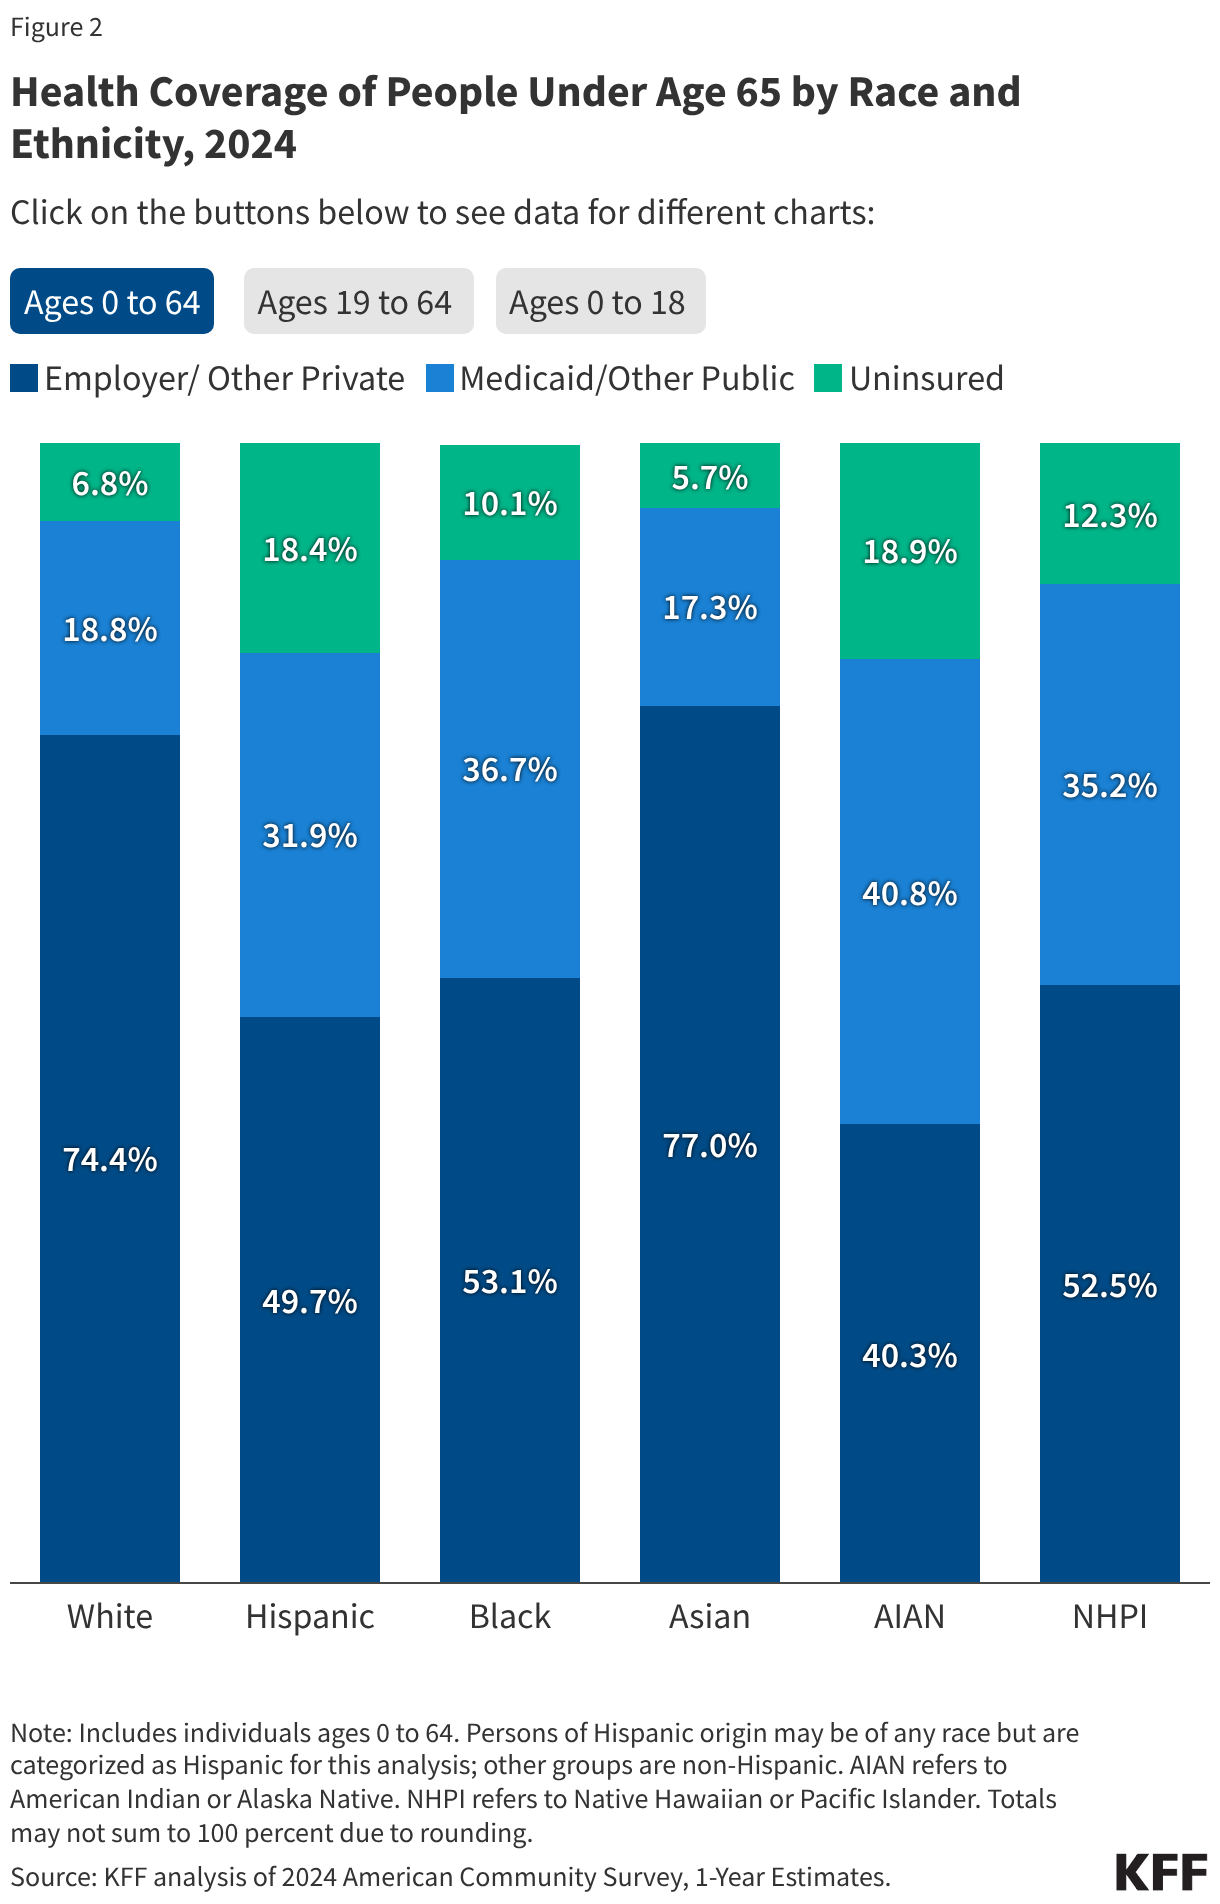
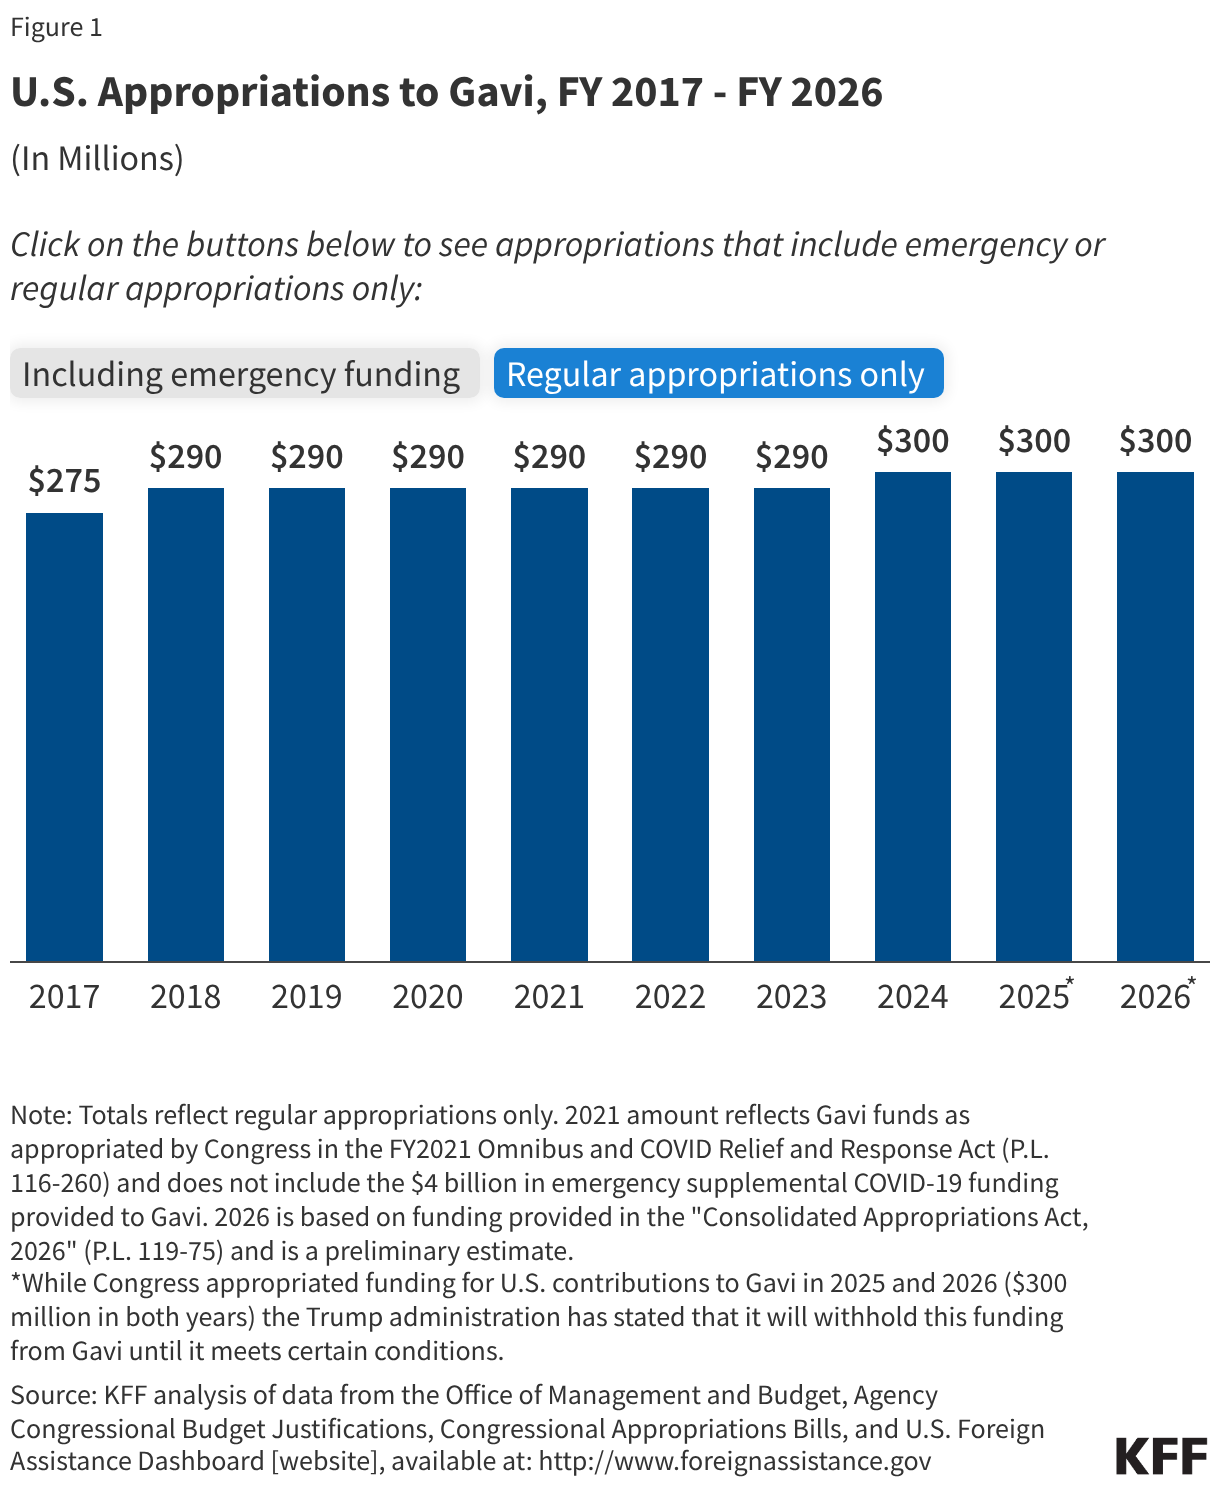
Even with these coverage limits on obesity drugs in place, utilization and gross spending on GLP-1 drugs for approved uses in Medicare and Medicaid have increased considerably in recent years. In 2024, there were 8.4 million prescriptions and $8.6 billion in spending on GLP-1s in Medicaid, and 21.8 million claims and $27.5 billion in gross spending (not excluding rebates) on GLP-1s in Medicare (Figure 1).
CMS is proposing temporary expansions of Medicare and Medicaid coverage of GLP-1s for obesity through demonstration programs
CMS initially proposed a two-step approach to expanding coverage of GLP-1s for obesity in Medicare – a temporary payment demonstration for 2026, known as the Medicare GLP-1 Bridge, and a new Center for Medicare and Medicaid Innovation (CMMI) model, known as the BALANCE Model, that was originally scheduled to begin in January 2027 and end in December 2031. CMS has recently announced an indefinite delay in implementation of the BALANCE Model, however, and an extension of the GLP-1 Bridge through the end of 2027 (as described below).
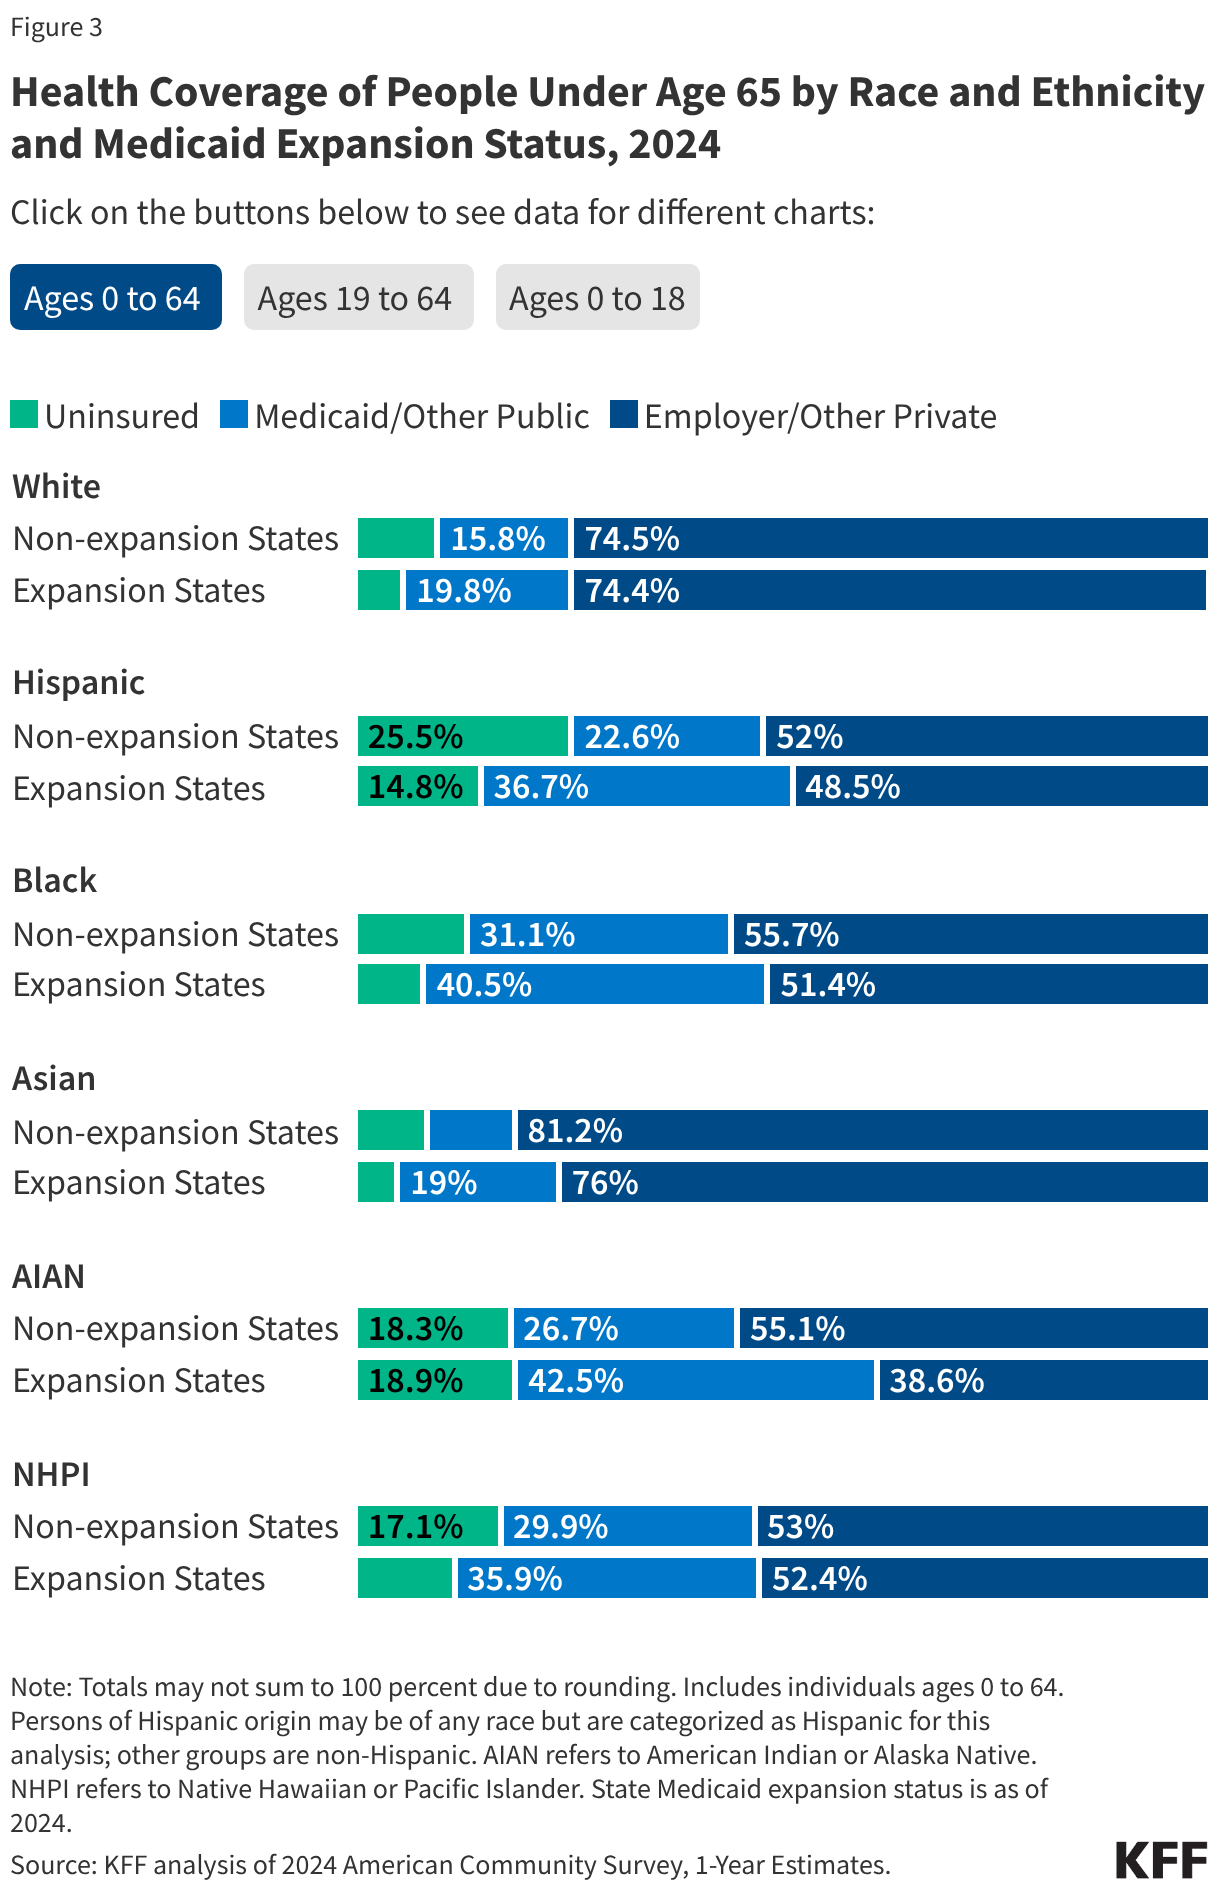
For Medicaid, GLP-1 coverage will be expanded through the BALANCE Model beginning in May 2026 and ending in December 2031. (See Figure 2 for a timeline of key activities associated with the GLP-1 coverage demonstrations.)
Medicare coverage of GLP-1s for obesity begins in July 2026 through the Medicare GLP-1 Bridge and will be extended through the end of 2027
CMS will provide Part D beneficiaries with coverage of select GLP-1s for obesity from July 1, 2026 to December 31, 2027 (originally December 31, 2026) through the Medicare GLP-1 Bridge, which is a short-term demonstration established using Section 402 demonstration authority. The Medicare GLP-1 Bridge is a nationwide demonstration program that will be separate from Part D coverage, meaning Part D sponsors will not have to opt into the demonstration for eligible beneficiaries to gain access, nor will Part D sponsors bear any financial risk for costs incurred by their enrollees associated with the demonstration.
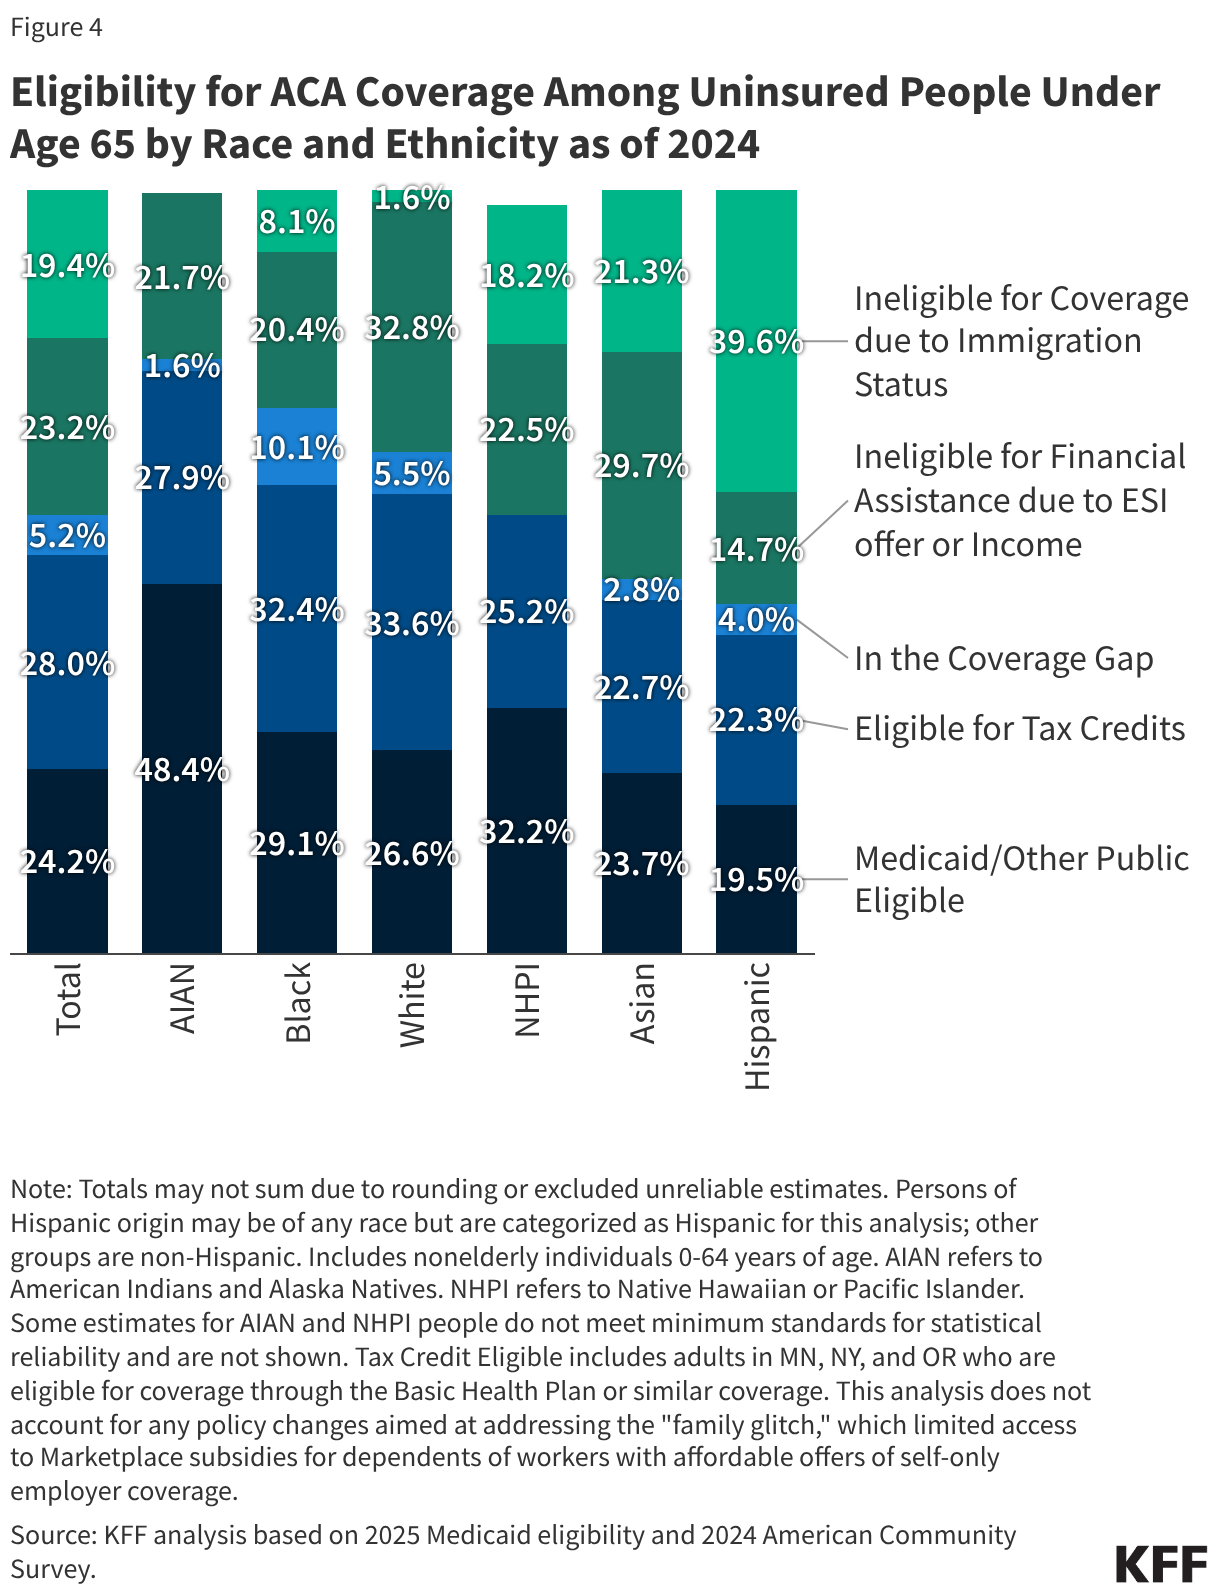
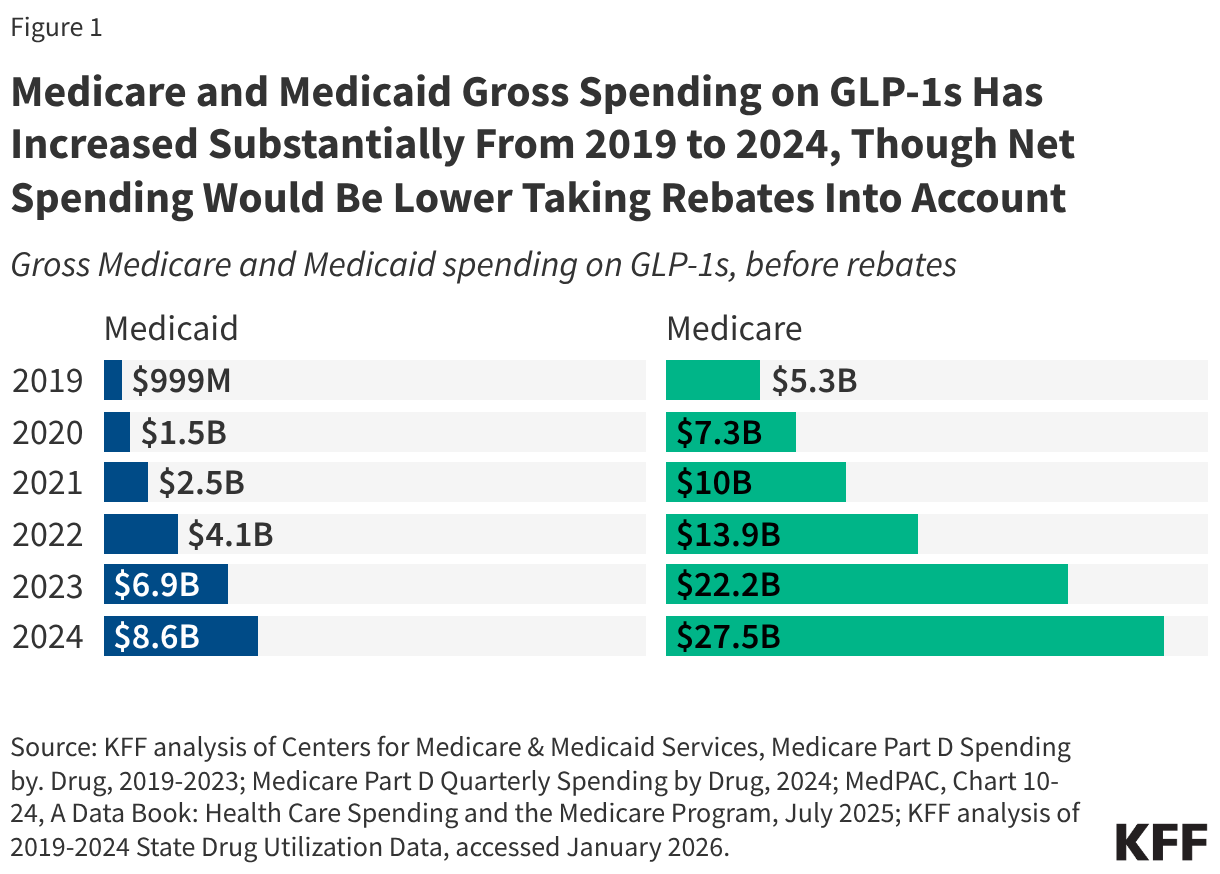
Medicare beneficiaries enrolled in Part D plans who meet the eligibility criteria will have access to GLP-1 medications approved for weight reduction (all formulations of both Foundayo and Wegovy and the KwikPen formulation of Zepbound) at a copayment of $50 per month. For a beneficiary to qualify, their provider must submit a prior authorization request that attests the beneficiary is being prescribed the drug to reduce excess body weight and ongoing maintenance of weight reduction and that they fall into one of three categories related to BMI and other clinical diagnostic criteria (Figure 3).
Manufacturers have agreed to provide eligible GLP-1s under the Bridge program at a net price of $245 per month supply. When participating beneficiaries fill a prescription for one of these drugs, pharmacies will collect the $50 copayment and submit claims to a central processor for reimbursement. Pharmacies will be reimbursed by CMS at no lower than the wholesale acquisition cost (WAC) of a drug, less the beneficiary copay, plus a dispensing fee and, as applicable, sales tax. Manufacturers will then owe money back to CMS for the difference between the WAC and the negotiated $245 net price.
Because this payment demonstration operates outside coverage under a Part D plan, the $50 copayment toward these medications will not count toward a participating beneficiary’s Part D deductible or the $2,100 out-of-pocket maximum in 2026 (increasing to $2,400 in 2027), and copayments will stay consistent at $50 per month, regardless of the Part D benefit phase a beneficiary is in when they fill the prescription. Medicare beneficiaries who are already receiving coverage from their Part D plan for a GLP-1 for a Medicare-covered use, such as type 2 diabetes, cardiovascular disease risk reduction, or sleep apnea, will continue to access the drug through their Part D plan and not through the Medicare GLP-1 Bridge, which will only provide coverage of GLP-1s when used for obesity.
For beneficiaries enrolled in the Low-Income Subsidy (LIS) program, the LIS cost-sharing subsidies will not apply in the Medicare GLP-1 Bridge. This may make it more difficult for low- and modest-income beneficiaries who are otherwise eligible to participate to take advantage of coverage under the short-term demonstration in 2026 and 2027 if the $50 monthly copayment is unaffordable.
At this time, it is uncertain how participating beneficiaries will be able to maintain Medicare coverage of their GLP-1 medication for obesity after the Medicare GLP-1 Bridge ends at the end of 2027, pending further action from CMS to implement the BALANCE Model in Medicare Part D in 2028, as described below.
The BALANCE Model was designed to expand coverage of GLP-1s for obesity in Medicaid and Medicare Part D
According to CMS, the BALANCE Model aims to increase access to GLP-1 medications and healthy lifestyle interventions to help people on Medicare and Medicaid improve their overall health. Under this model, CMS negotiated with manufacturers of GLP-1s to provide lower prices to the state Medicaid programs and Medicare Part D plans that choose to participate in the model. For beneficiaries to be eligible under the BALANCE Model, providers must attest that they meet certain clinical criteria, including qualifying for a GLP-1 for a currently covered use (such as type 2 diabetes, cardiovascular disease risk reduction, or sleep apnea) or for use to treat obesity based on similar clinical criteria as applied in the Medicare GLP-1 Bridge (Figure 3).
In addition to offering lower prices for GLP-1s, this model will provide patients with access to lifestyle support programs at no cost, which are intended to support medication adherence as well as increase GLP-1 effectiveness. (Details about these programs are not yet available.) These lifestyle support programs will be provided by participating manufacturers. As part of their agreements with CMS, the manufacturers must demonstrate how these lifestyle support programs will meet the program requirements, including encouraging healthy eating and increasing physical activity, supporting medication adherence, ensuring engagement with the program on a regular basis, and ensuring availability of this program to all patients receiving these medications, either online or offline for those who have limited digital access. However, prescribing providers will not be required to document that patients are actively participating in these lifestyle support programs as part of attesting to their eligibility for the model based on other clinical criteria.
Participation in the BALANCE Model is voluntary for drug manufacturers, state Medicaid programs, and Medicare Part D plans, but there was insufficient interest among Medicare Part D plans to move forward in 2027
Participation in BALANCE is voluntary for drug manufacturers, state Medicaid agencies, and Medicare Part D plans. The date for manufacturers to notify CMS of their interest in participating was January 8, 2026; for Medicare Part D plans was April 20, 2026; and for state Medicaid programs is July 31, 2026 (Figure 2).
On April 21, 2026, the day after the application deadline for Medicare Part D plan sponsors to participate in the BALANCE Model, CMS announced that it would not be moving forward with implementation of the BALANCE Model in Medicare in 2027 and instead would be extending the Medicare GLP-1 Bridge to run through the end of 2027. CMS said that this was in part to allow for collection of additional data on GLP-1 utilization to share with Part D plan sponsors ahead of potential implementation of BALANCE in Part D. CMS also stated they received feedback from plans that an extension of the BRIDGE would facilitate a smoother transition to potential implementation of BALANCE in Part D. At the same time, it was also reported that major Part D plan sponsors were reluctant or unwilling to participate in the BALANCE Model as it was originally designed. The discussion below of Medicare Part D participation in BALANCE reflects implementation details under CMS’s original design. However, implementation of this model in Medicare faces an uncertain future, since CMS has not yet announced specific plans to restart or restructure the model for future years. The delay in implementation of the BALANCE Model within Medicare Part D will not affect plans for implementation of the model within Medicaid beginning in 2026.
Drug Manufacturers
During the model pre-implementation period in early 2026, CMS negotiated with Novo Nordisk and Eli Lilly to come to agreement on the key parameters of the model, including details about pricing of the model drugs, cost sharing, rebate calculations, access policies (i.e., coverage criteria and prior authorization policies), the length of the agreement, data sharing arrangements, and agreement on lifestyle supports that will be offered. Both manufacturers have agreed to participate in the model, and the following medications will be included: all formulations of Foundayo, Mounjaro, Ozempic, Rybelsus, and Wegovy, and the KwikPen formulation of Zepbound. The manufacturers have agreed to a $245 net price per 30-day supply for all model drugs in 2027 for the Medicare program though the net price for state Medicaid programs is confidential to the public. CMS and manufacturers may renegotiate terms in the future depending on certain circumstances such as changes in the FDA labeling, new clinical evidence, or new products launched.
State Medicaid Programs
Participation. For state Medicaid agencies that opt to participate in the model, implementation will be on a rolling basis from May 1, 2026 through January 1, 2027. To participate in the model, state Medicaid programs must sign a State Agreement with CMS and then adopt supplemental rebate agreements (SRAs) with each participating manufacturer that reflects the standard key terms that the participating manufacturers and CMS have agreed to. While states typically develop their own utilization management strategies, the model key terms establish standardized coverage criteria (Figure 3). States may offer broader coverage but cannot make coverage criteria more restrictive, and the Medicaid key terms must apply equally in both fee-for-service and Medicaid managed care. Although the Medicaid component of the BALANCE Model will launch May 1, the deadline for the state Medicaid agency Request for Applications (RFA) is July 31, 2026.
Cost. The discounted GLP-1 net price for state Medicaid programs will be available through additional supplemental rebates (on top of statutory rebates through the MDRP). To participate in the model, state Medicaid programs must terminate or update any existing SRAs with participating manufacturers. While the original announcement of the MFN deals with Eli Lilly and Novo Nordisk noted Medicaid programs would also have access to the $245 price available to Medicare, the final negotiated discounted price available to state Medicaid programs mentioned in the state Medicaid RFA is not available to the public, only participating states. The model will not affect out-of-pocket costs for Medicaid enrollees, which are limited to nominal amounts under federal law.
Medicare Part D Plans
Participation. Part D plan sponsors needed to apply to participate in the model by April 20, 2026. Participants could include sponsors of Part D stand-alone prescription drug plans (PDPs) and Medicare Advantage prescription drug plans (MA-PDs), including Special Needs Plans (SNPs), and employer plans that offer Part D. Eligible plan types exclude Defined Standard benefit plans, which charge a standard 25% coinsurance amount for all covered drugs and do not vary cost sharing by drug type or formulary tier, although plan sponsors could indicate if they wished to convert a Defined Standard benefit plan to another basic benefit type in order to become eligible. Participation was defined at the plan sponsor level, and plan sponsors could choose which of their specific plan benefit packages would be part of the model. However, CMS required plan sponsor participants to include all of their enhanced alternative plans and 90% of their enrollment in basic plans.
CMS was aiming for a “critical mass” of Part D sponsors to participate and established a threshold participation rate of 80% for 2027. This participation rate was to be calculated as the enrollment in Part D plans applying to participate in the model divided by the total enrollment in all Part D plans, excluding special needs plans and employer plans, even though they are eligible to participate in the model, but including Defined Standard benefit plans, even though they are ineligible to participate. (This calculation could produce a different participation rate than if it was based on enrollment in all participating plans divided by enrollment in all plans eligible to participate. CMS did not explain the rationale behind their approach.) CMS specified that if the 80% threshold was not met, CMS would not move forward with the BALANCE Model in Medicare in 2027, and that appears to be what occurred, as CMS’s April 21, 2026 announcement suggests.
Cost sharing. Part D plans must adopt specific cost-sharing limits under the basic benefit plan structure as agreed upon by CMS and manufacturers. Cost sharing for model drugs will be limited to $245 for a 30-day supply in the deductible phase and a lower amount in the initial coverage phase: $50 per month for enhanced plans and employer group plans and $125 per month for basic plans (though plan sponsors can choose to apply lower cost-sharing amounts to model drugs as long as they do so uniformly across all model drugs). Once beneficiaries reach their out-of-pocket maximum (set at $2,400 in 2027), they will pay $0 for their medications, including for model drugs. Part D plans participating in the model are required to place all model drugs on the same formulary tier, cover all medically accepted indications for model drugs, and apply the same cost sharing to all indications.
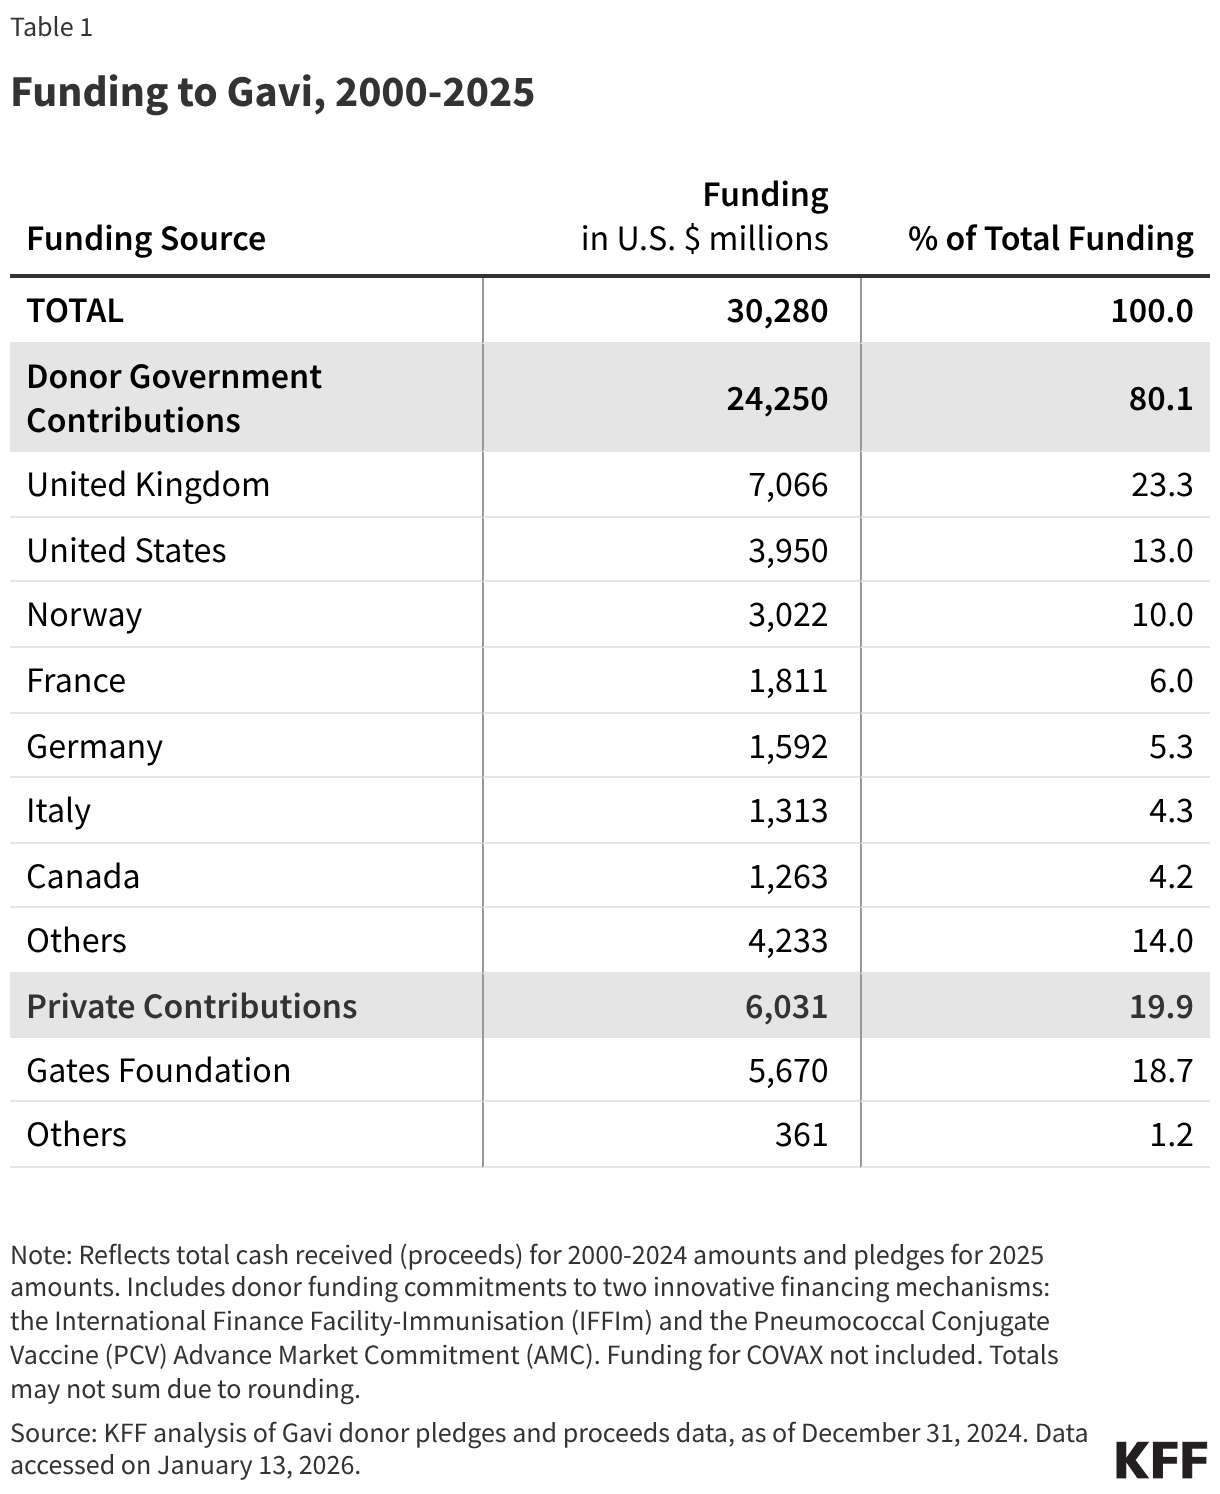
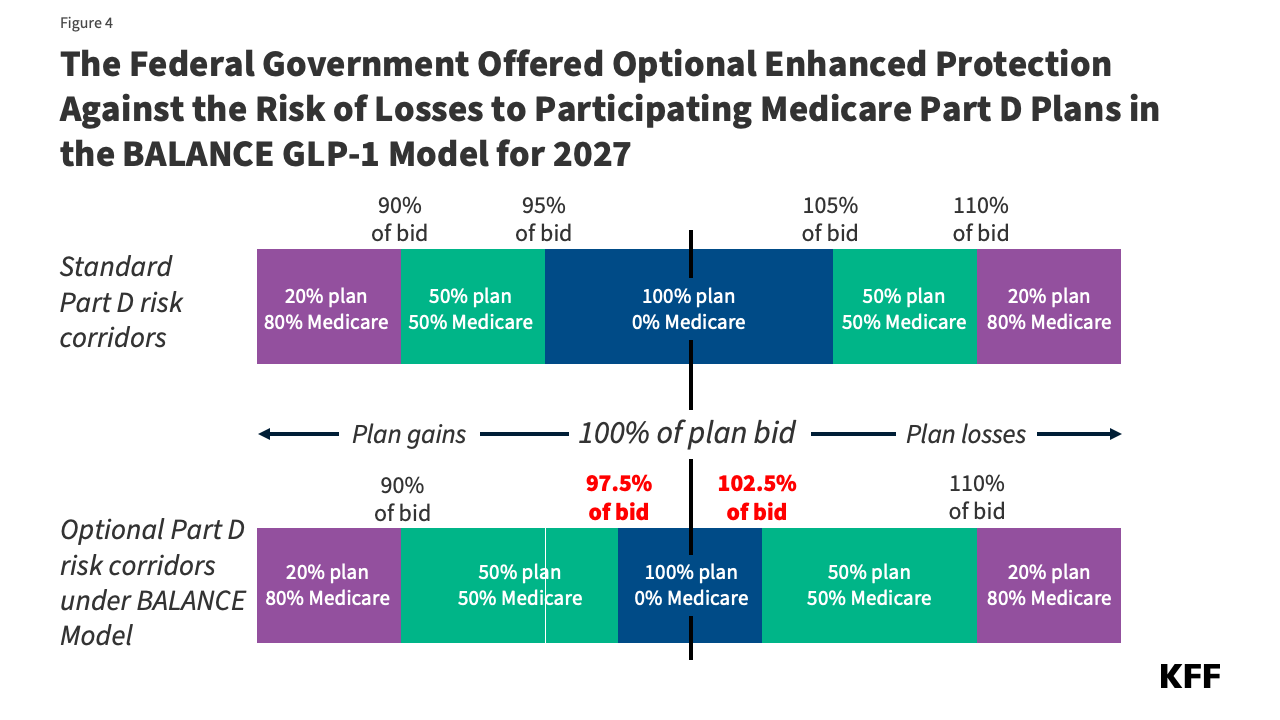
Participation incentives. Because the model was voluntary for Part D plan sponsors, CMS designed financial incentives to encourage plan participation. The primary approach to encourage participation for 2027 involved an optional narrowing of the risk corridor thresholds to reduce the range of spending where PDPs bear full risk for actual costs higher than their bids (Figure 4). Model participants would qualify for this additional financial protection if they opted in and had higher-than-average utilization of model drugs relative to other similar plan participants. CMS initially stated that for future model years, the agency was considering additional payment incentives, including higher direct subsidy payments based on an adjustment factor to the beneficiary risk score in participating plan bids.
Millions of people with Medicare and Medicaid could benefit from expanded coverage of GLP-1s for obesity
Overall, CMS’s efforts to expand Medicare and Medicaid coverage of GLP-1s for people with Medicare and Medicaid could greatly expand access to these drugs, albeit on a temporary basis, depending on the level of participation by drug manufacturers, state Medicaid agencies and Part D plans. In addition to providing coverage of these drugs for obesity, which would be a new indication in Medicare and in most states under Medicaid, these efforts will also allow beneficiaries in participating states and Part D plans to access GLP-1s for obesity at a lower out-of-pocket cost than if they were to purchase them with cash at the direct-to-consumer prices offered by the manufacturers. Additionally, this model will provide access to a lifestyle support program to promote healthy behaviors and increase the effectiveness of GLP-1s, which could provide improvements in health along with sustained weight reduction.
However, there are factors that could limit the reach of these temporary programs for both the Medicaid and Medicare populations. For example, if the level of participation by state Medicaid agencies is relatively low, the impact of this model for Medicaid recipients may not be very far reaching. In addition, state Medicaid agencies can choose to participate in the model initially but then decide to drop out of the model in later years, which could result in disruptions in coverage. And there is no clear path forward for GLP-1 coverage in Medicare after 2027 if the Medicare GLP-1 Bridge is not extended further and the BALANCE Model is not implemented. This sets up the possibility that Medicare beneficiaries could have coverage of GLP-1s for obesity under the Medicare GLP-1 Bridge in the latter half of 2026 and 2027 but then lose access in 2028 if the BALANCE Model or another coverage pathway are not implemented.
If the BALANCE Model launches in some future year with at least 80% participation, Part D plans could drop out of the model before the final year (originally 2031), which could interrupt treatment, or require frequent plan changes for Medicare Part D enrollees to maintain access. It is also unclear whether Part D plan sponsors would be able continue to cover GLP-1 drugs for the treatment of obesity once the model ended if Medicare’s statutory exclusion on weight loss drugs is not lifted.
Another uncertainty for Part D enrollees in terms of their out-of-pocket costs is the impact of the BALANCE model on Part D premiums. Participating plan sponsors would factor the cost of the model into their bids. That could have the effect of increasing Part D premiums across the board, although Medicare Advantage plans can use rebates to buy down Part D premiums, but this is not an option for stand-alone PDPs. It is possible that CMS could modify the parameters of the Part D PDP premium stabilization demonstration to provide greater premium subsidies for PDP plan sponsors that participate in the BALANCE Model. The ultimate effect on Part D plan bids and premiums is unknown at this time.
The potential federal and state budgetary impacts of expanded coverage of GLP-1s for obesity in Medicare and Medicaid are unknown
CMS documentation does not include potential federal or state budgetary impacts from either the BALANCE Model or the Medicare GLP-1 Bridge. Spending on GLP-1 drugs for currently covered uses under Medicare and Medicaid has increased substantially in a relatively short period of time and could increase further with expanded coverage of GLP-1s for obesity, even at the lower net prices for these medications under both demonstrations. The cost to Medicare of covering obesity drugs under Part D has been estimated at between $25 billion and $35 billion over 10 years, which could have been a driving factor in the reluctance or unwillingness of major Part D plan sponsors to participate in the BALANCE model as it was originally designed. The cost to Medicaid of covering obesity drugs has been estimated at $15 billion, with the federal government paying $11 billion and states paying nearly $4 billion of this estimated total.
The law requires Innovation Center models to either maintain or reduce program expenditures. The BALANCE Model is designed to test whether lower negotiated prices as applied to currently covered indications will lower program spending. It is unclear how the new negotiated prices under the model for state Medicaid programs (which remain confidential) compare to the net prices state Medicaid programs are currently paying for these drugs, but Medicaid already typically pays lower prices than other payers for prescription drugs. In general, without knowing what Medicaid and Medicare generally are currently paying for these drugs on net, it is uncertain whether the lower prices that will be made available to state Medicaid programs and Part D plans under the BALANCE Model for currently covered uses of GLP-1s will generate enough savings to offset the additional costs from expanded use of these medications for obesity. If state Medicaid programs estimate the costs from expanded use will outweigh the savings, initial state Medicaid participation may be limited, especially given recent state budget challenges and federal funding cuts. Based on the reluctance of major Part D plan sponsors to participate in the BALANCE Model in 2027 under the original specifications, it appears that sponsors had insufficient data to estimate their added costs associated with covering GLP-1s for obesity.
Evaluations of the model will also determine whether improvements in health related to the use of these drugs and associated reductions in health care utilization are significant enough to maintain or reduce health care costs in the Medicaid and Medicare programs, after taking into account expanded use and coverage of GLP-1s for the treatment of obesity. Even with lower prices, there is little evidence to date to suggest that the expanded use of GLP-1s will be offset by lower spending on other health care services in the short term, even though the drugs do provide significant health benefits to users.
The cost of the Medicare GLP-1 Bridge is not discussed in CMS documentation about this demonstration. Federal spending is expected to increase under this demonstration due to paying for GLP-1s for obesity, which is not currently covered under Medicare, but the amount of the increase is unknown since CMS hasn’t disclosed the projected cost. In addition, because the demonstration will operate outside the Part D benefit, the manufacturers won’t be responsible for providing the manufacturer price discount on eligible GLP-1s (10% in the Part D initial benefit phase and 20% in the catastrophic phase.) While many prior section 402 demonstrations have had to conform to budget neutrality rules by the Office of Management and Budget (OMB), some demonstrations have been able to move forward without this requirement. Given the short timeframe of the GLP-1 demonstration, it is unlikely that there will be cost offsets from improved health due to increased GLP-1 use for obesity that can be documented.
This work was supported in part by Arnold Ventures. KFF maintains full editorial control over all of its policy analysis, polling, and journalism activities.