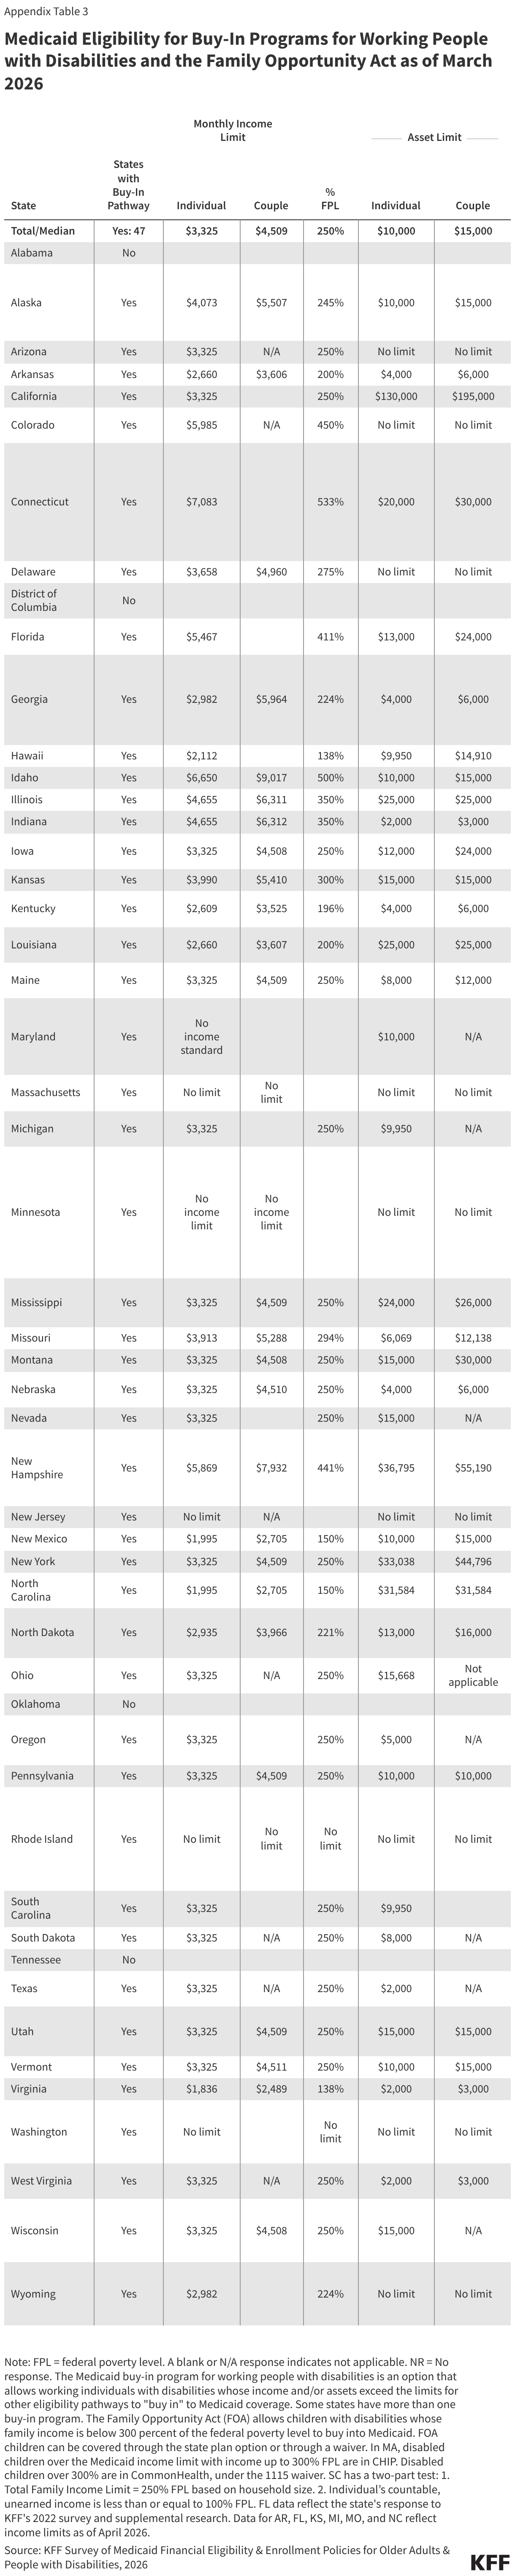
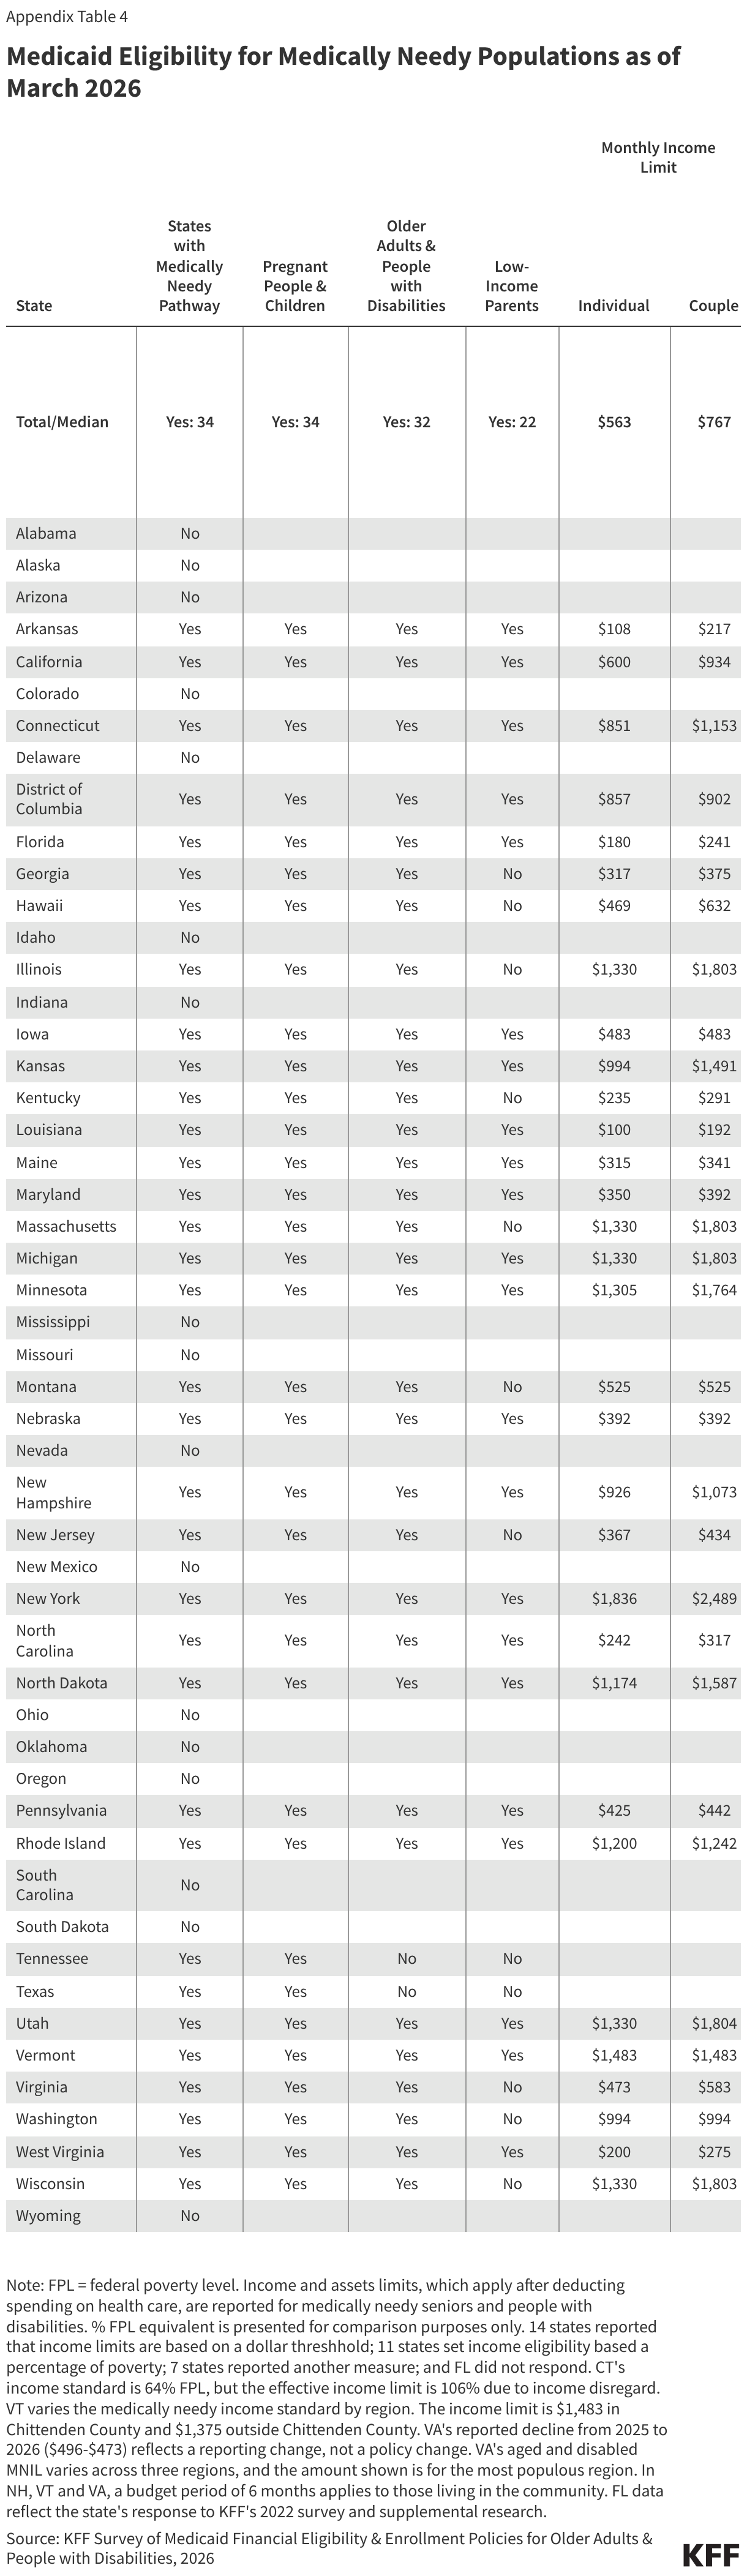
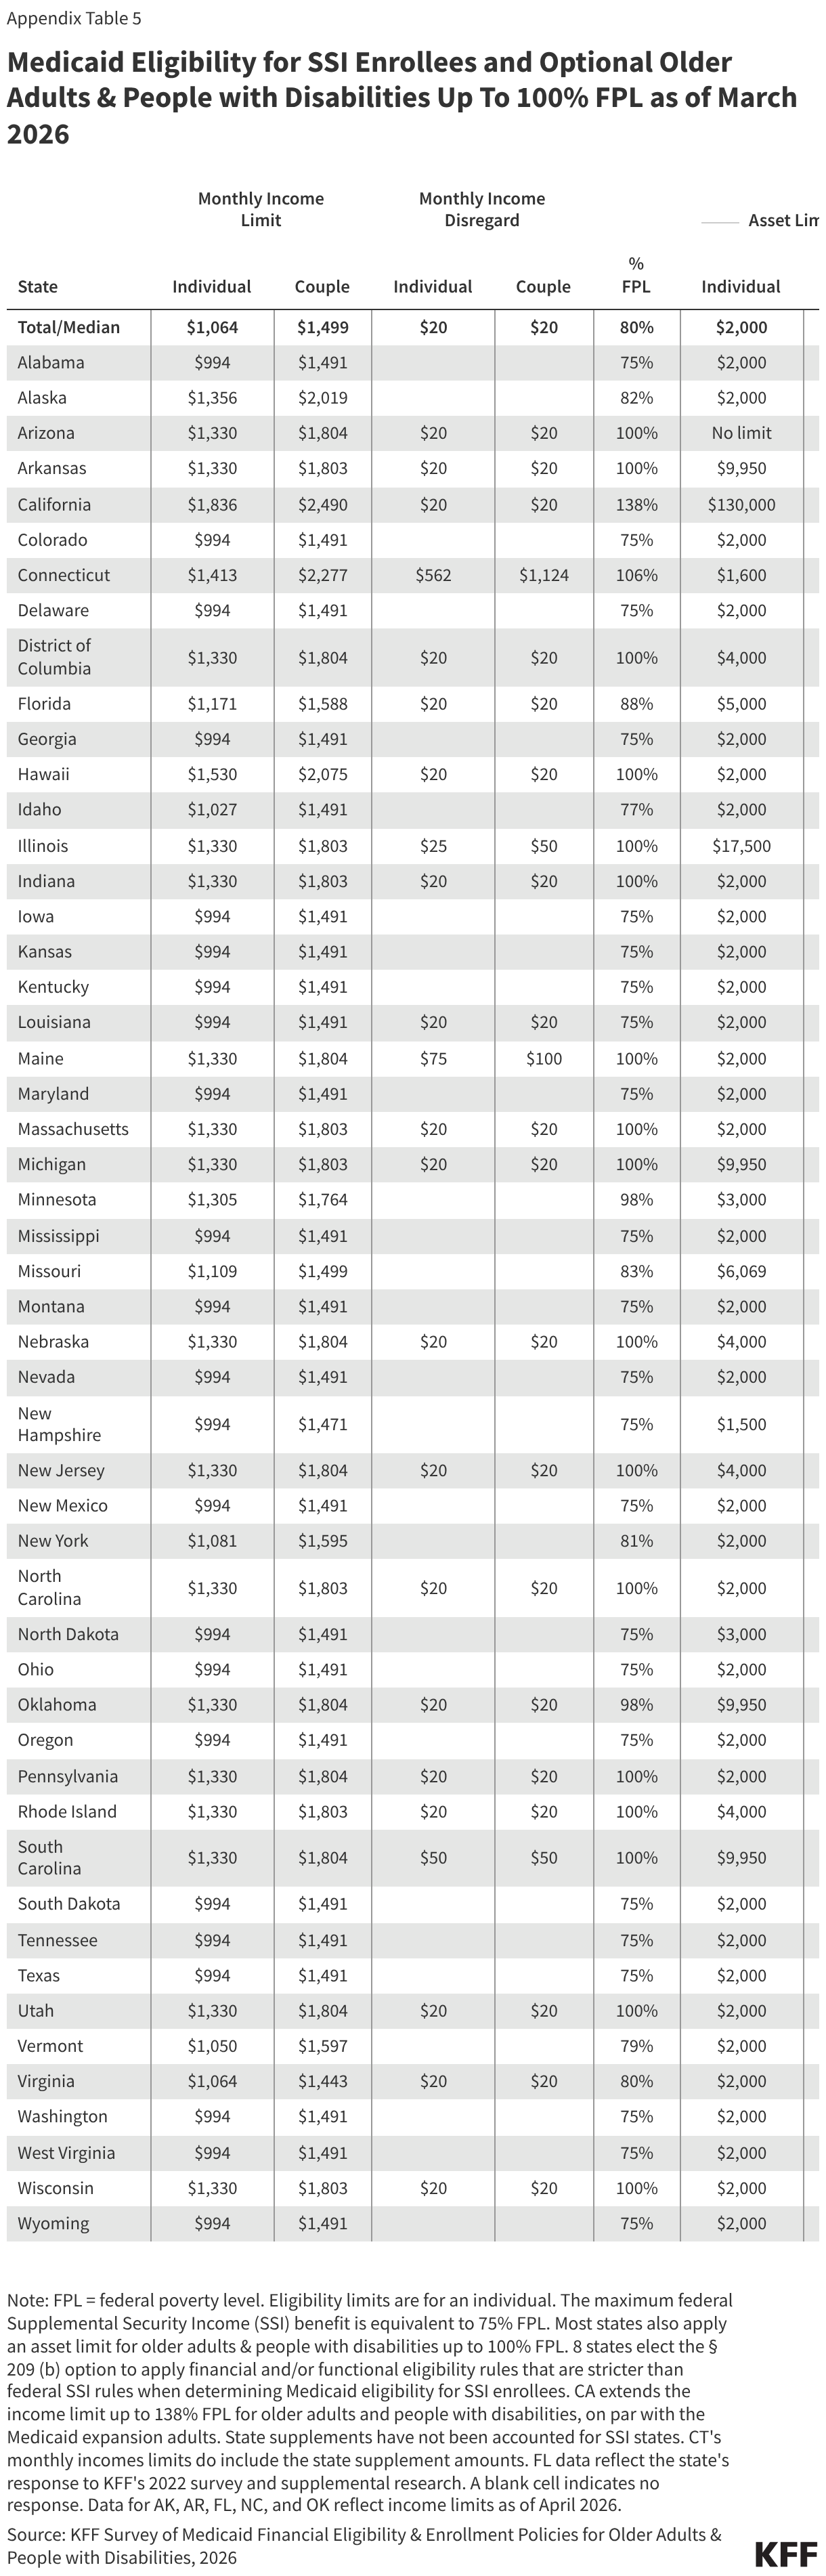
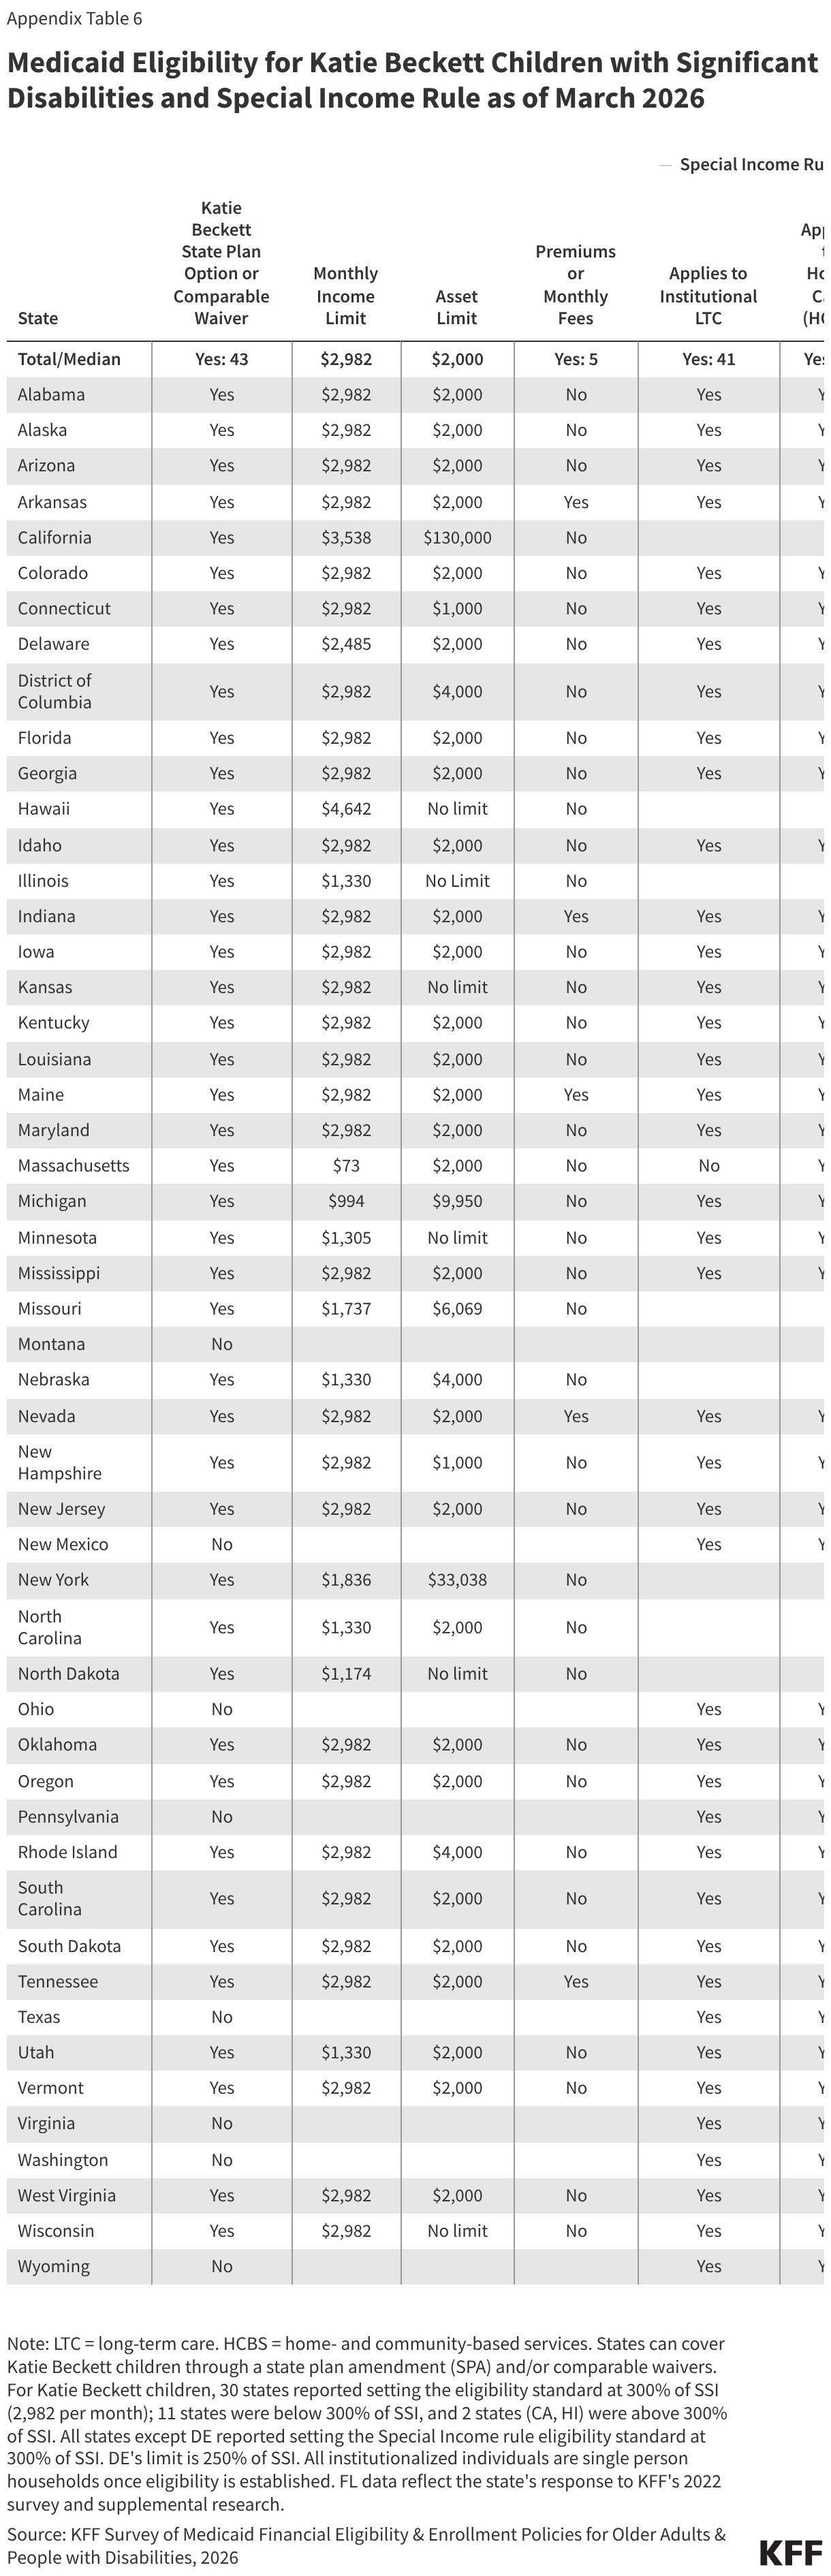
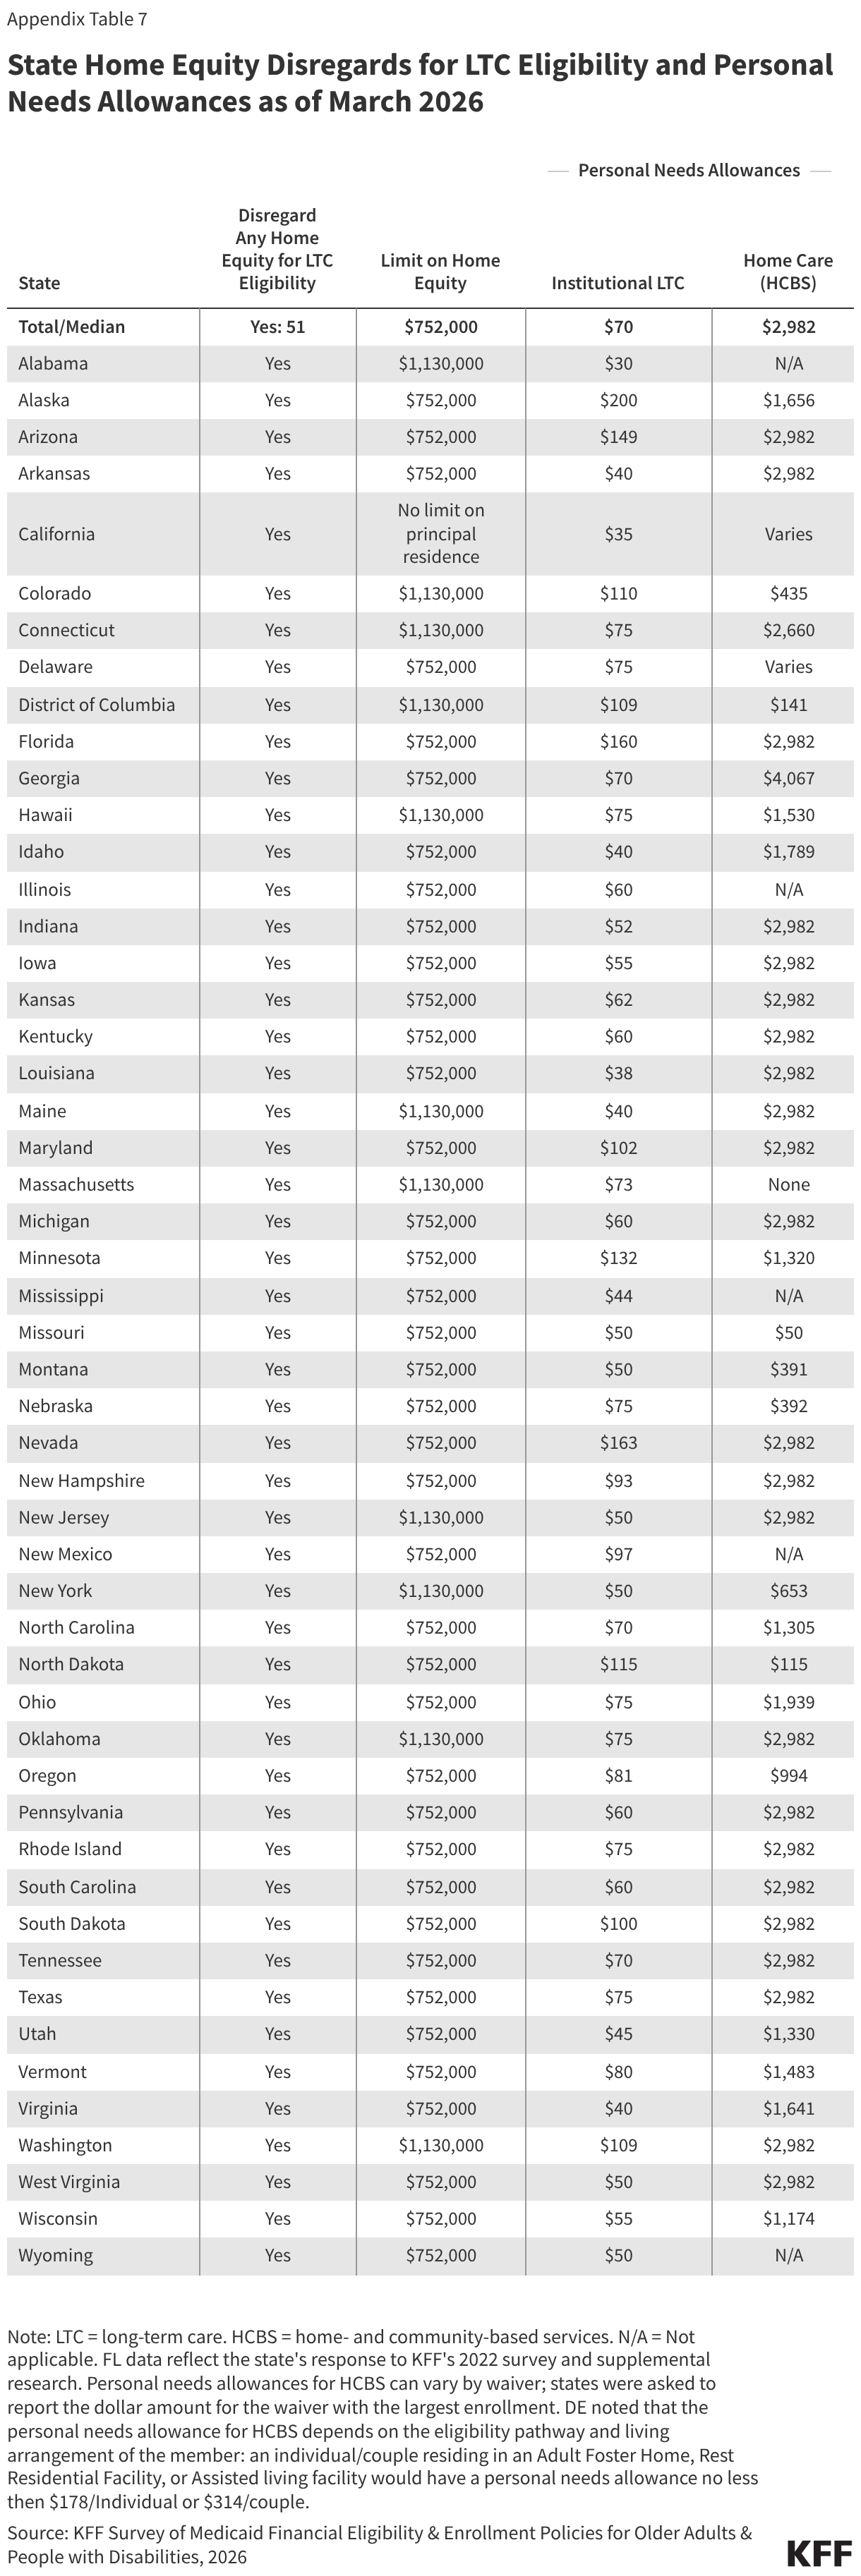
Eligibility Policies
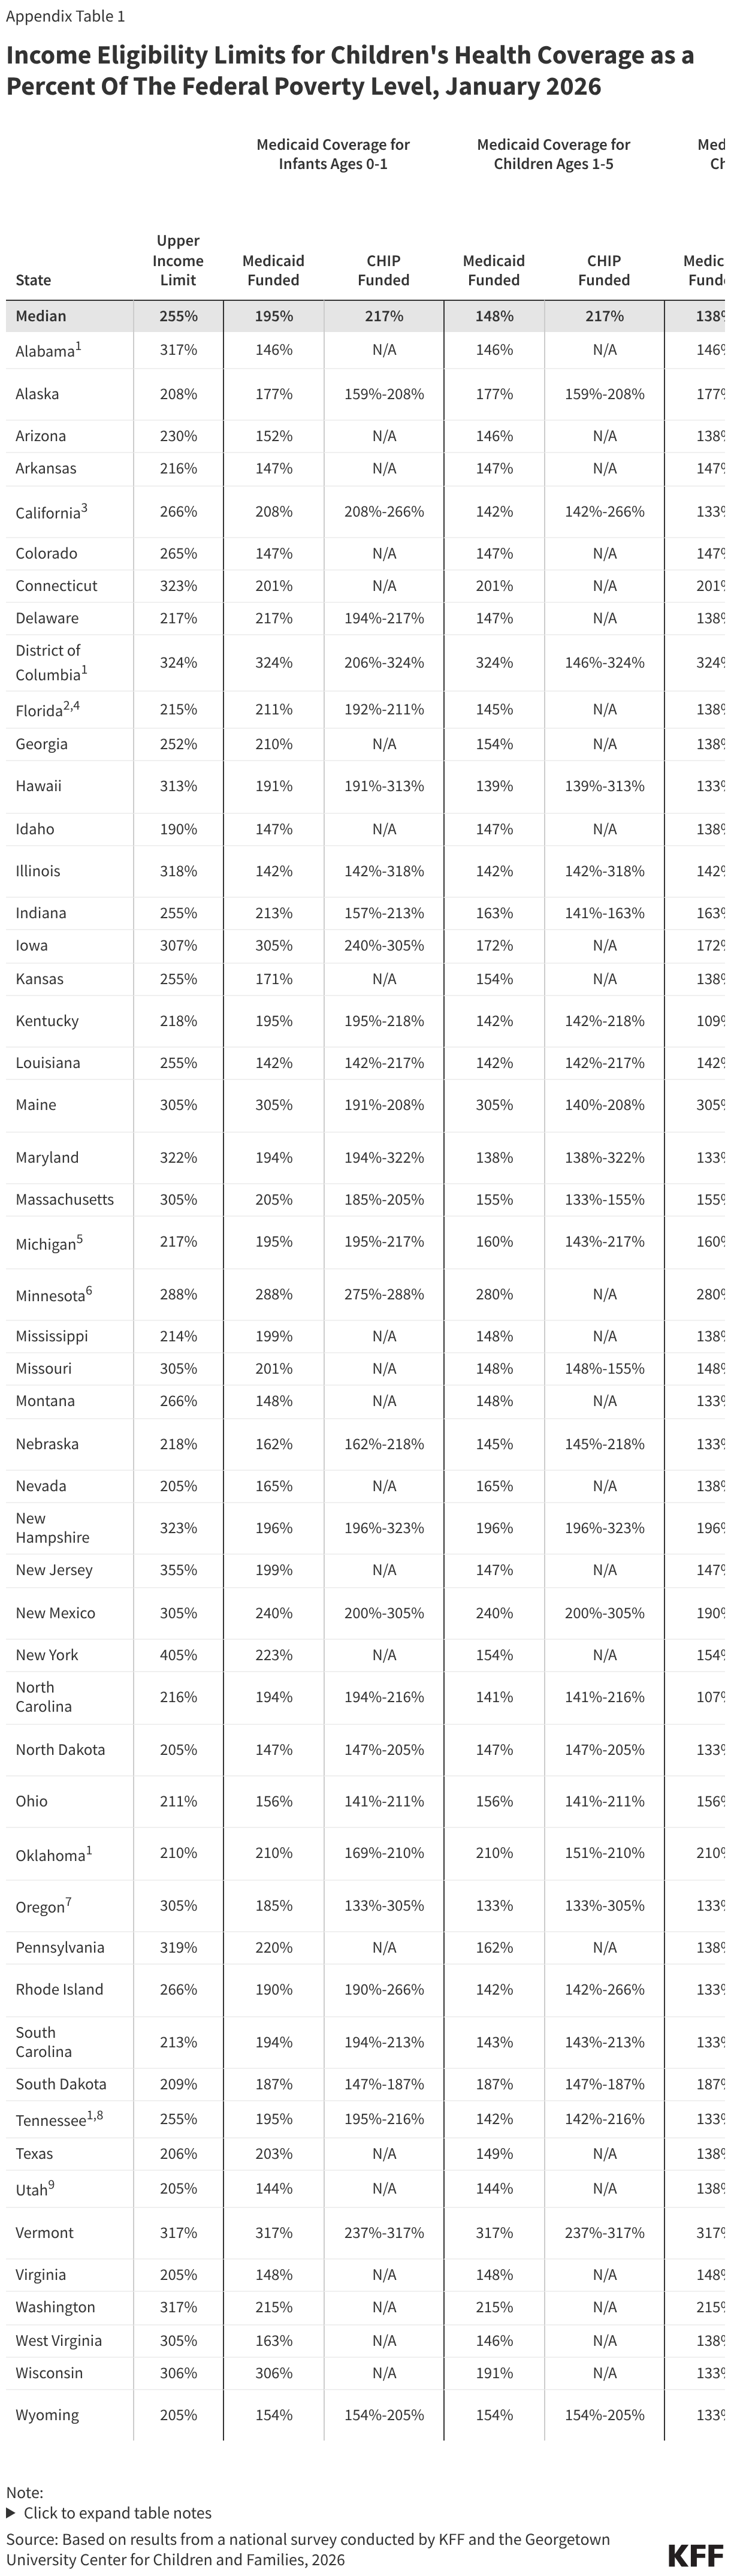
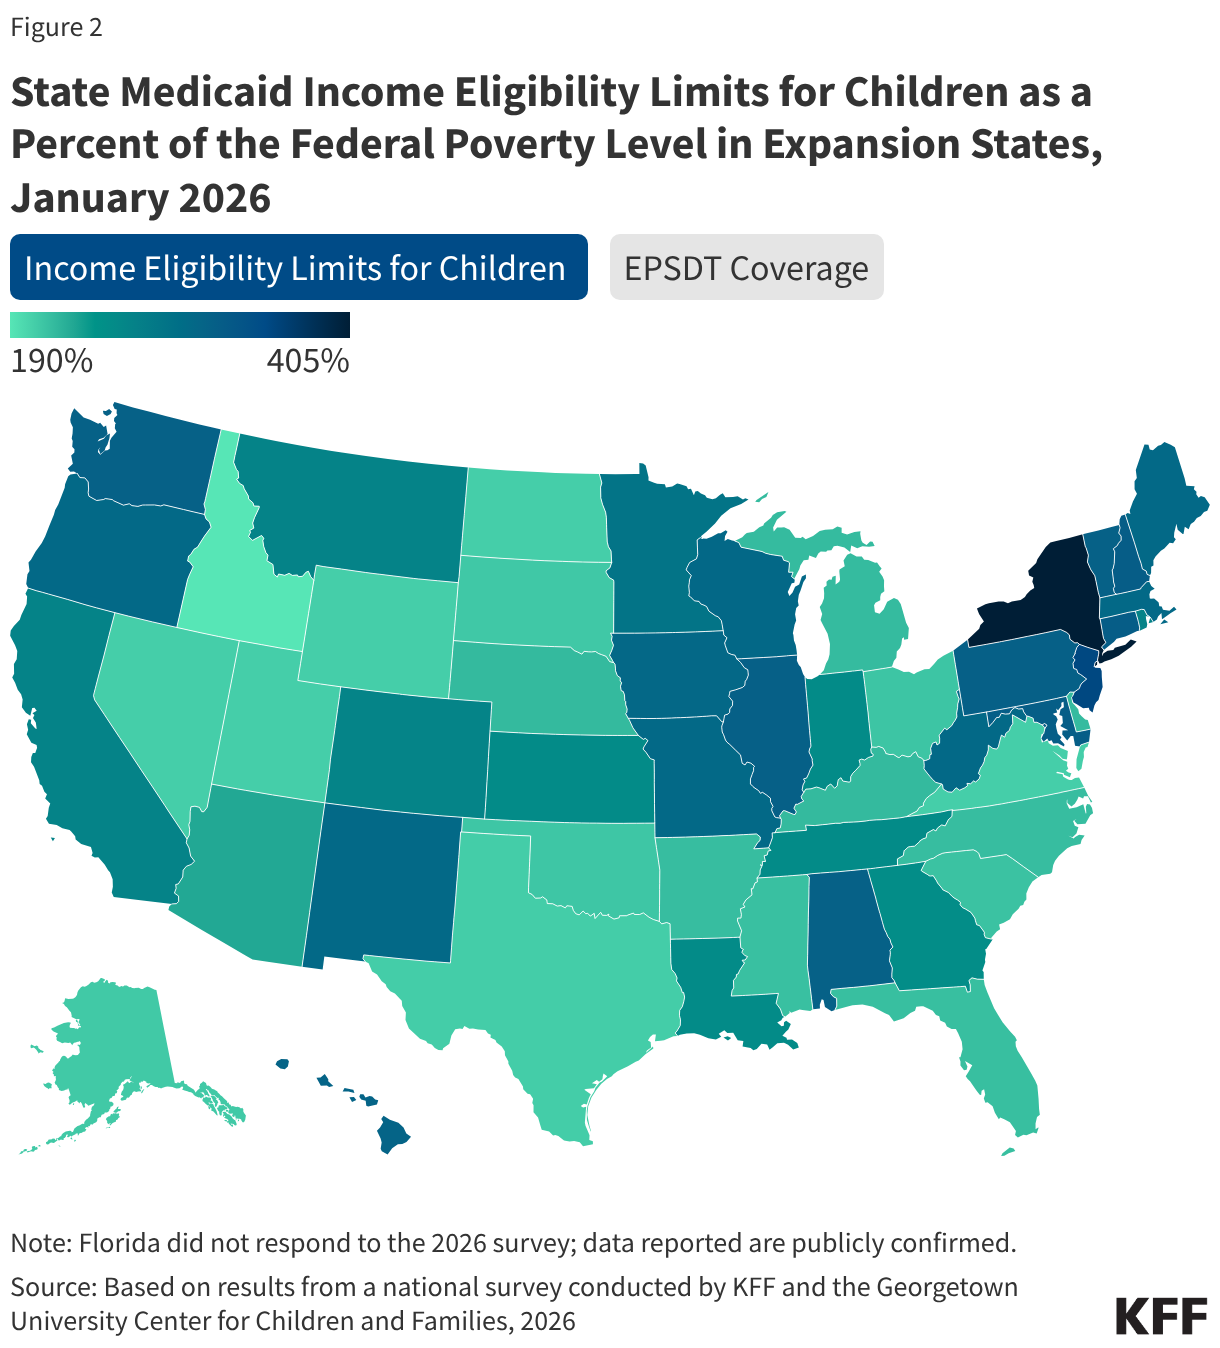
The median eligibility level for children remains unchanged from prior years at 255% FPL, though the transition from separate CHIP program to a CHIP-funded Medicaid expansion among some states continued. Oregon transitioned its separate CHIP program for children to a CHIP-funded Medicaid expansion (M-CHIP). In M-CHIP states, children who are income eligible for CHIP receive all the benefits and protections associated with Medicaid; however, the child must be previously uninsured for the state to claim the enhanced federal match for CHIP. Utah also plans to convert its separate CHIP program to M-CHIP in mid-2026, which will bring the total to 23 M-CHIP states, up from 18 states 2016. Although not required to do so, 14 of 28 states with separate CHIP programs for children provide full Medicaid (EPSDT) benefits (Figure 2).
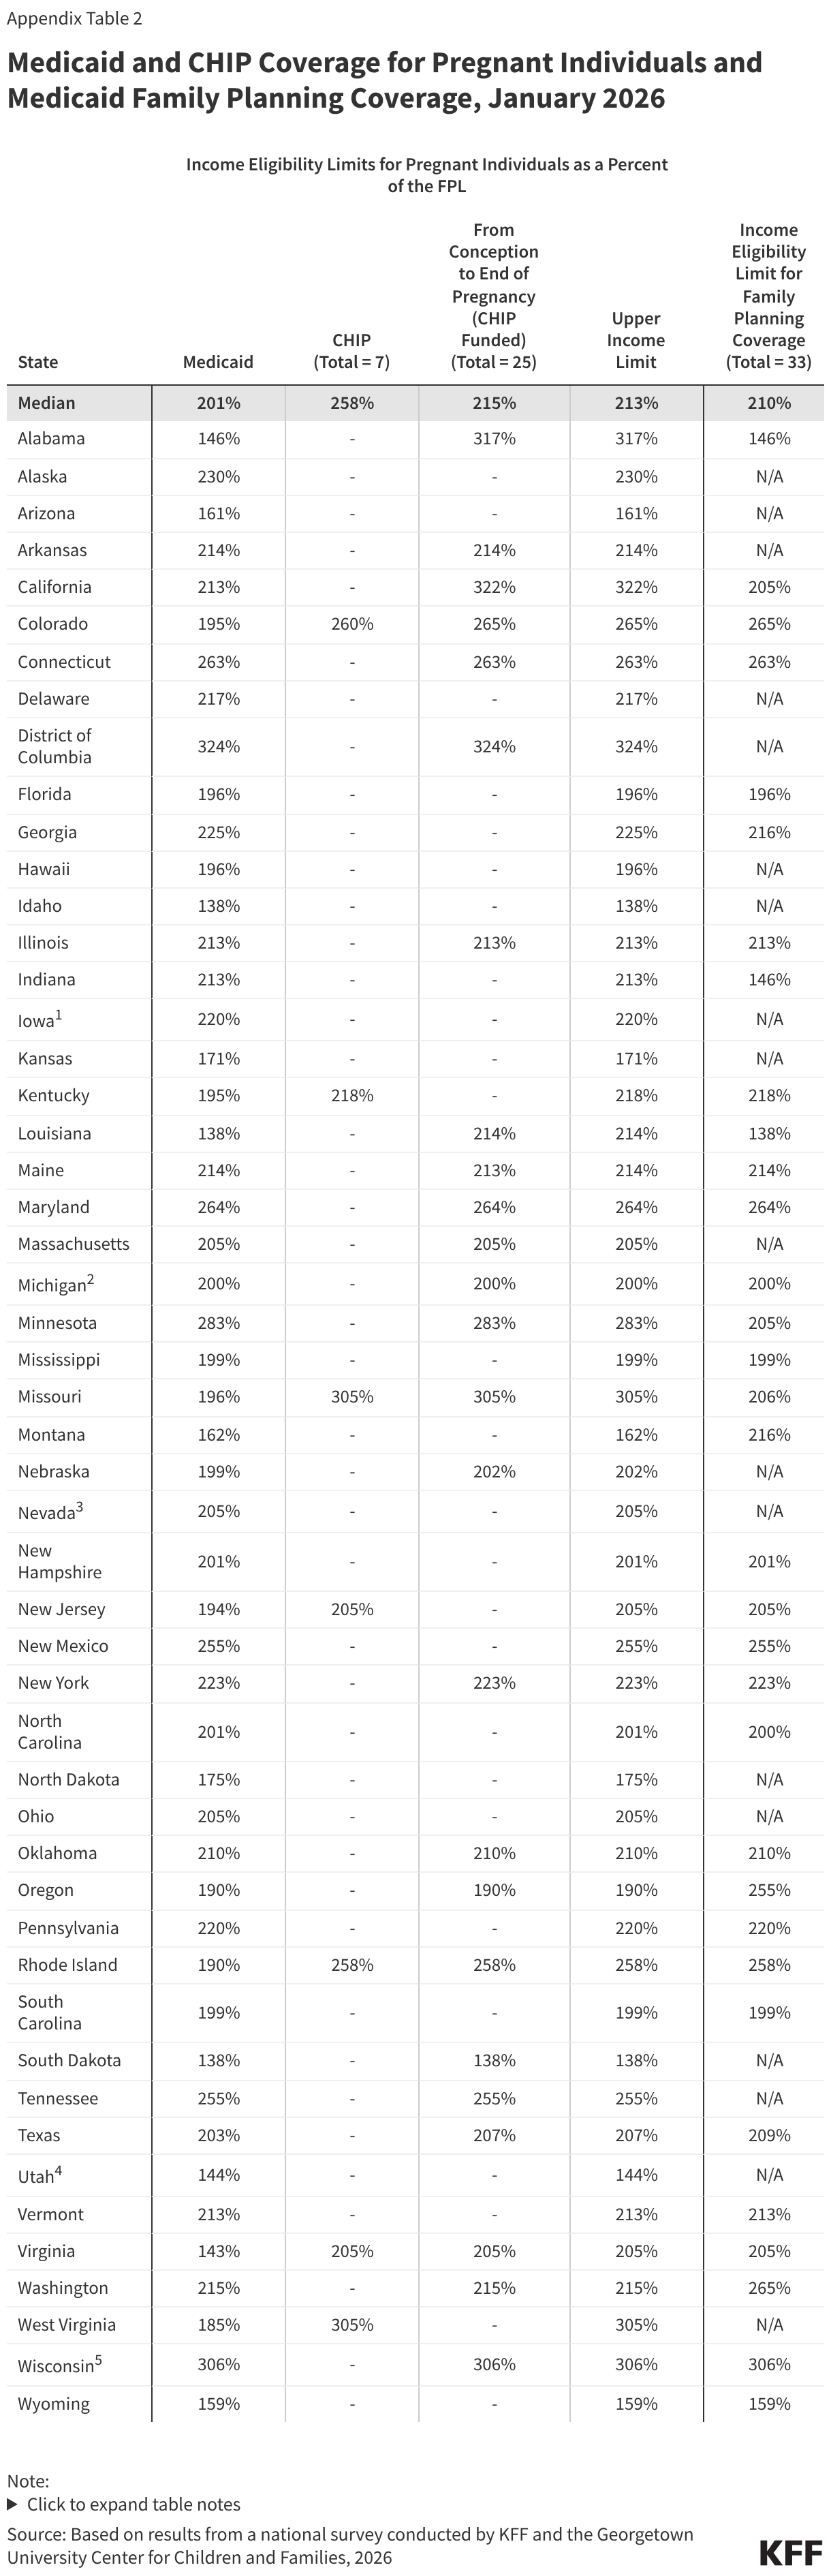
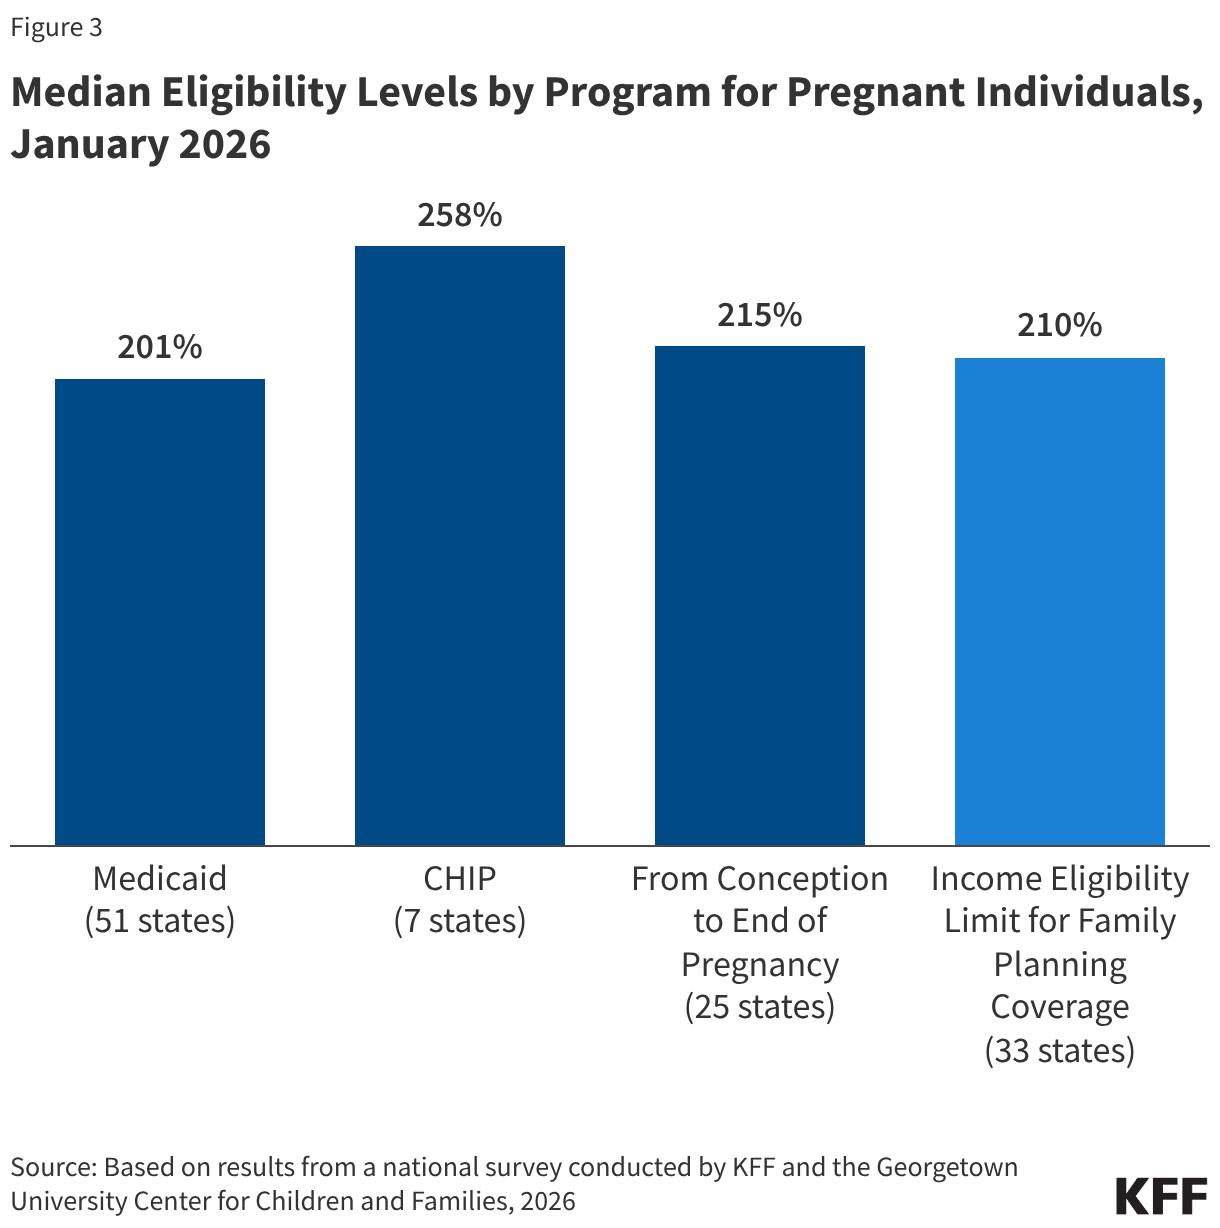
States must cover pregnancy for individuals with income up to 138% FPL, but most states (38) have an upper income limit for pregnancy coverage at or above 200% FPL. The upper income limit is the highest pregnancy income threshold among three pathways: Medicaid (all states), CHIP expansion for pregnancy (7 states), and CHIP-funded From Conception to the End of Pregnancy coverage (25 states) (Figure 3). The median eligibility level for pregnancy is unchanged at 213%. Two thirds of states (33) use federal funds through the Medicaid state plan option or a Section 1115 waiver to cover family planning services with a median income eligibility of 210% FPL.
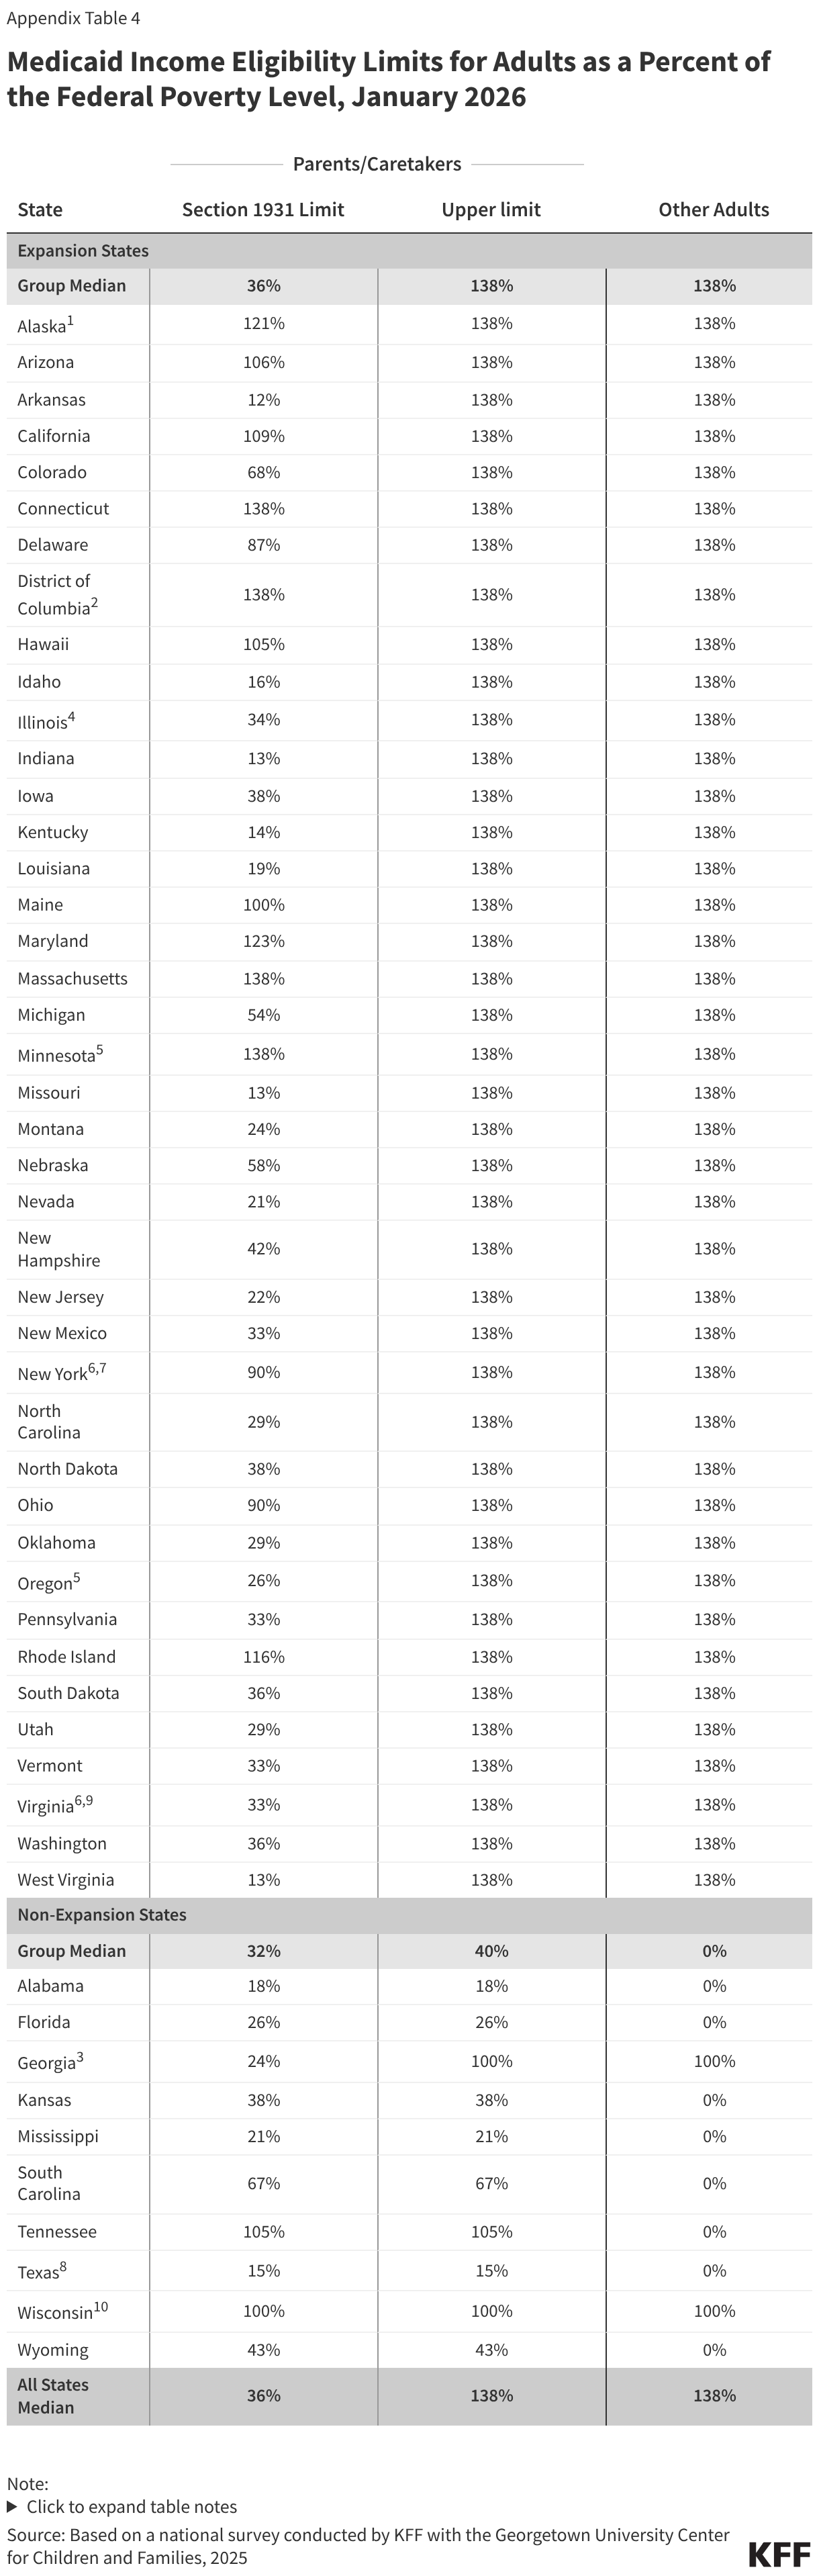
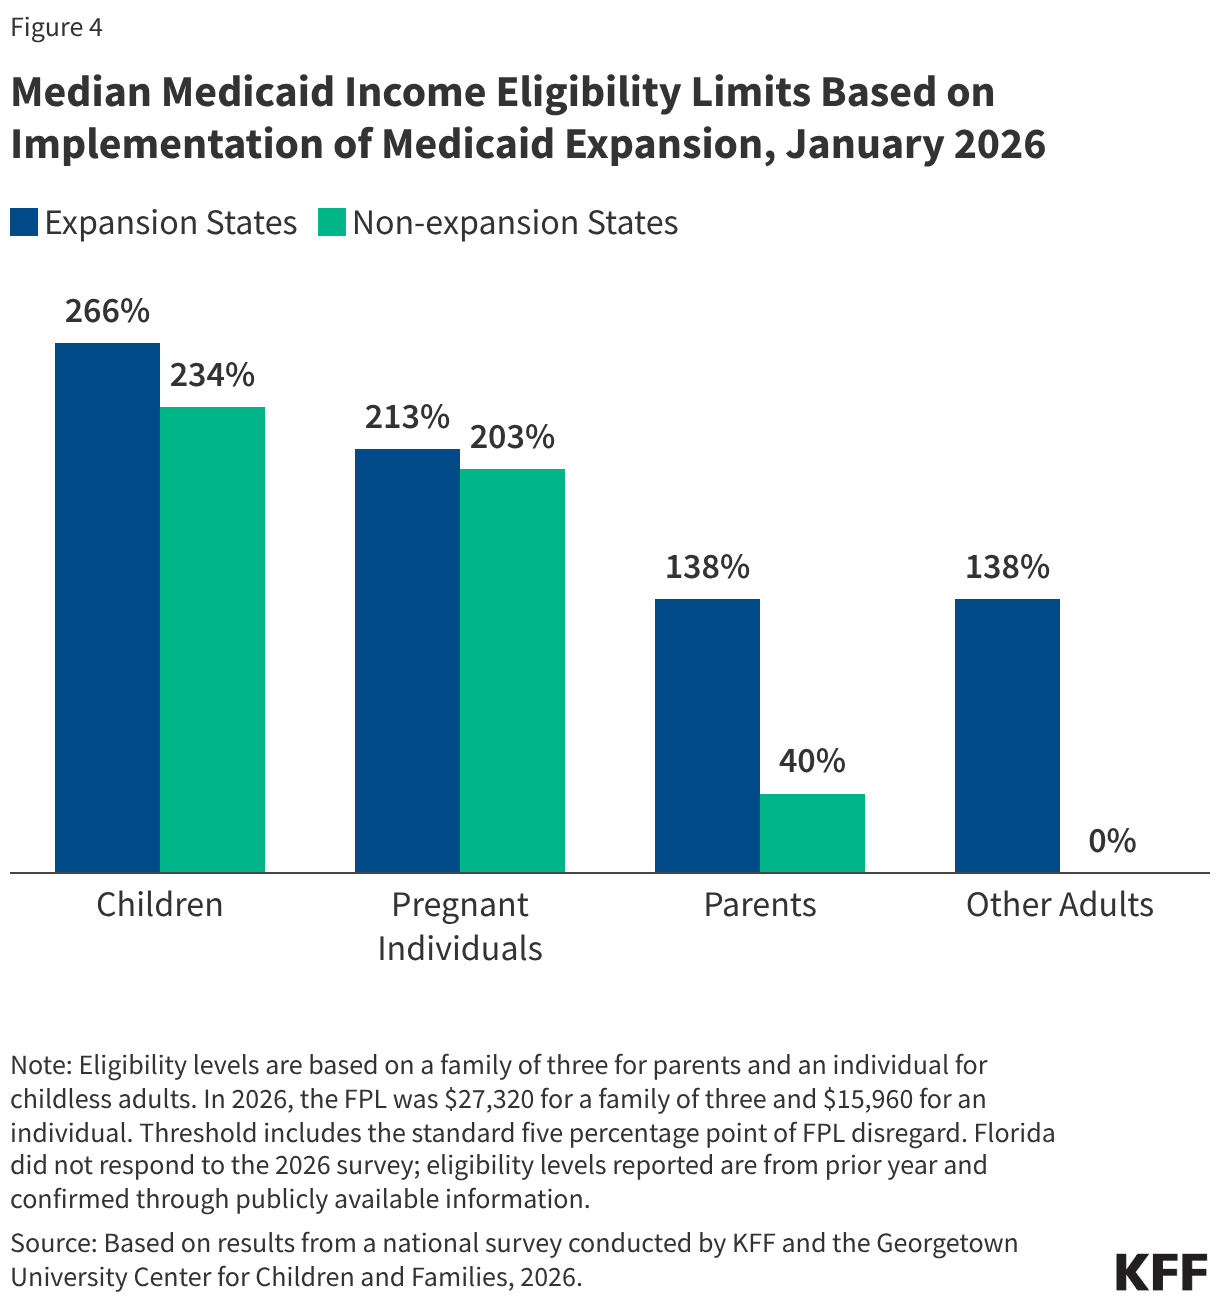
The median income eligibility for parents in non-expansion states is 40% FPL while eligibility levels for both parents and adults without dependent children is 138% FPL in expansion states (Figure 4). Although D.C. lowered income eligibility for parents and adults, from 221% and 215% respectively to 138% FPL, it launched the DC Healthy Plan, a Basic Health Program that covers non-Medicaid residents with income between 138%-200% FPL.
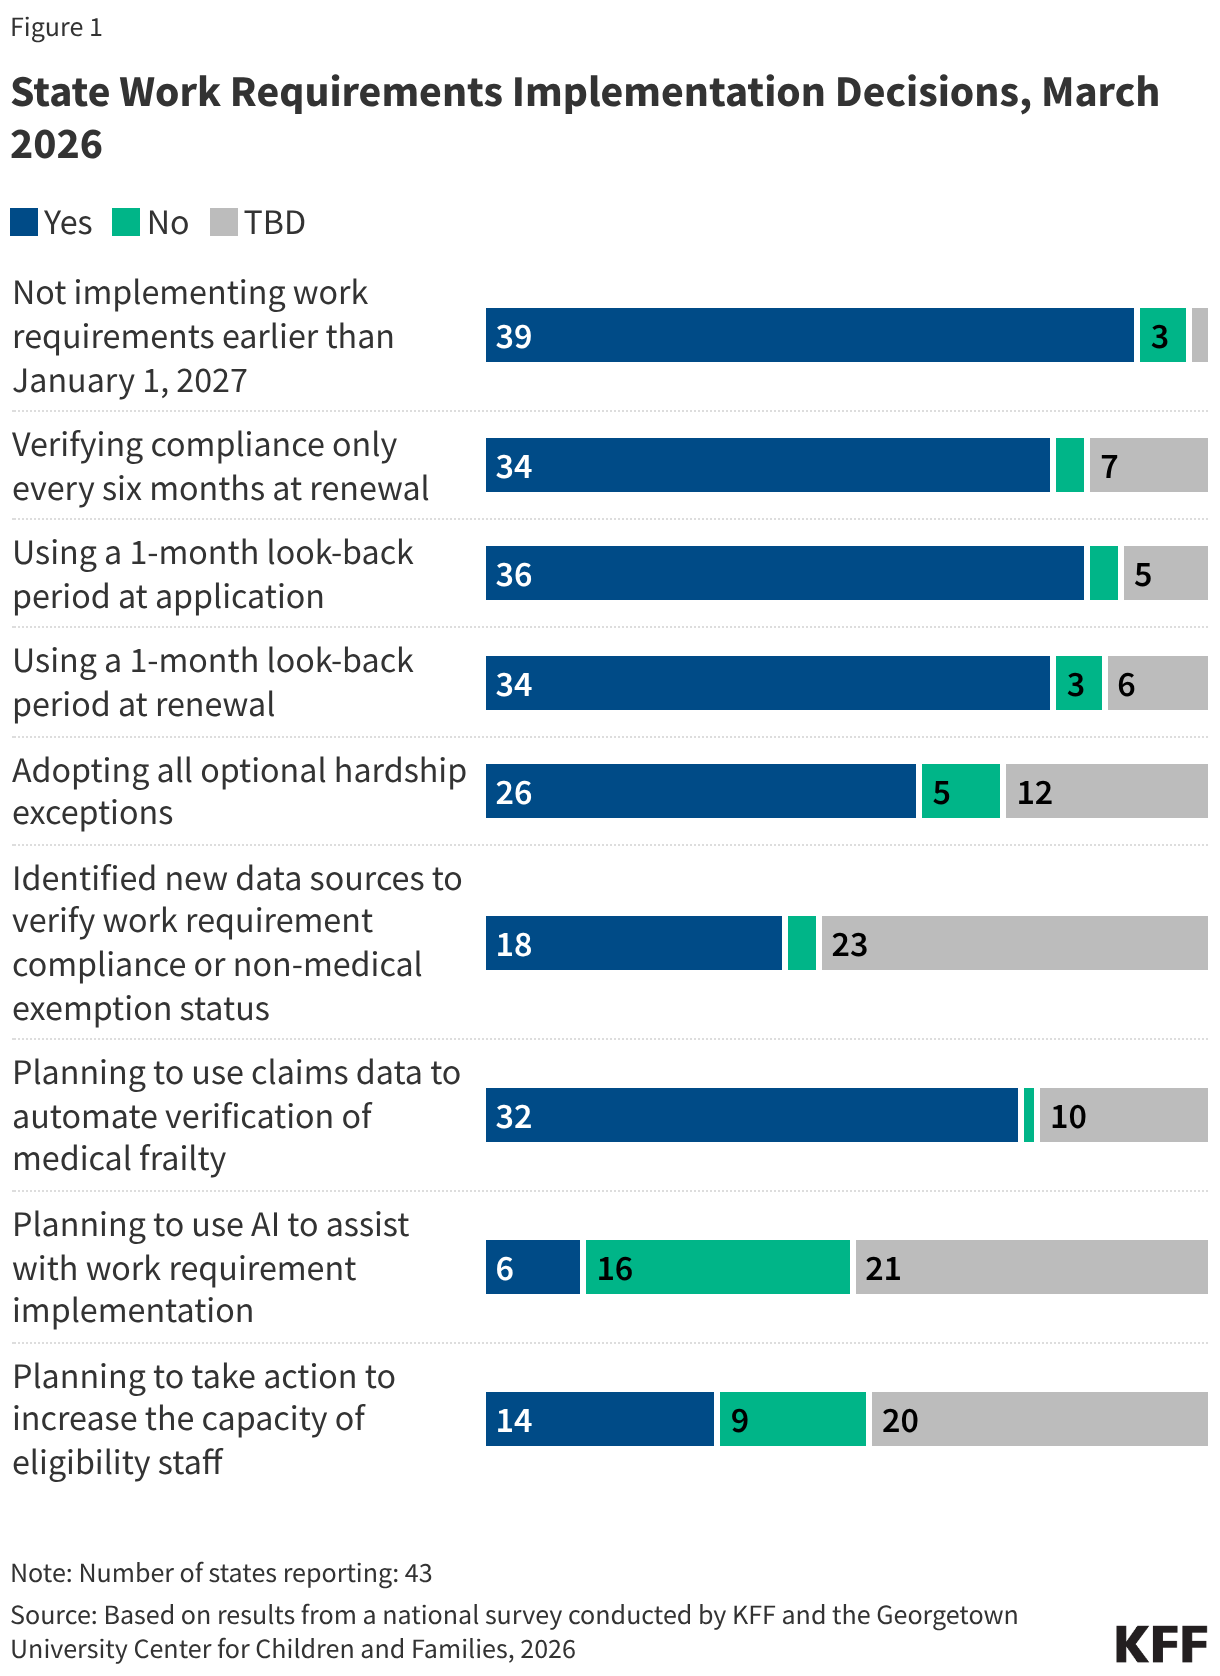
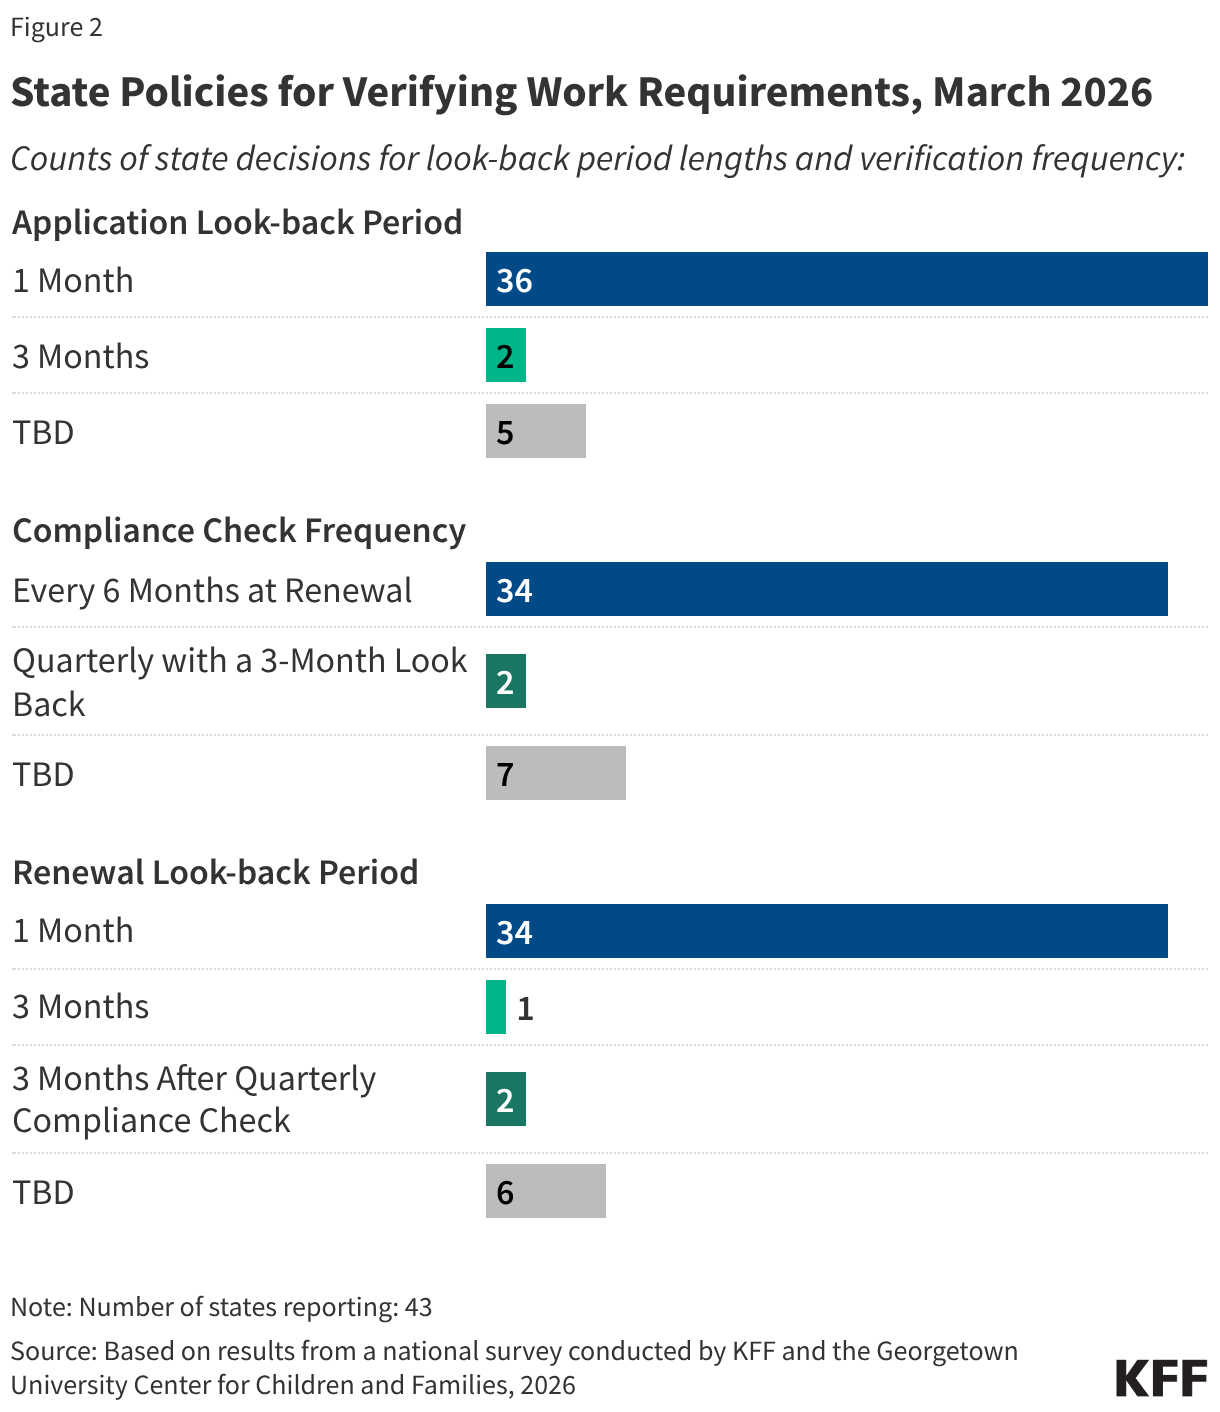
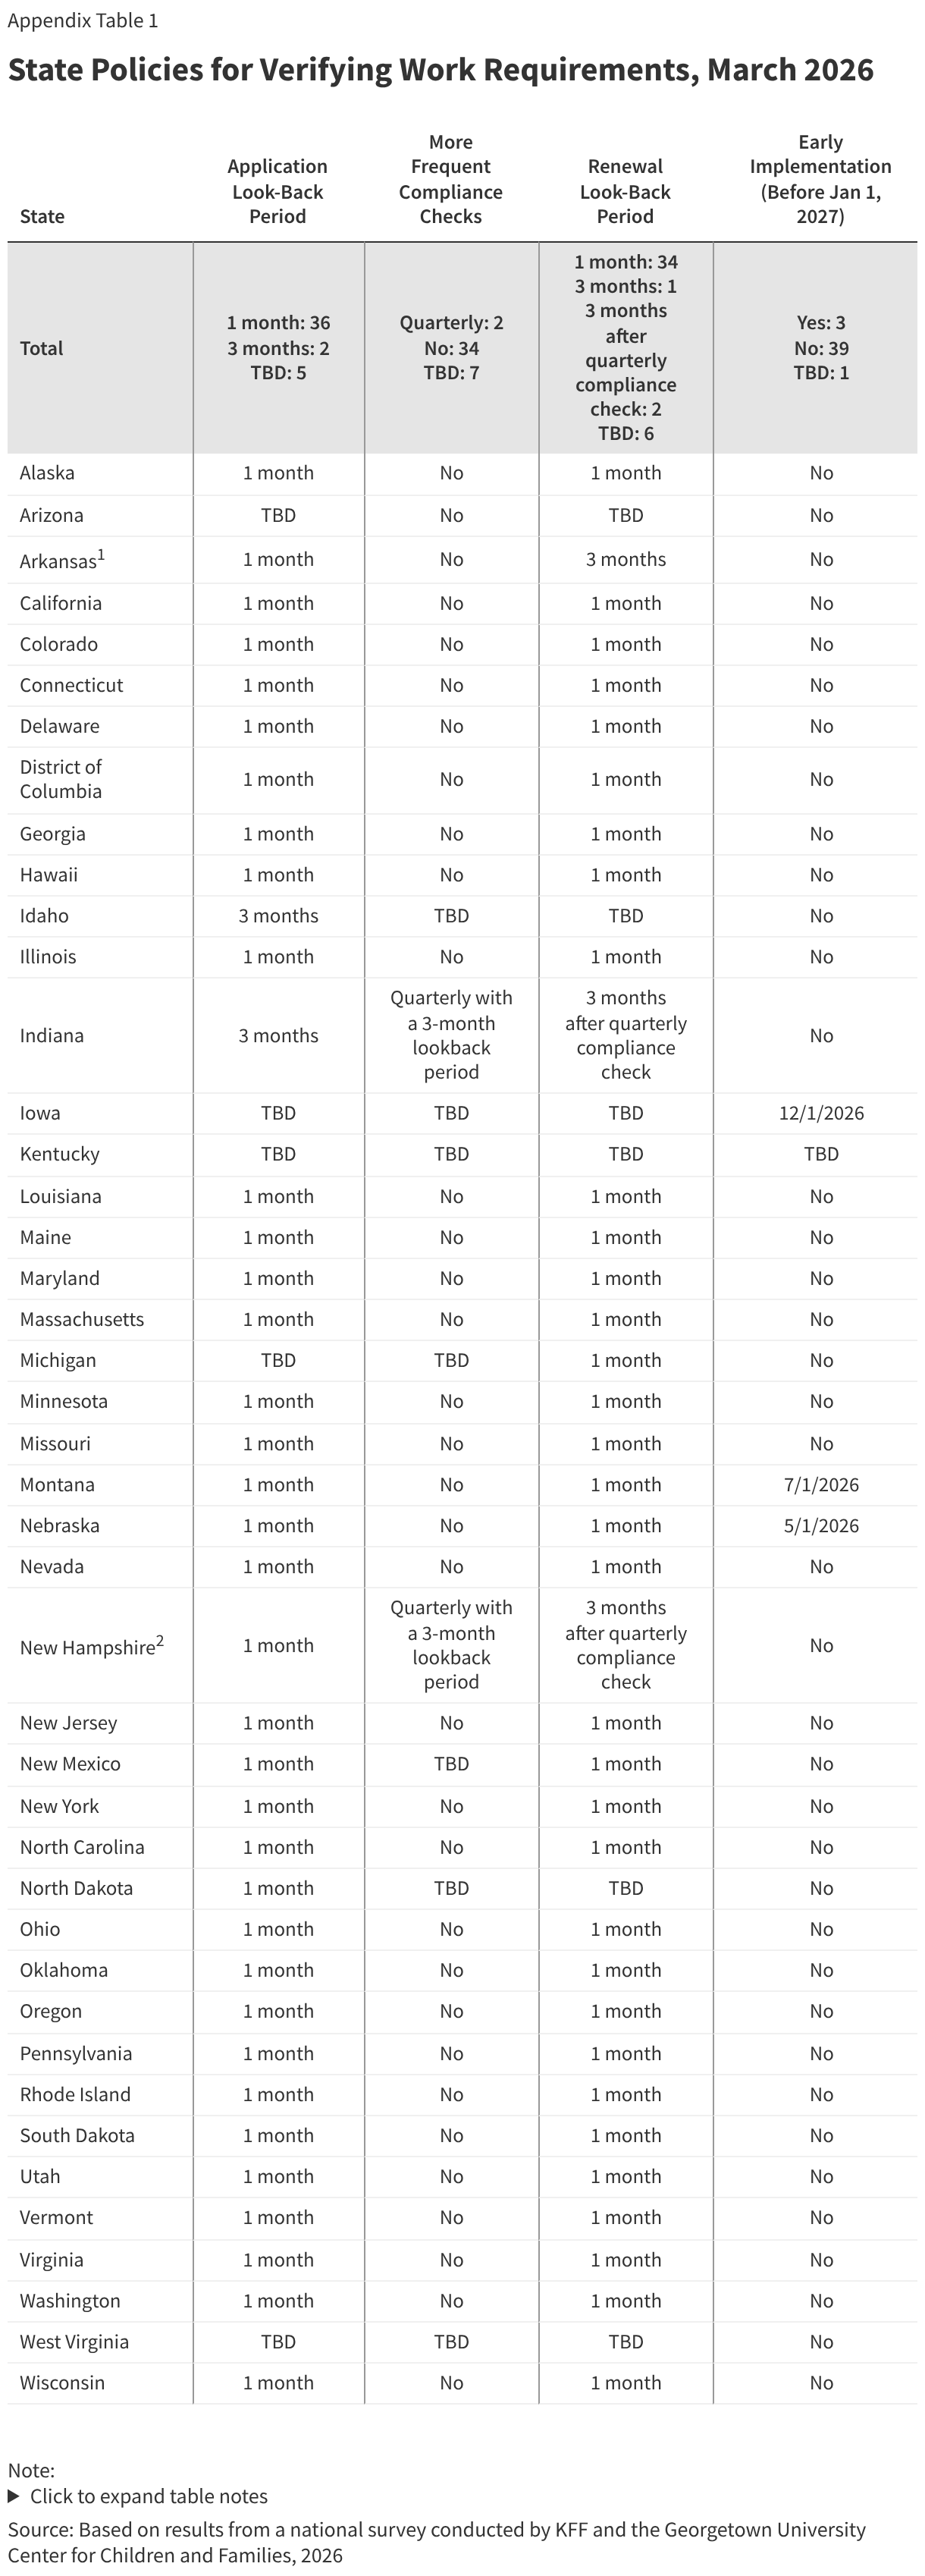
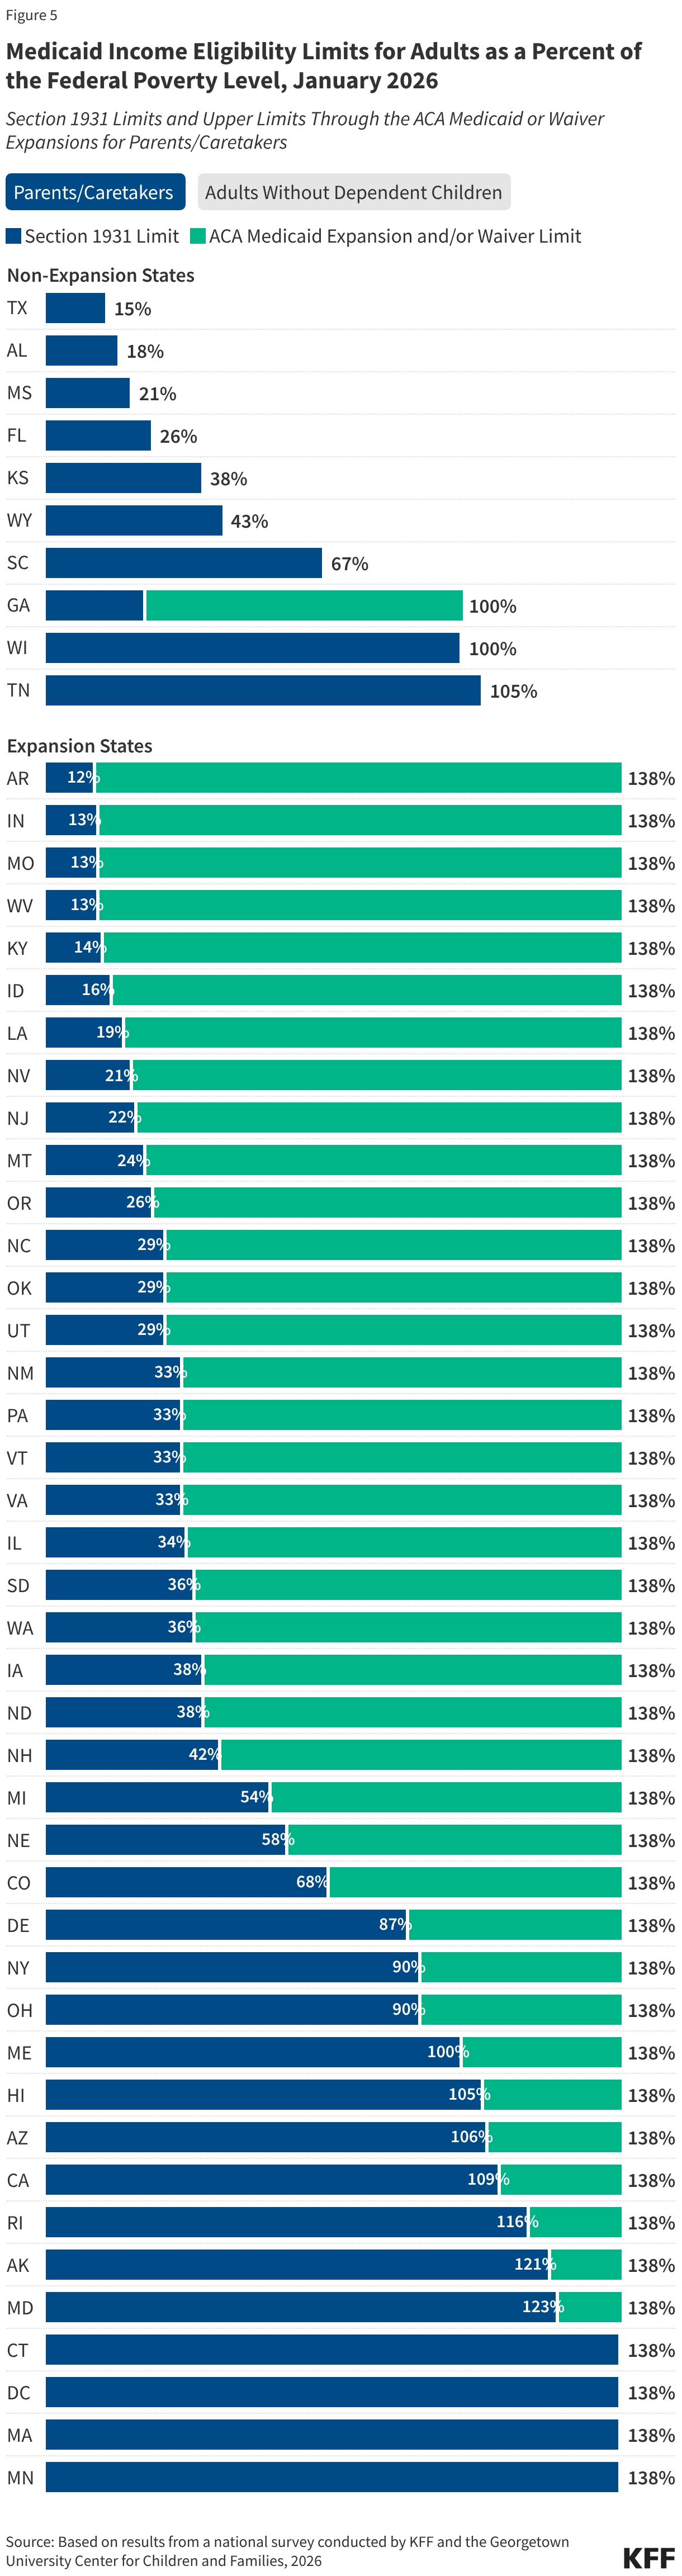
Many parents of older children in expansion states will be subject to new work requirements starting in January 2027. States are required to cover parents and caretakers of children under age 18 who have income at or below the eligibility standard for cash assistance that was in effect as of May 1, 1988, through the Section 1931 pathway. The ACA expanded Medicaid eligibility for parents and created a new eligibility pathway for adults without dependent children with incomes up to 138% FPL. In states that adopted the expansion, many parents with income above the state’s Section 1931 level gained coverage. Parents covered through the Medicaid expansion who have children ages 14 or older will need to comply with the new work requirements. Some parents of older children in Georgia also gained coverage through the state’s partial expansion waiver program and will be subject to new work requirements.
The median eligibility for Section 1931 parents in expansion states is 36%; however, the levels vary widely across states. Four expansion states cover parents with income up to 138% FPL through the Section 1931 pathway, thus exempting all parents in their states from work requirements (all parents are also exempt in Wisconsin), and 11 other states have Section 1931 eligibility above 100% FPL. In the ten states with the lowest Section 1931 eligibility levels (less than 25% FPL), many parents will need to meet the requirements or qualify for an exemption (Figure 5).
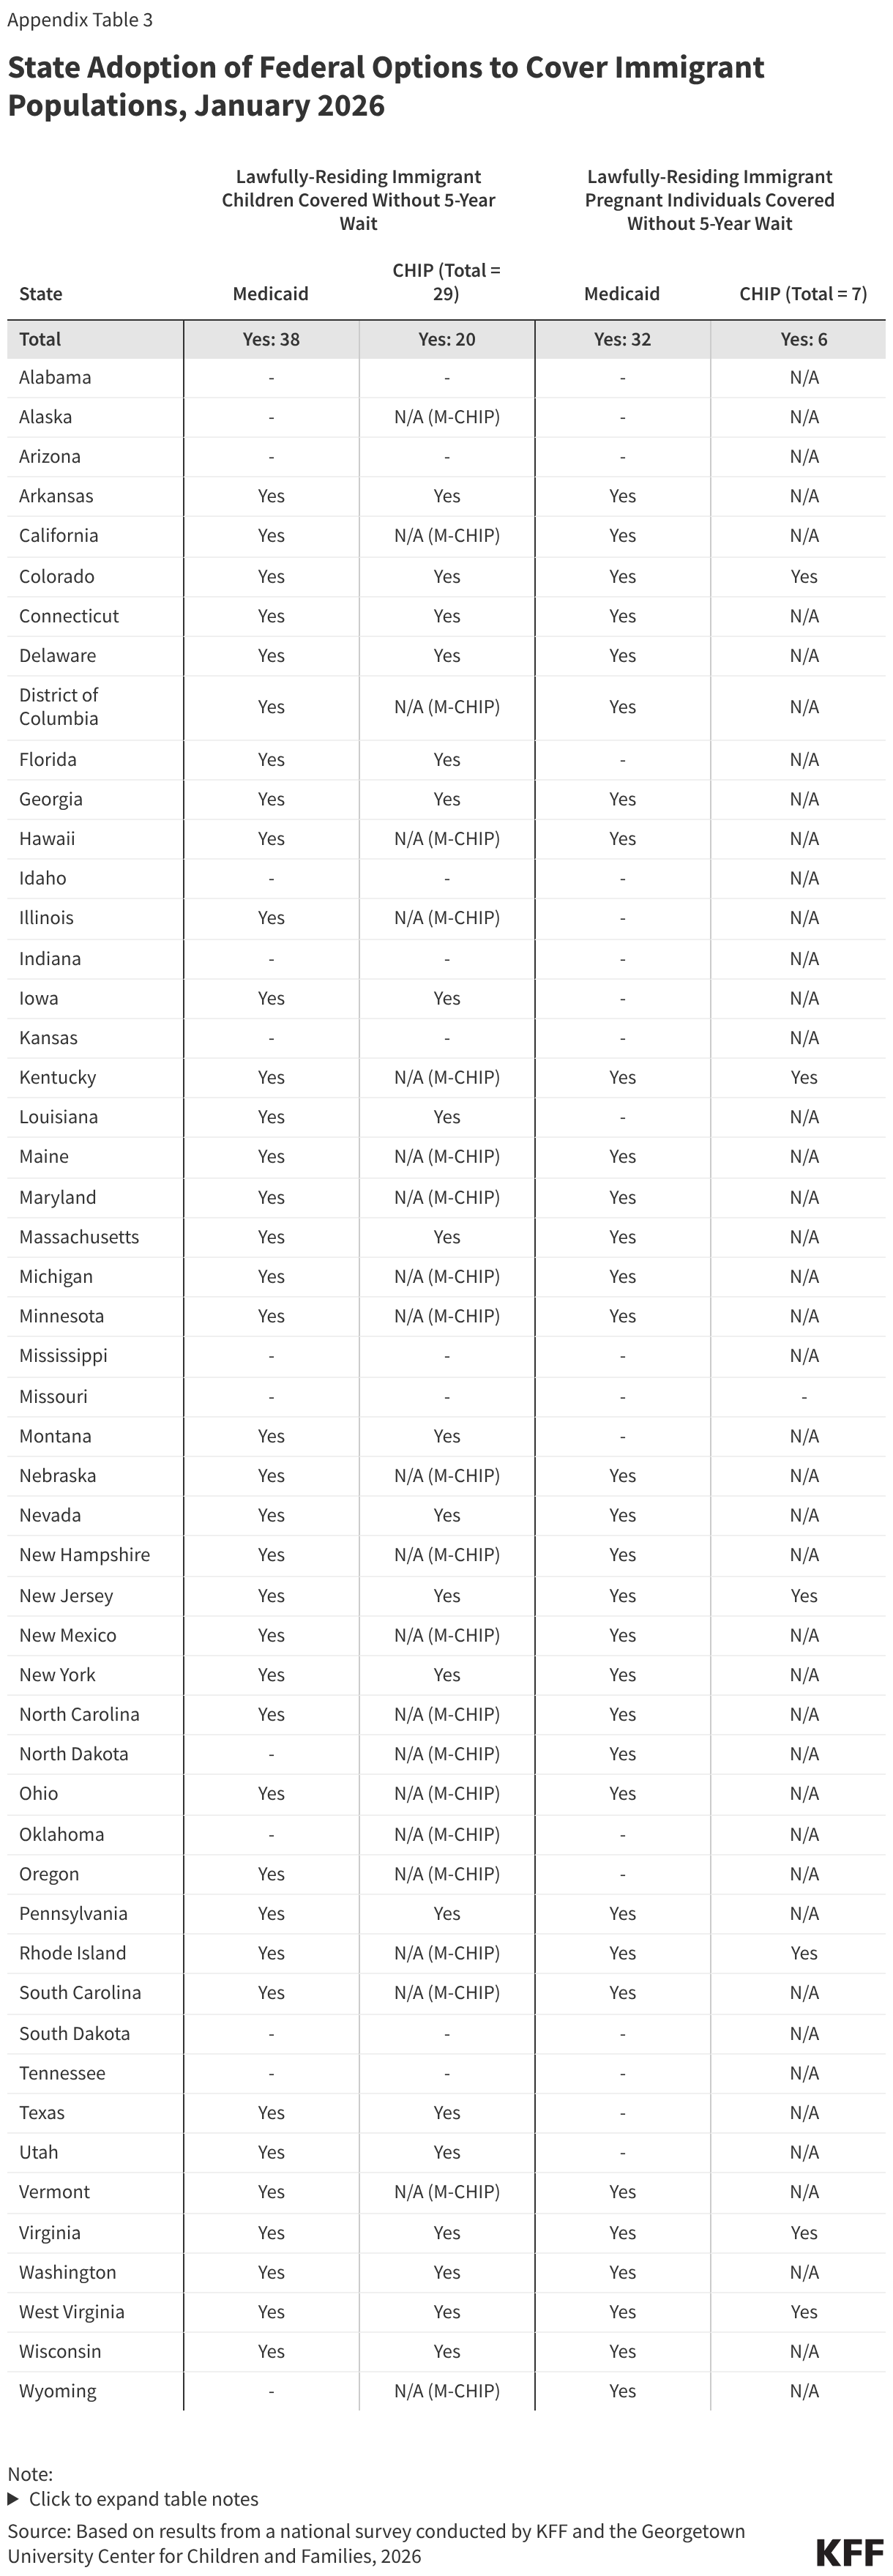
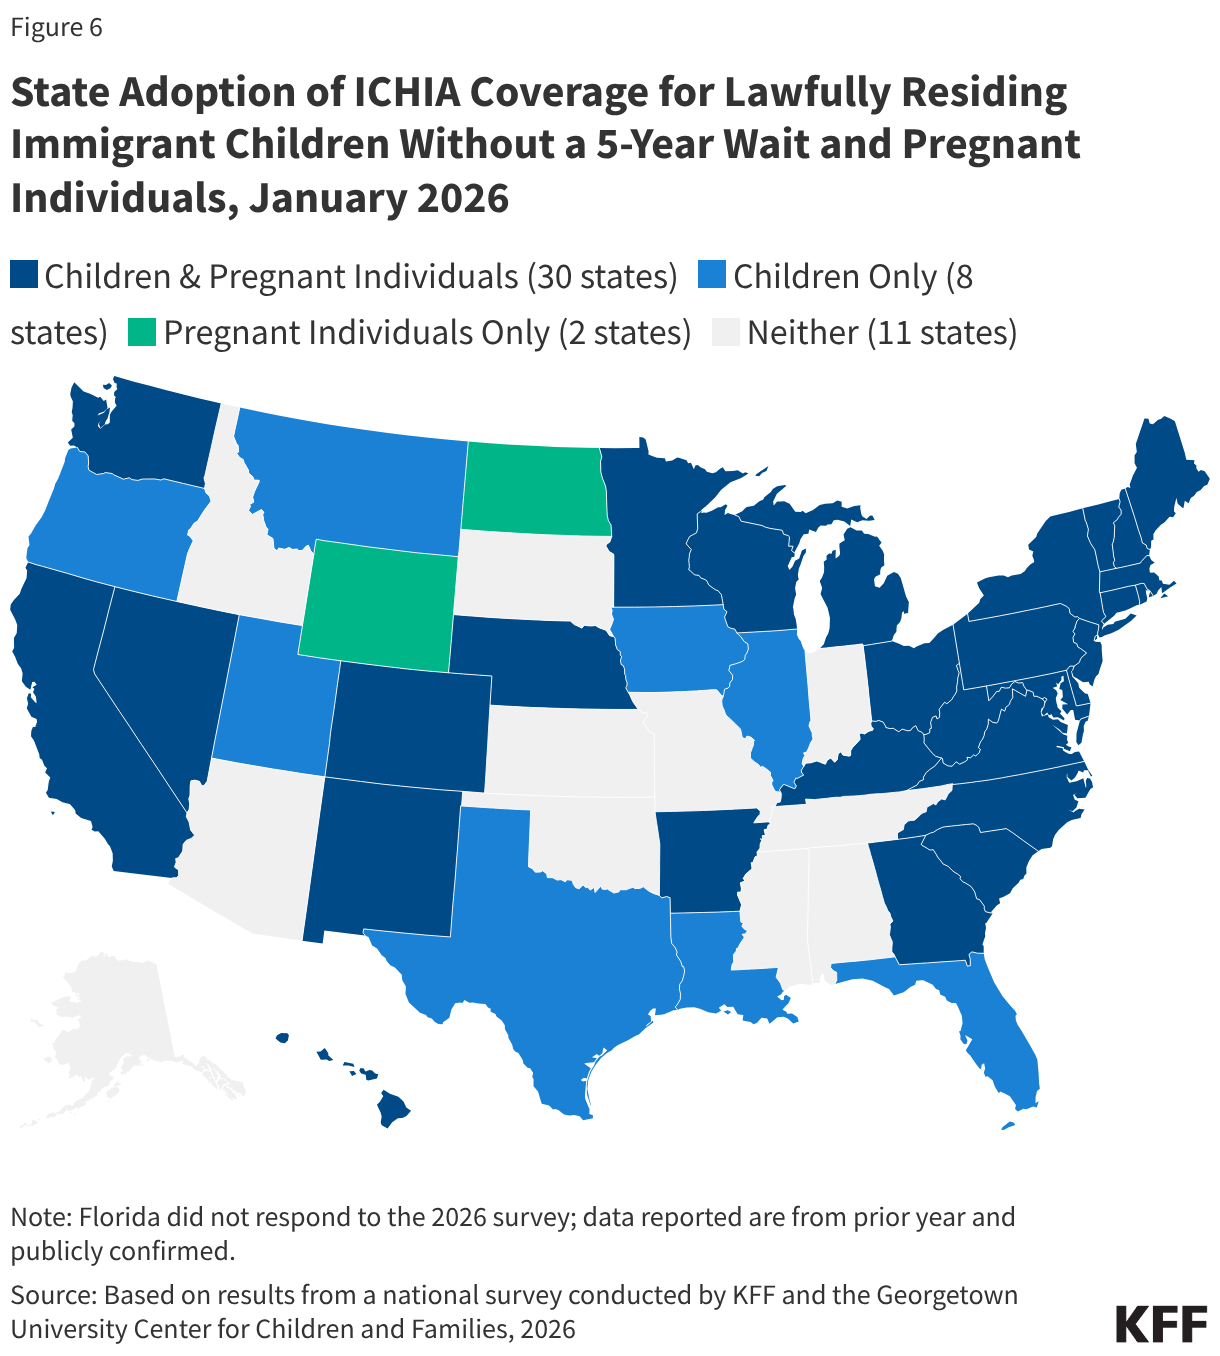
Three quarters of states (38) cover lawfully residing children without a 5-year waiting period and over six in ten states (32) cover lawfully residing pregnant immigrants through Medicaid. In general, lawfully residing immigrants must have a “qualified” immigration status to be eligible for Medicaid or CHIP, and many, including most lawful permanent residents or “green card” holders, must wait five years after obtaining qualified status before they may enroll. Through the 2009 Immigrant Children’s Health Insurance Act (ICHIA), states have the option to cover lawfully residing immigrant children and pregnant immigrants without a 5-year waiting period (Figure 6). Undocumented immigrants are not eligible to enroll in Medicaid or CHIP. While the reconciliation law restricted Medicaid and CHIP eligibility for certain lawfully residing immigrants, it did not eliminate the state option to cover lawfully residing children and pregnant individuals without the 5-year waiting period.
Eligibility Changes for Immigrants
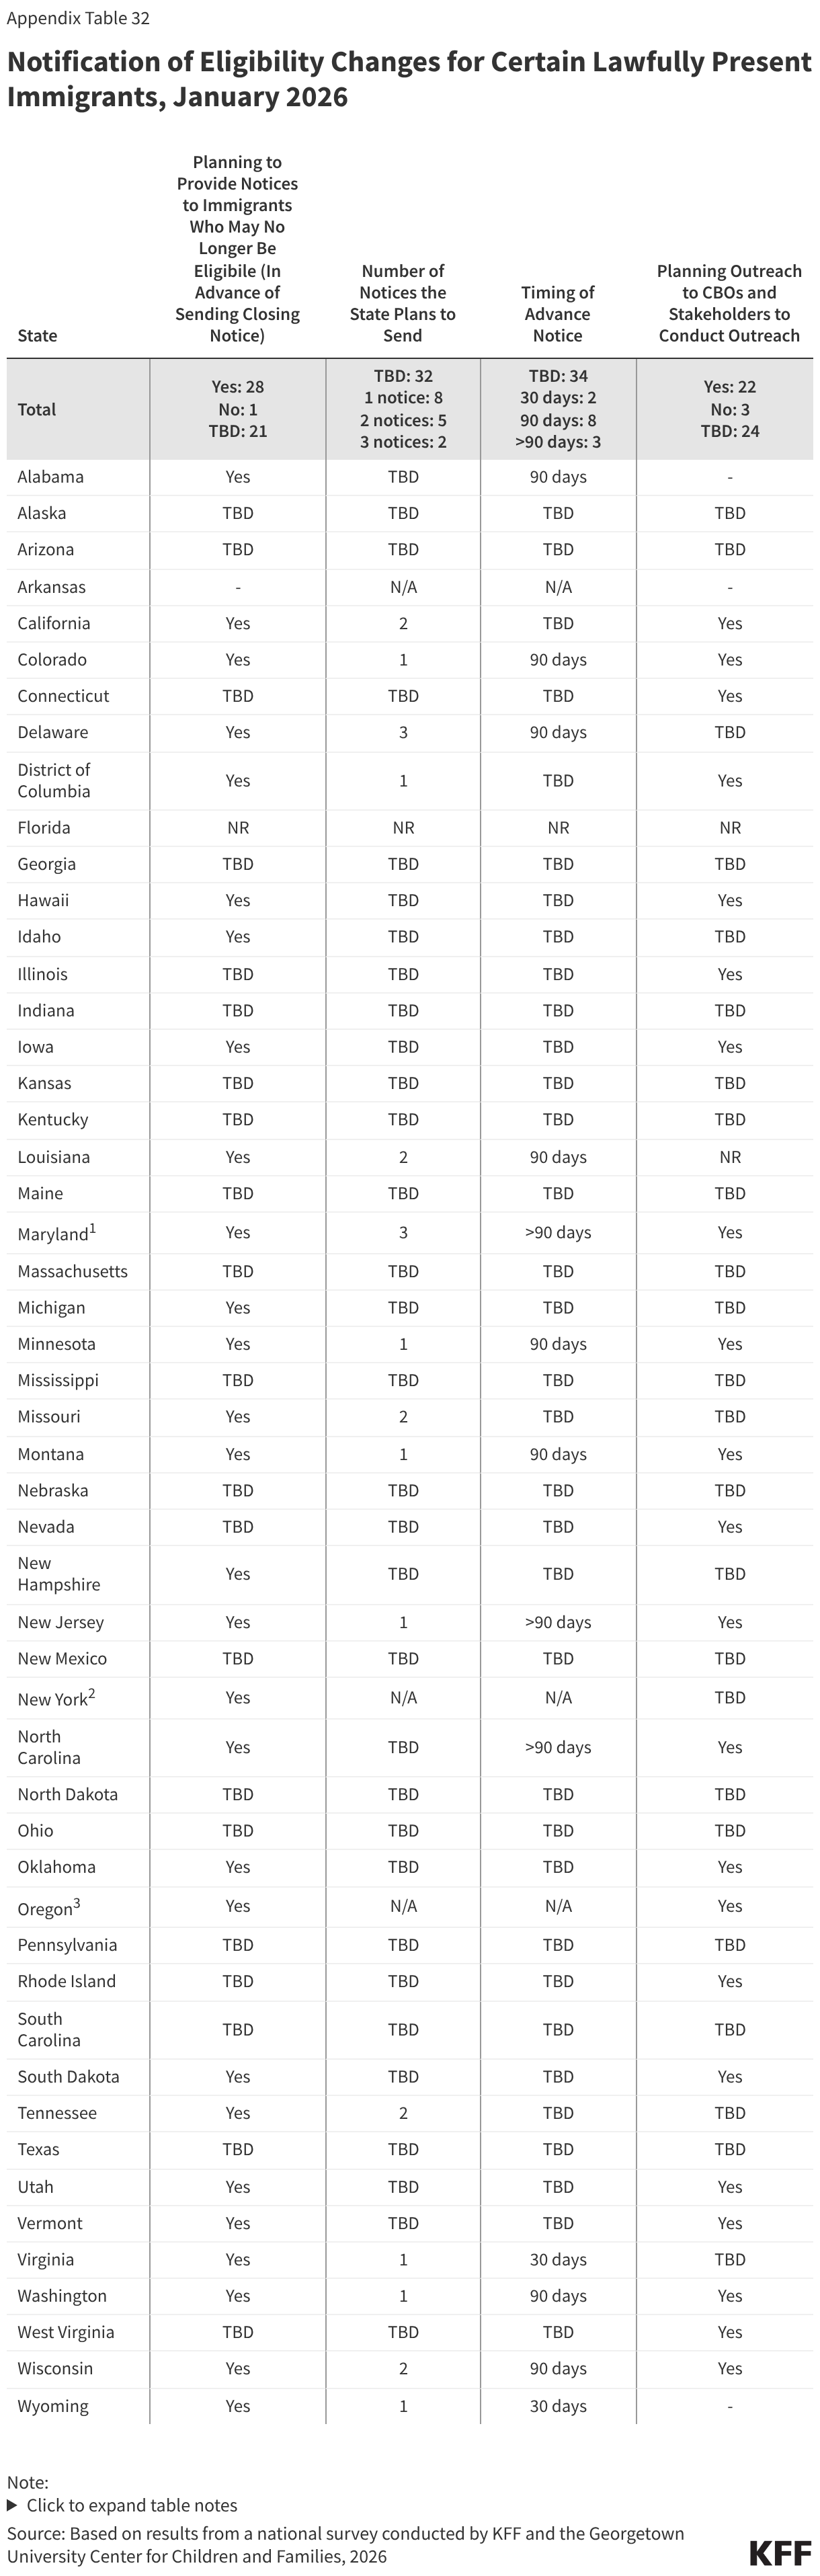
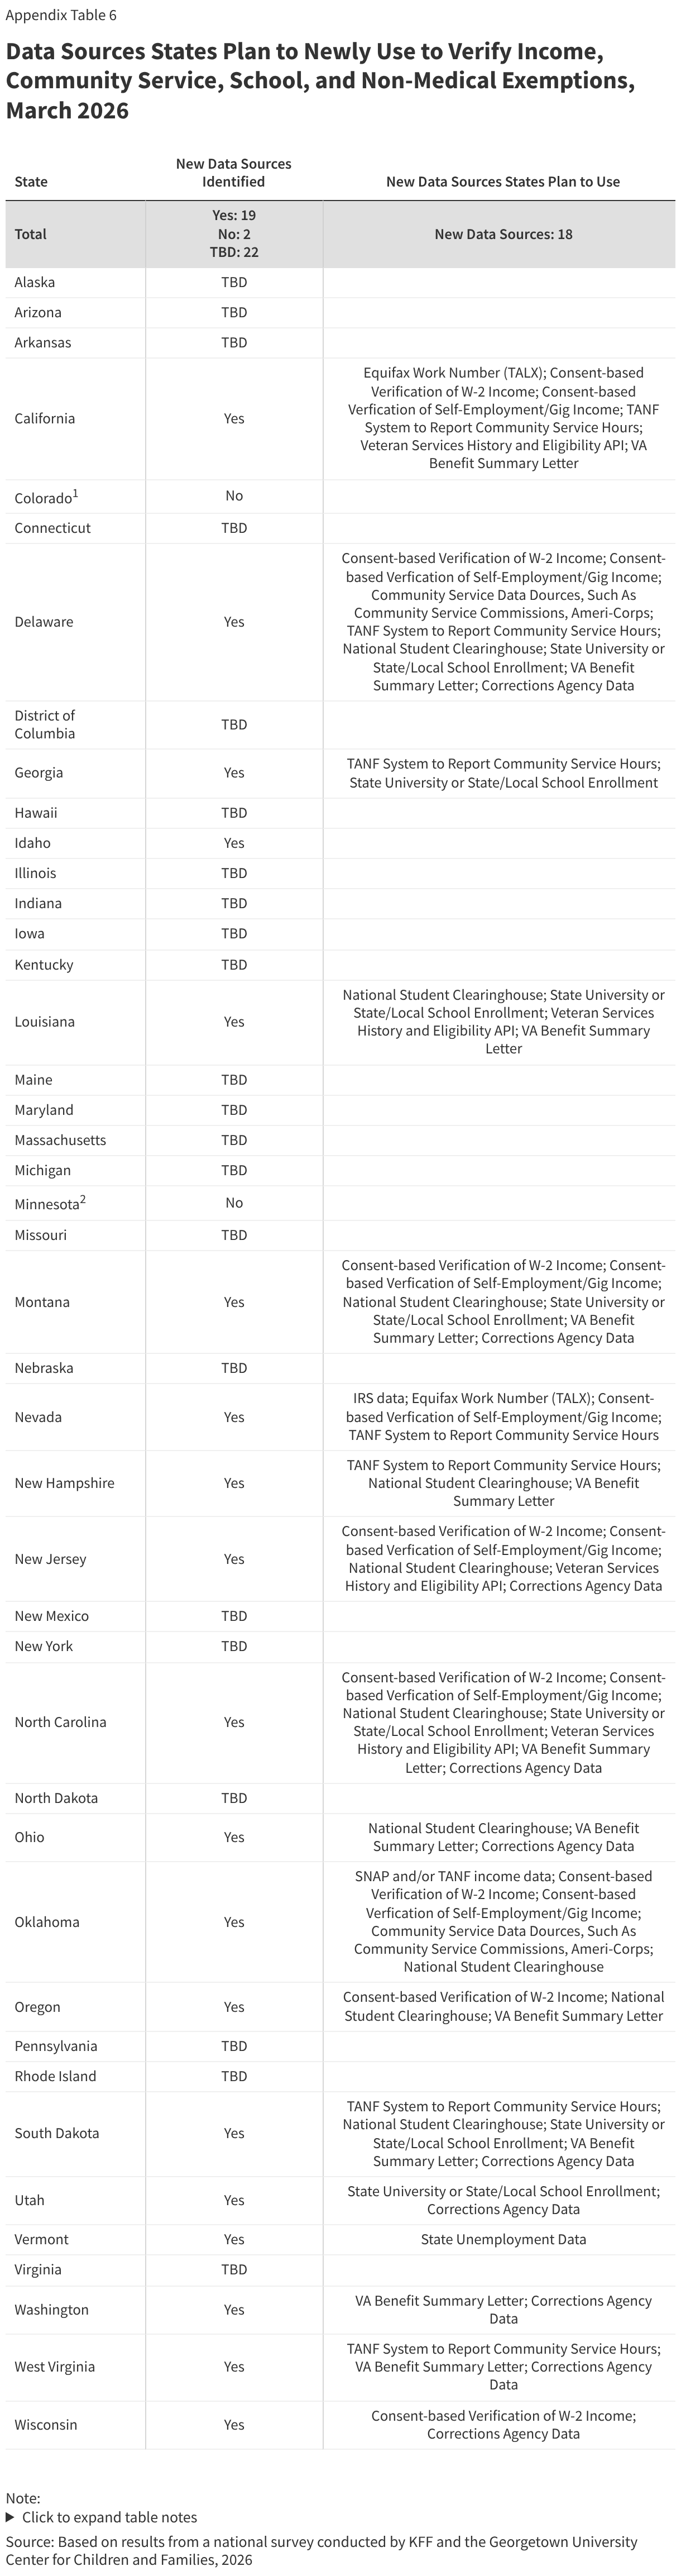
States are preparing to send advance notices to lawfully residing immigrants who are losing eligibility because of restrictions in the reconciliation law. Beginning October 1, 2026, Medicaid eligibility for immigrants will be restricted to only LPRs or green card holders, certain Haitian and Cuban entrants, and COFA migrants residing in the U.S. Recent guidance clarifies that to implement these eligibility changes states will need to reverify individuals to confirm they have an eligible immigration status under the new rules. If states are unable to reverify an eligible immigration status, they will need to provide notice to individuals that they are no longer eligible and will be disenrolled. Prior to the guidance being released, more than half of states (28) said they plan to send one or more notices to inform affected immigrants of the eligibility change while 21 states have not yet established their policies regarding outreach and notices, most likely because they were waiting on formal guidance from CMS. Two states (New York and Oregon) plan to transition eligible immigrants who lose coverage to state-funded coverage. Although most states are still making decisions about the number and timing of notices, states that have made decisions report they will send between one and three notices between 30 days and more than 90 days in advance. Advance notice can help affected individuals plan for the loss of coverage and seek care for urgent or unmet needs before they become uninsured. Nearly half of states (22) plan to engage community-based organizations in conducting outreach to affected immigrant communities. Outreach through trusted, community-based organizations can help boost awareness among those who will be affected, and community partners may be able to help individuals consider alternatives, including how to access free or low-cost care.
Eligibility Policies for Incarcerated Individuals
As of January 1, 2026, states are required to suspend, rather than terminate, Medicaid eligibility for adults during incarceration. The Consolidated Appropriations Act of 2023 required states to suspend Medicaid for incarcerated adults so that coverage could be promptly reactivated if the individual requires an inpatient hospital stay of at least 24 hours while incarcerated and to facilitate resumption of coverage when the adult is released. Coverage suspension also allows states to take advantage of reentry waivers (currently approved in 19 states and pending in 9) to provide Medicaid coverage of medications, outpatient services, and mental health services prior to release.
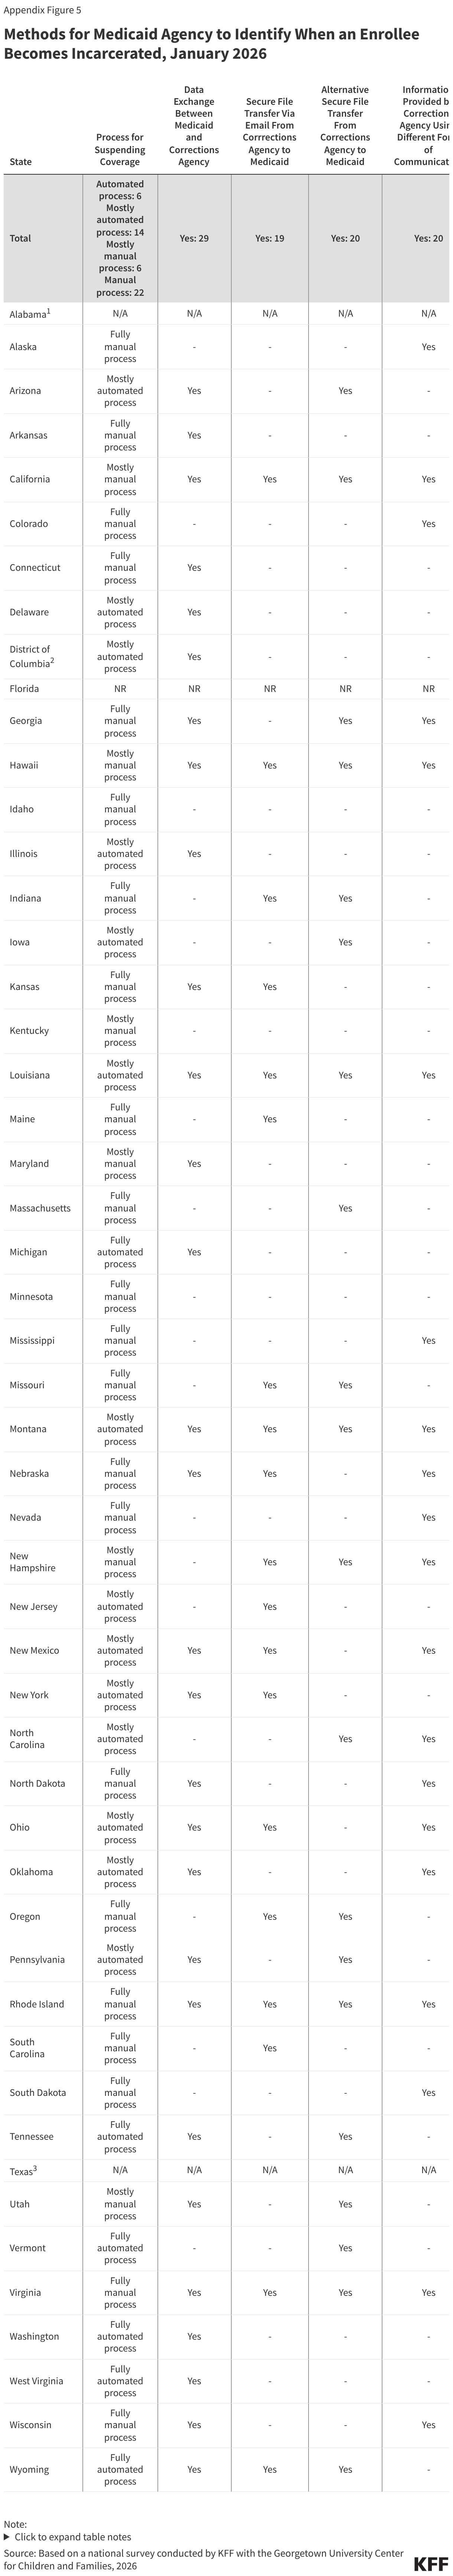
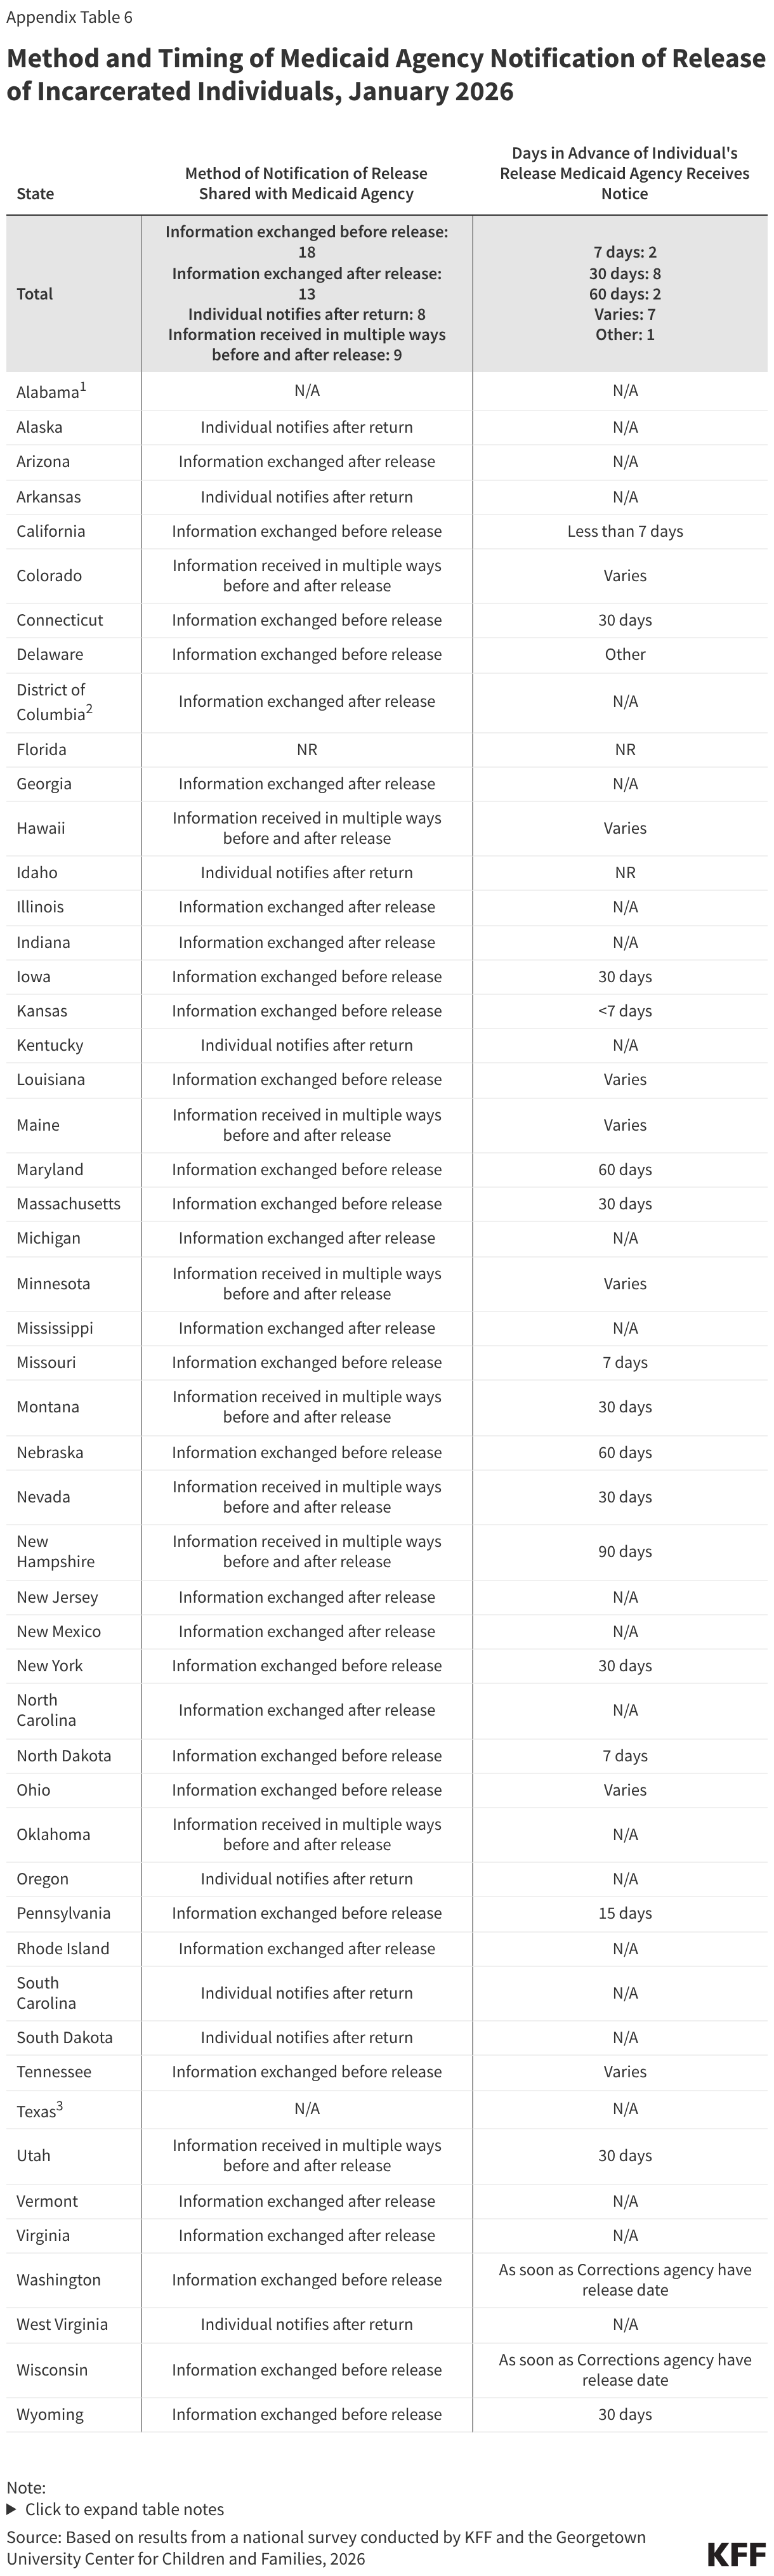
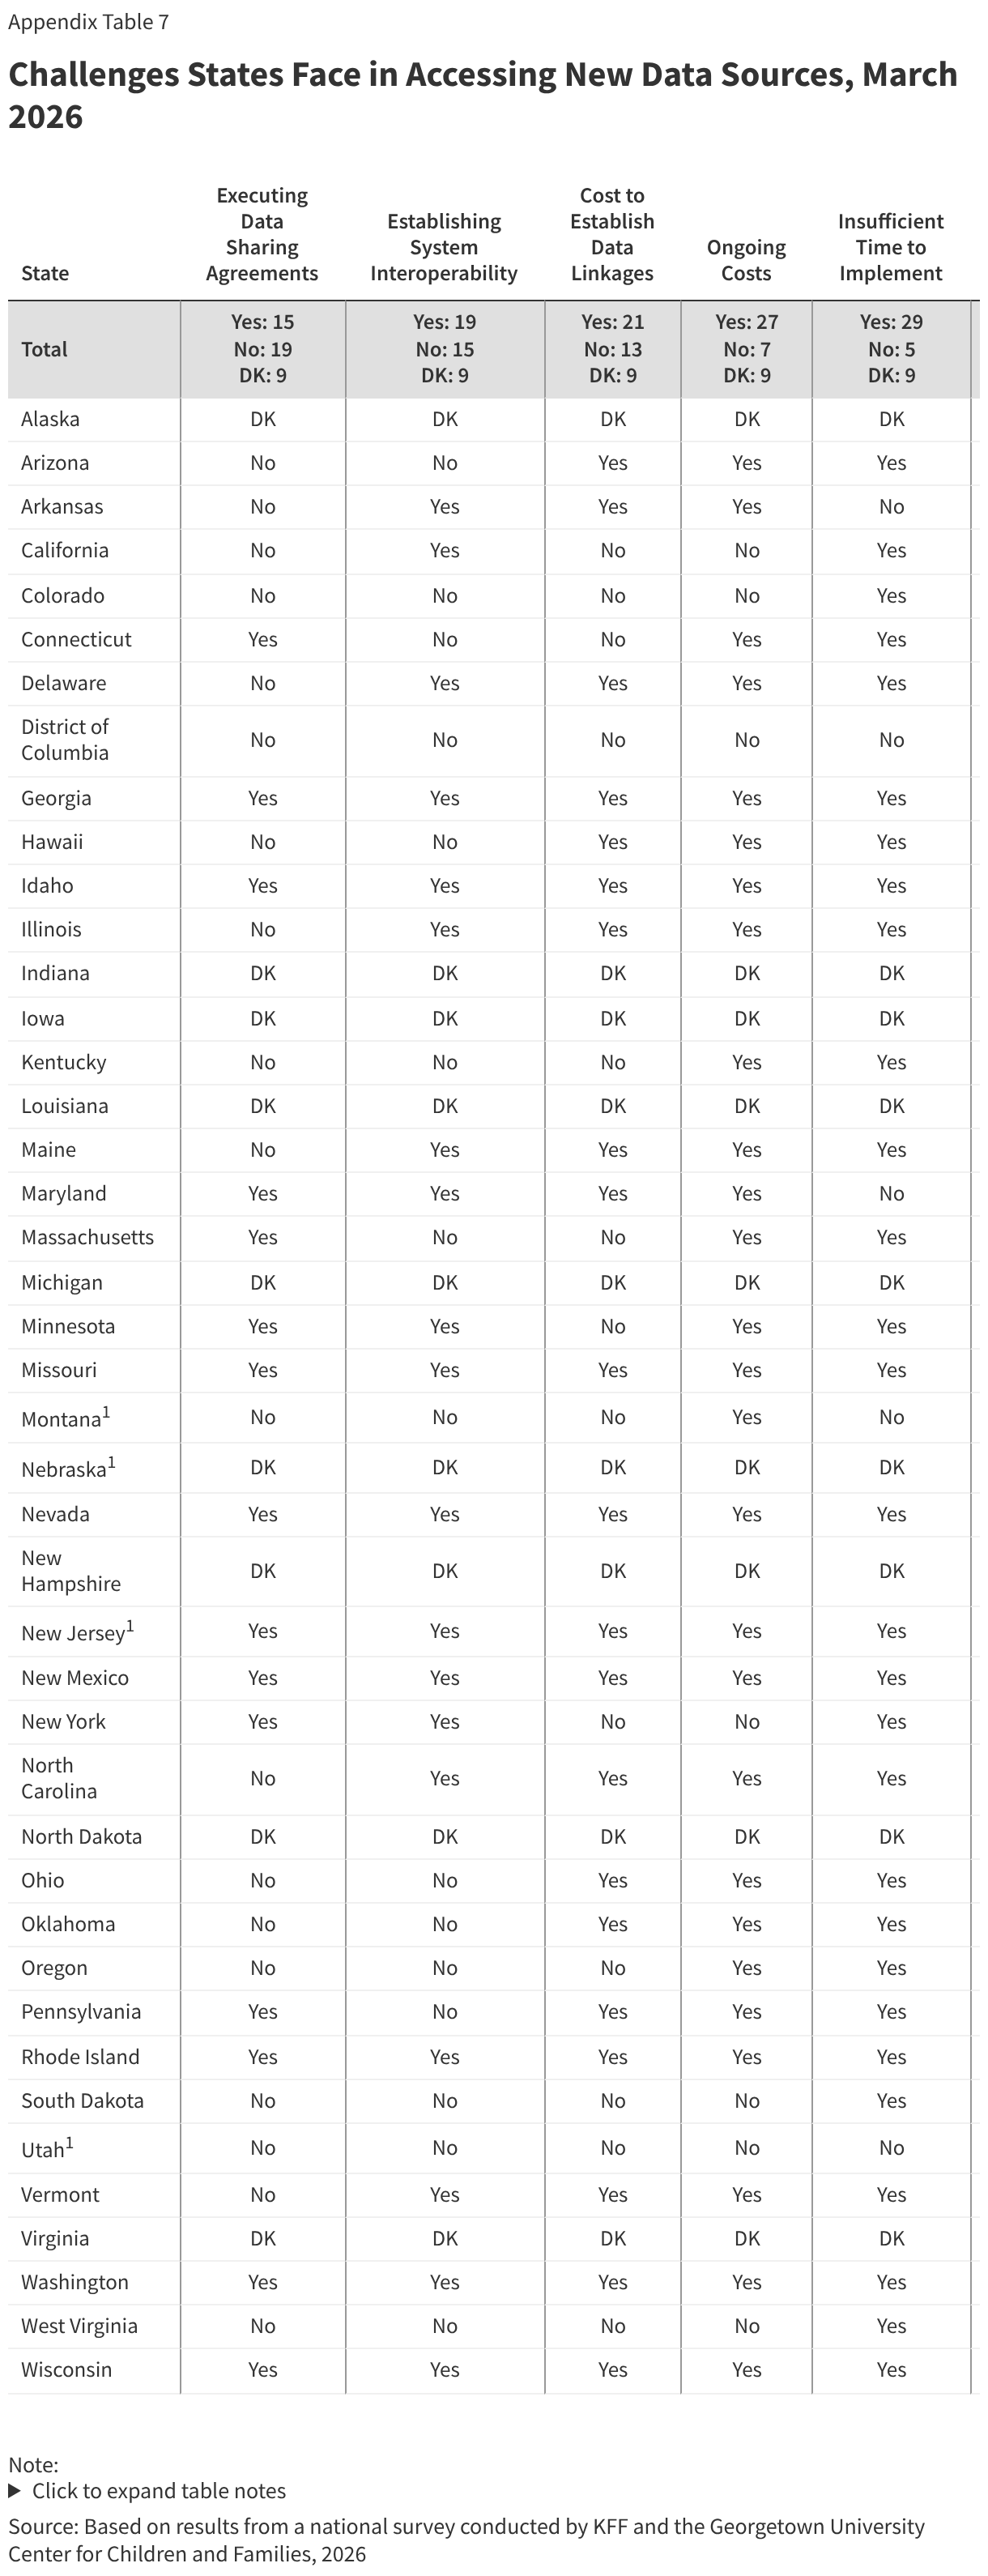
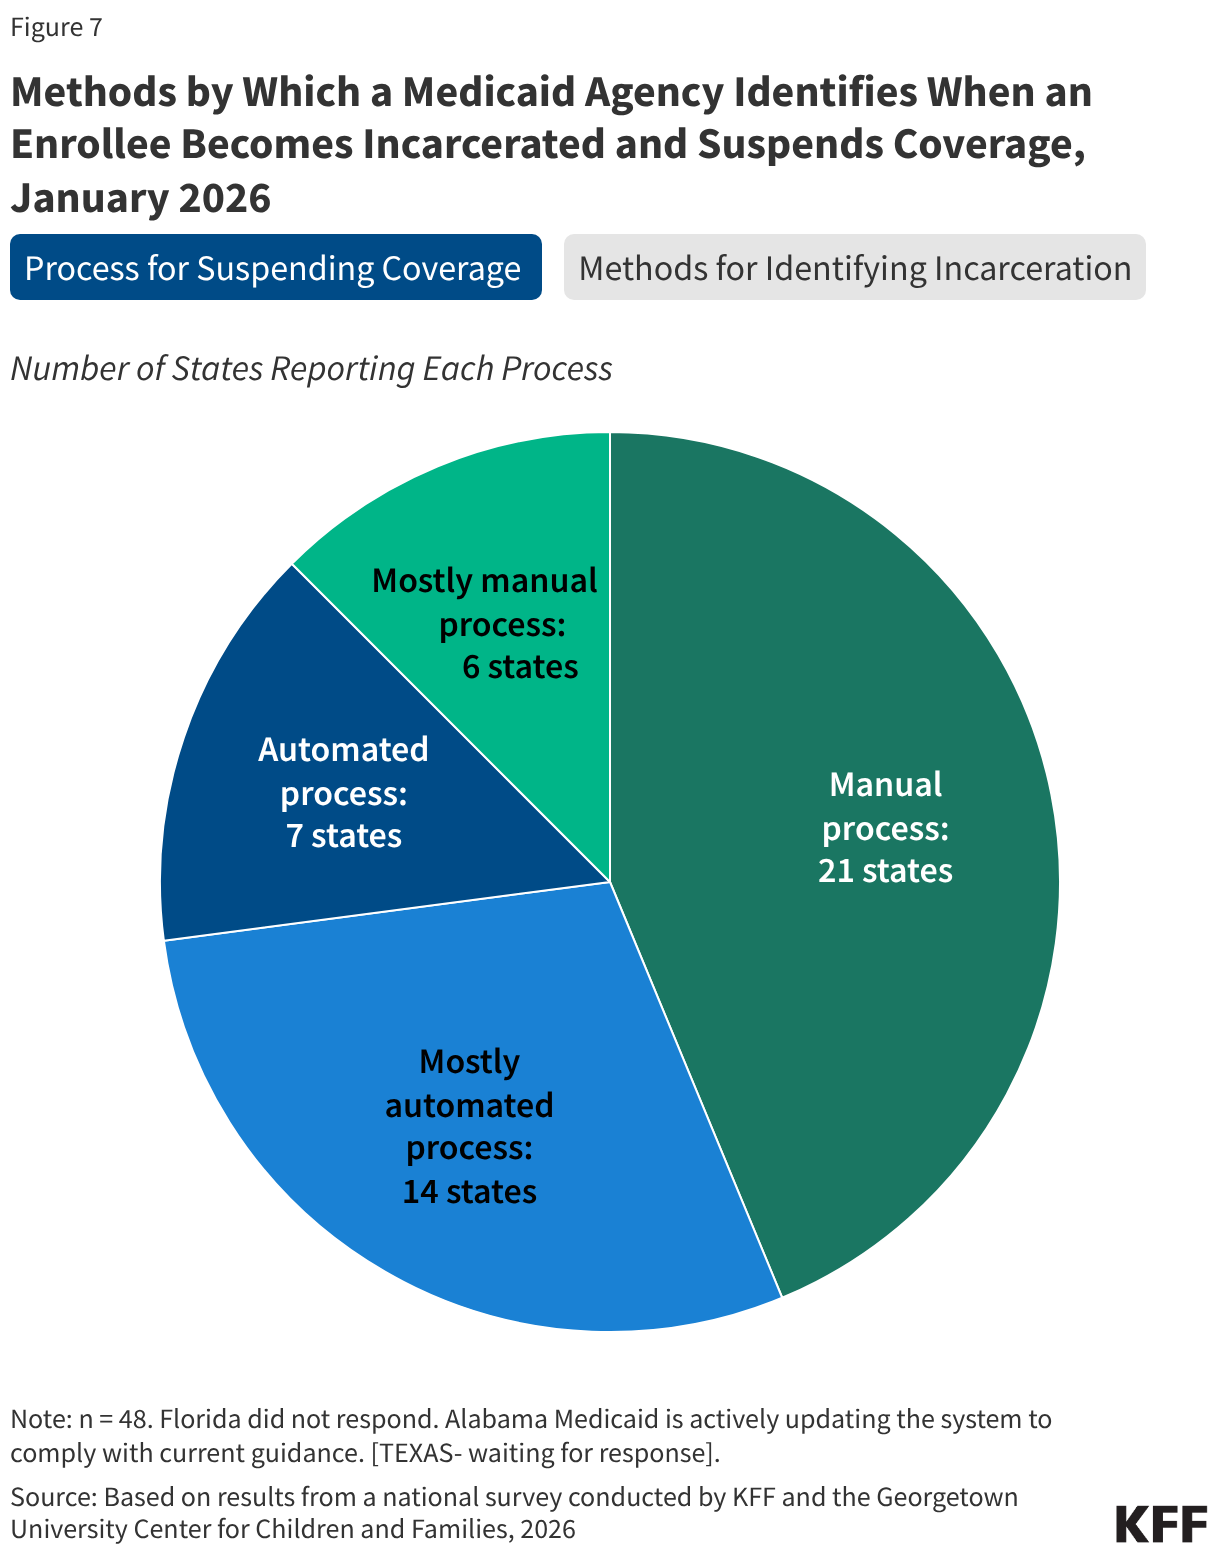
Most states (46) receive information from the Corrections Agency to identify when an individual has been incarcerated for purposes of suspending Medicaid coverage, but the method for transferring the information varies. Half of the states (26) use two or more methods for obtaining the information, including direct data exchange between the Medicaid and Corrections Agencies (29 states), through a secure file transfer via email (19 states), through an alternative secure file transfer (20 states), or using a different form of communication between the two agencies (20 states) (Figure 7). Two states are still developing processes to share information between the agencies. States also rely on information provided directly by incarcerated individuals (35 states) or someone in their household (37 states) or by a third-party vendor (14 states). In over half the states (28), these processes remain mostly or fully manual, which increases the administrative burden for eligibility workers and can lead to delays in processing coverage suspensions.
Over half of states (27) receive information from the Corrections agency prior to an individual being released from incarceration to reinstate coverage. In these states, the Medicaid agency is informed of the release between 90 days and a few days prior to release. The remaining states receive the information on the day of release or after release, either from the Corrections agency or from the formerly incarcerated individuals when they return to the community. Without data sharing and advance notice of release from incarceration from the Corrections agency, it may be difficult for Medicaid agencies to exempt individuals from work requirements during the three months post release as required.
Enrollment Policies
Uploading Documents
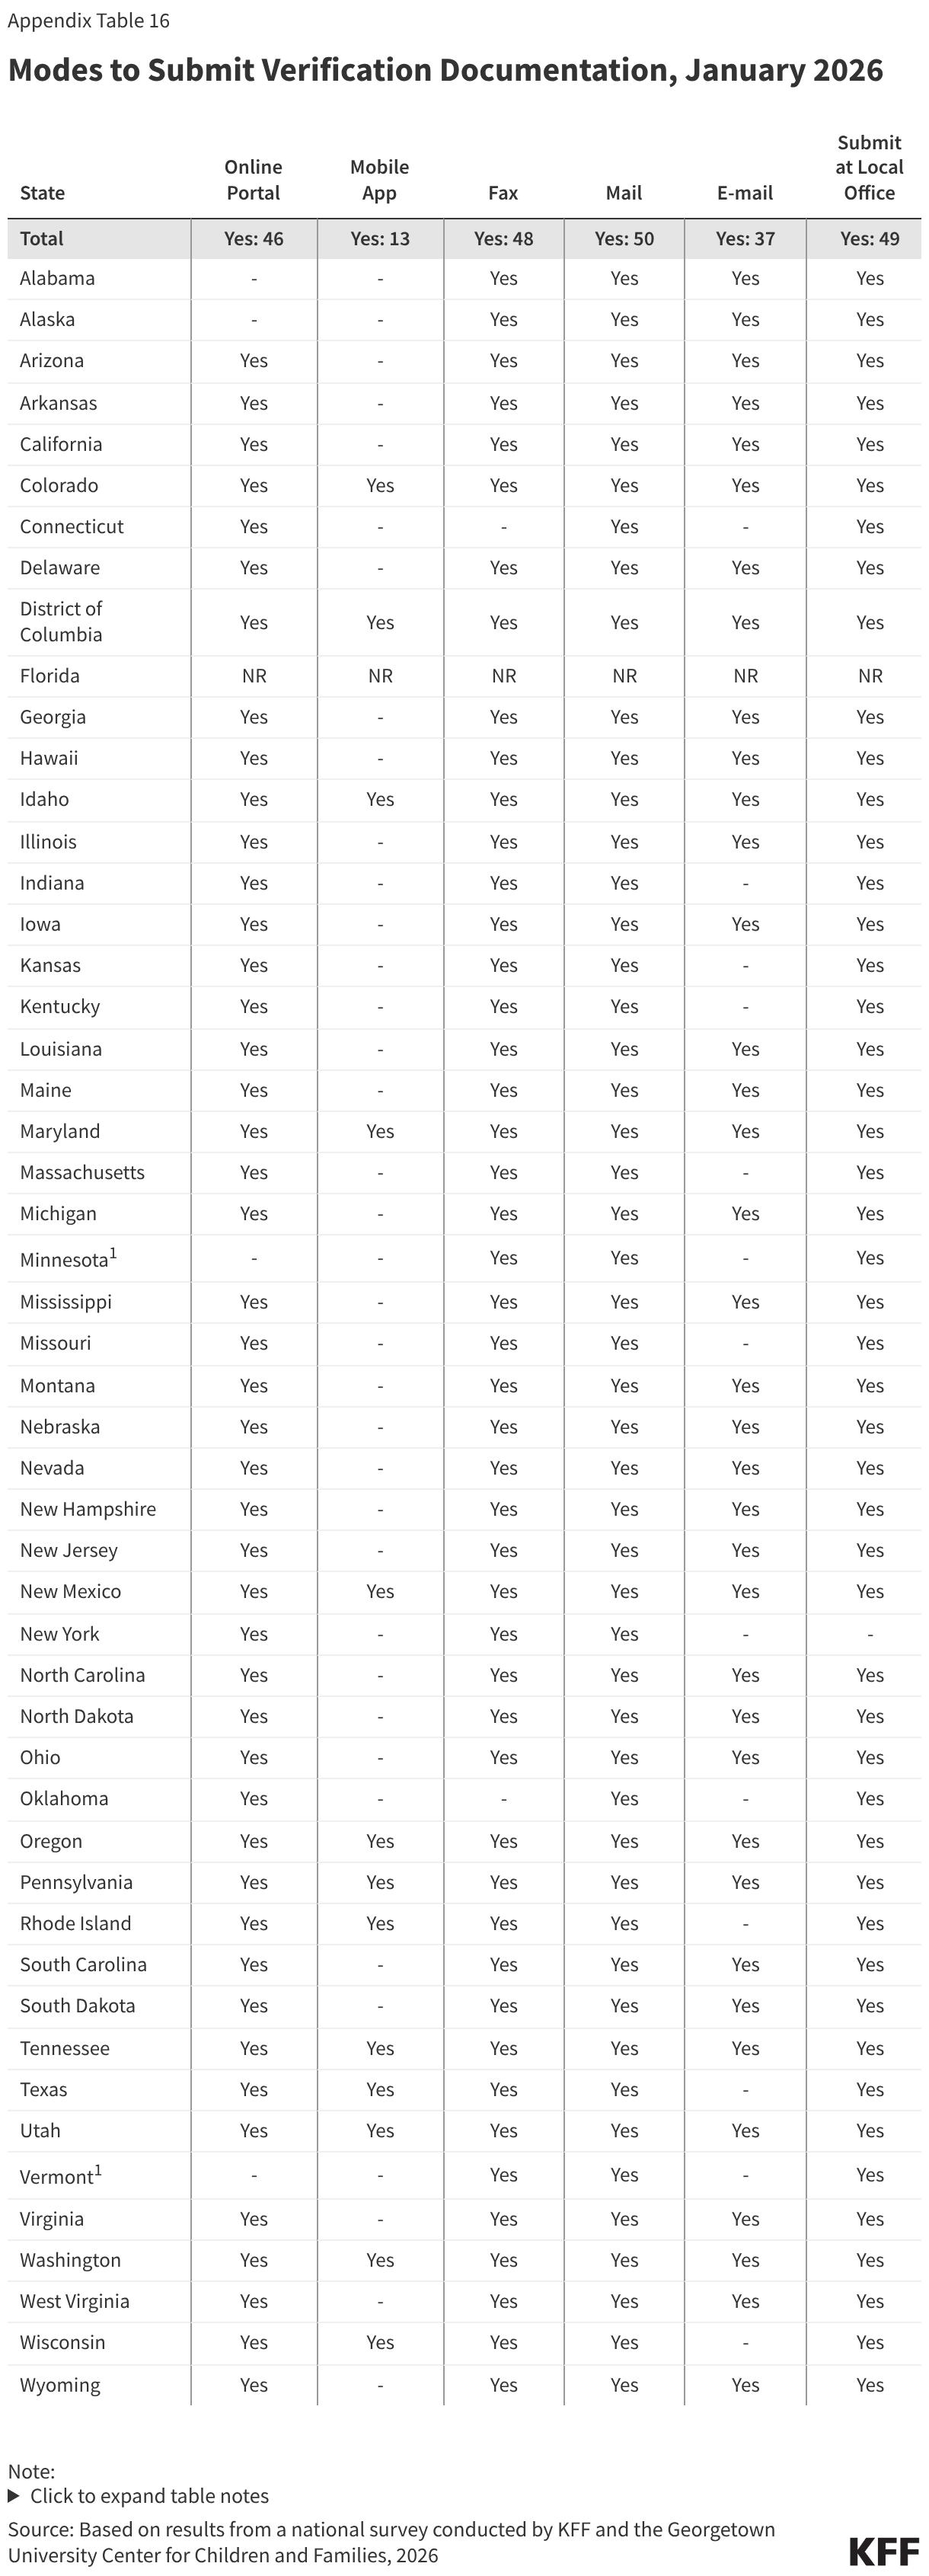
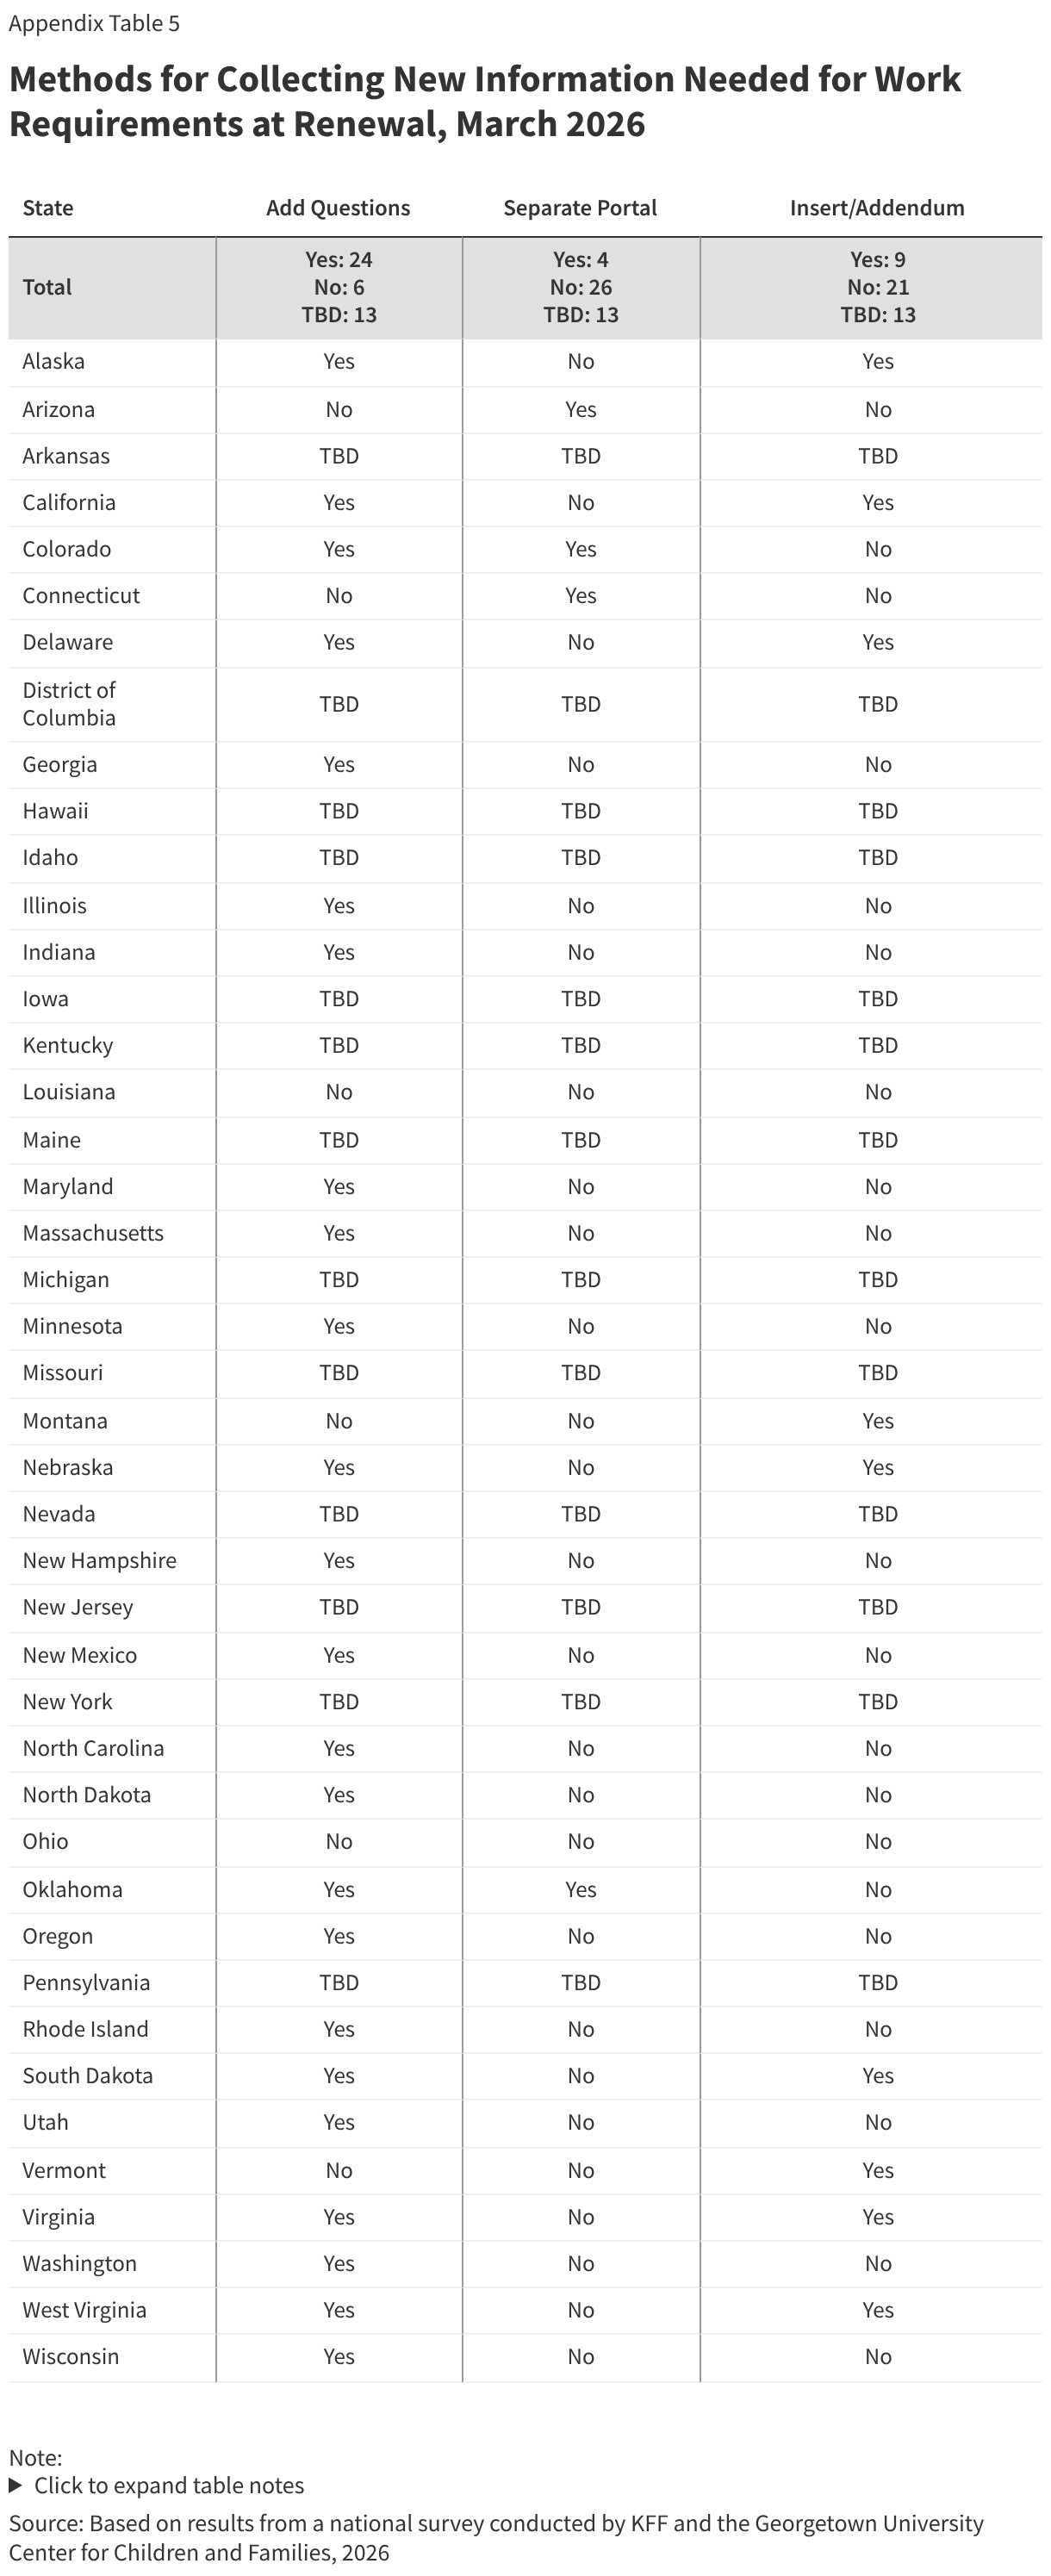
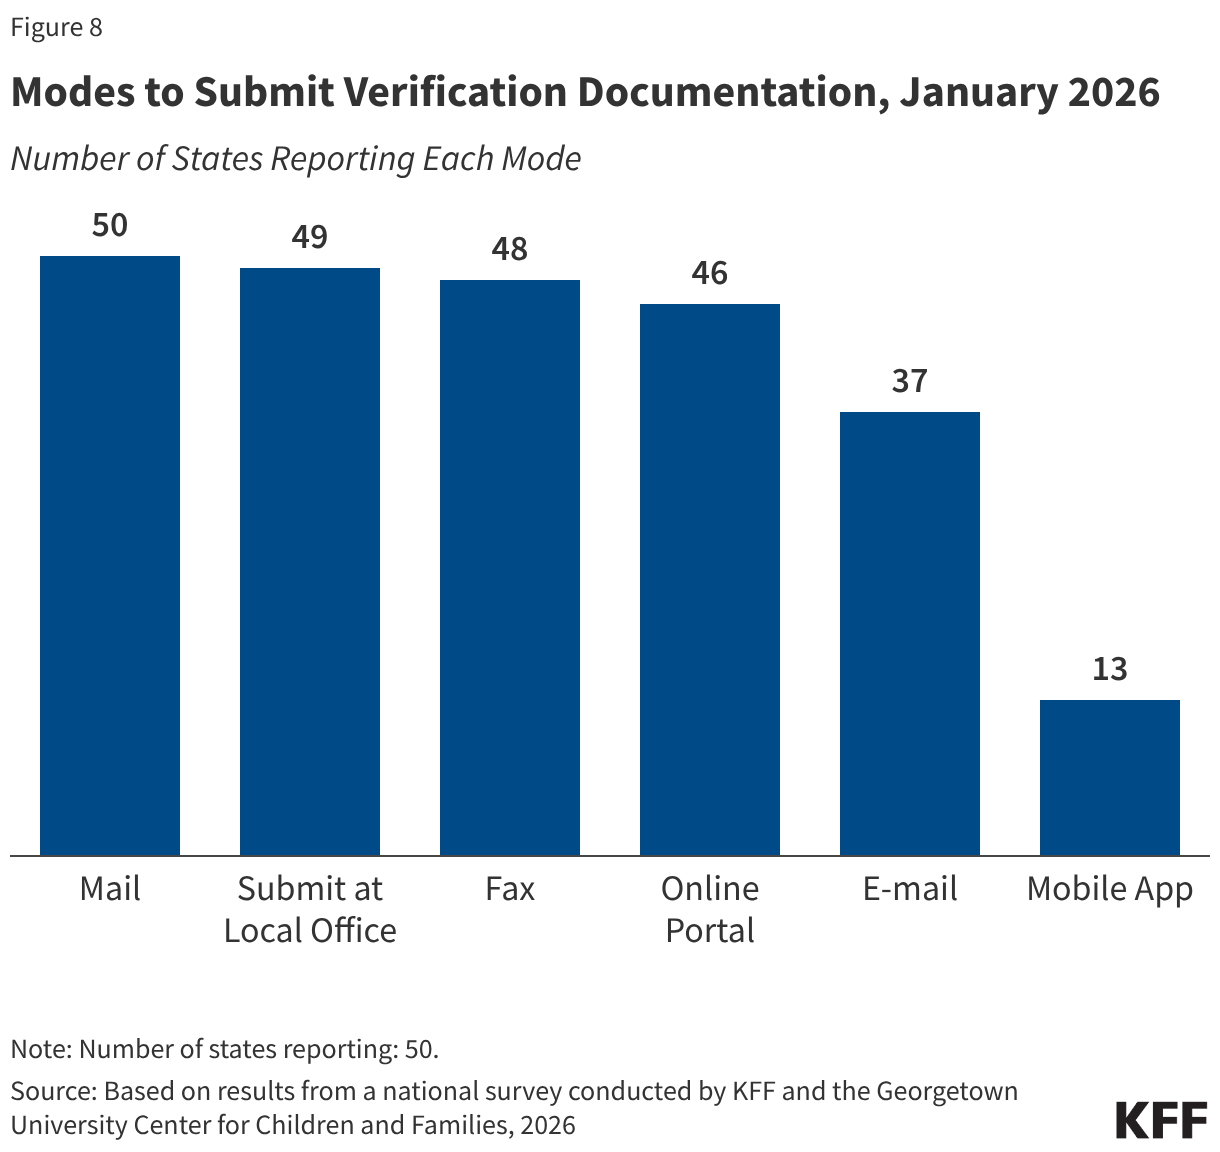
In advance of implementing work requirements, most states maximize options for individuals to submit verification documents. Once states implement work requirements, providing applicants and enrollees with multiple ways to upload documents will help minimize the number of people who are denied or lose coverage because they were unable to submit verification documentation. Documents can be submitted by mail (50 states), to a local office (49 states), by fax (48 states), through online accounts (46 states), via email (37 states), and through mobile apps in 13 of the 16 states with mobile apps (Figure 8).
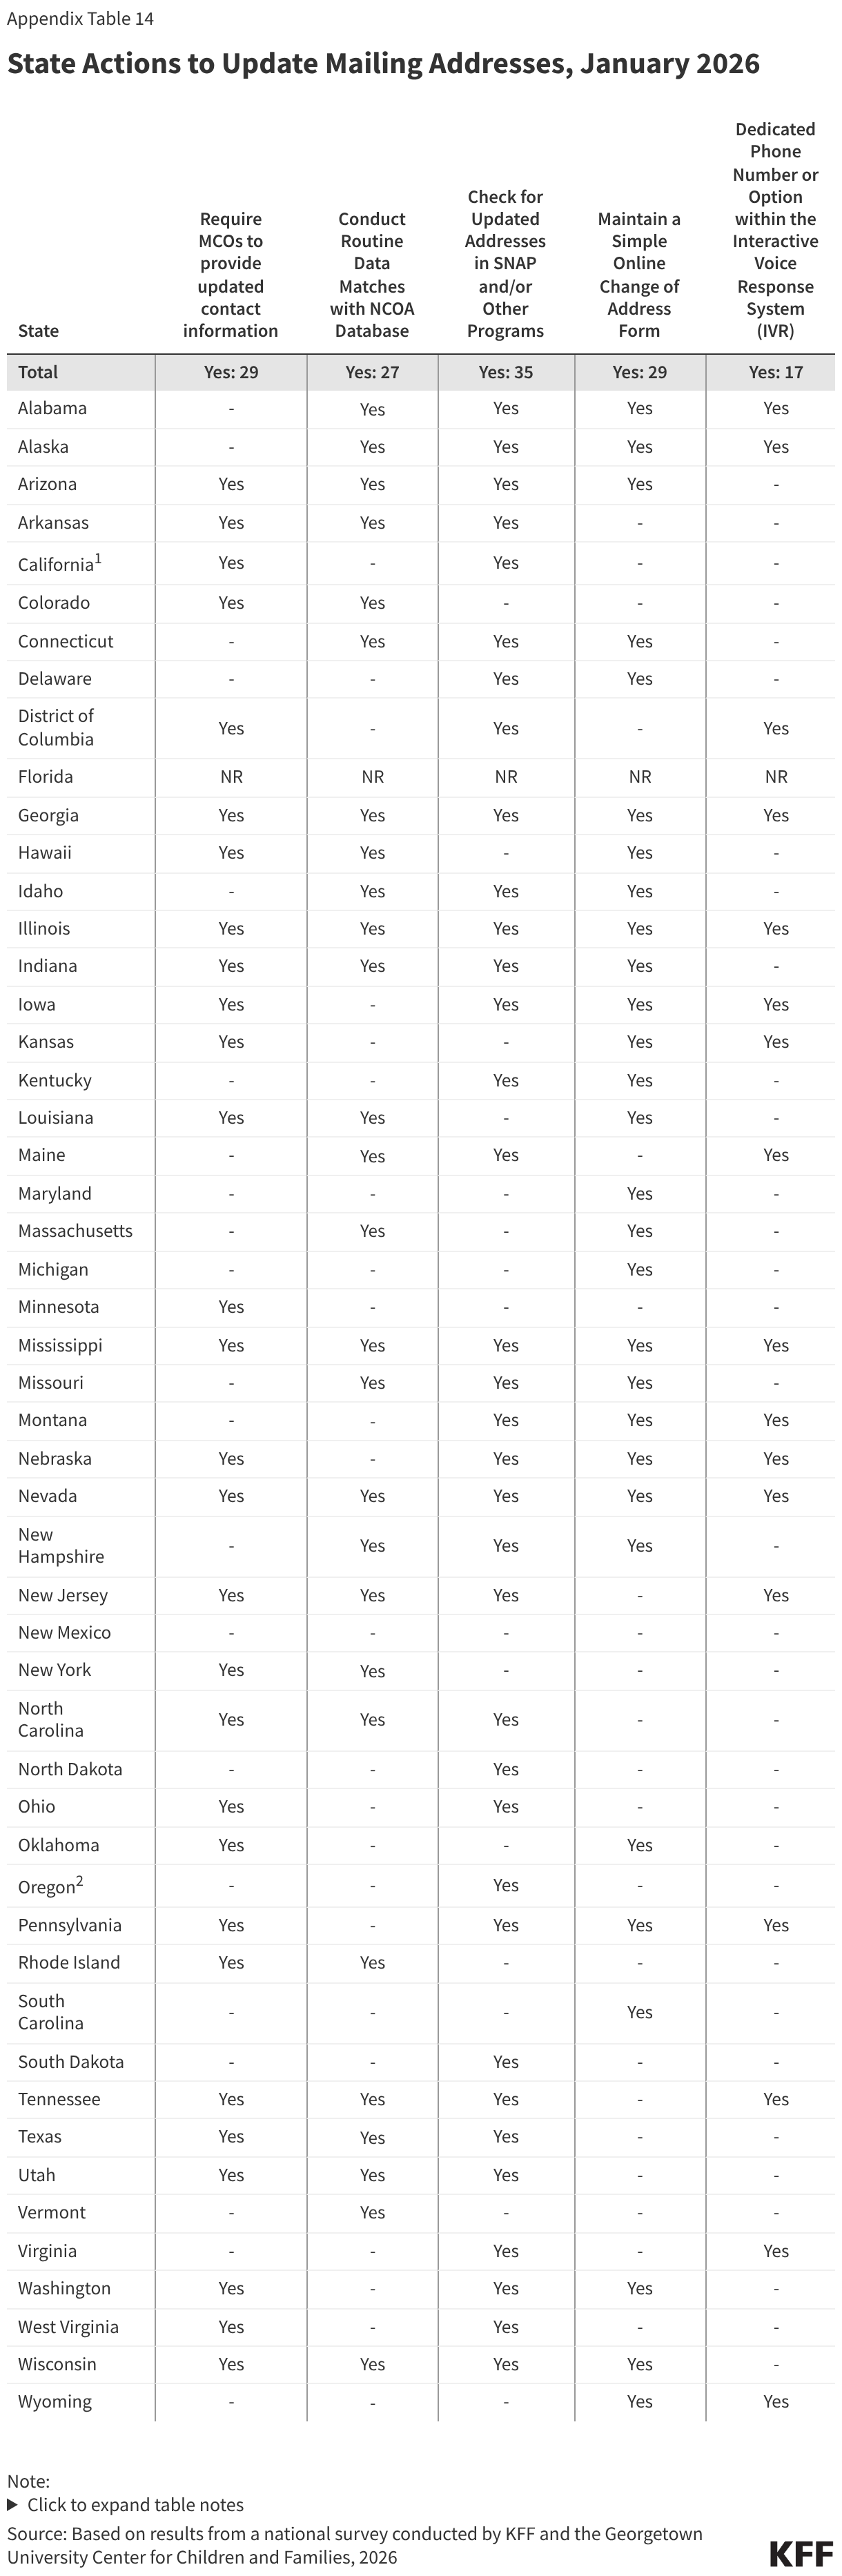
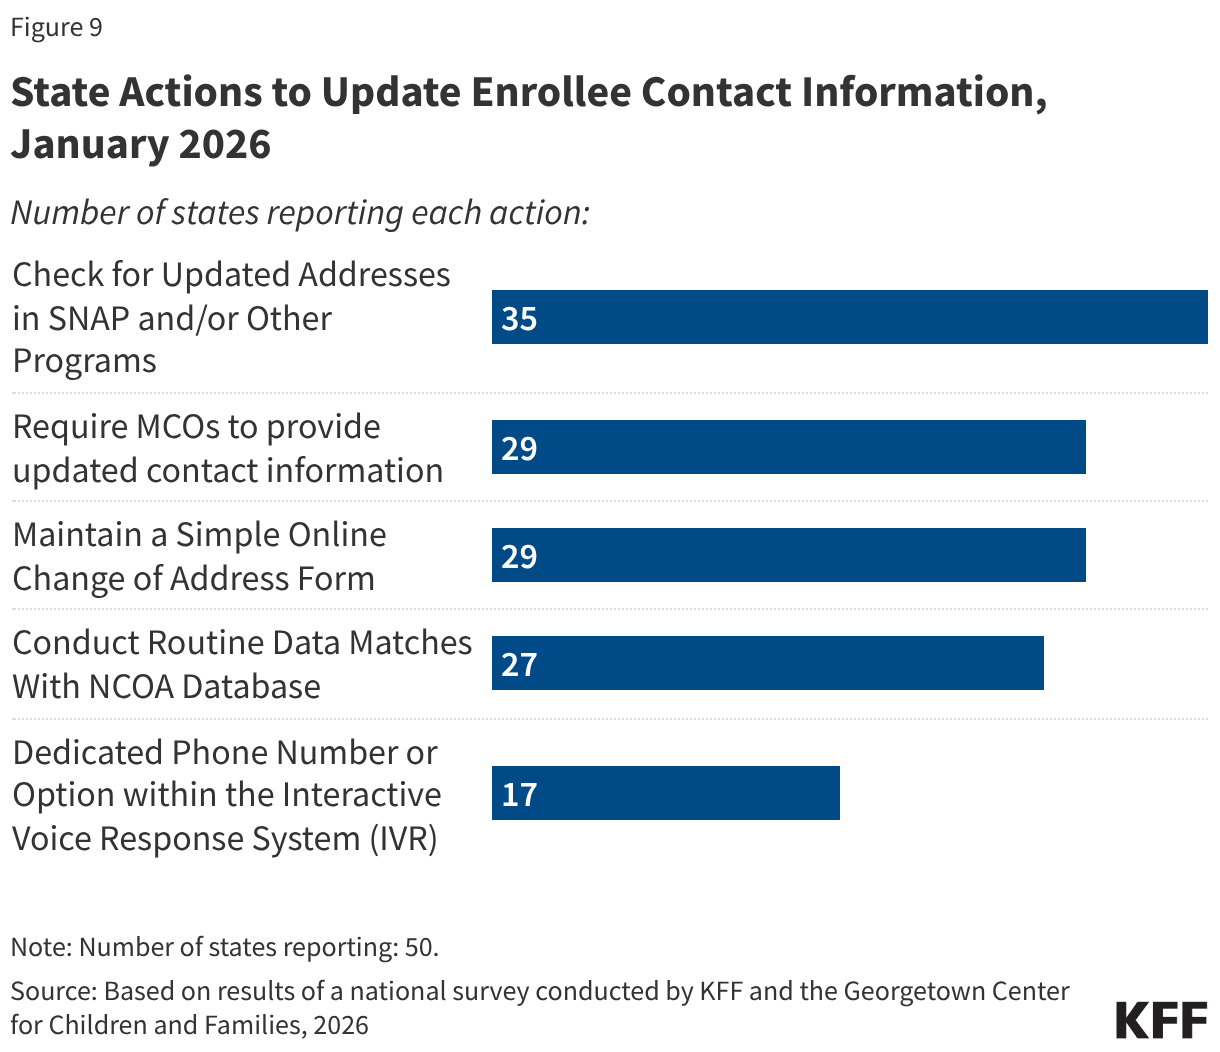
All states take multiple actions to update enrollee contact information, though some states will have to take additional steps to comply with requirements in the reconciliation law. The 2025 reconciliation law requires states to collect updated mailing addresses from reliable sources, including mail returned with a forwarding address, the USPS National Change of Address database (NCOA), and information from managed care plans. Starting January 1, 2027, states must contractually require all types of managed care organizations to transmit updated addresses for enrollees and must regularly check the NCOA. Currently, over half of states require MCO’s to provide updated contact information (29 states) or conduct routine data matches with NCOA (27 states), with 18 states using both sources (Figure 9). Two thirds of states (35) also check for updated information in SNAP or other programs, 29 states maintain a simple online change of address form, and 17 states have a dedicated phone option for reporting new contact information.
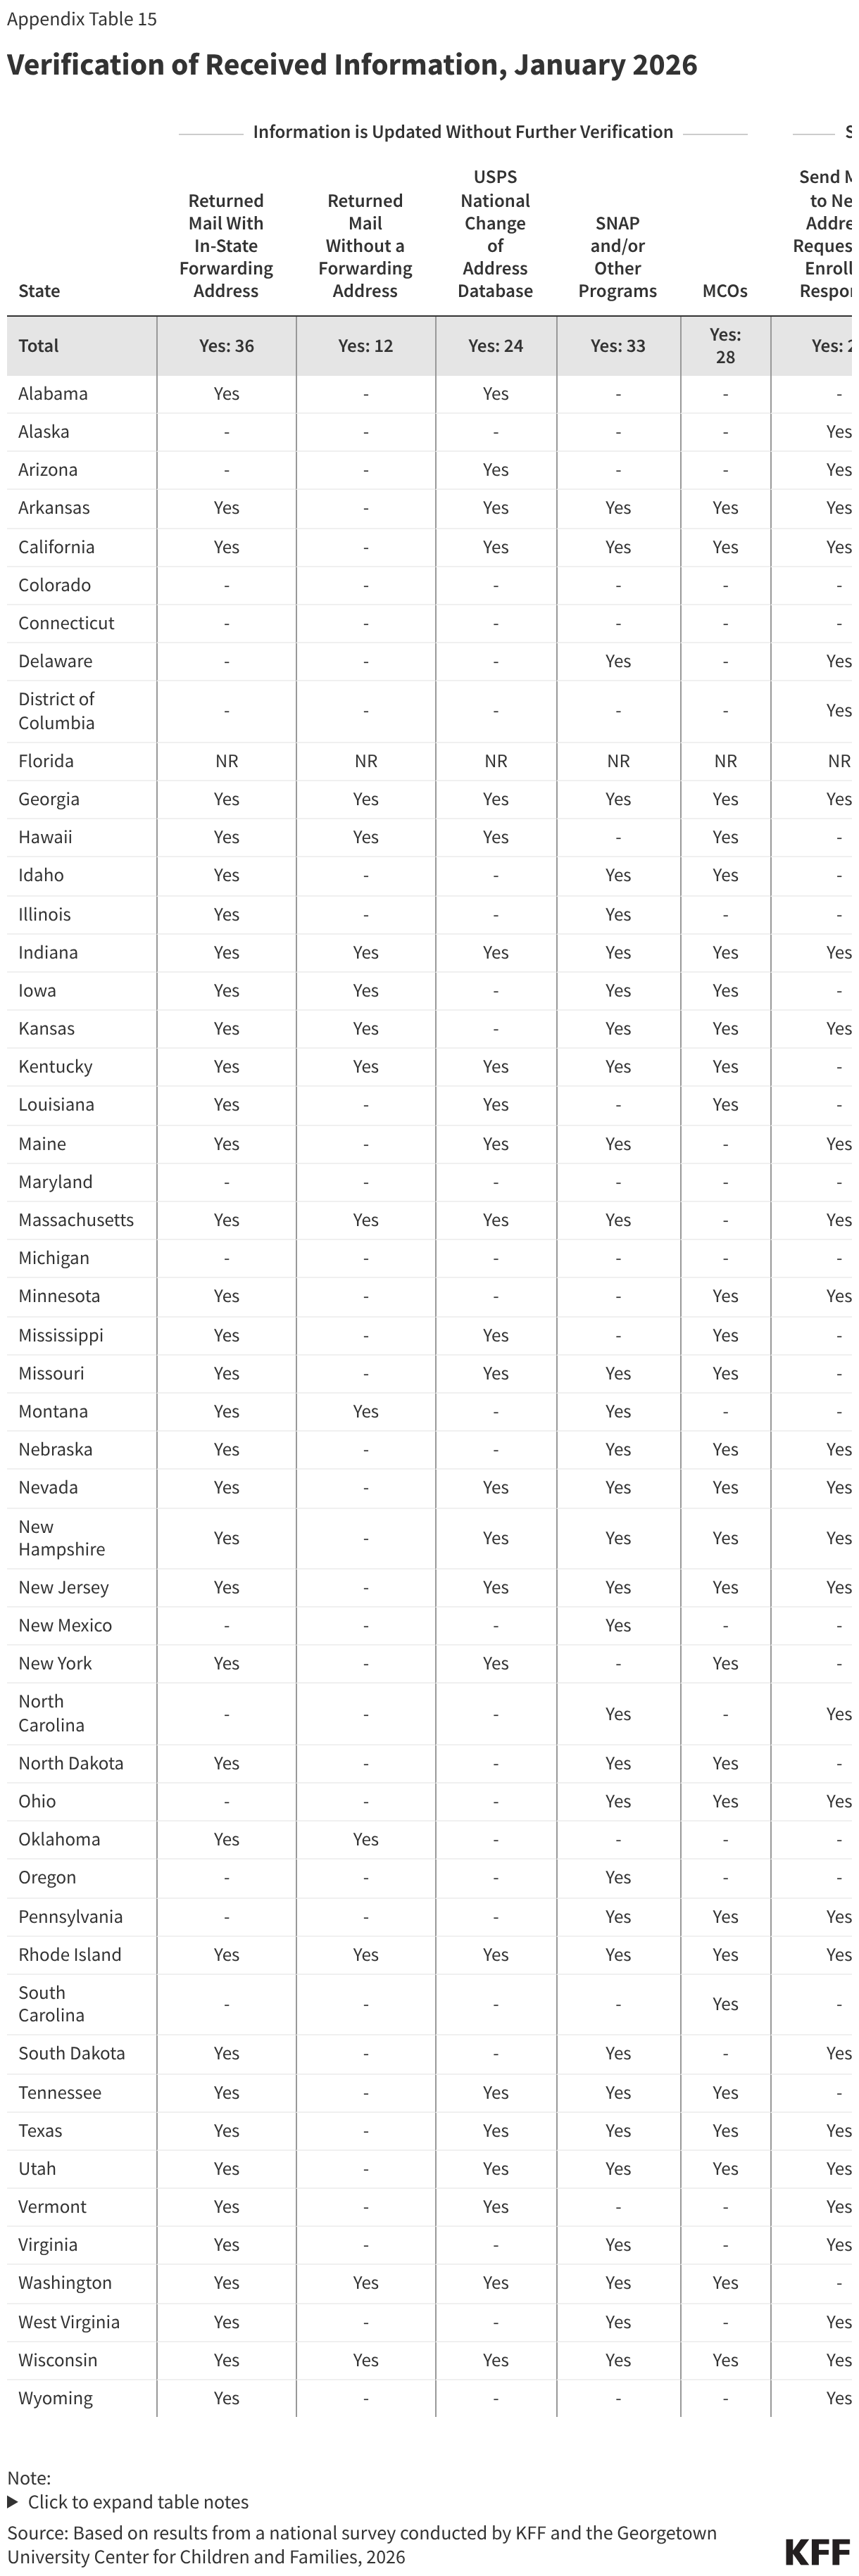
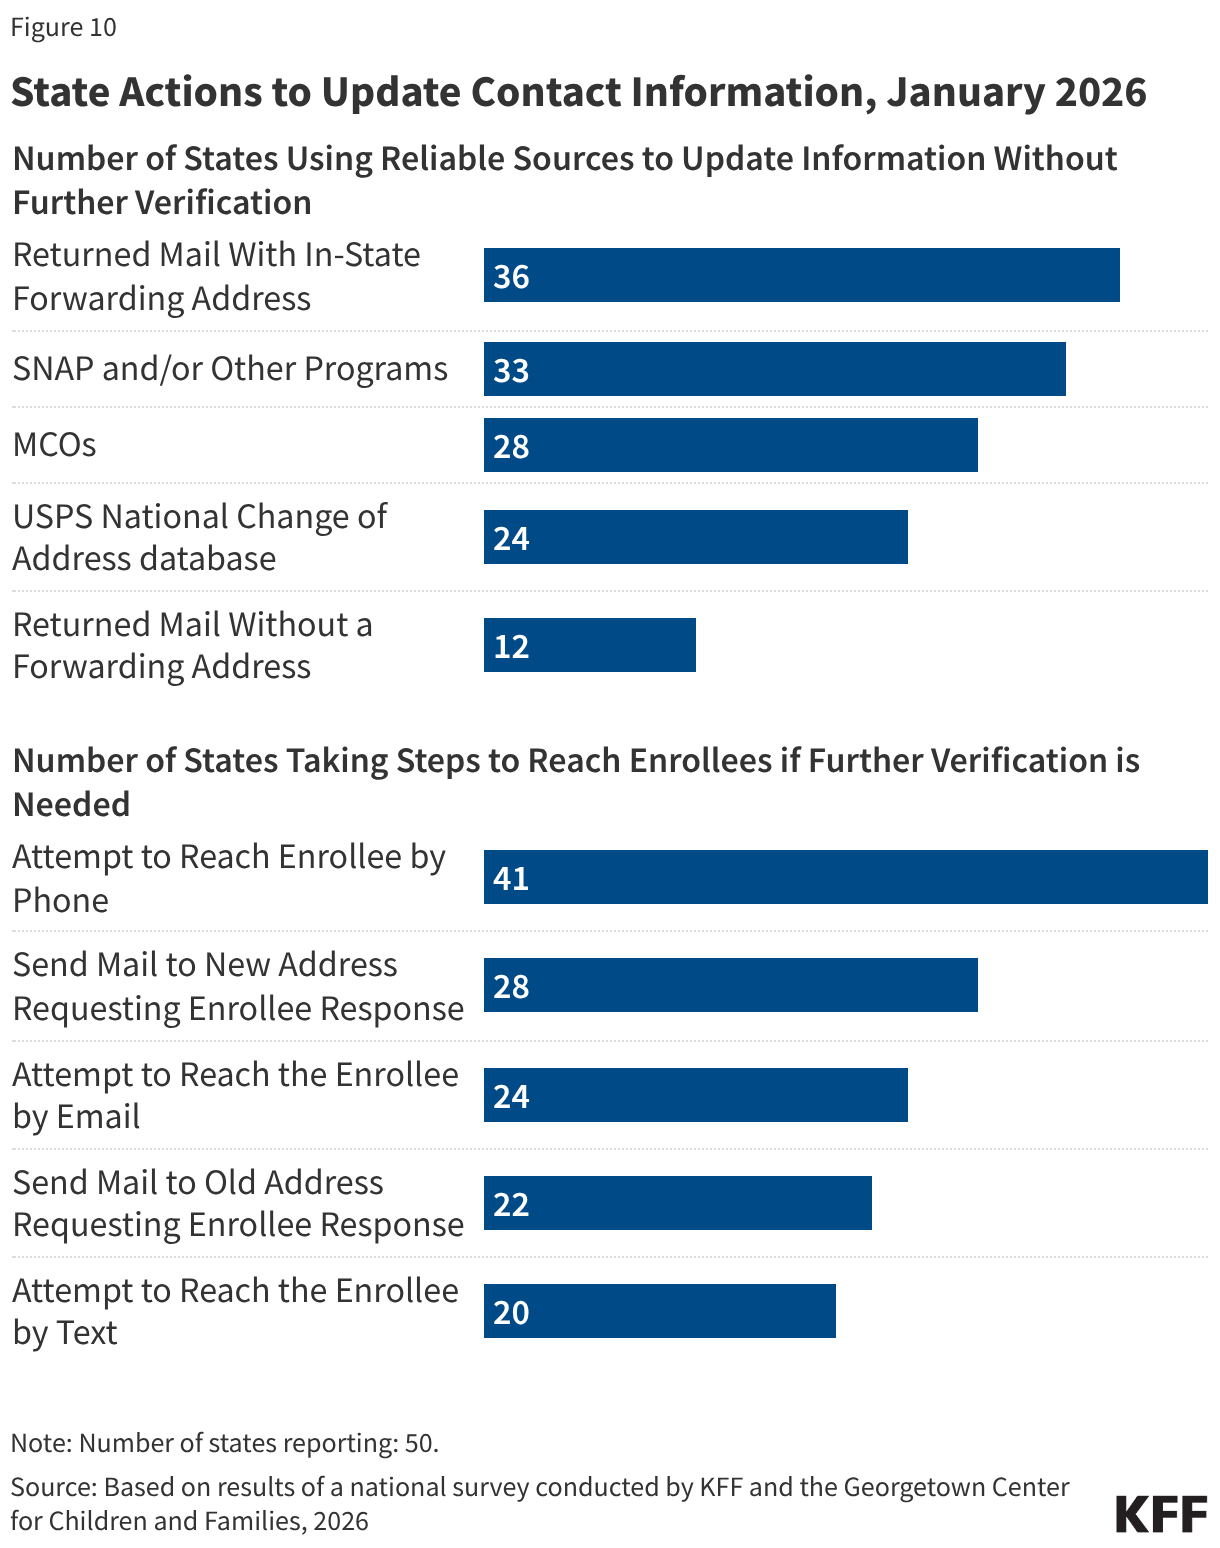
Although not required by the reconciliation law, many states accept updated contact information from reliable sources “as verified” and make a good faith effort to contact an individual when verification is needed. The 2024 eligibility and enrollment rule would have required states to accept the contact information received from reliable sources without having to conduct further verification, including confirming with the enrollee. Without requiring further verification, 36 states update addresses from returned mail with an in-state forwarding address, 28 states accept MCO-submitted changes, 24 states accept NCOA updates, 33 states use SNAP or other program information to update mailing addresses, and 12 states update returned mail without a forwarding address (Figure 10). The E&E rule would also have required states to make a good faith effort to contact an individual when mail is returned with no forwarding address or with an out-of-state address. Currently, when additional information to confirm an address is needed, 28 states send mail to the new address and 22 states send mail to the old address, requesting enrollee confirmation. States also attempt to reach the individual by phone (41 states), by email (24 states), or by text (20 states).
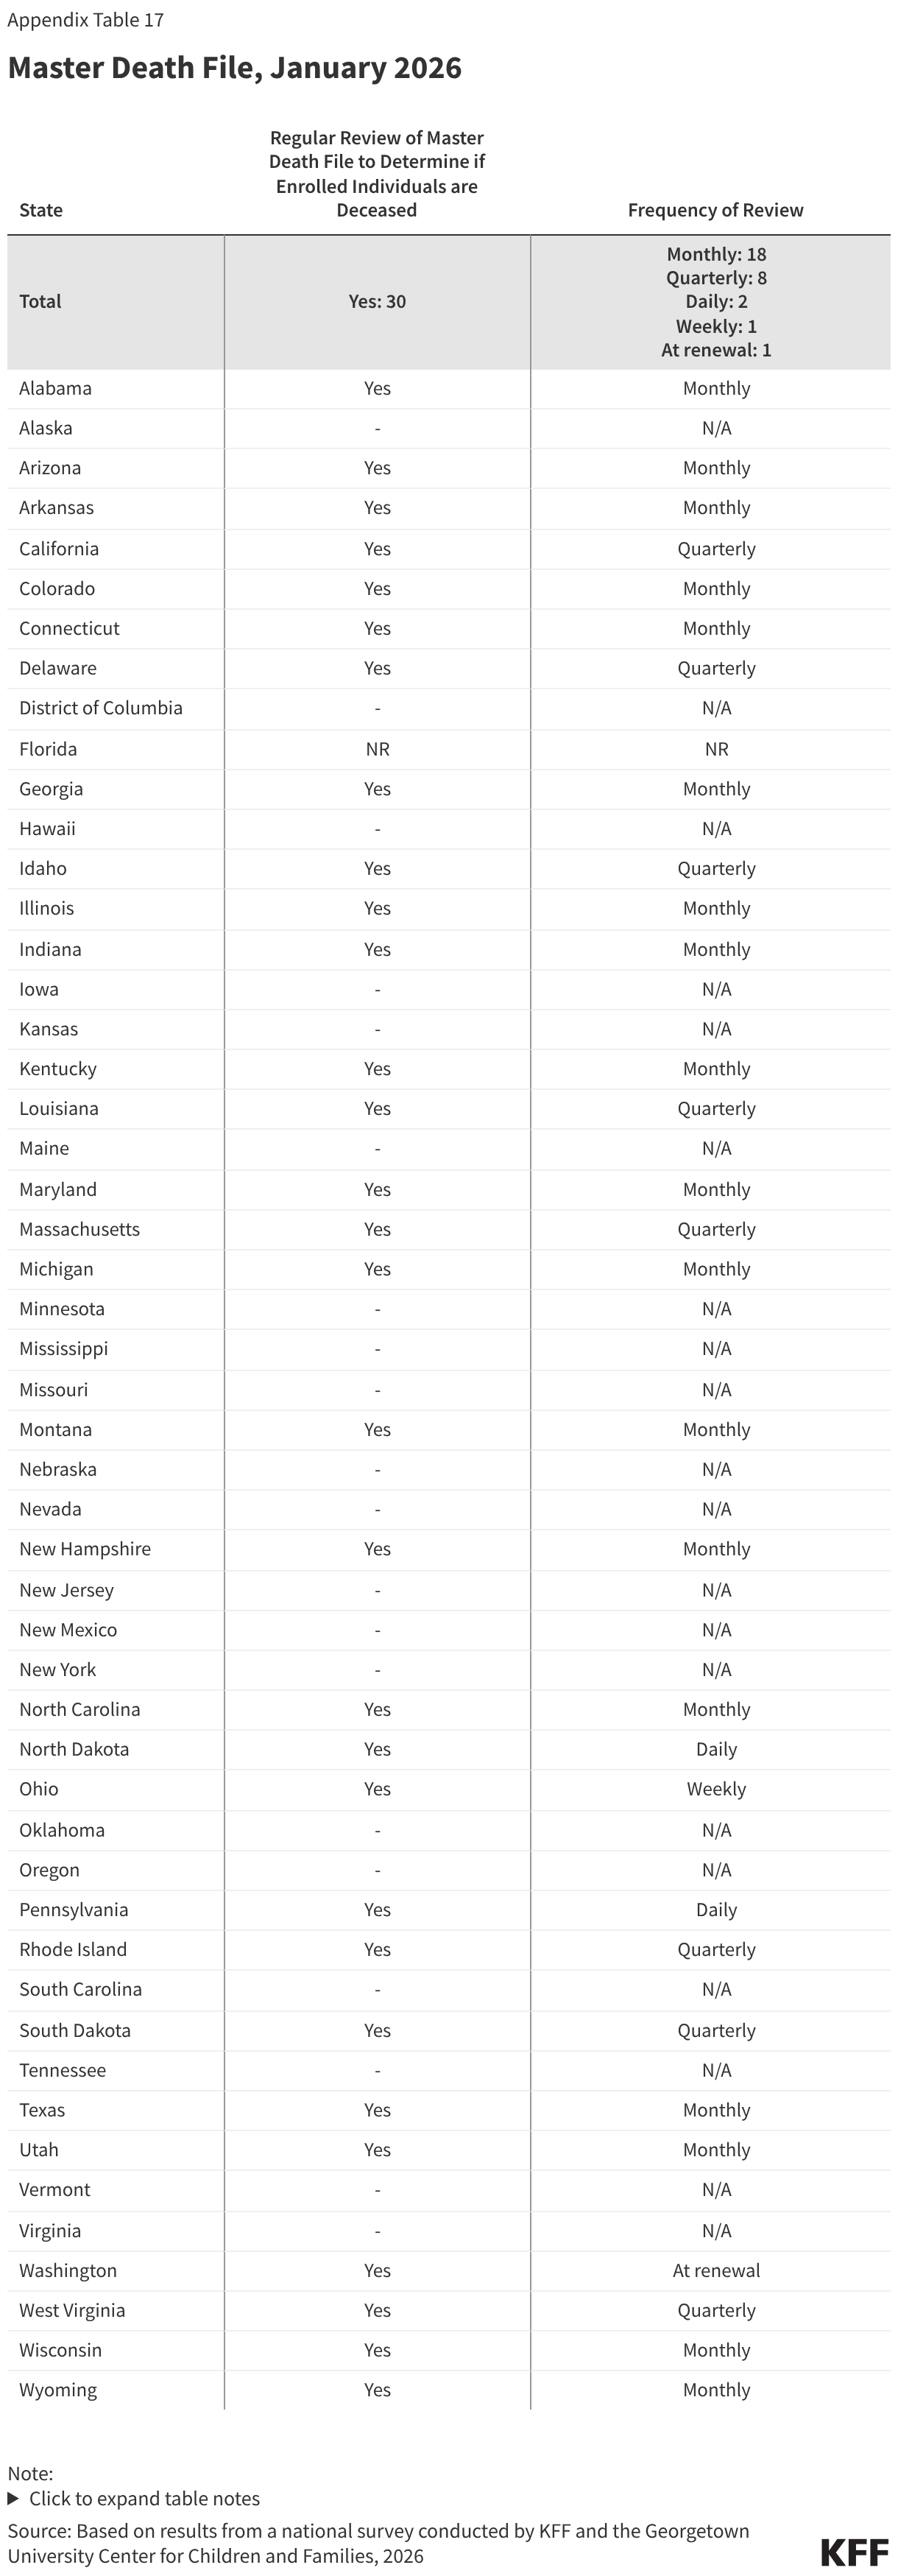
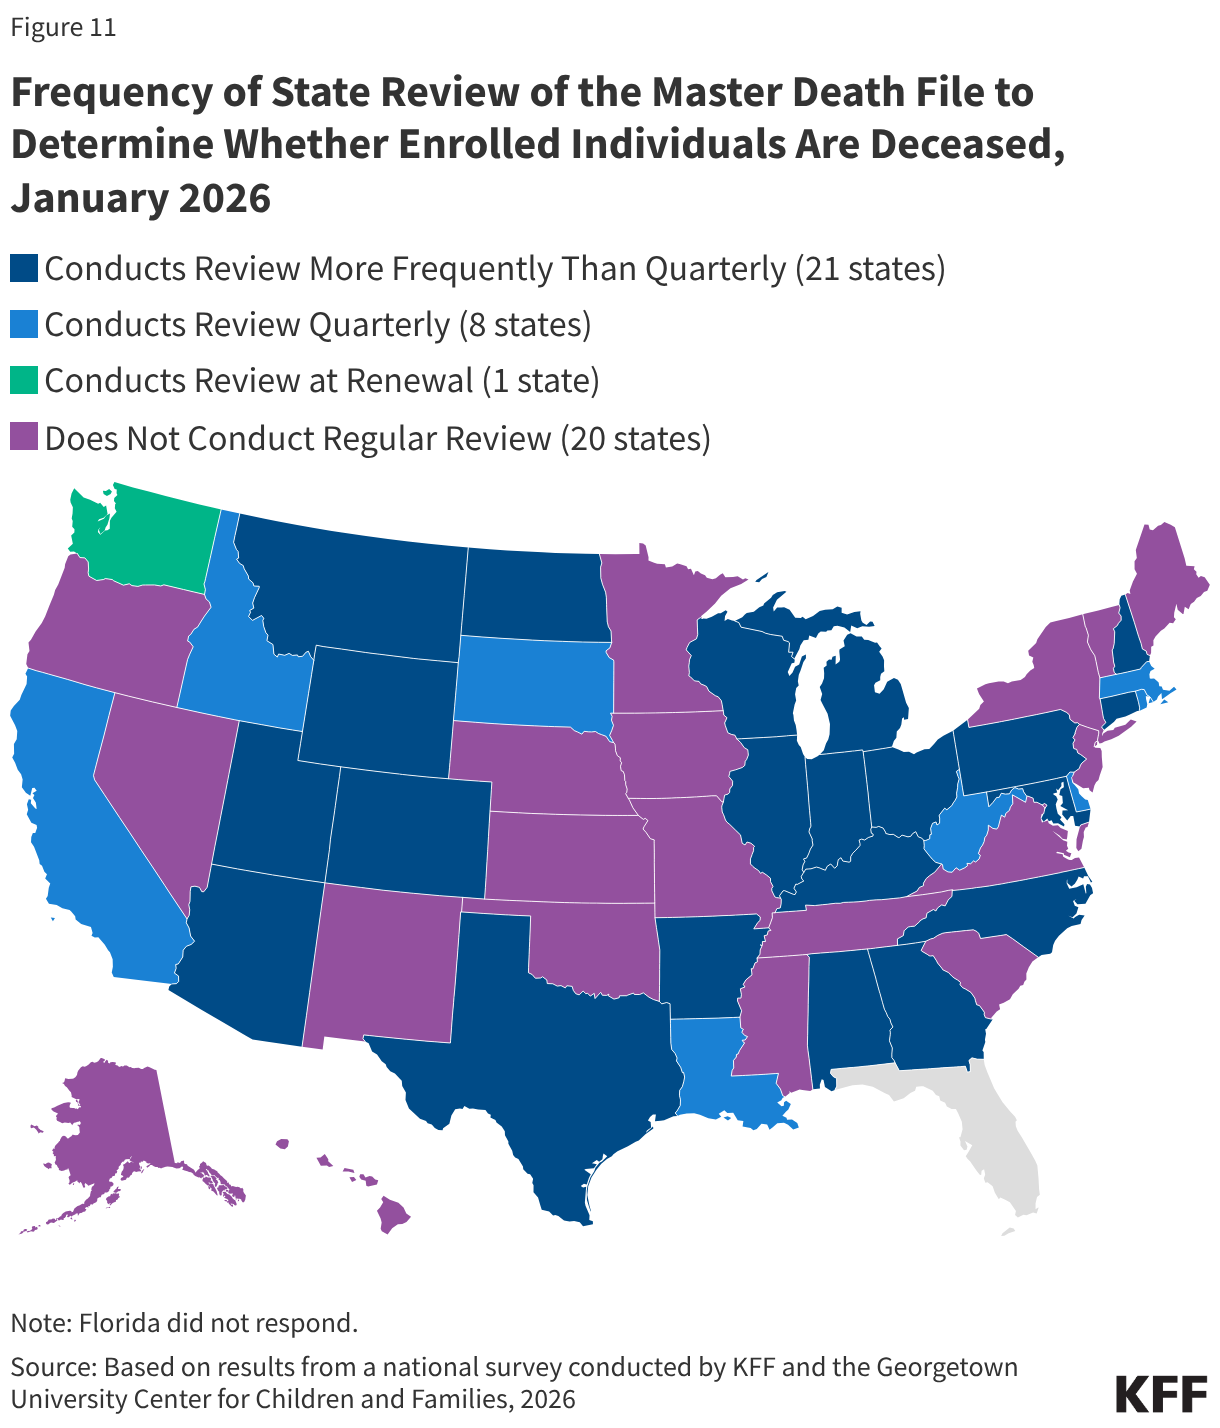
Over half of states review the Death Master File to identify any enrollee who is deceased, as will be required by the reconciliation law. Beginning in January 2028, the reconciliation law requires all states to review the Death Master File at least quarterly to determine if an enrolled individual is deceased. States may treat the information as factual and are not required to attempt to contact the individual to confirm its accuracy. However, they are required to reinstate coverage if an error is made in disenrolling an individual who is still alive. Currently, 30 states regularly review the Master Death file, and all but one review on a quarterly basis or more frequently (Figure 11). Beginning October 1, 2029, states also will be required to submit Social Security numbers and other personal enrollment information monthly to a new federal system to check for enrollment in more than one state, as well as at application and renewal. This system will replace the requirement that states use the Public Assistance Reporting Information System (PARIS) currently used to check for duplicate enrollment.
Use of AI
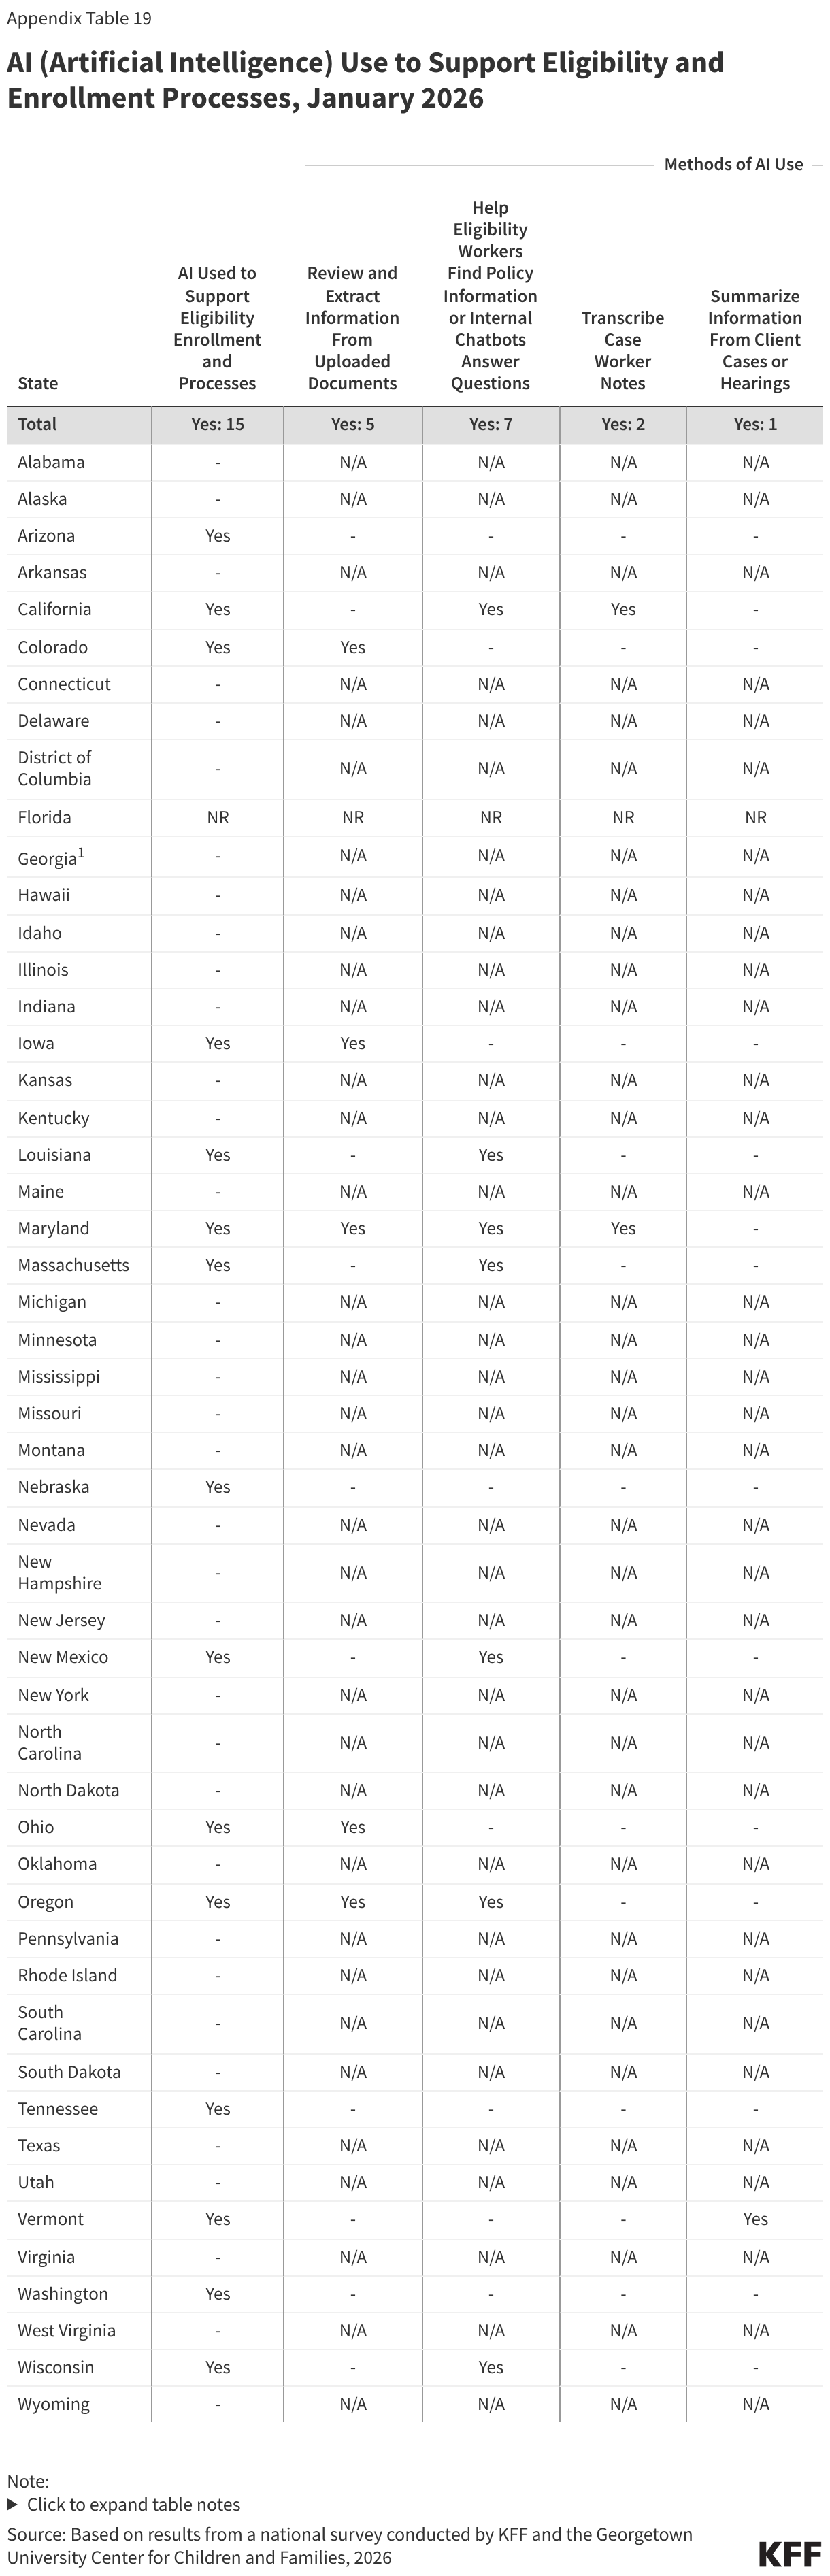
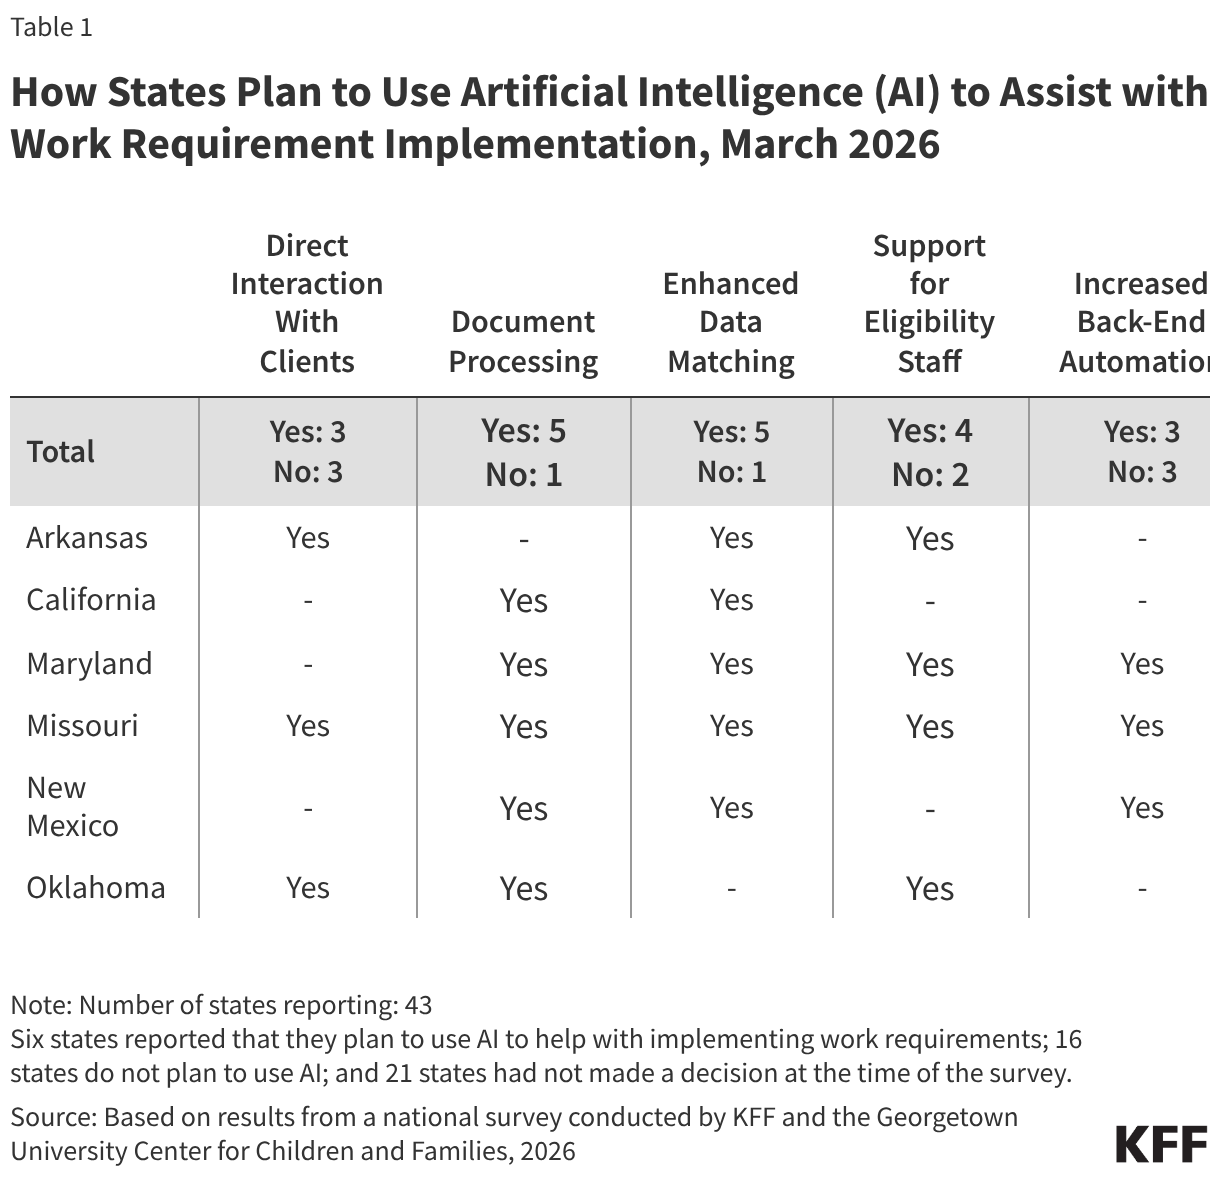
Several states are using AI in ways that could be applicable to implementing work requirements. Of 22 states using AI, 15 states are using AI to support eligibility and enrollment processes. Five states say they use AI to review and extract information -- such as social security numbers or income data -- from uploaded documents, and one state is using AI to enhance data matching, both functions that can facilitate implementation of work requirements (Table 1). Other uses of AI include helping eligibility workers find policy information (7 states), transcribing case worker notes and hearings (2 states), or using bots to enroll deemed newborns or collect updated contact information (2 states).
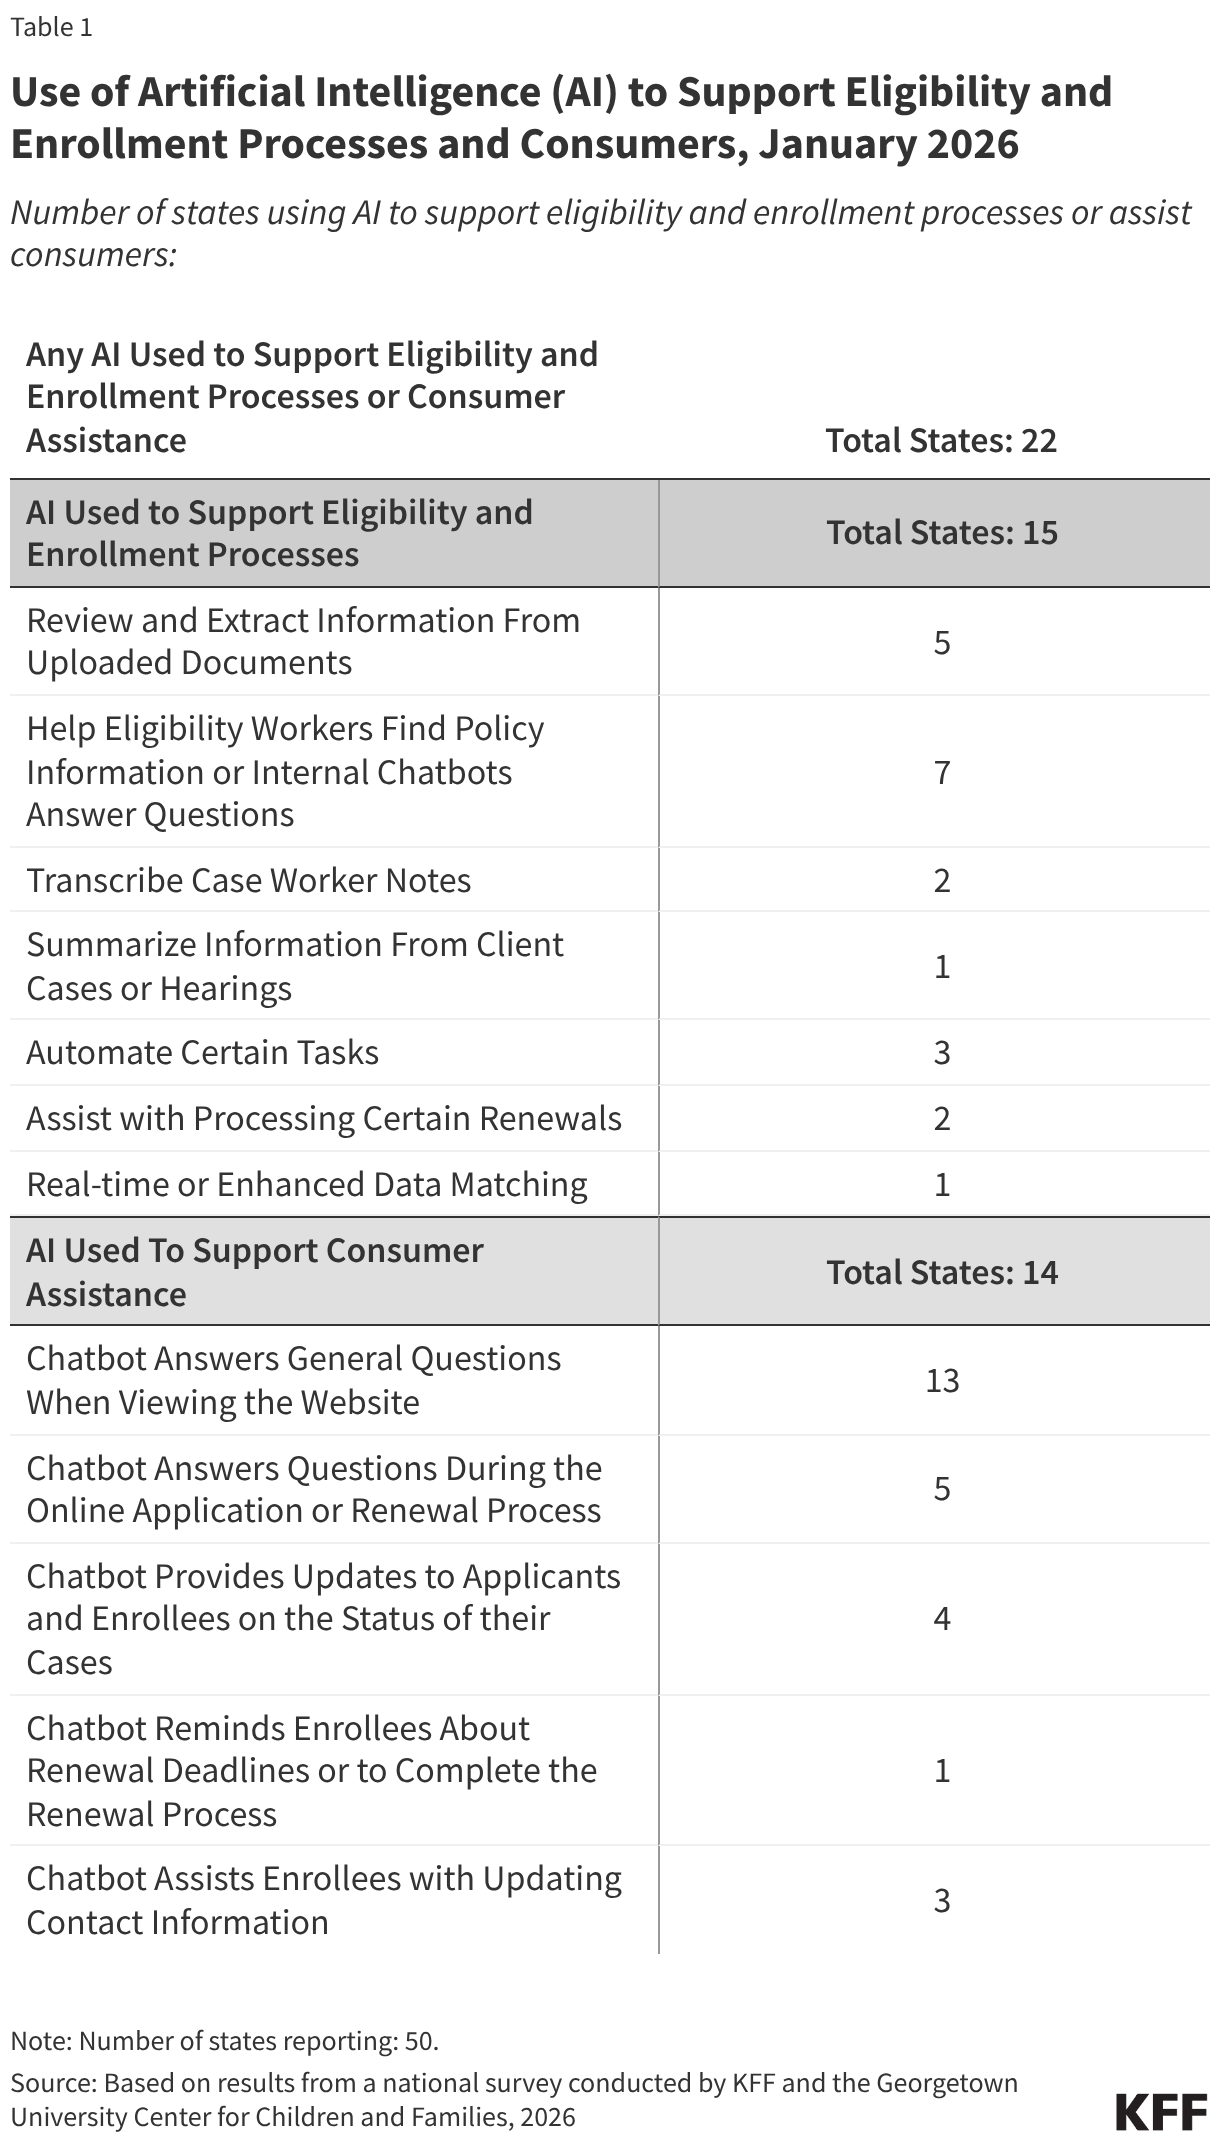
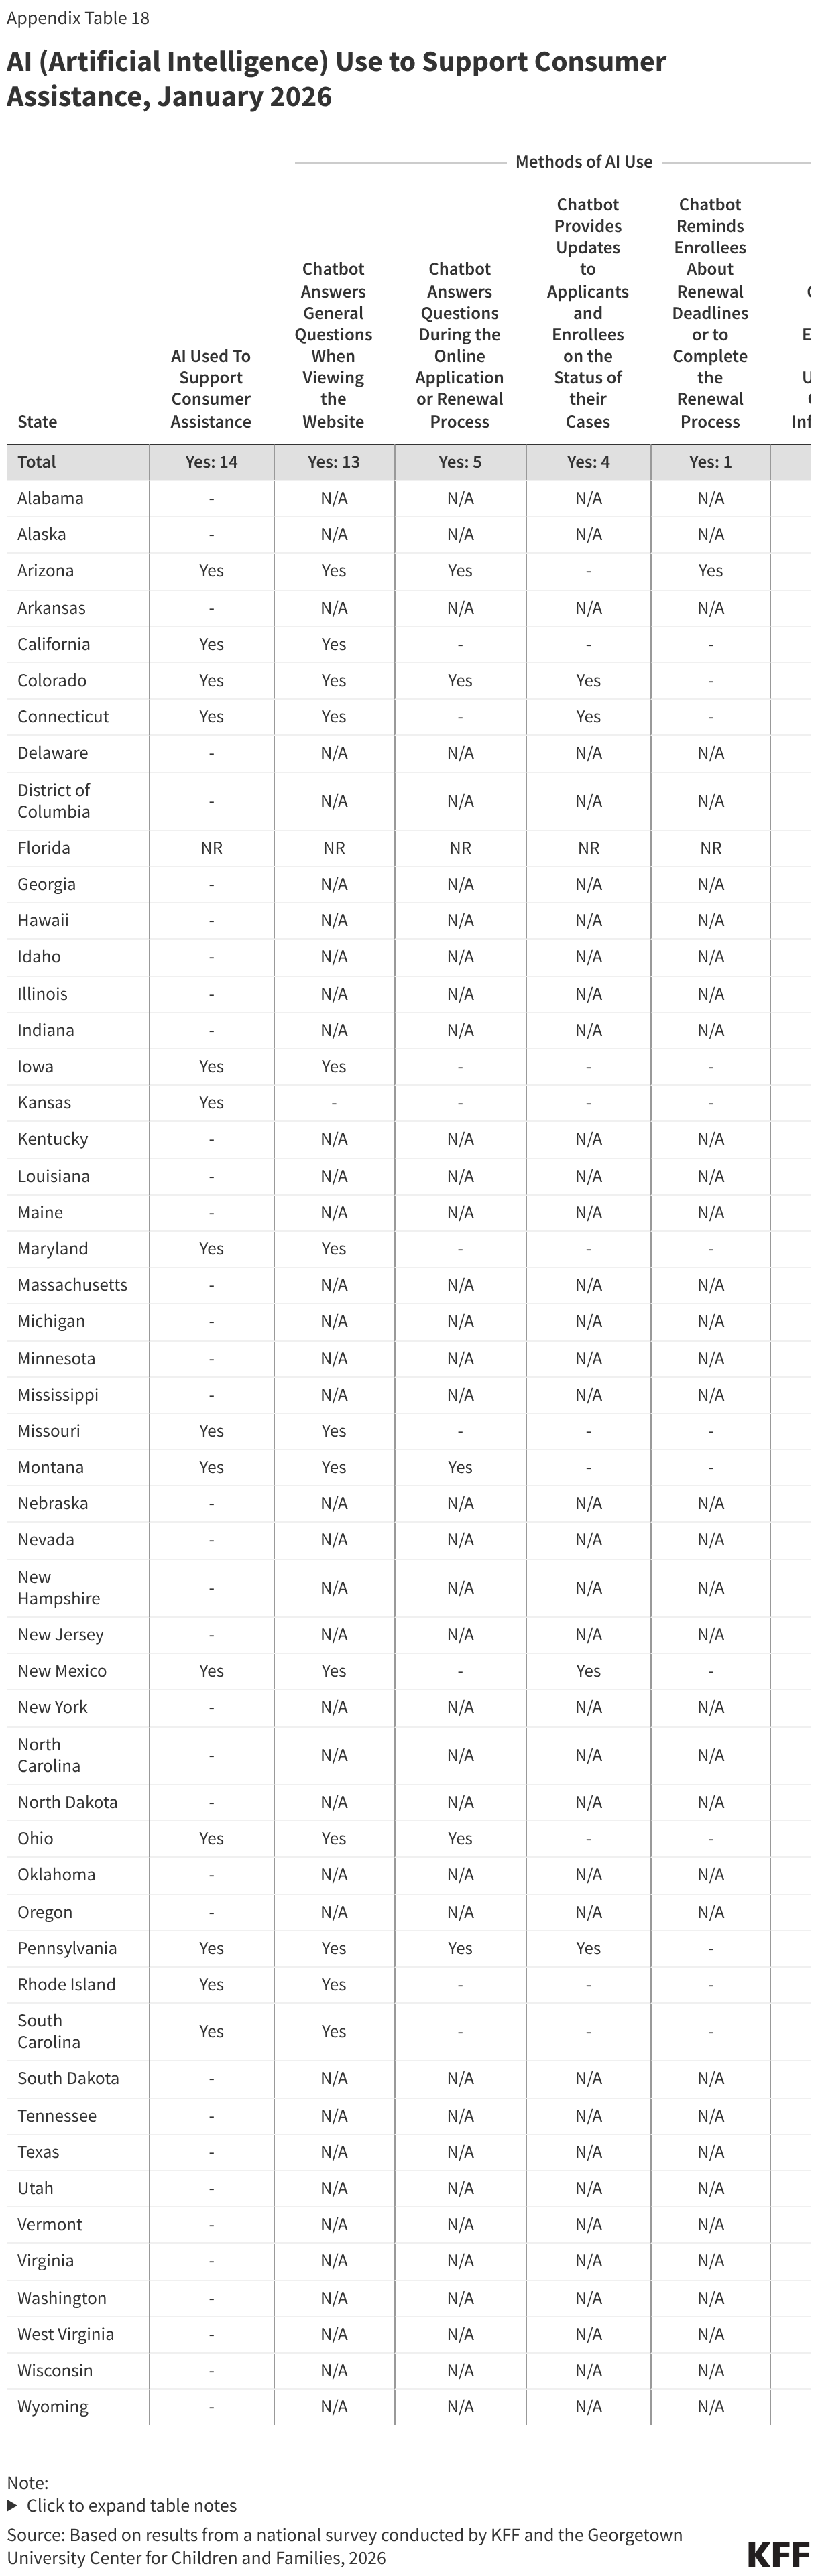
States are also using AI to support consumer assistance, most often through a chatbot to answer questions when individuals are viewing the website. Of the 14 states using AI to assist consumers, nearly all (13) have chatbots to answer questions on the website. A smaller number of states (5) report using AI to assist consumers during the application or renewal process. Chatbots are also used to provide updates to applicants and enrollees on the status of their case or to collect updated contact information.
Half of states (25) have SNAP and TANF integrated in their MAGI-Medicaid eligibility systems which may help to coordinate SNAP and Medicaid work requirements. In most cases, an individual who has met SNAP work reporting requirements can be automatically determined compliant with Medicaid work reporting requirements and adults without dependent children who are eligible for SNAP and not exempt from SNAP work requirements qualify for an exemption from the Medicaid work requirements. An integrated system makes it easier for states to share information across programs and identify individuals who meet work requirements or qualify for an exemption. Nearly three-quarters of states (36) also have integrated non-MAGI Medicaid, and 15 states have integrated child care subsidy eligibility.
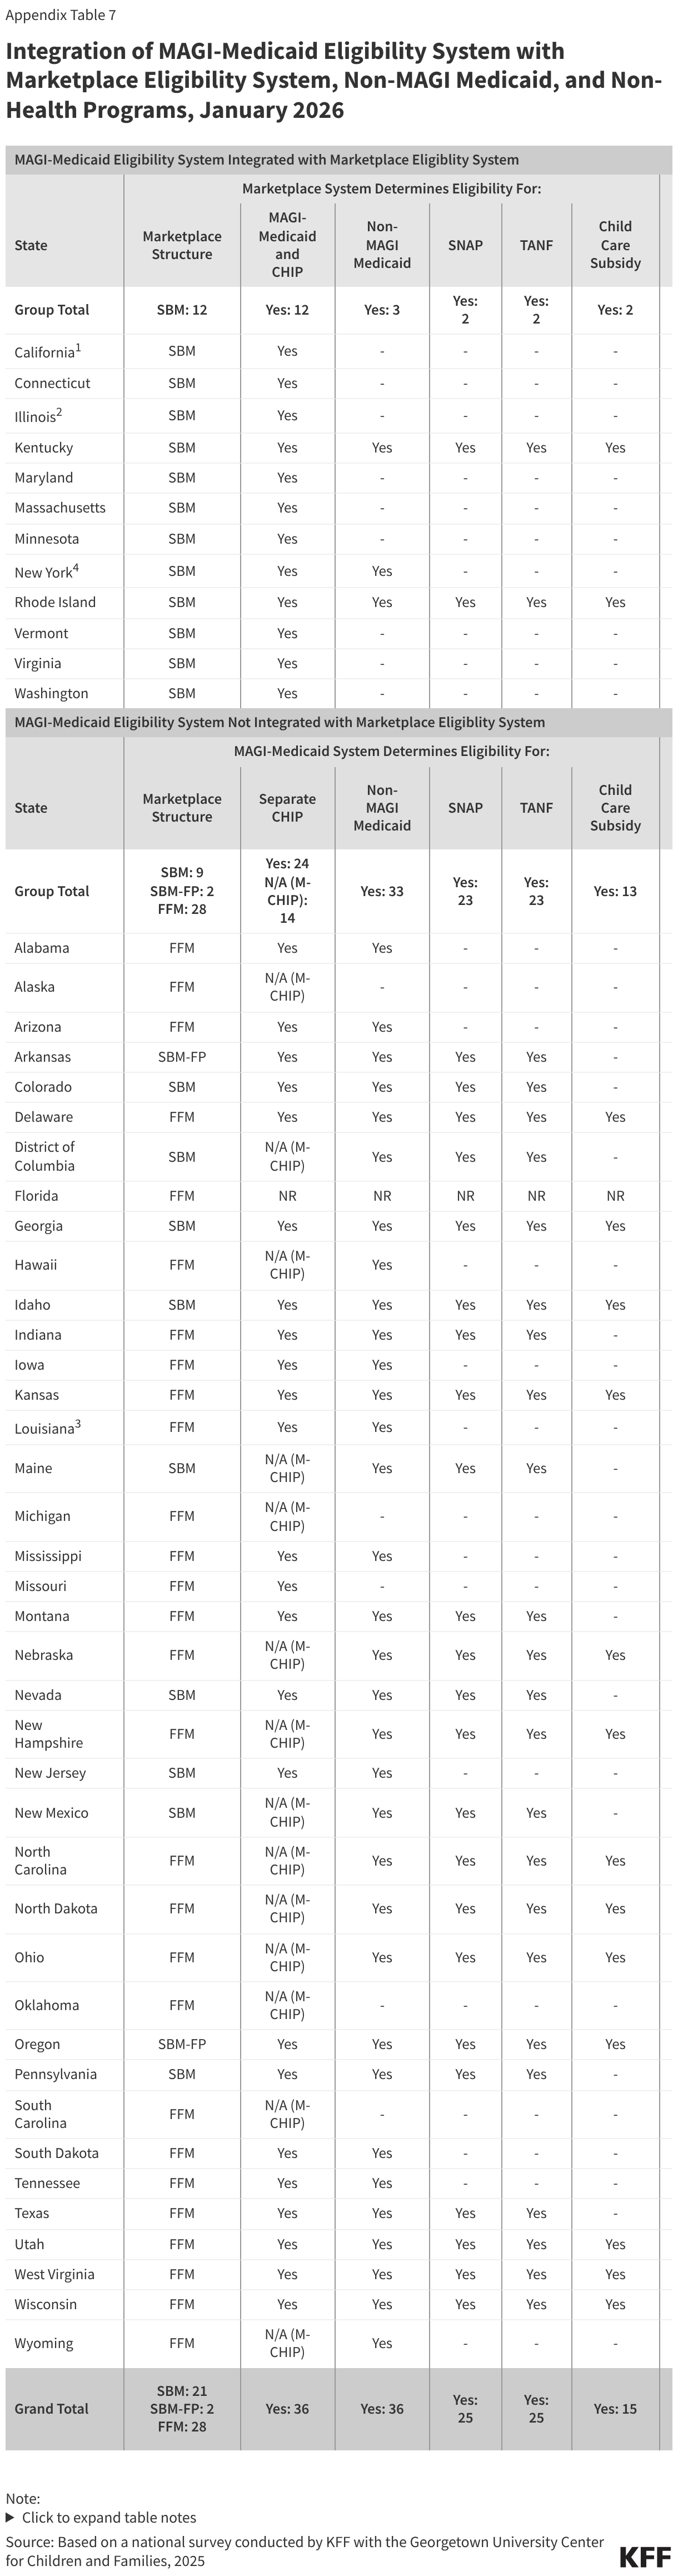
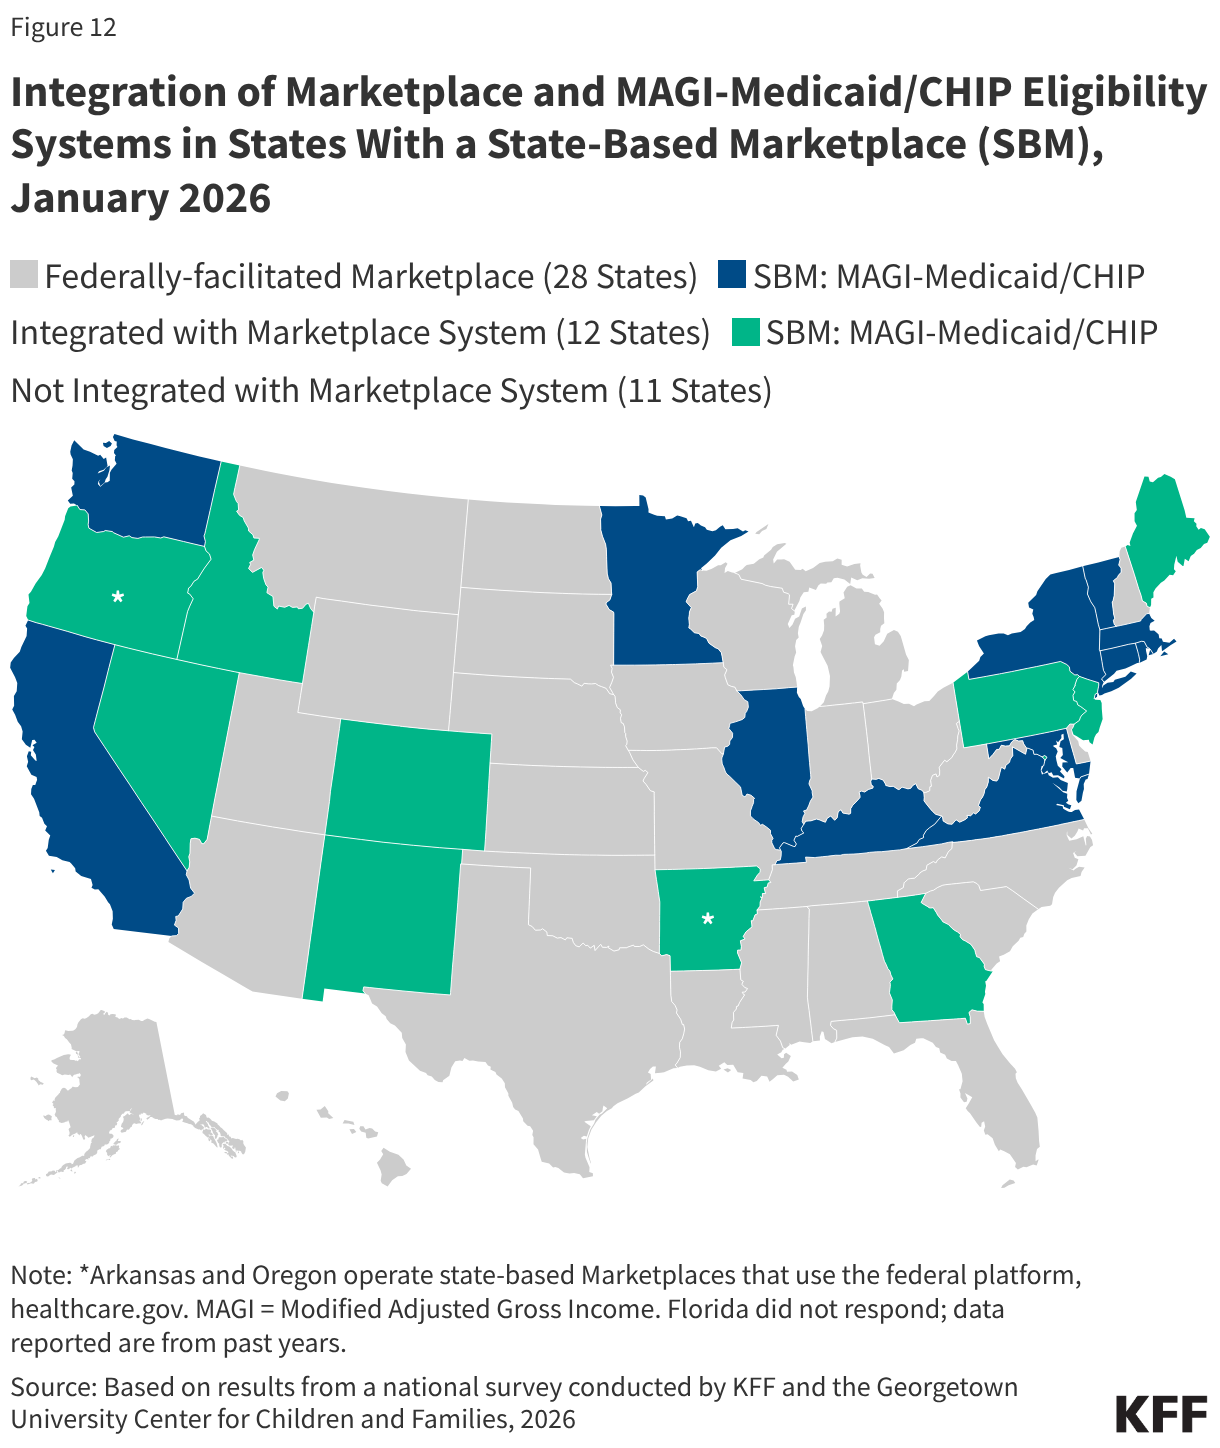
Over half of states that operate their own state-based Marketplace (12 of 21 SBM states) have integrated eligibility for MAGI Medicaid and CHIP into their Marketplace eligibility system. Illinois became the 12th state to integrate Medicaid and Marketplace eligibility systems (Figure 12). The remaining nine SBM states, as well as the two SBM states that use the Federally-facilitated Marketplace (FFM), have separate systems for determining eligibility for MAGI Medicaid and CHIP. Of the 30 states that rely on the Federally-facilitated Marketplace (FFM) for marketplace eligibility functions, eight allow the FFM to determine Medicaid eligibility (determination states) while the FFM assesses eligibility in 21 states (assessment states). The FFM relies on the state’s eligibility criteria and reliable data sources to make an assessment or determination. CMS has encouraged states to use the determination option as a strategy to reduce the workload when state administrative capacity is overwhelmed. However, it is unclear whether the FFM will be able to determine compliance with or exemption from Medicaid work requirements. Upcoming CMS guidance may provide some clarification.
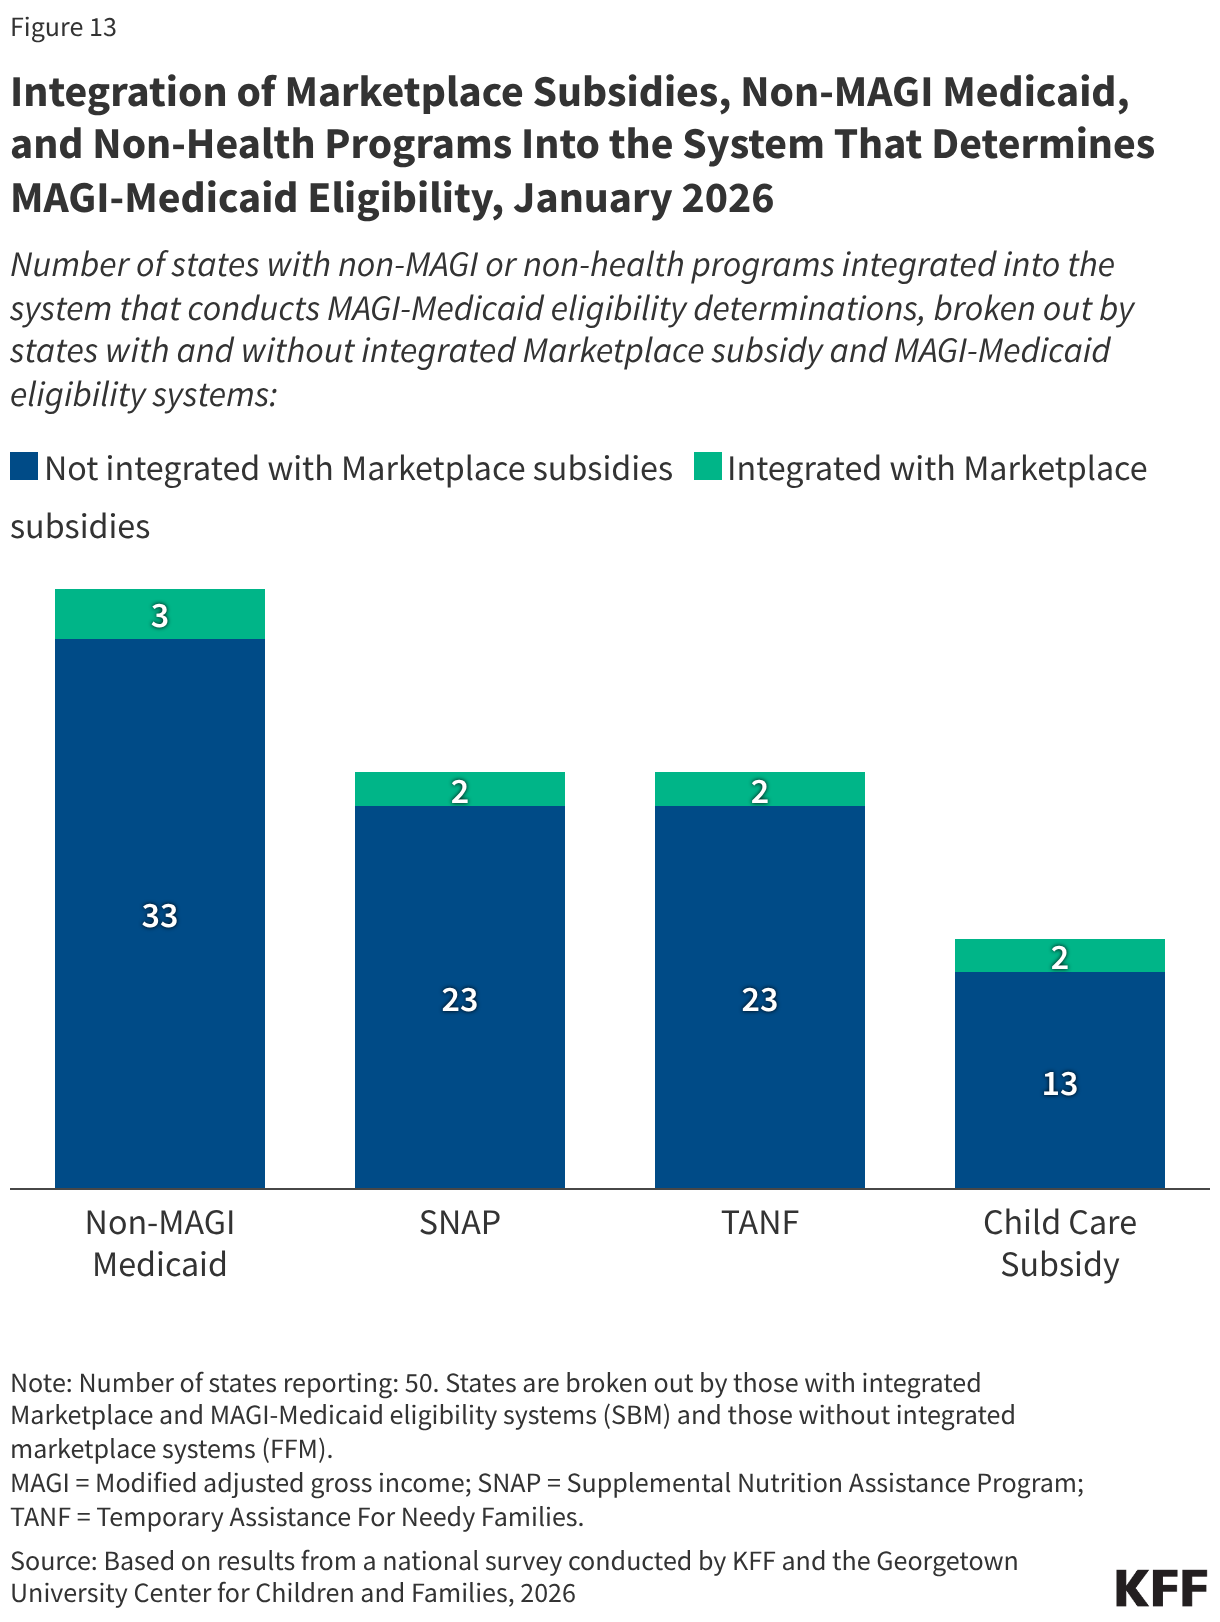
The 12 SBM states with an integrated Marketplace and MAGI-Medicaid eligibility system are much less likely to have integrated non-health programs into their eligibility systems. Only Kentucky and Rhode Island have integrated SNAP, TANF, and the child care subsidy into the Marketplace/Medicaid eligibility system (Figure 13). Both states, plus New York, also have integrated eligibility for non-MAGI Medicaid.
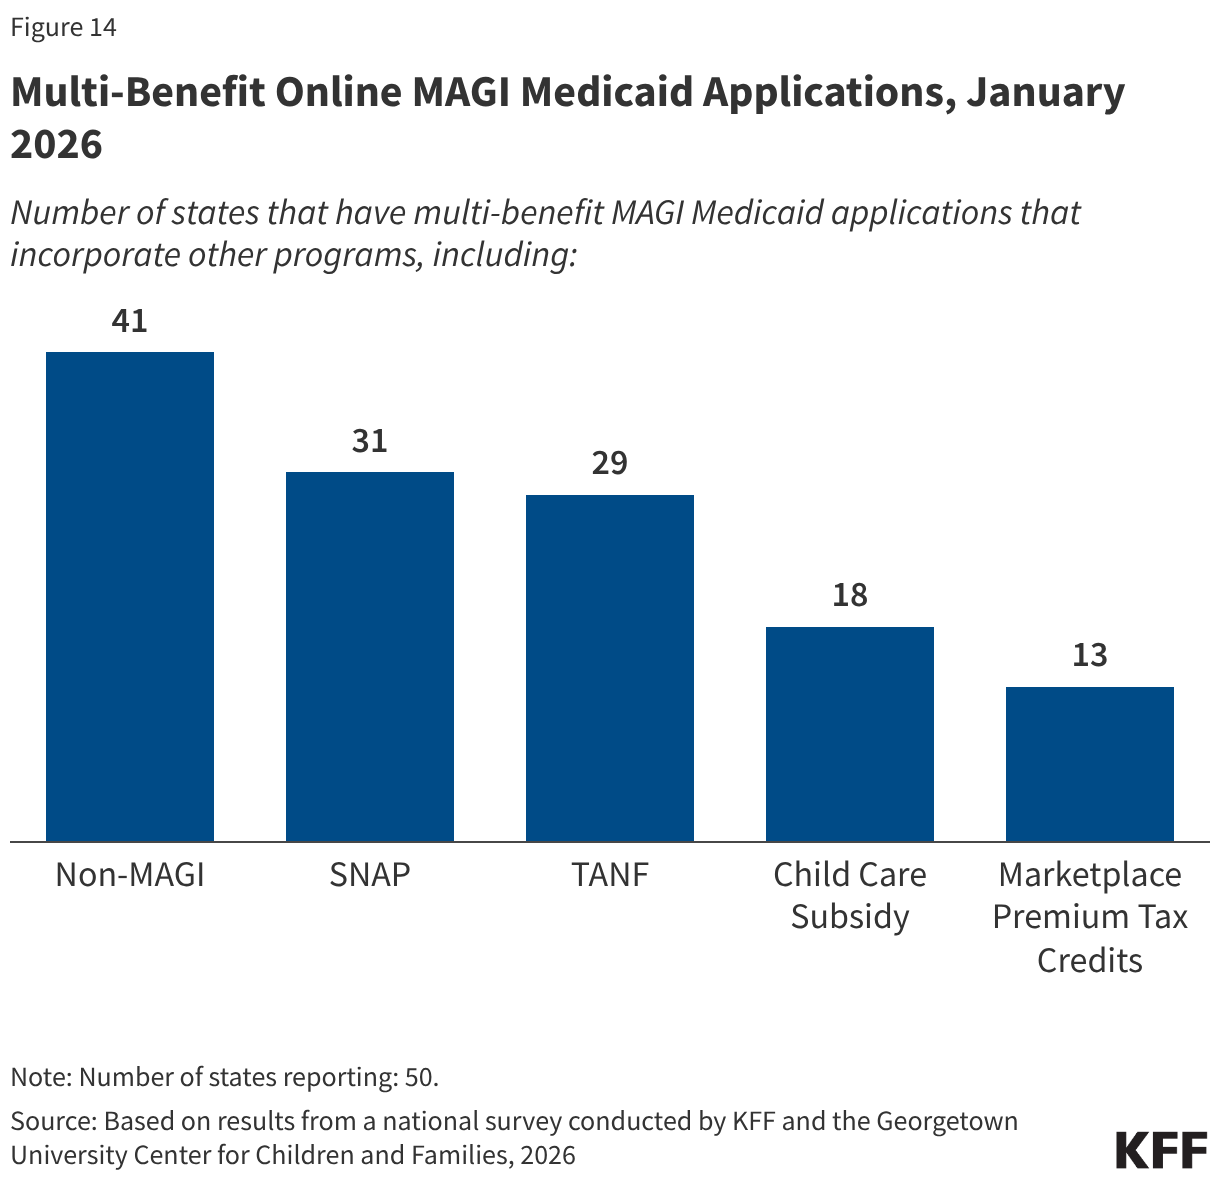
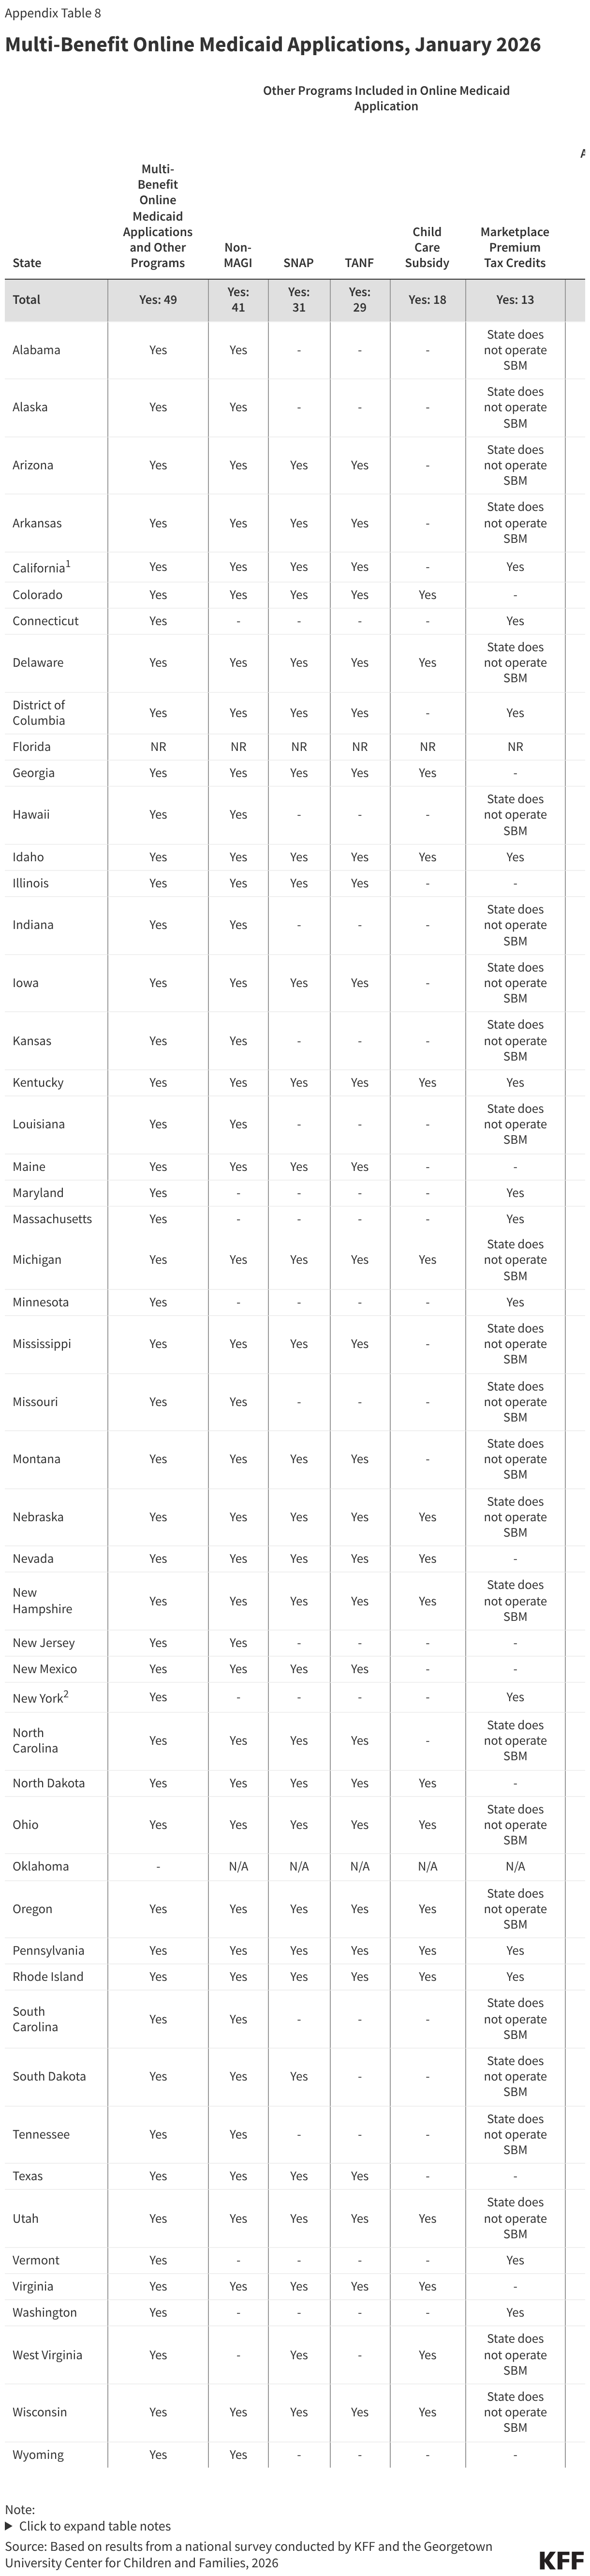
All states have an online MAGI Medicaid application, and nearly all states (49) allow individuals to apply for one or more other benefits, including SNAP or TANF, through the online application even if the state’s eligibility systems are not integrated with the other programs. Multi-benefit MAGI Medicaid applications include non-MAGI Medicaid in 41 states, SNAP in 31 states, TANF in 29 states, child care subsidy in 18 states, and premium tax credits in 13 SBM states (Figure 14). In states that do not have integrated eligibility systems, the data collected from the multi-benefit applications are transferred to the systems that process eligibility for those programs. With the more extensive use of smart phones and other mobile devices along with more limited access to computers among low-income populations, 36 states have designed their online applications to reformat for mobile devices.
Online Accounts and Mobile Apps
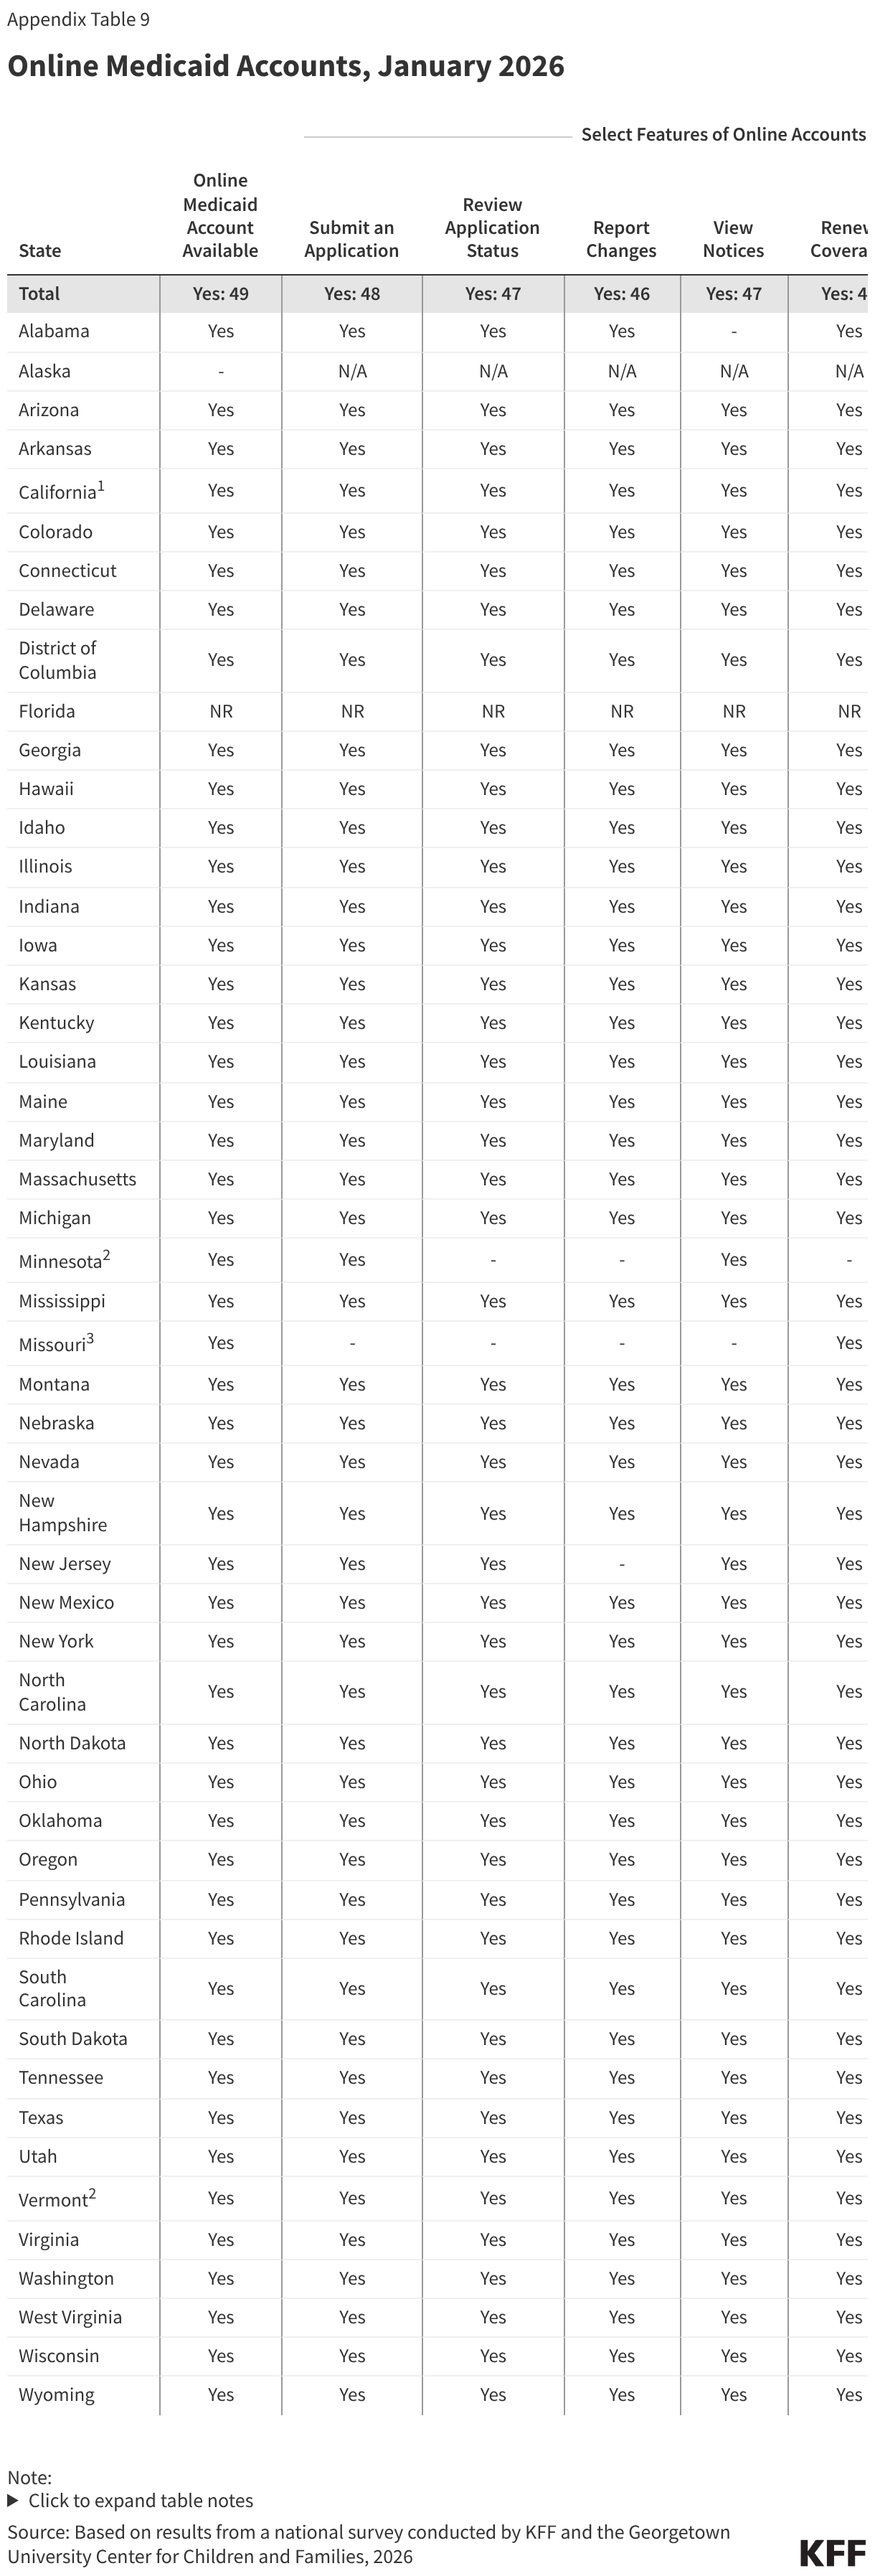
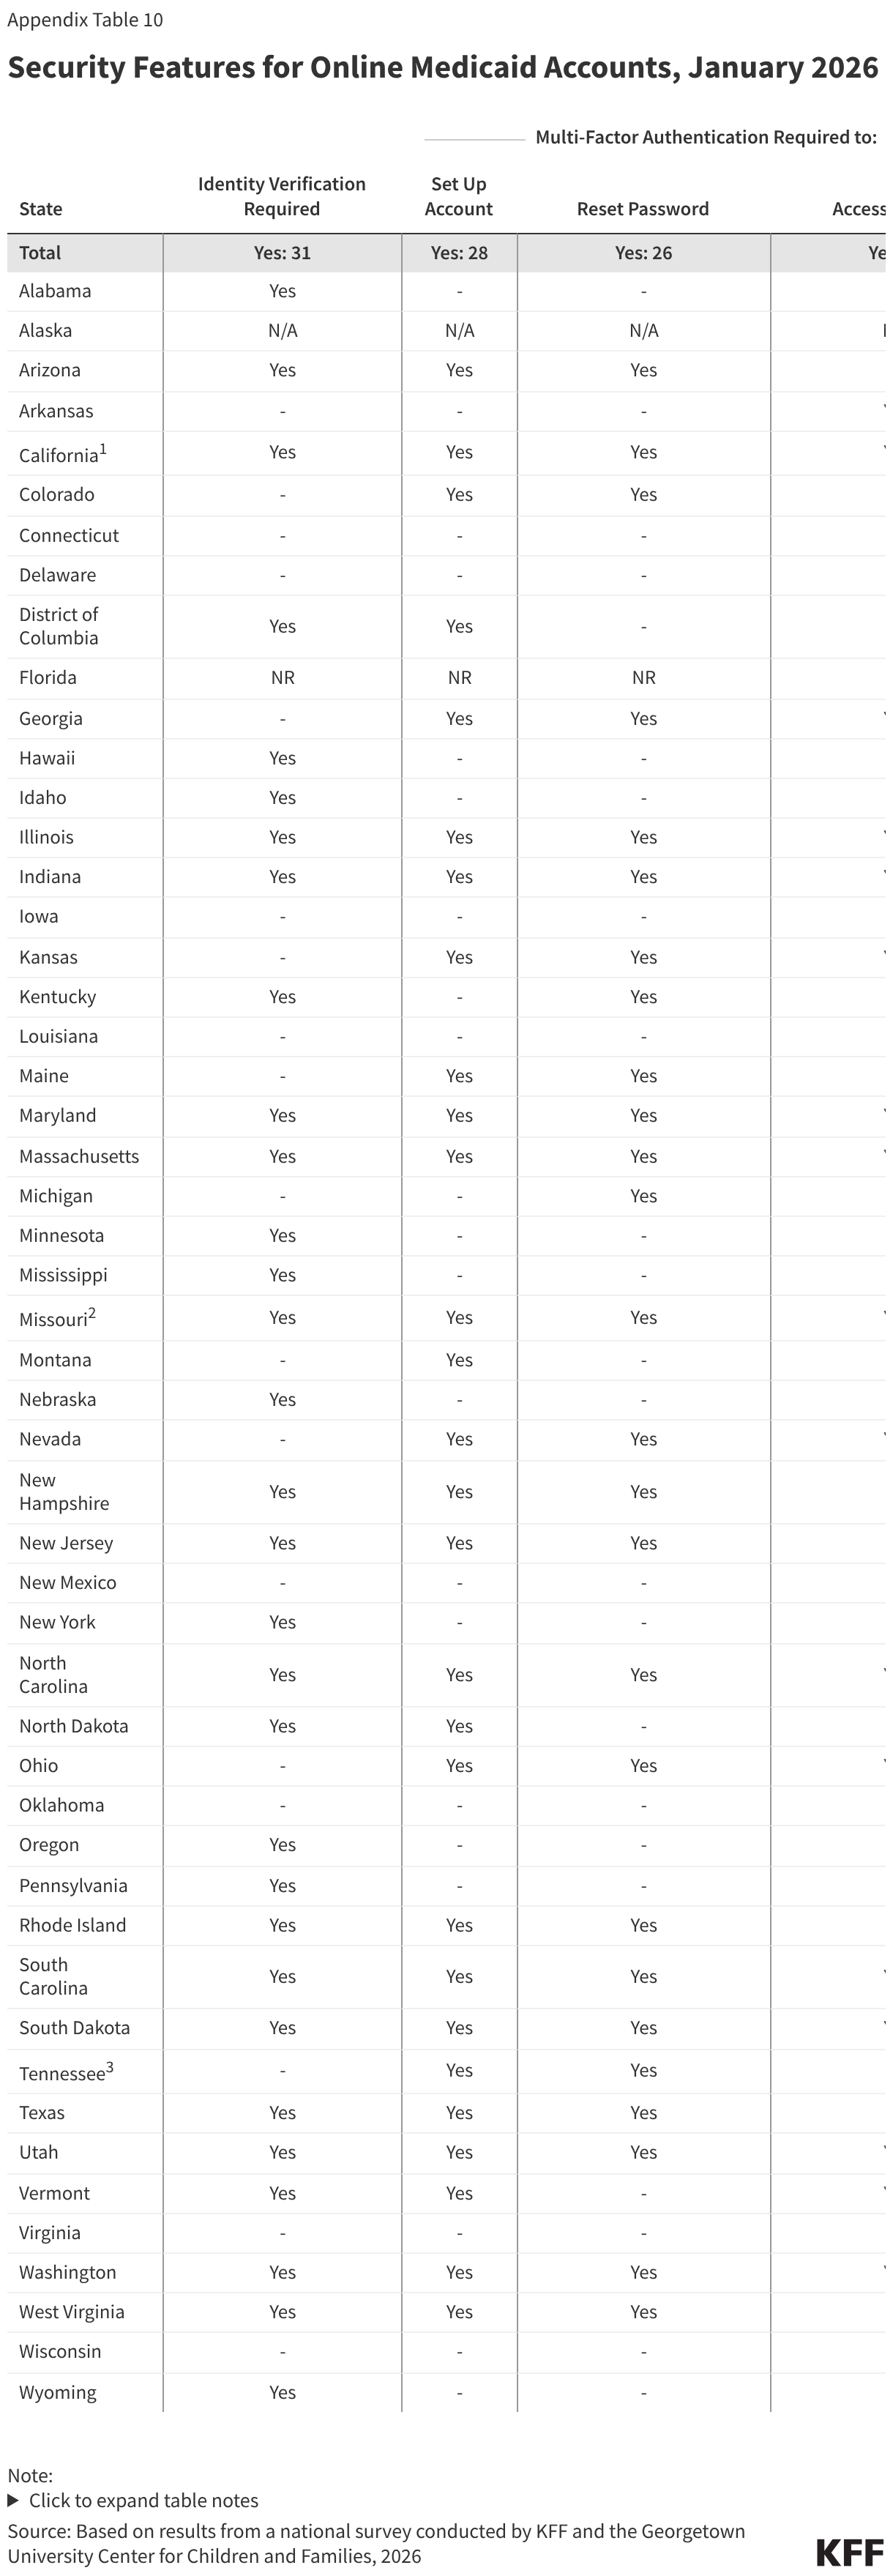
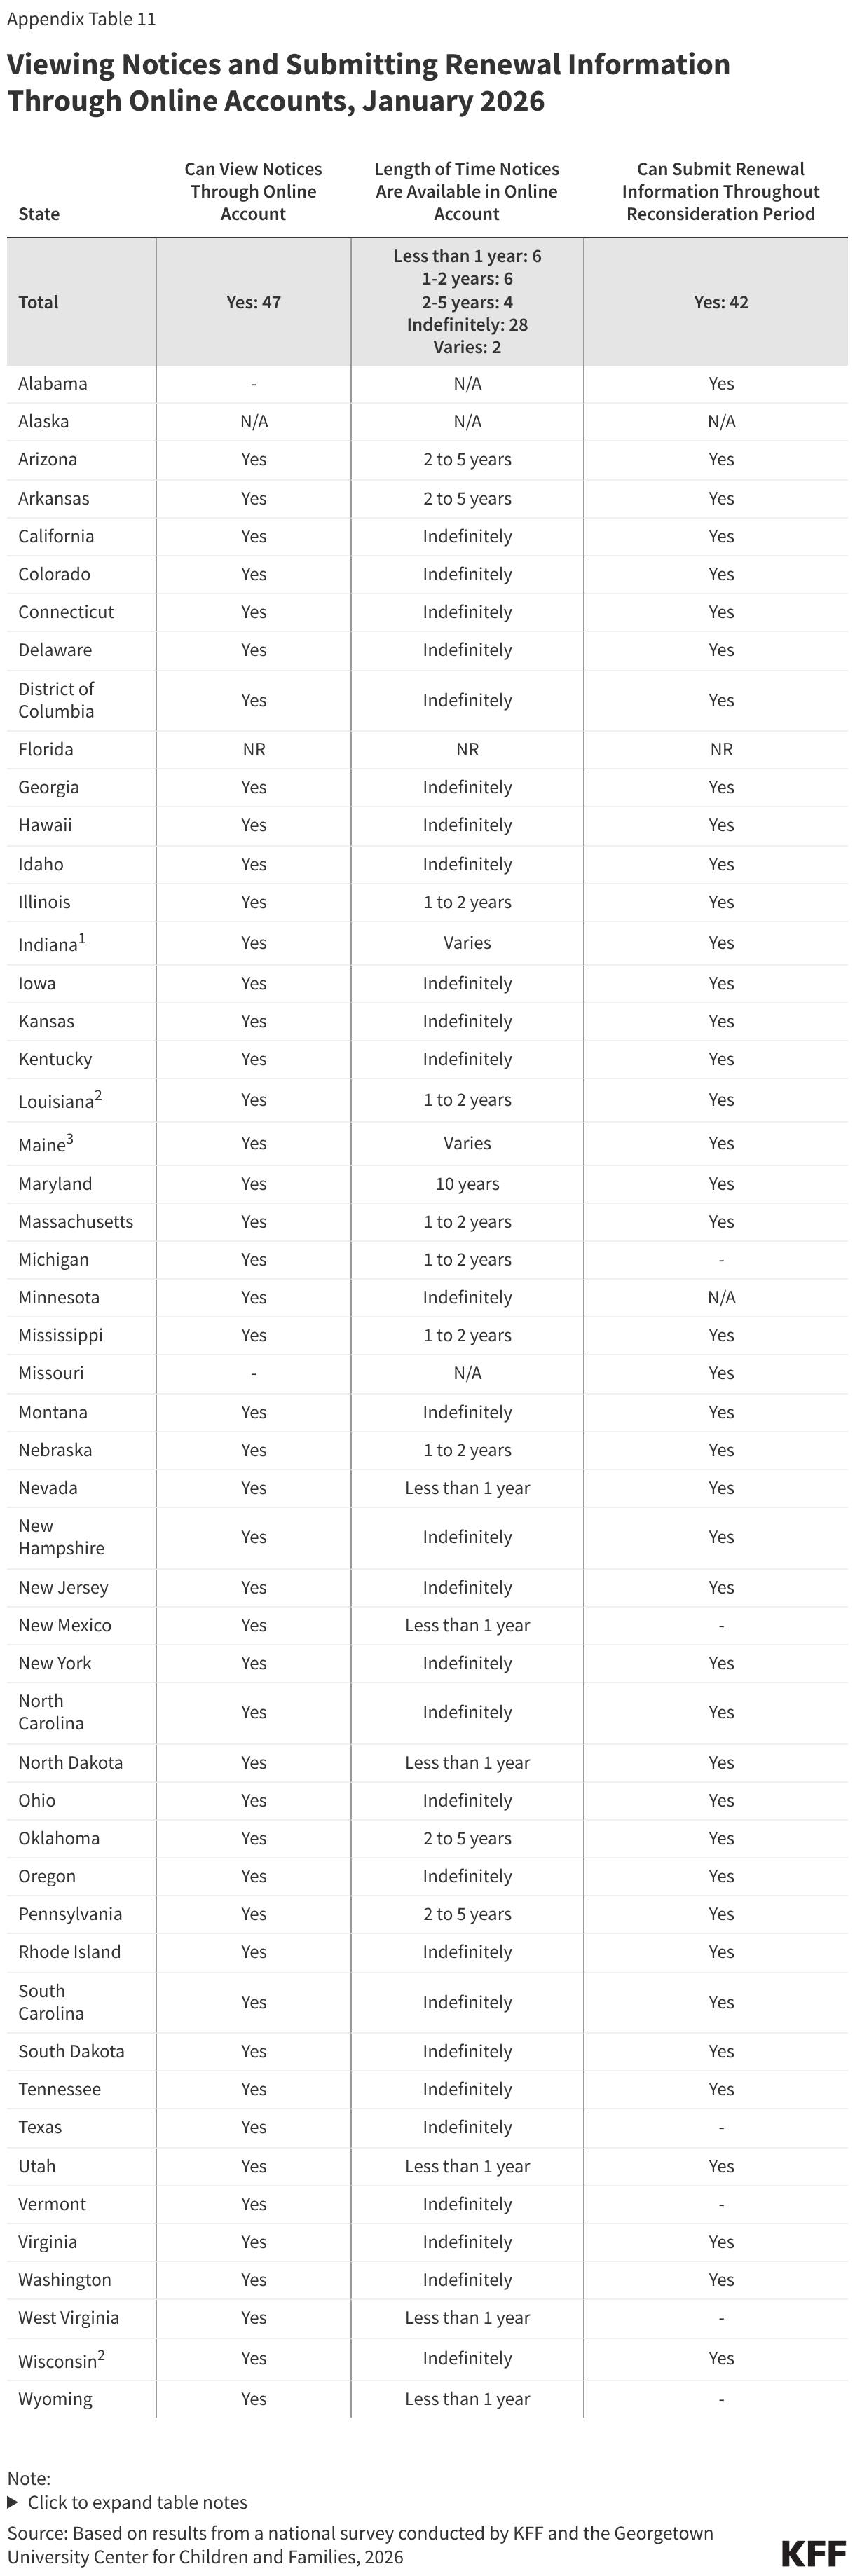
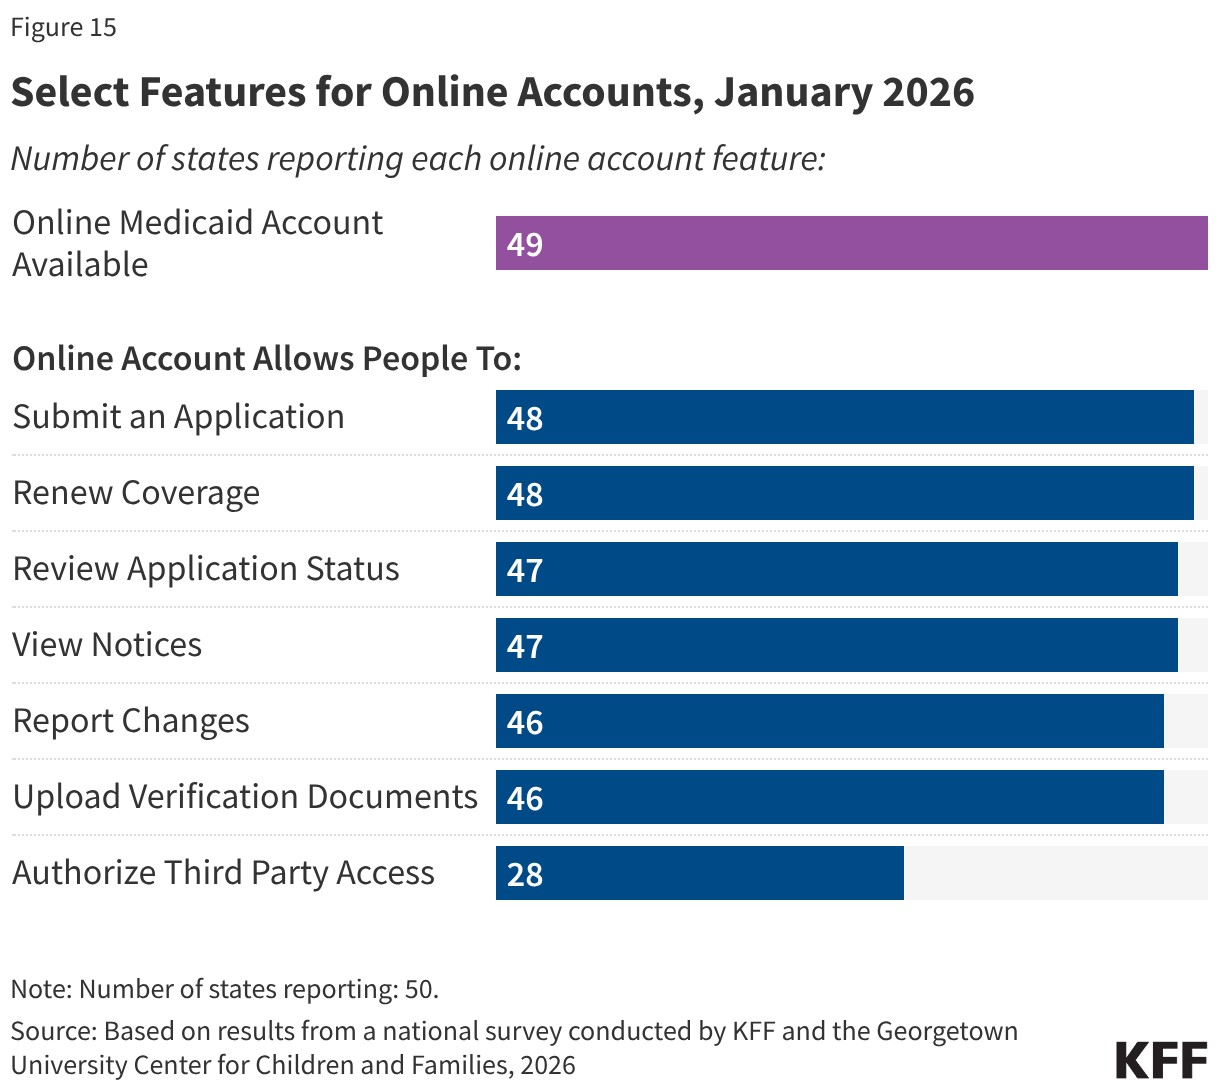
Almost all states now have comprehensive online accounts through which individuals apply for Medicaid and manage their personal and enrollment-related information (Figure 15). In the past ten years, the number of states with online accounts increased from 39 to 49. Initially online accounts included a limited number of features; today most states report having a variety of features, including the ability to submit an application or renewal, view notices, report changes, and upload documents. Online accounts provide applicants and enrollees with a centralized location for most of their Medicaid enrollment information, and states can more quickly and cost-effectively connect with individuals if action is needed to enroll or maintain coverage.
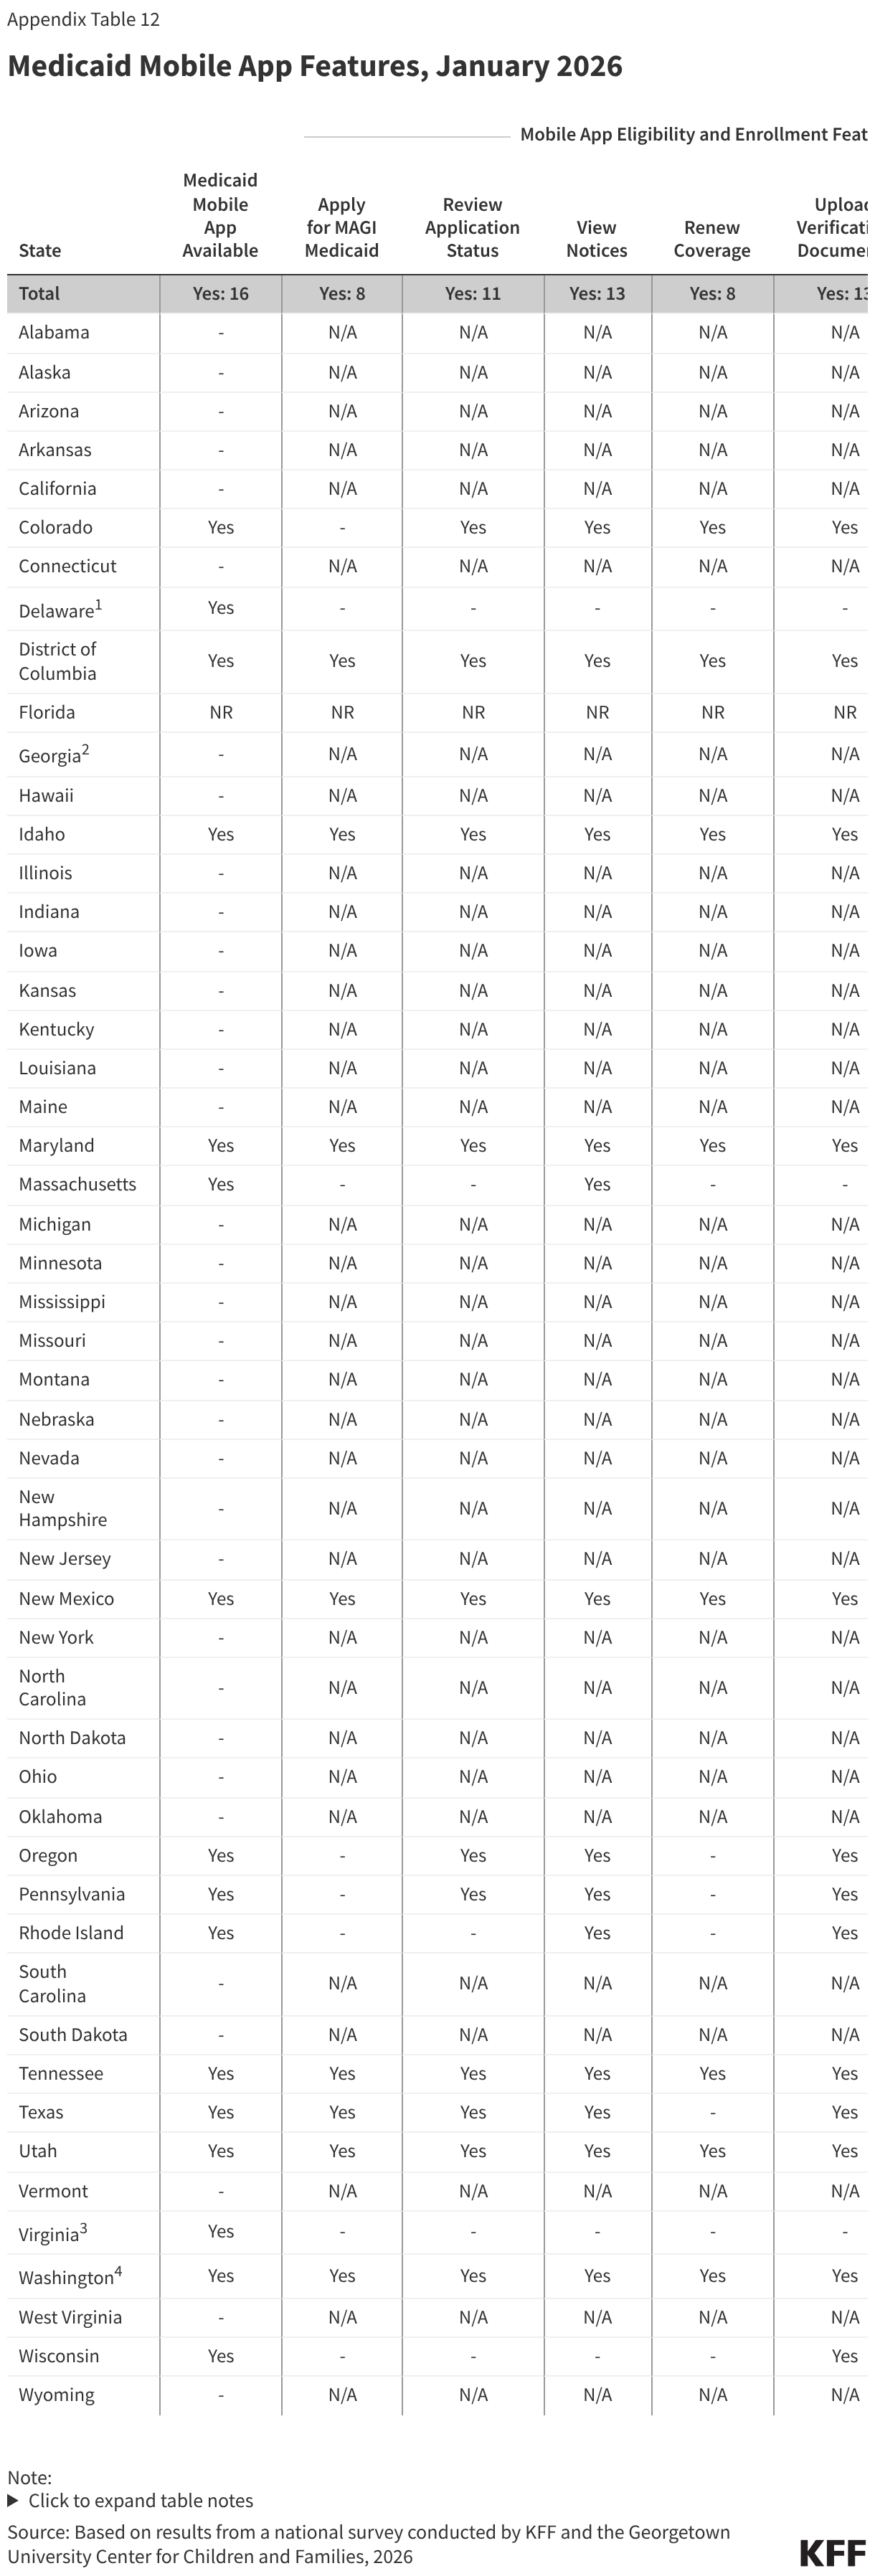
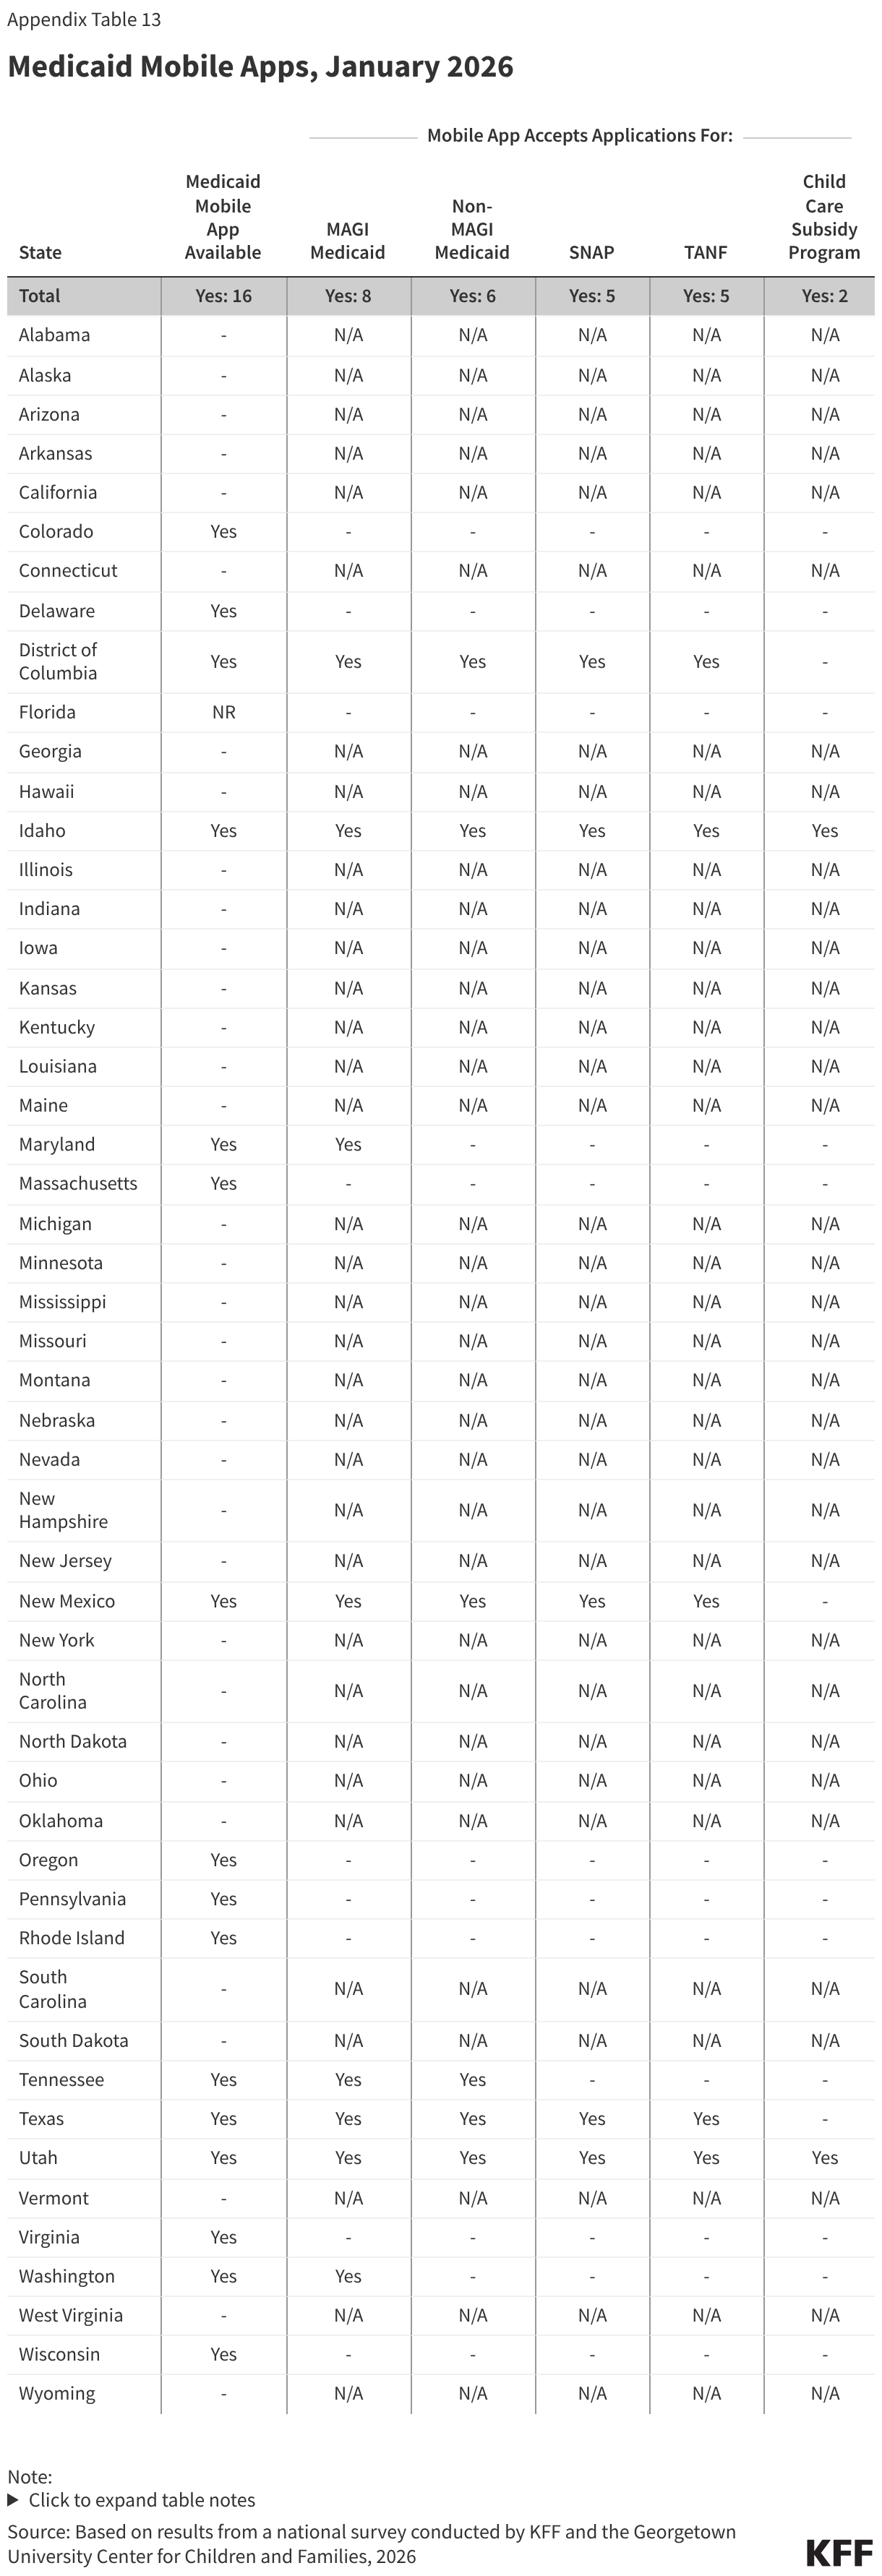
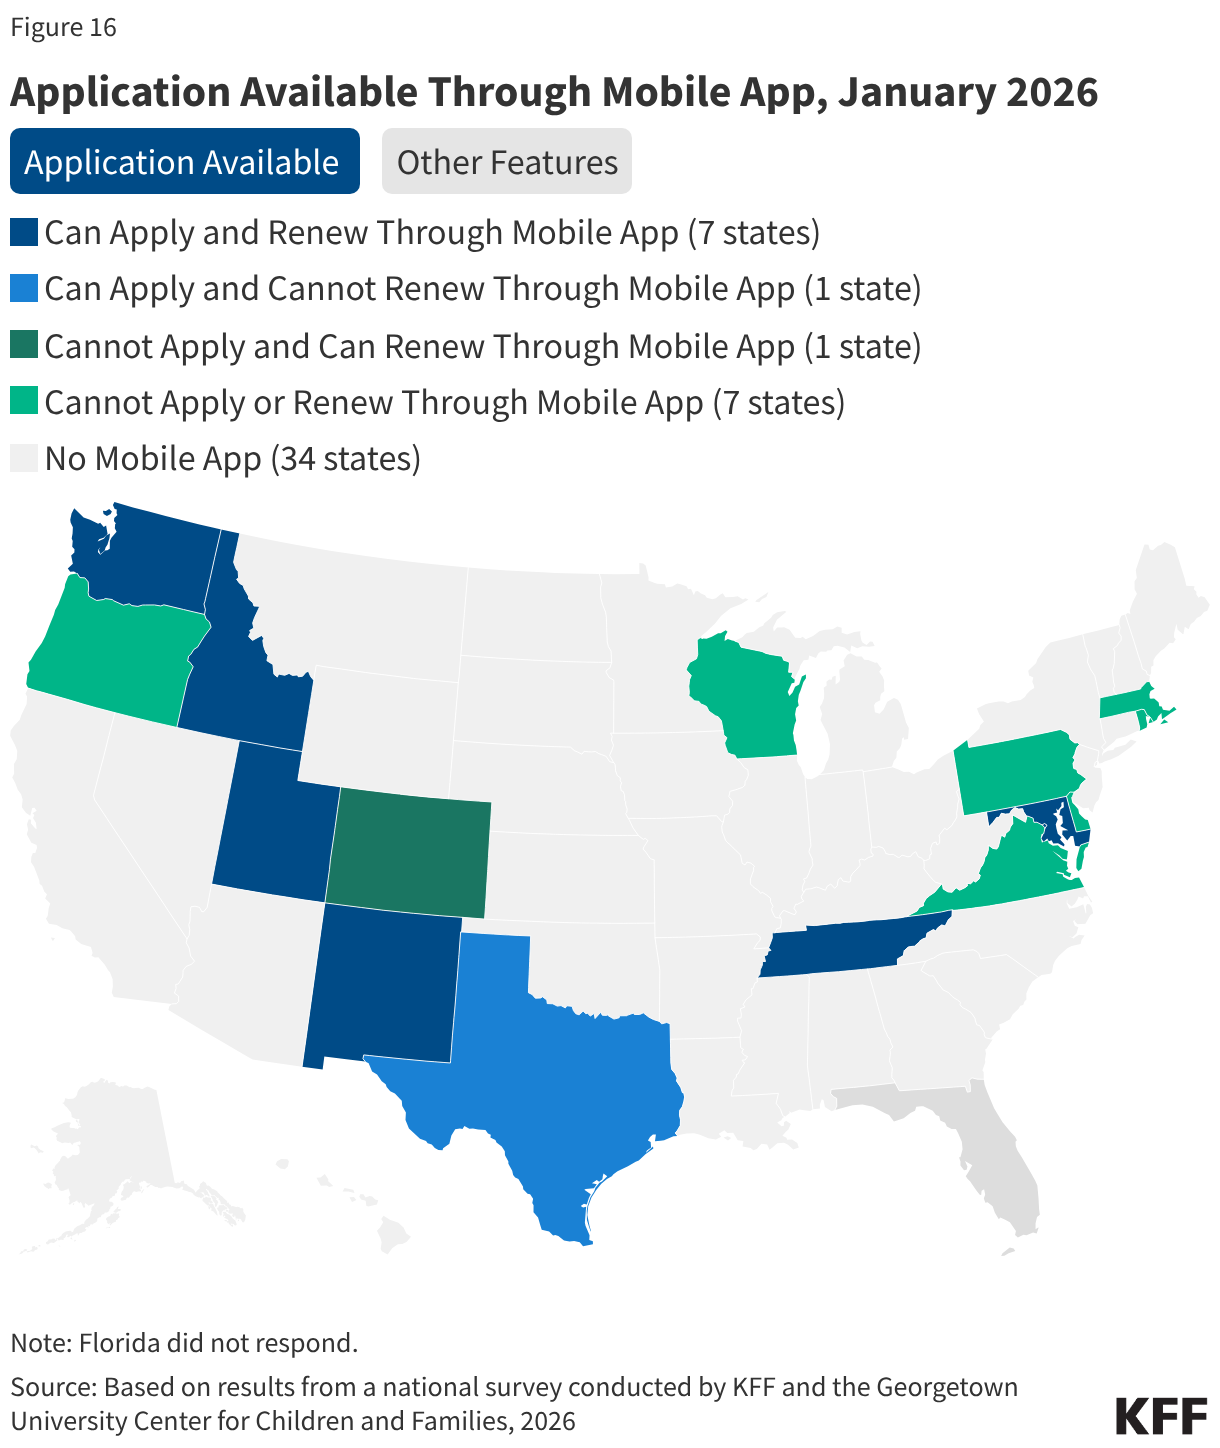
Sixteen states have a Medicaid mobile ‘app,’ but features in the apps are generally more limited than in online accounts. Mobile ‘apps’ are specifically designed to work well on smartphones and tablets but offer fewer features. In 13 states, the mobile ‘app’ allows enrollees to view notices and upload documents while the ability to view application status is a feature in 11 states (Figure 16). However, only half of states (8) with mobile ‘apps’ accept applications and half (8) accept renewals for Medicaid. In 2 states (Delaware and Virginia), the mobile ‘app’ helps Medicaid enrollees with non-eligibility and enrollment actions like finding providers or selecting a managed care plan.
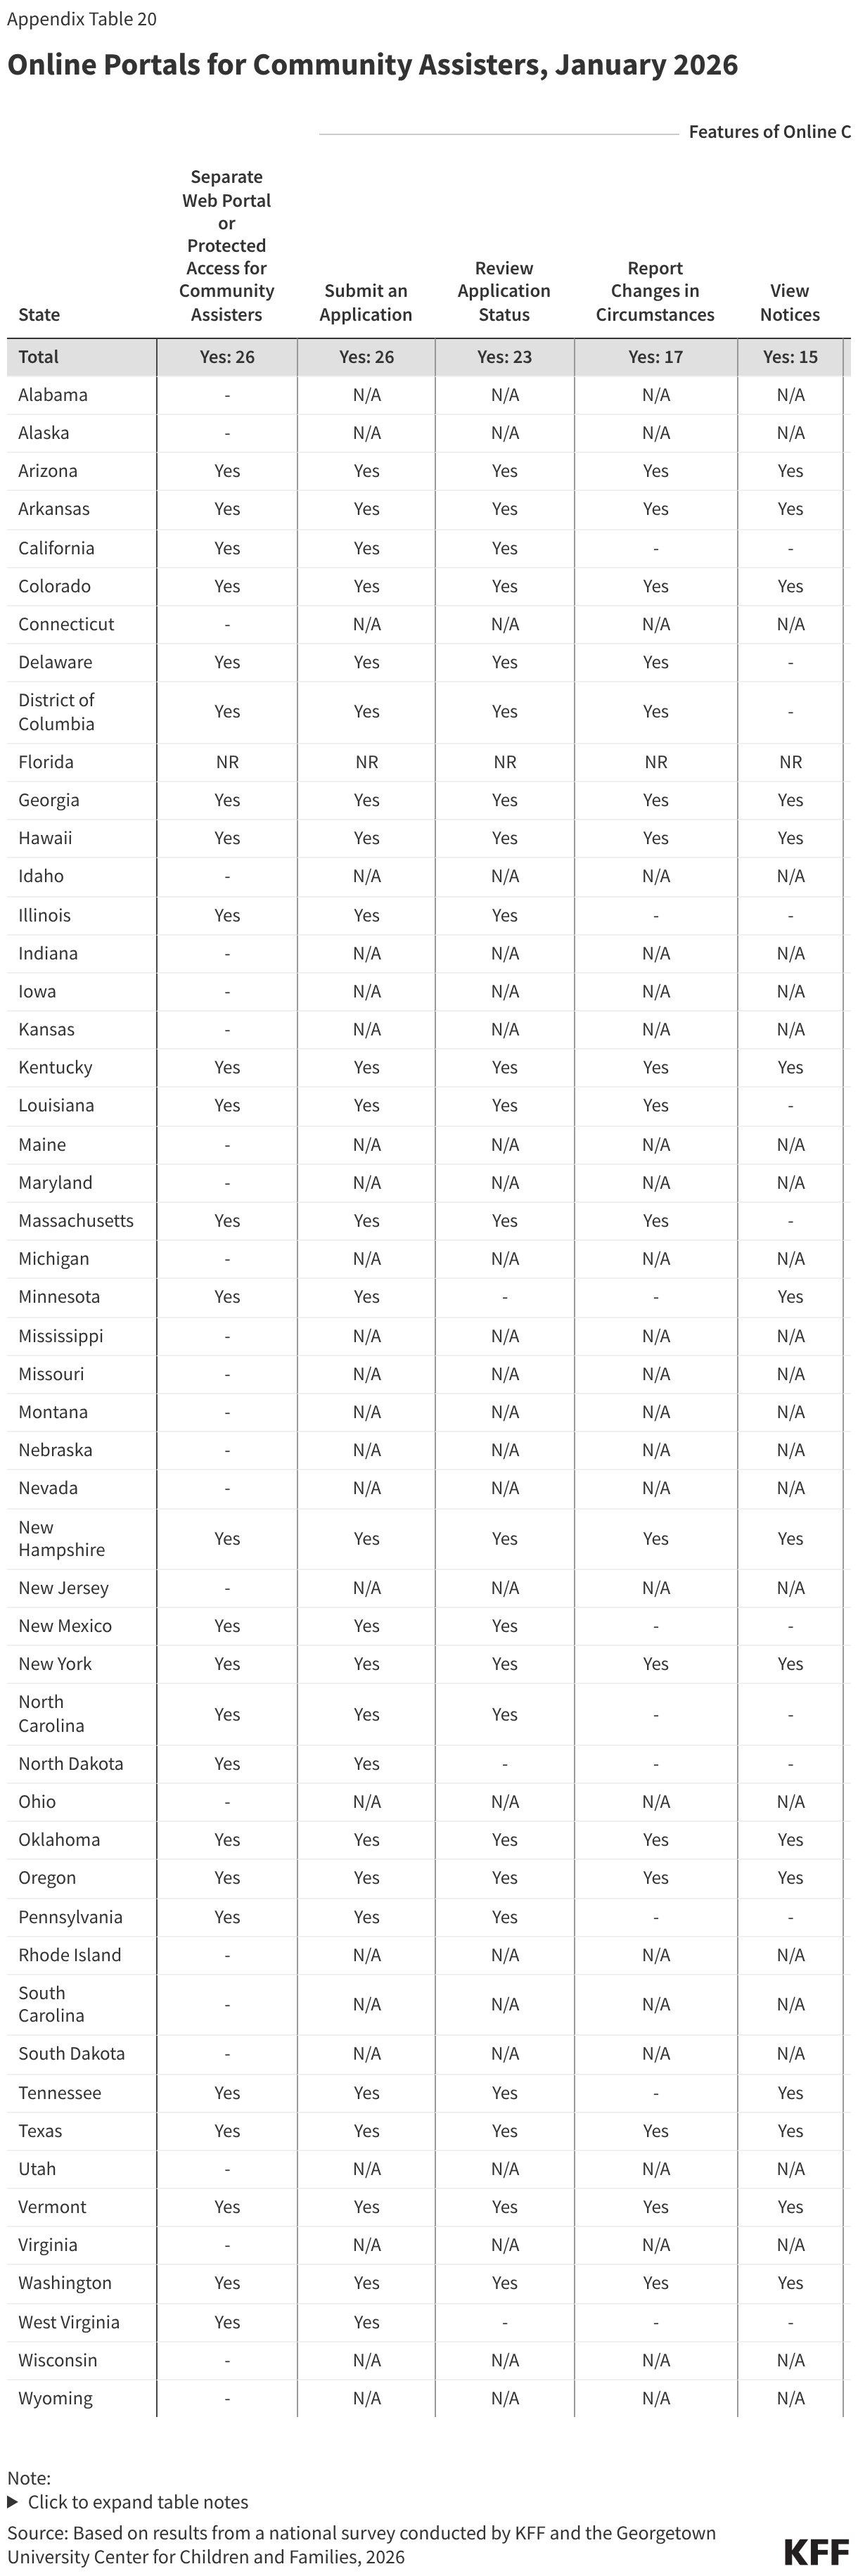
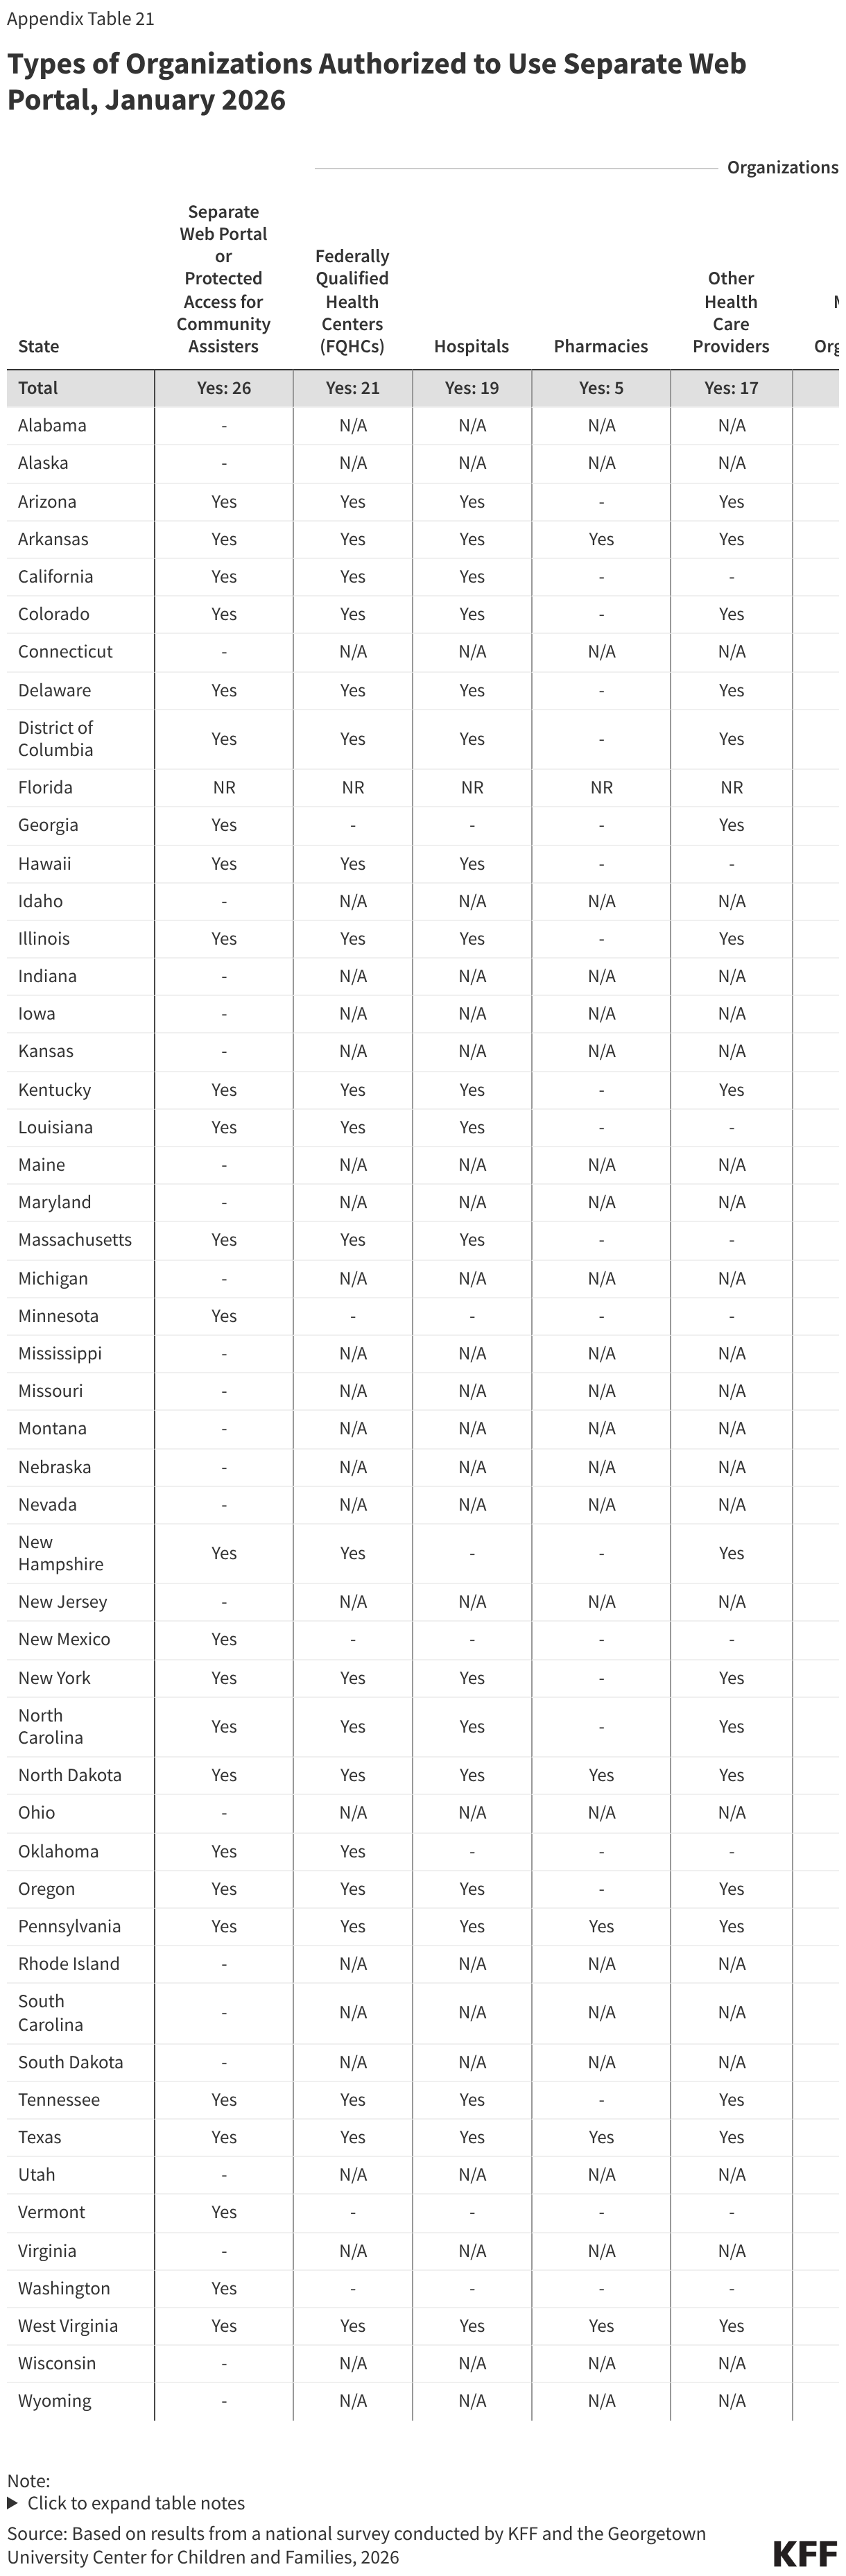
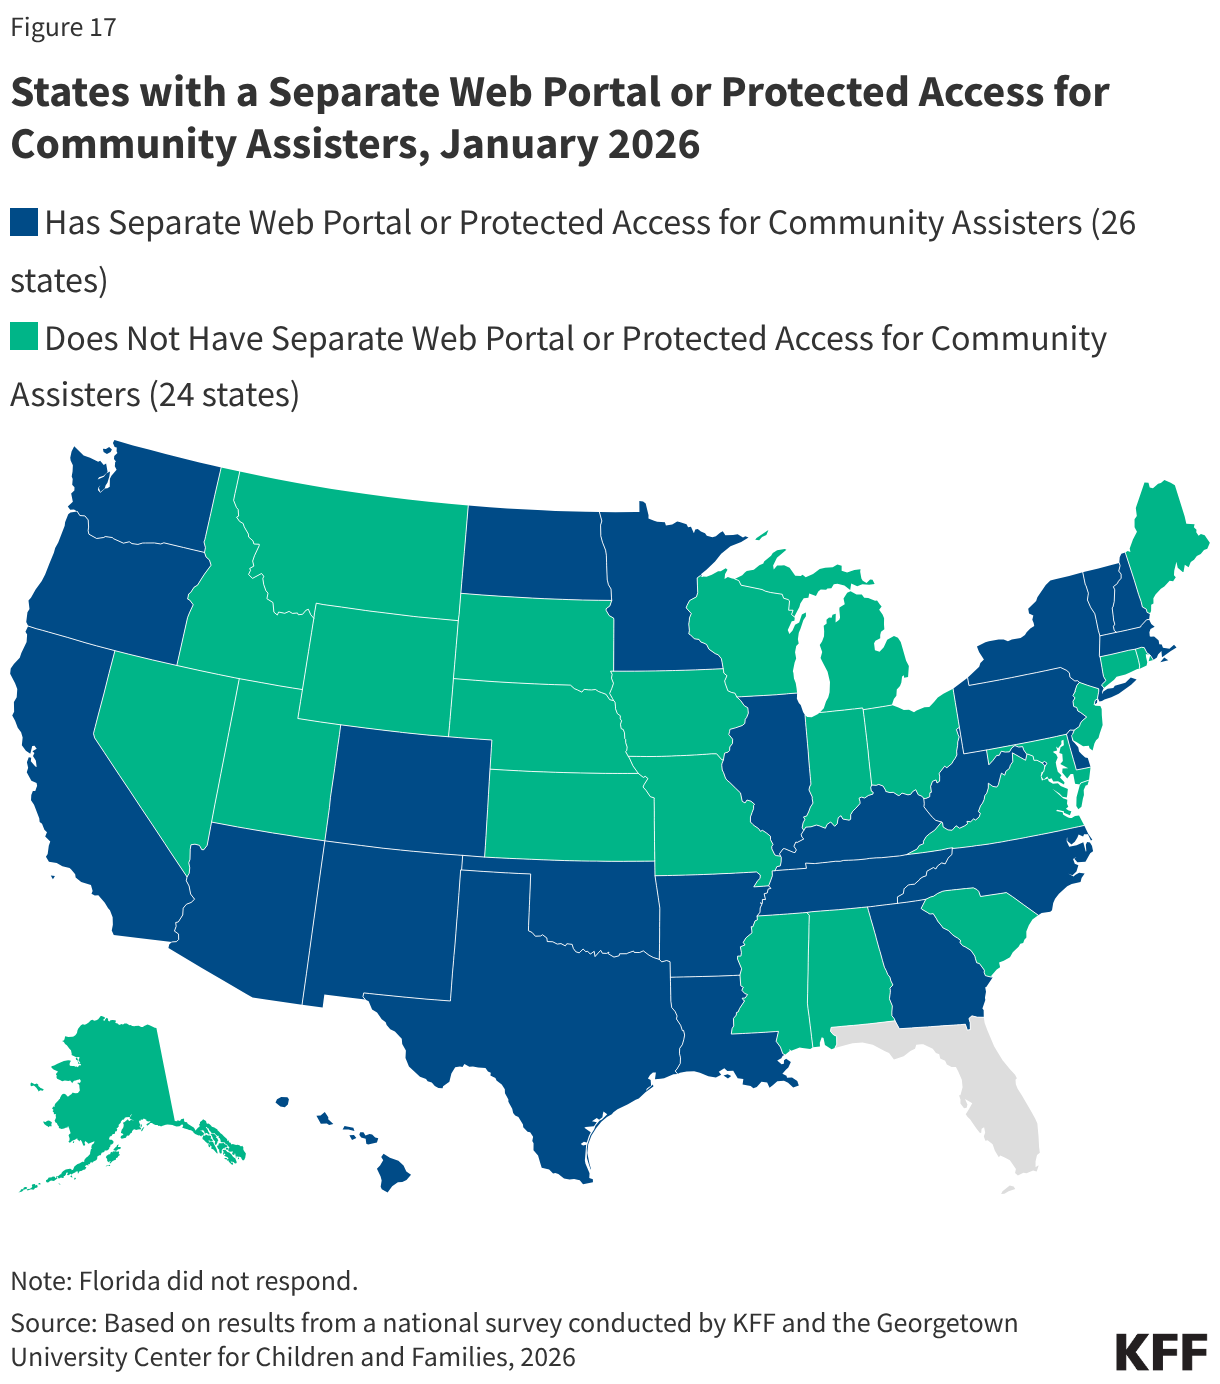
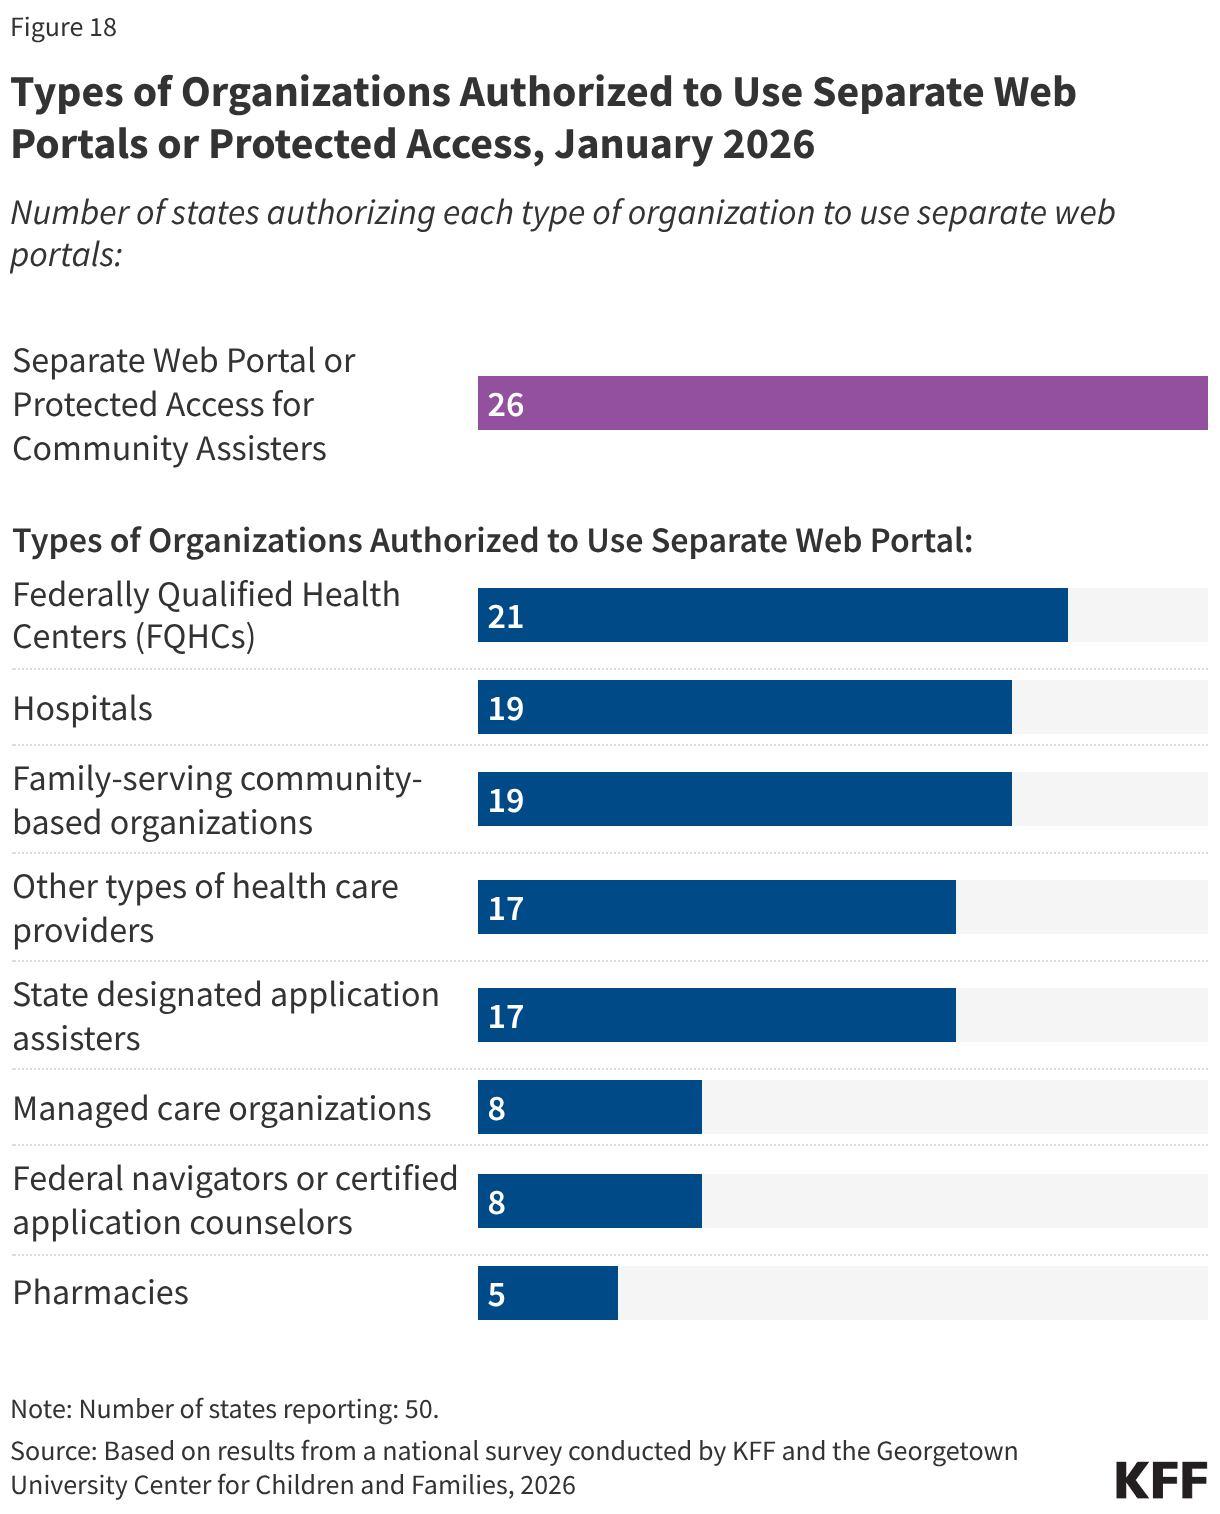
Half of states (26) provide a separate web portal or protected access to the online account for entities that provide application assistance to help individuals apply for coverage (Figure 17). All states with online portals for assisters allow for the submission of the application and most (23 states) allow assisters to review the application status. In 21 states, including 19 that will be implementing work requirements, community assisters can submit renewal information and/or upload scanned or electronic documents through the portals, increasing their ability to assist consumers with providing documentation of compliance with work requirements or exemption status. About a third of states allow assisters to do other tasks such as reporting changes, viewing notices, and accessing renewal dates. States may designate the types of entities allowed to use the portal, which generally include federally qualified health centers and other health care providers, family-serving community-based organizations, MCOs, and federal or state navigators and assisters (Figure 18). Access to community assisters can extend the state’s capacity to help individuals comply with work requirements or seek an exemption.
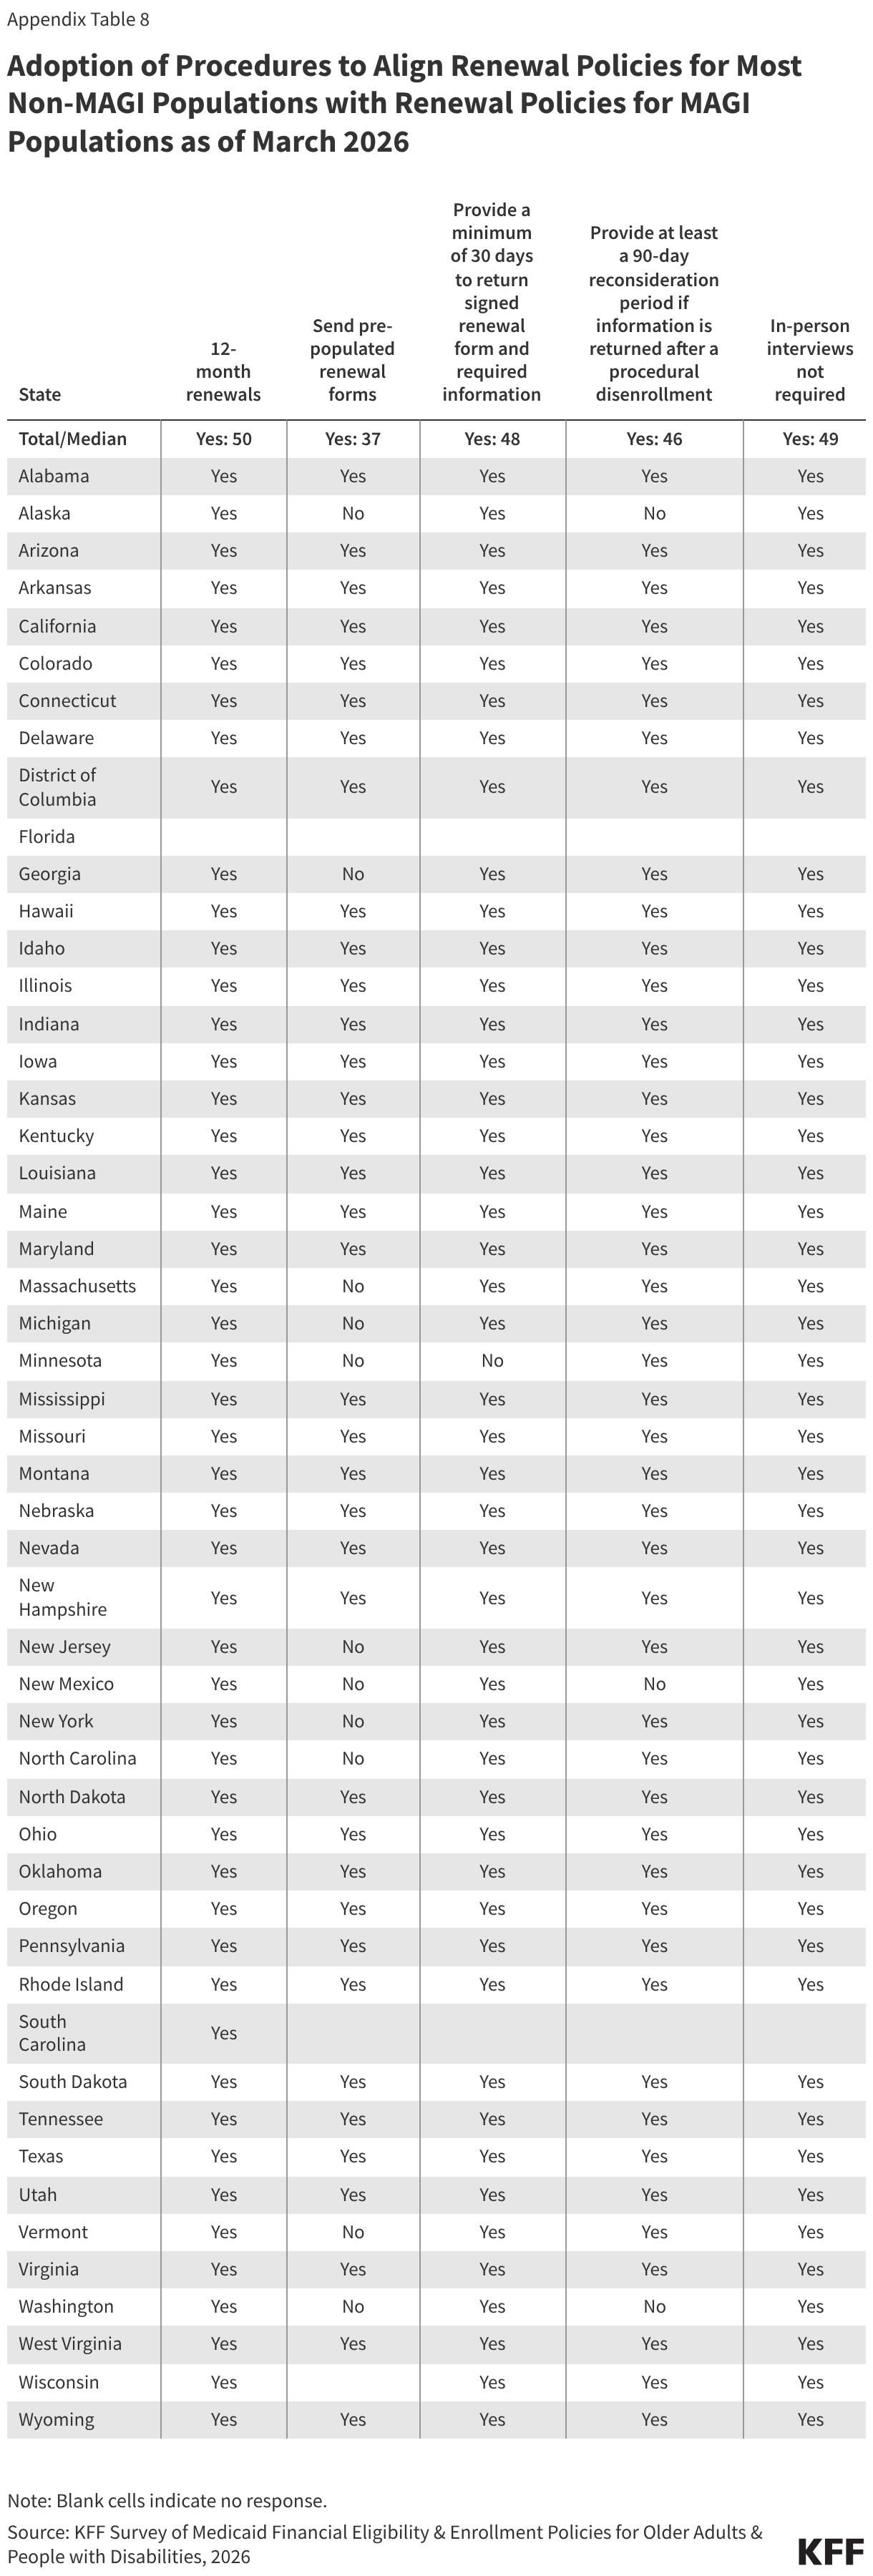
Renewals and Changes in Circumstances
Renewal Policies
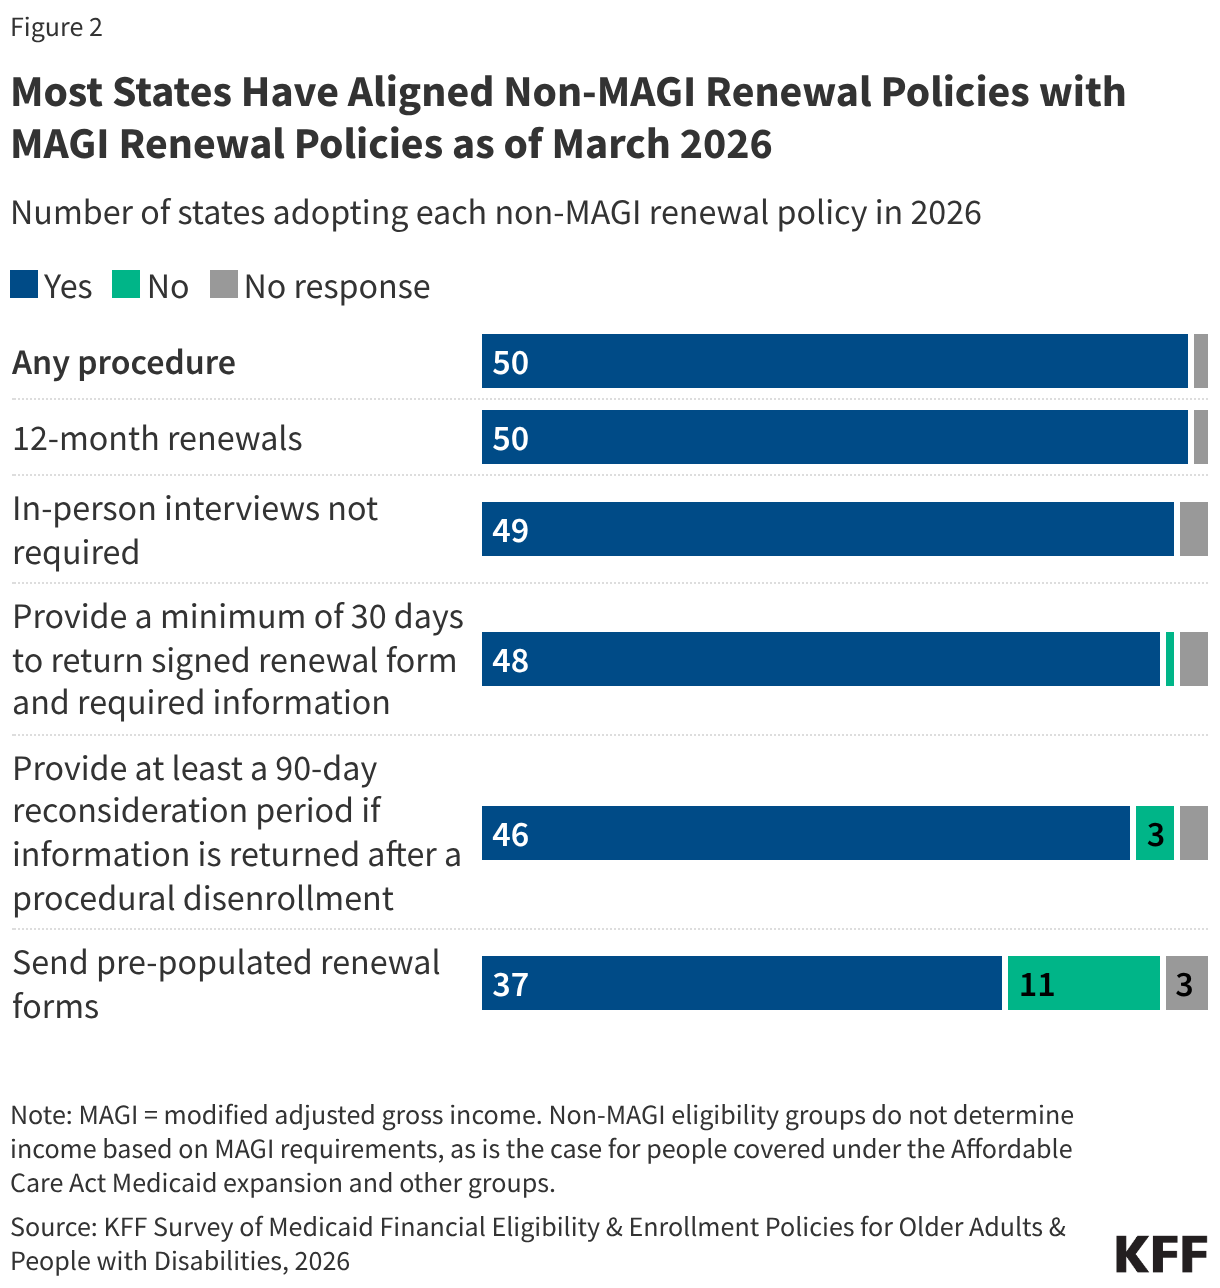
During the unwinding significant effort was dedicated by states and CMS to increase the rate of ex parte (automated) renewals and boost communication with enrollees through multiple modes to avoid procedural disenrollments of eligible individuals. States are maintaining most of the strategies put in place during unwinding to increase retention of eligible individuals.
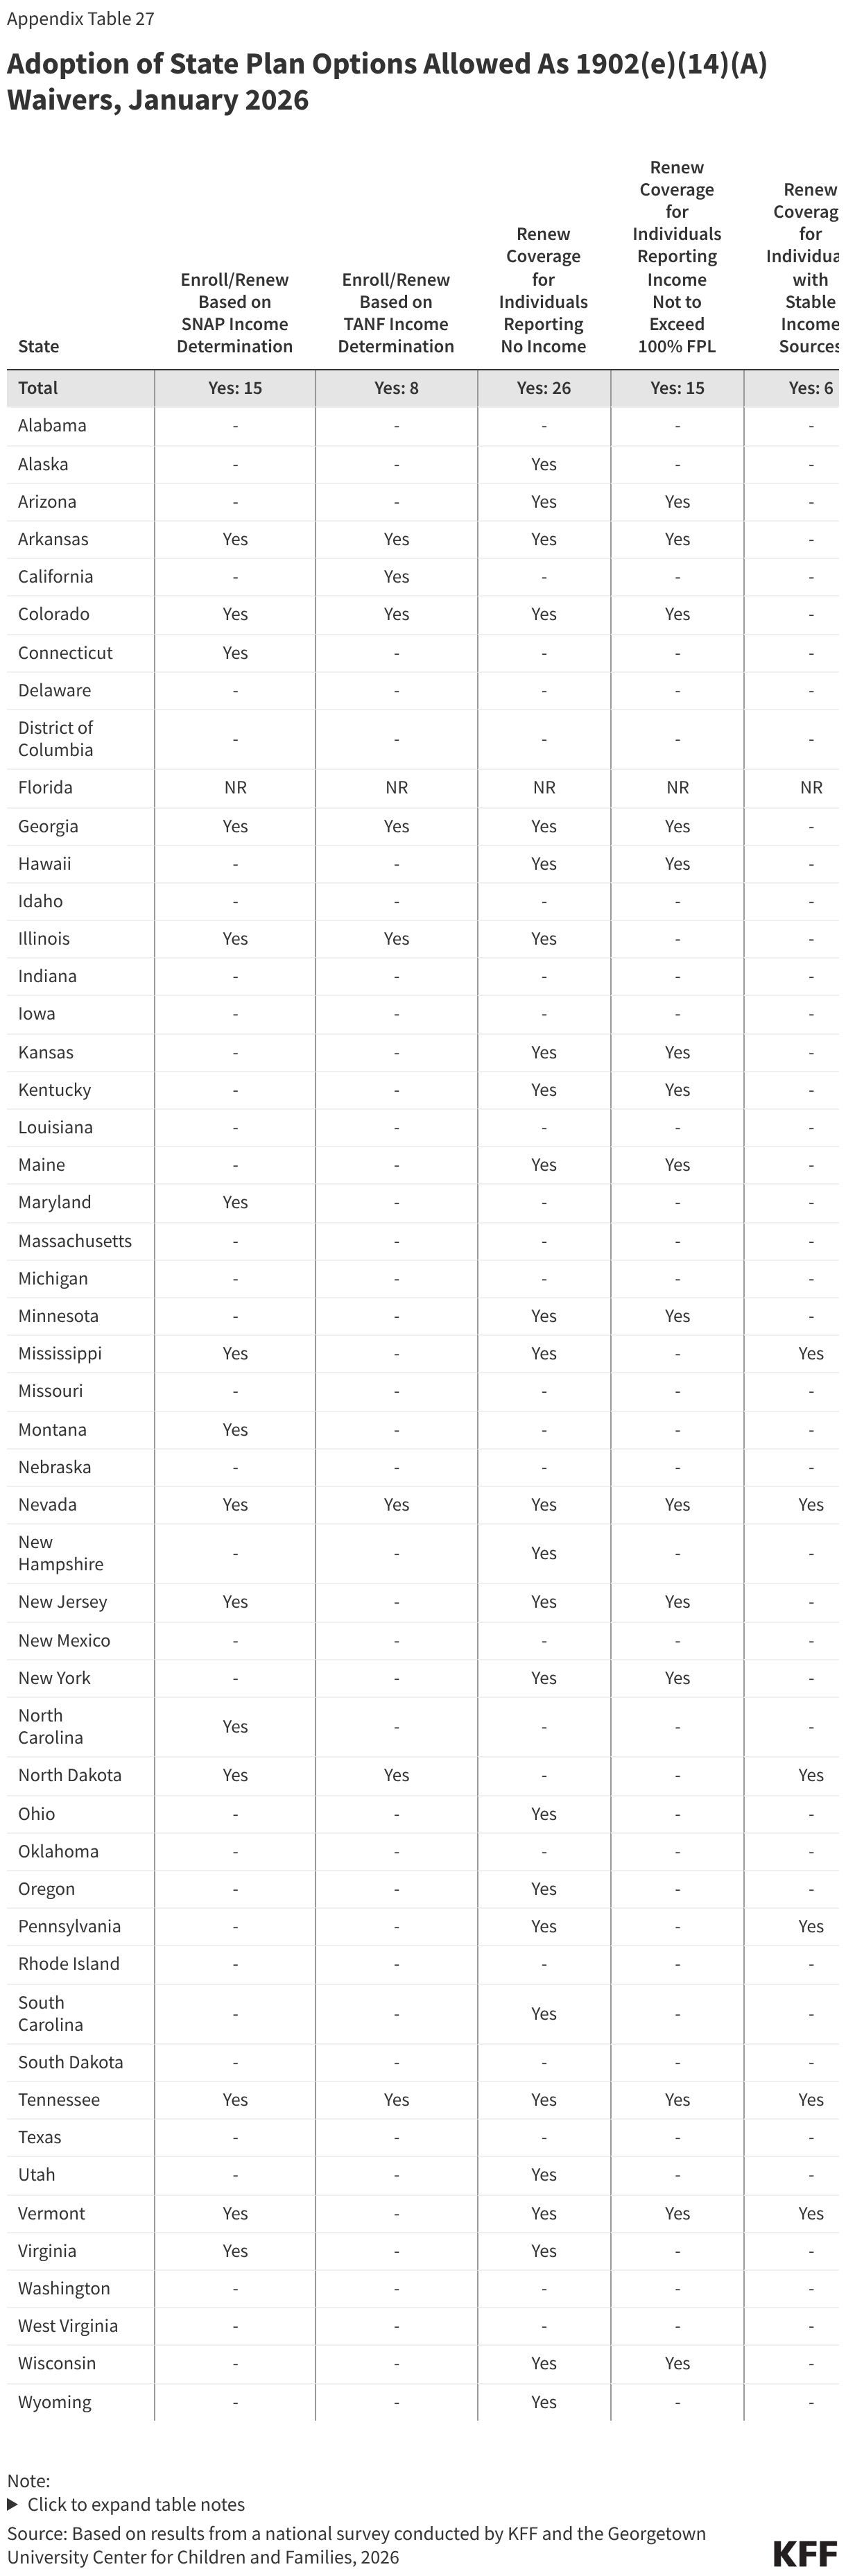
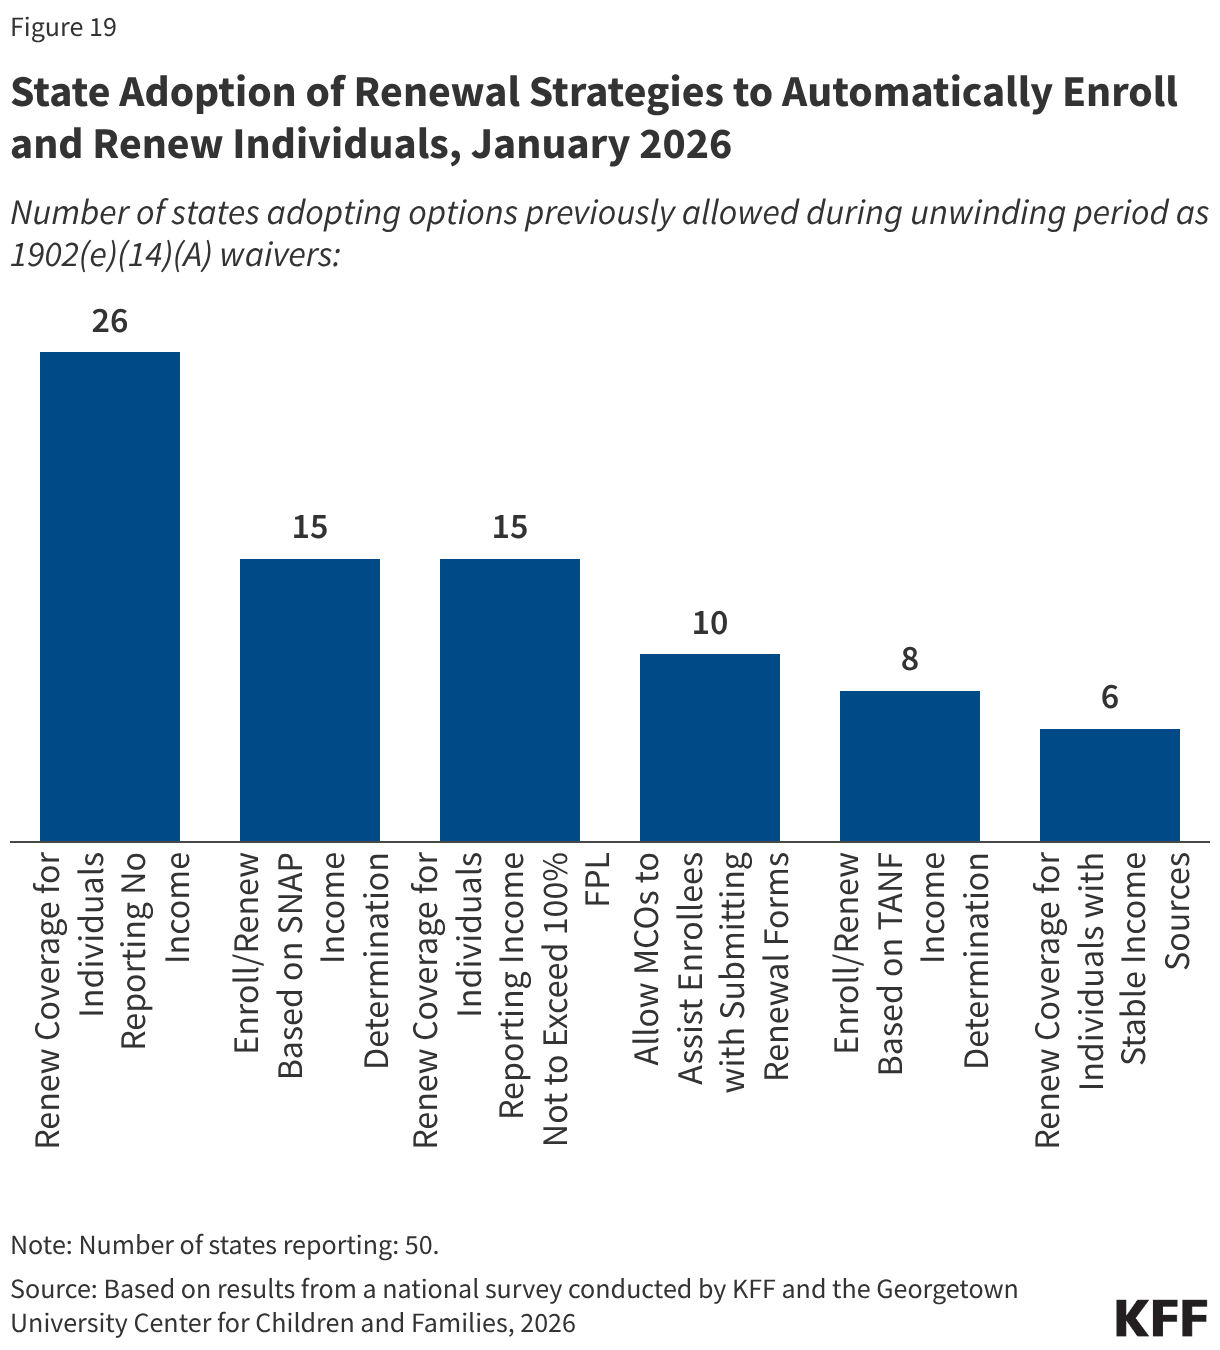
State adoption of certain renewal strategies allowed during the unwinding could reduce the administrative burden on expansion states as they operationalize work requirements. During the unwinding, all states took advantage of flexible 1902(e)(14)(A) waiver authority to use alternative data and methods to verify income eligibility. Several of these strategies are available to states as state plan options with two-thirds of states (33) adopting one or more of the options. Fifteen (15) states, including 13 states that will need to implement work requirements, enroll and renew individuals based on a SNAP income determination and 8 states use a TANF income determination. The sharing of SNAP program data, in particular, will facilitate implementation of work requirements. Also helpful is the option for MCOs to assist members with renewals, which 10 states have adopted (Figure 19). Although MCO’s cannot determine if an individual meets the work requirements or qualifies for a medically-related exemption, they can assist members in understanding the new requirements and provide information to states that can be used to verify the exemption status of the enrollee. Half of states adopted the option to renew individuals reporting no income if data sources show no income, and 15 states renew individuals reporting income under 100% FPL when there is no conflicting data. However, these strategies are less useful when it comes to verifying compliance with work requirements.
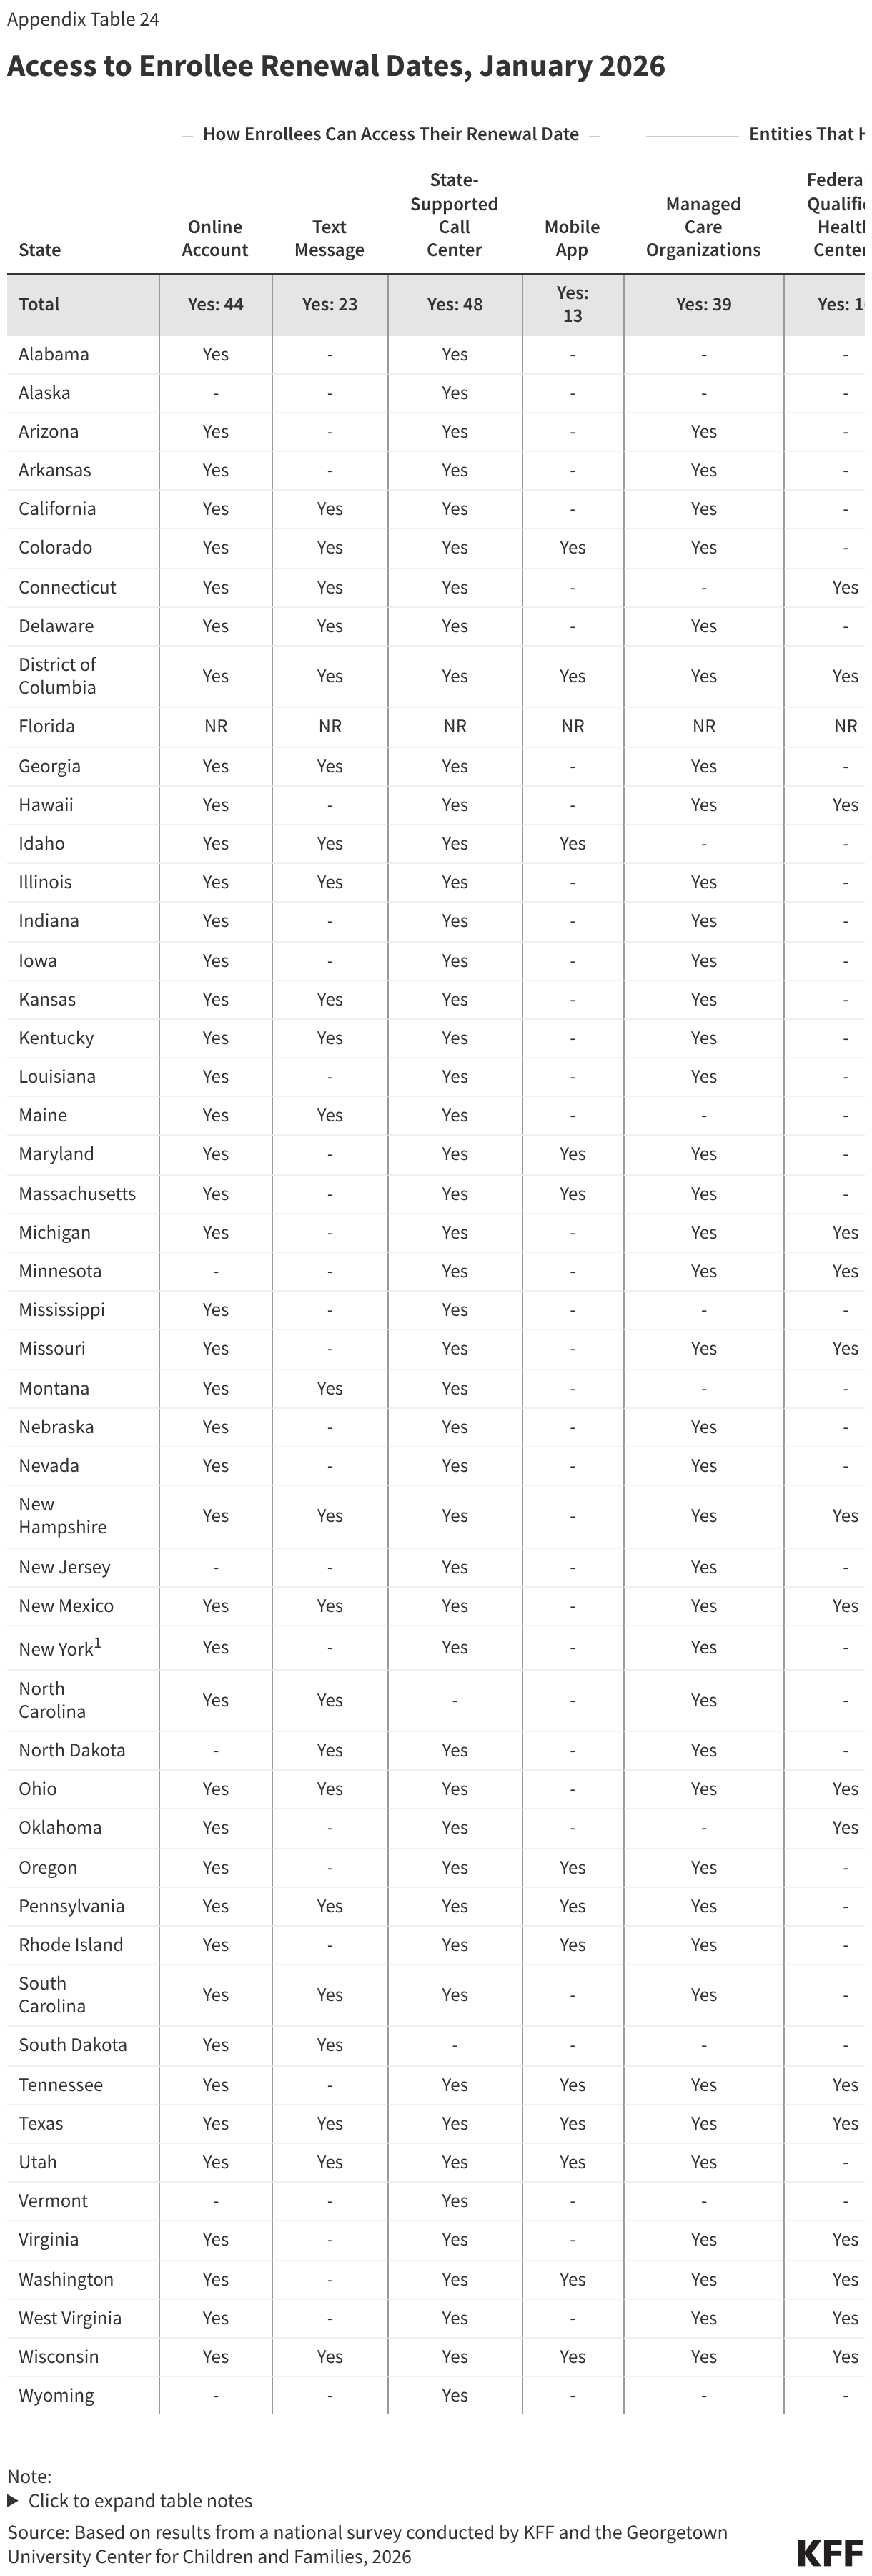
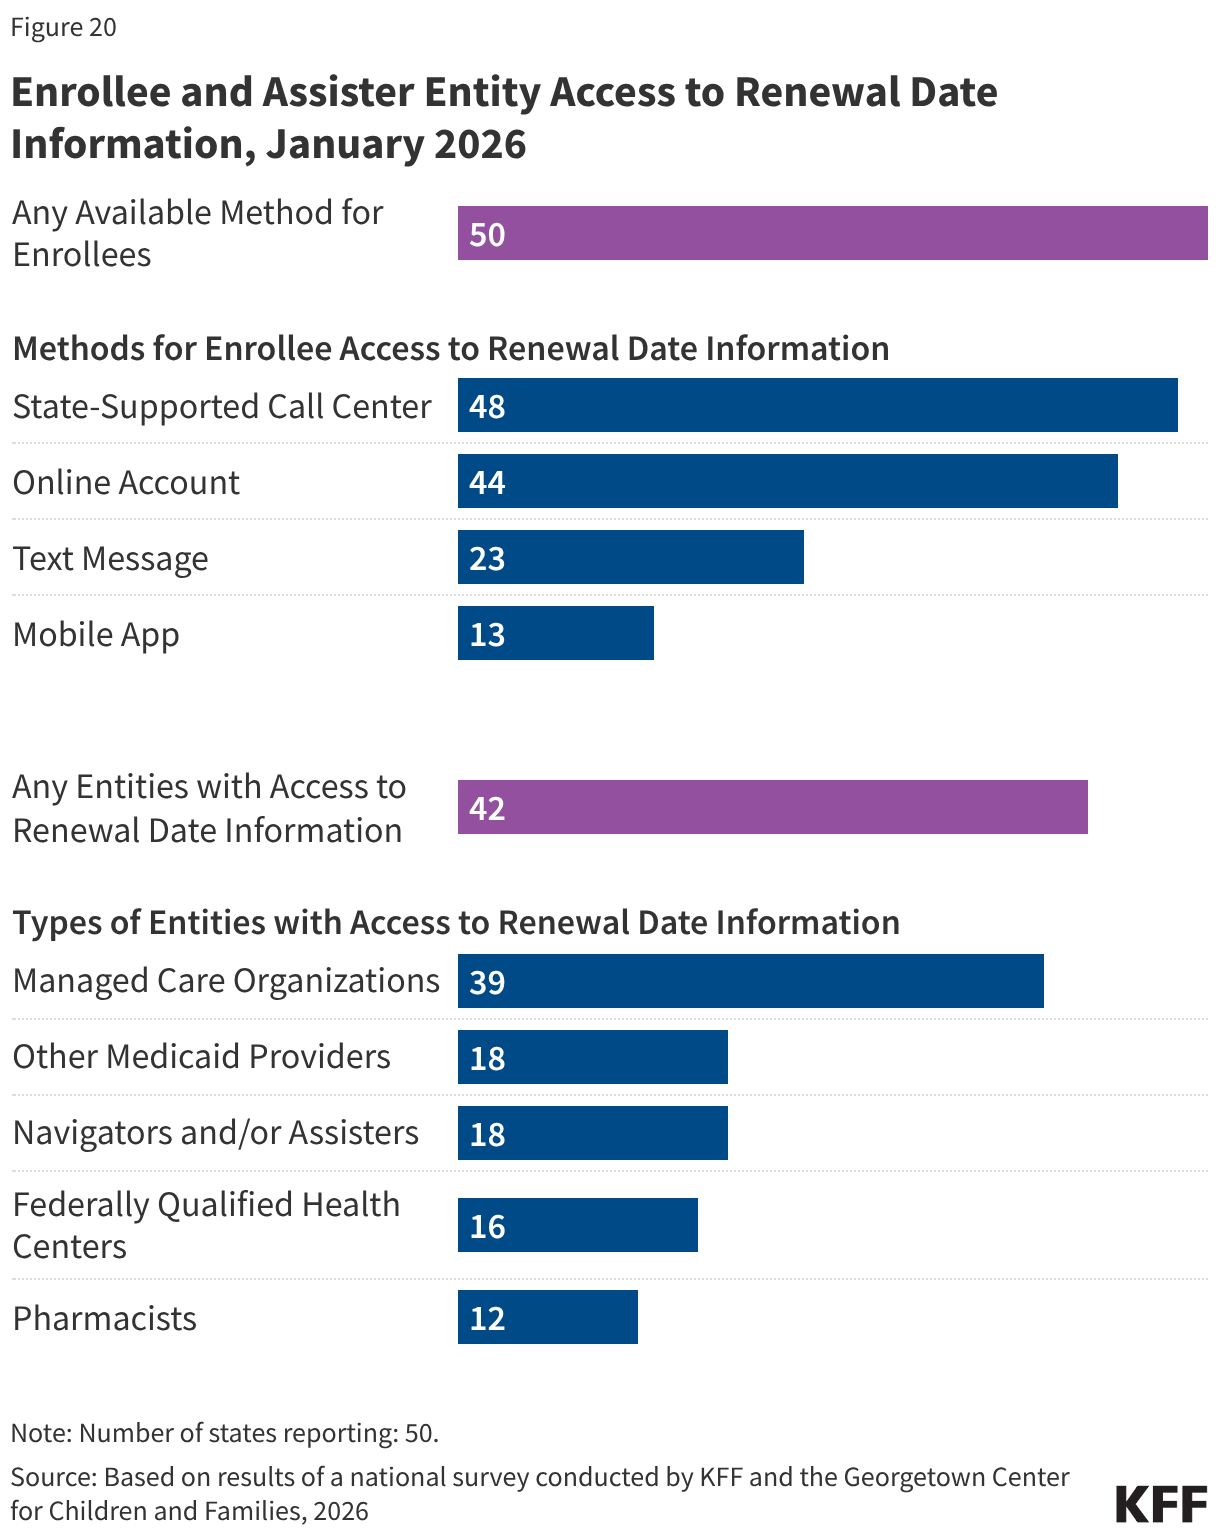
States continue to expand the ways individuals can access their renewal date directly or through providers and assisters. Providing enrollees with numerous ways to confirm their renewal date reduces the likelihood that they will miss renewal notices. This access to renewal dates will be particularly useful as expansion enrollees transition to 6-month renewal periods starting in January 2027. Enrollees can directly access their renewal date in their online accounts in 44 states, mobile app in 13 of 16 states with apps, through the Medicaid call center in 48 states, or via text message from the state in 23 states (Figure 20). All states offer at least one source, and half the states provide renewal information through three or more options. Most states (42) also share renewal dates with entities that provide services or assistance to enrollees, including MCOs (39 states), FQHCs (16 states), other providers (18 states), pharmacies (12 states), and navigators and/or assisters (18 states).
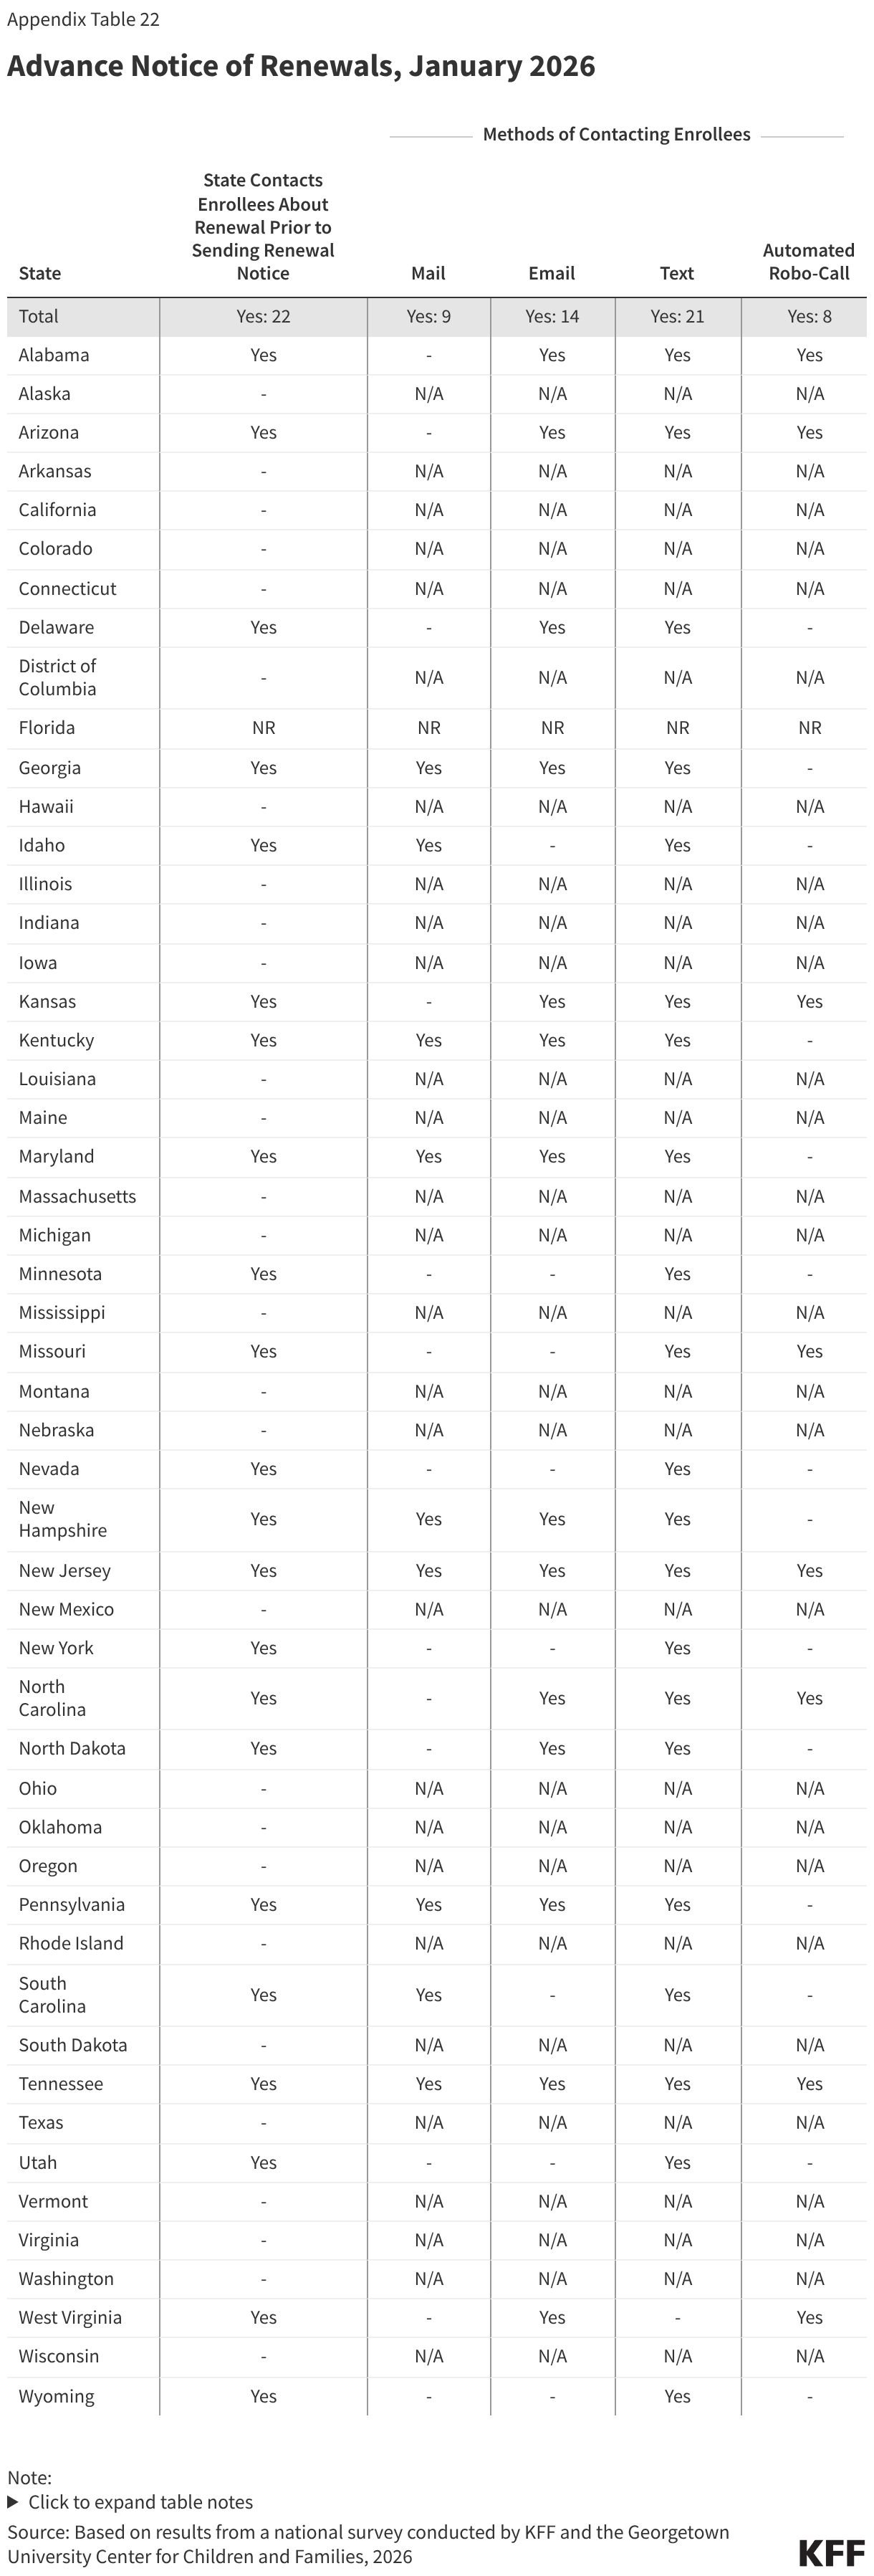
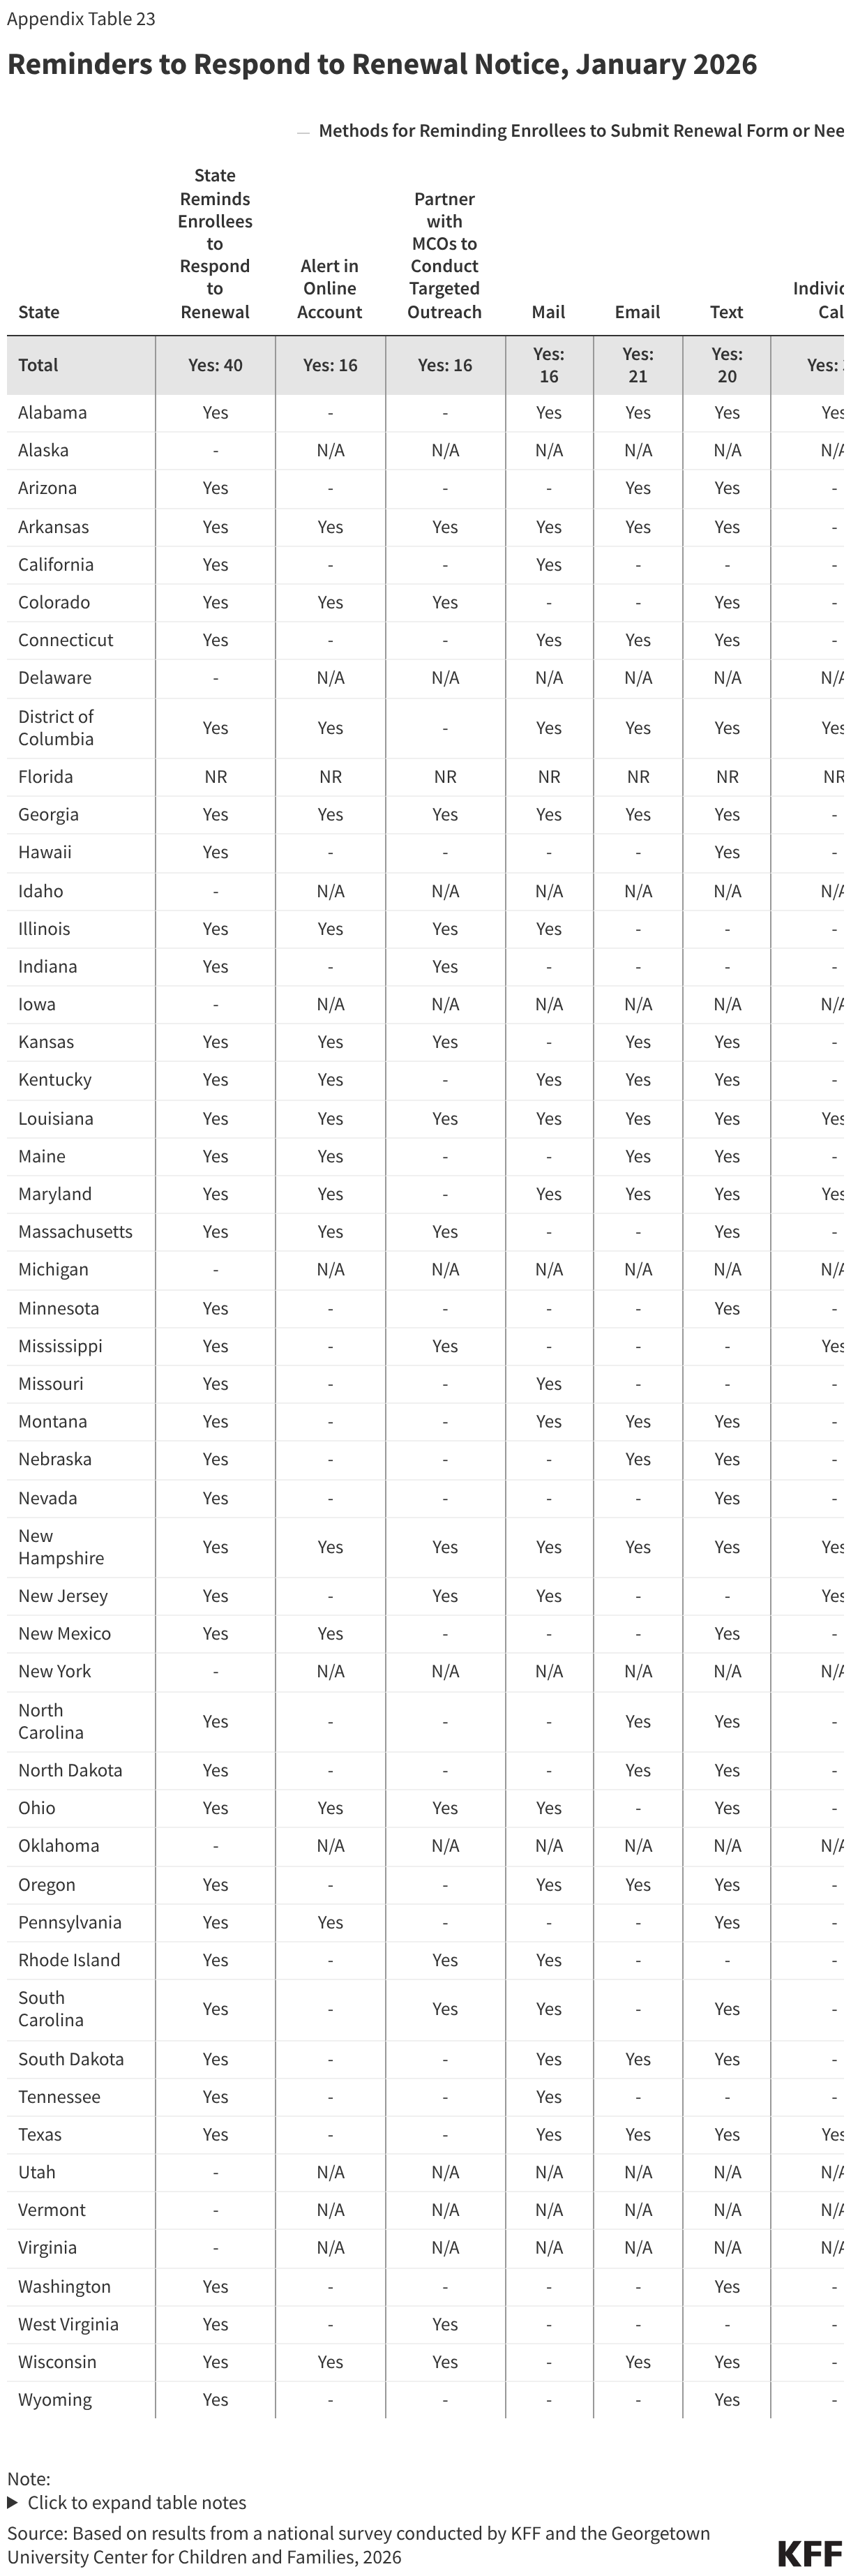
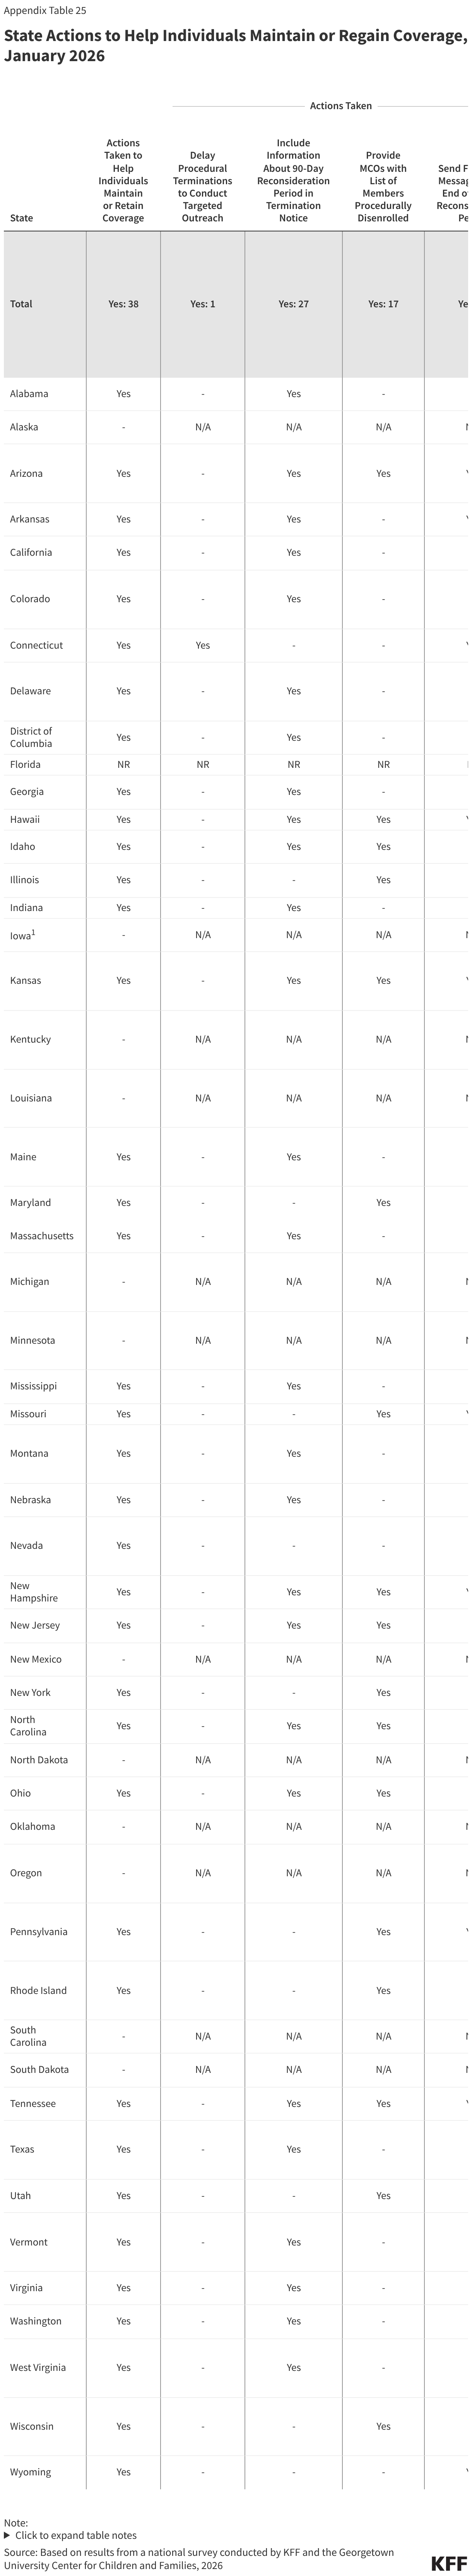
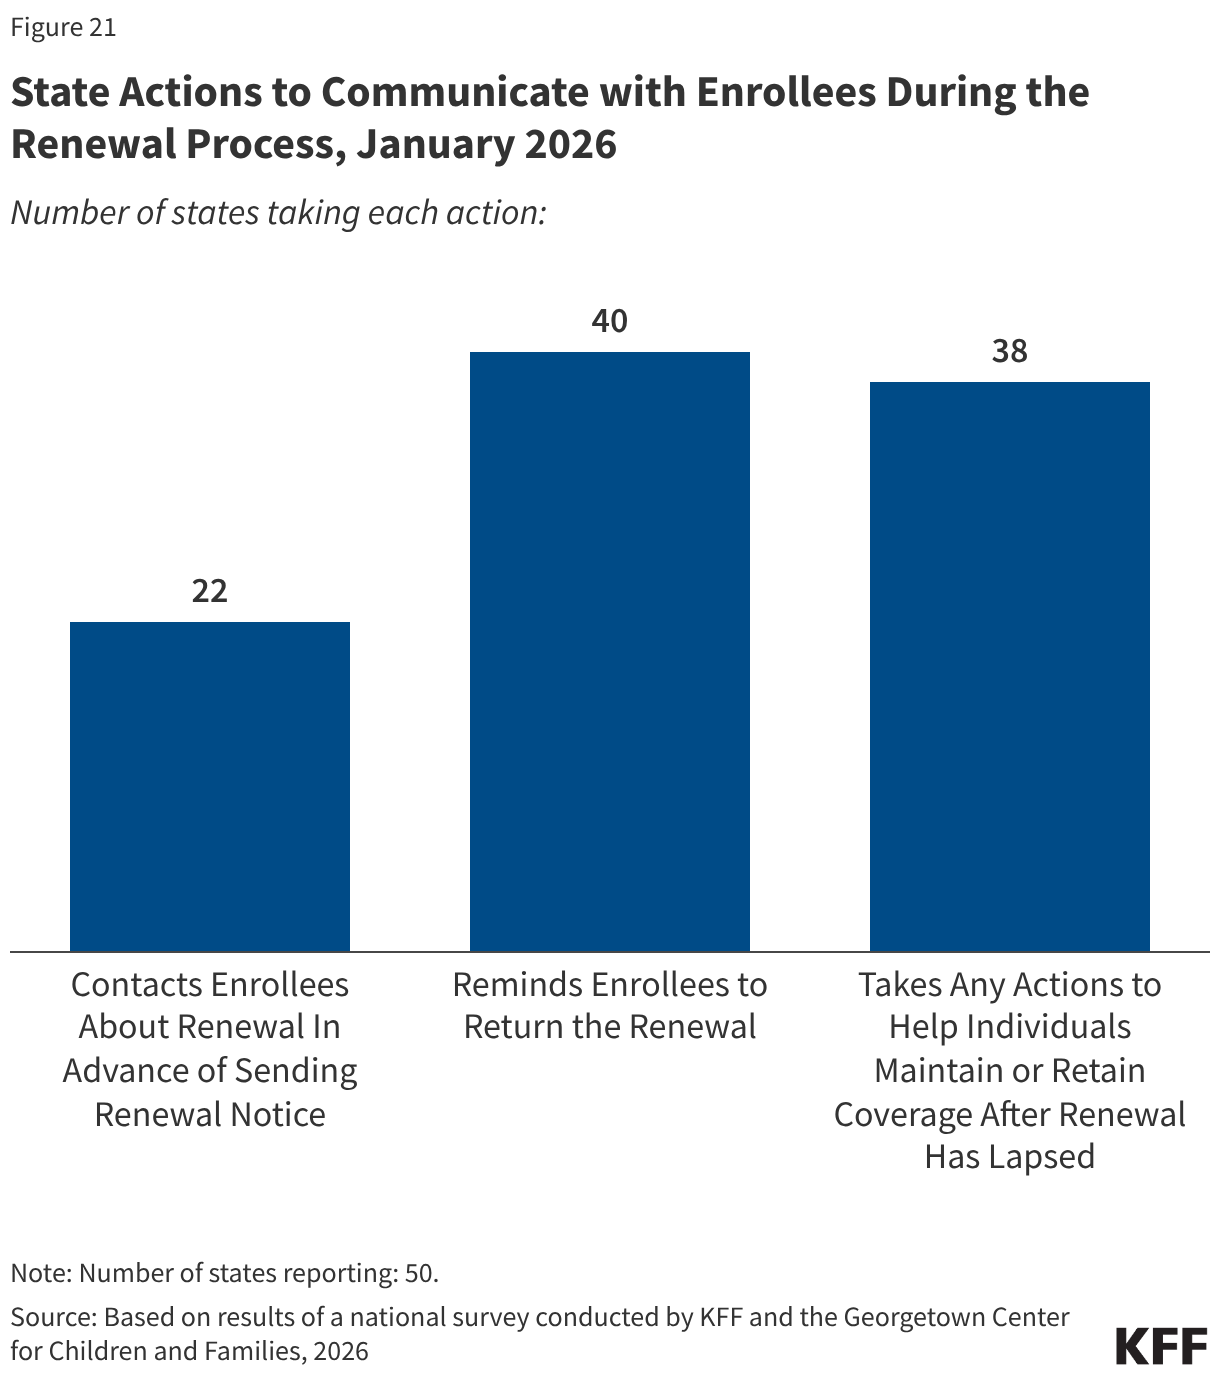
More states are using timely and cost-effective electronic communications, adding methods of communication, and boosting capacity to communicate more frequently with enrollees. During the Medicaid unwinding states sought to increase awareness of renewals and encourage enrollees to respond to improve retention and reduce procedural disenrollments of eligible individuals. To alert enrollees to upcoming renewals, 22 states send advance notice most frequently through text messages, but also via email, regular mail, and robo-calls; 40 states send reminders to enrollees to submit renewal information; and 38 states take various actions to help individuals maintain or regain coverage after disenrollment, including by providing information about the 90-day reconsideration period during which enrollees can still submit renewal forms and documentation (27 states) and by providing MCOs with a list of members who have been procedurally disenrolled (17 states) (Figure 21). It is unclear how work requirements will intersect with the 90-day reconsideration period as states await additional guidance from CMS.
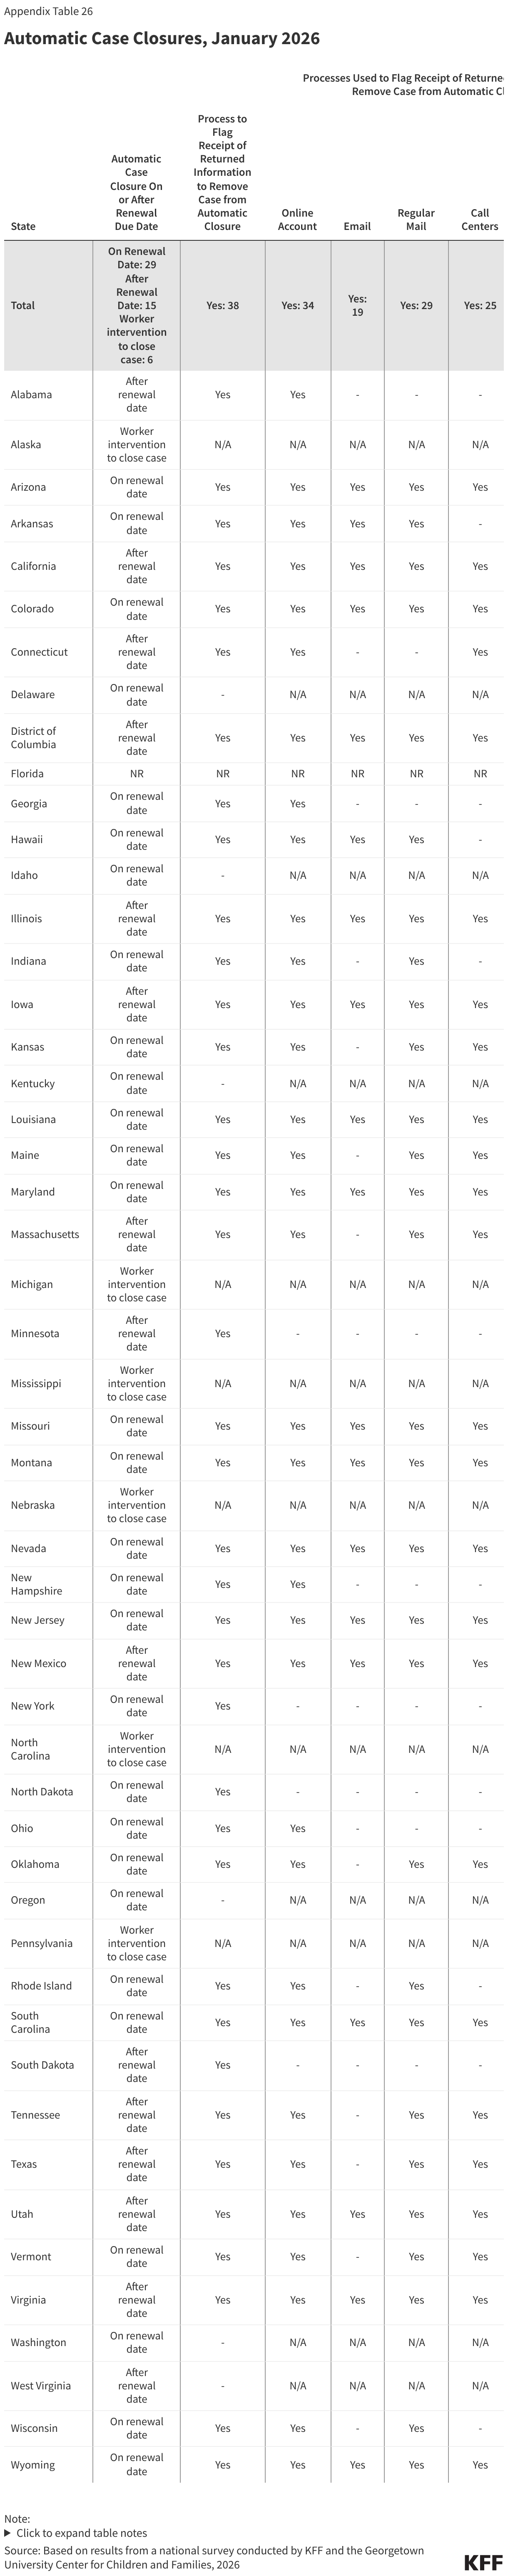
Automatic Case Closures at Renewal
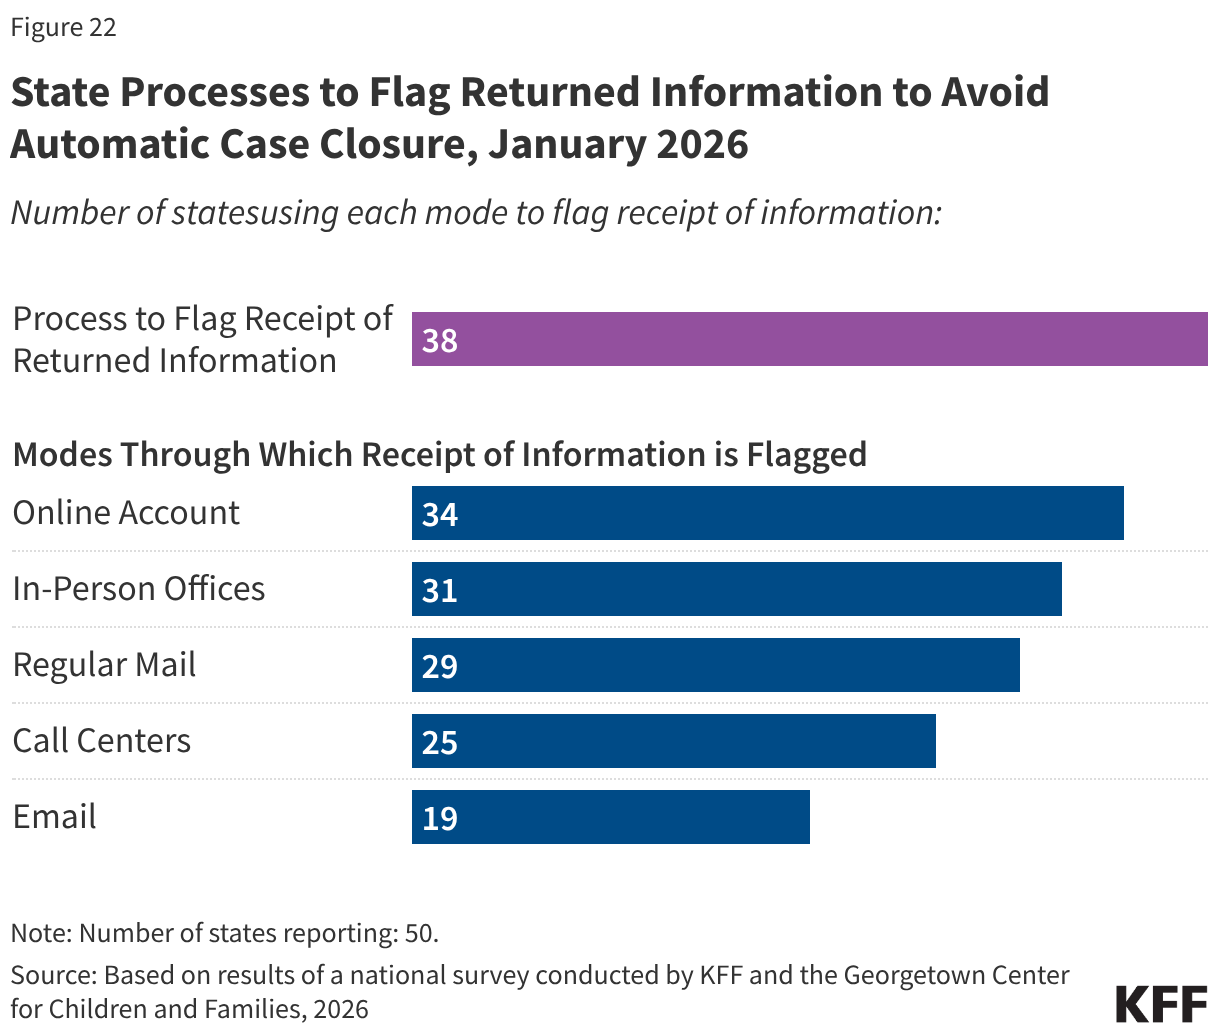
States have implemented additional measures to flag receipt of unprocessed renewal information to avoid automatically closing a case with a pending renewal. Most states (44) have eligibility systems that automatically close a case on or shortly after the renewal date if renewal information has not been received. But automatic case closure can result in a premature disenrollment if the renewal or other documentation has been received but is unprocessed. To avoid the extra work to disenroll and reenroll individuals, states have established processes to flag receipt of renewals or documentation in the multiple modes through which renewal information can be submitted, including online accounts, email, regular mail, call centers, and in-person offices, and remove cases from automatic closure (Figure 22). The number of states that flag information from any source increased to 38 from 33 in 2025. Having a process to avoid automatic case closure when documents have been received may be particularly important as states shift from a 12-month to a 6-month renewal cycle and as they implement work requirements for expansion enrollees. During this transition, expansion enrollees who are confused by the earlier than expected renewals or by the new work requirements may be late in responding to renewal notices. It is unclear whether expansion states will have to make any changes to their automated case closure systems when they implement work requirements.
Changes in Circumstances
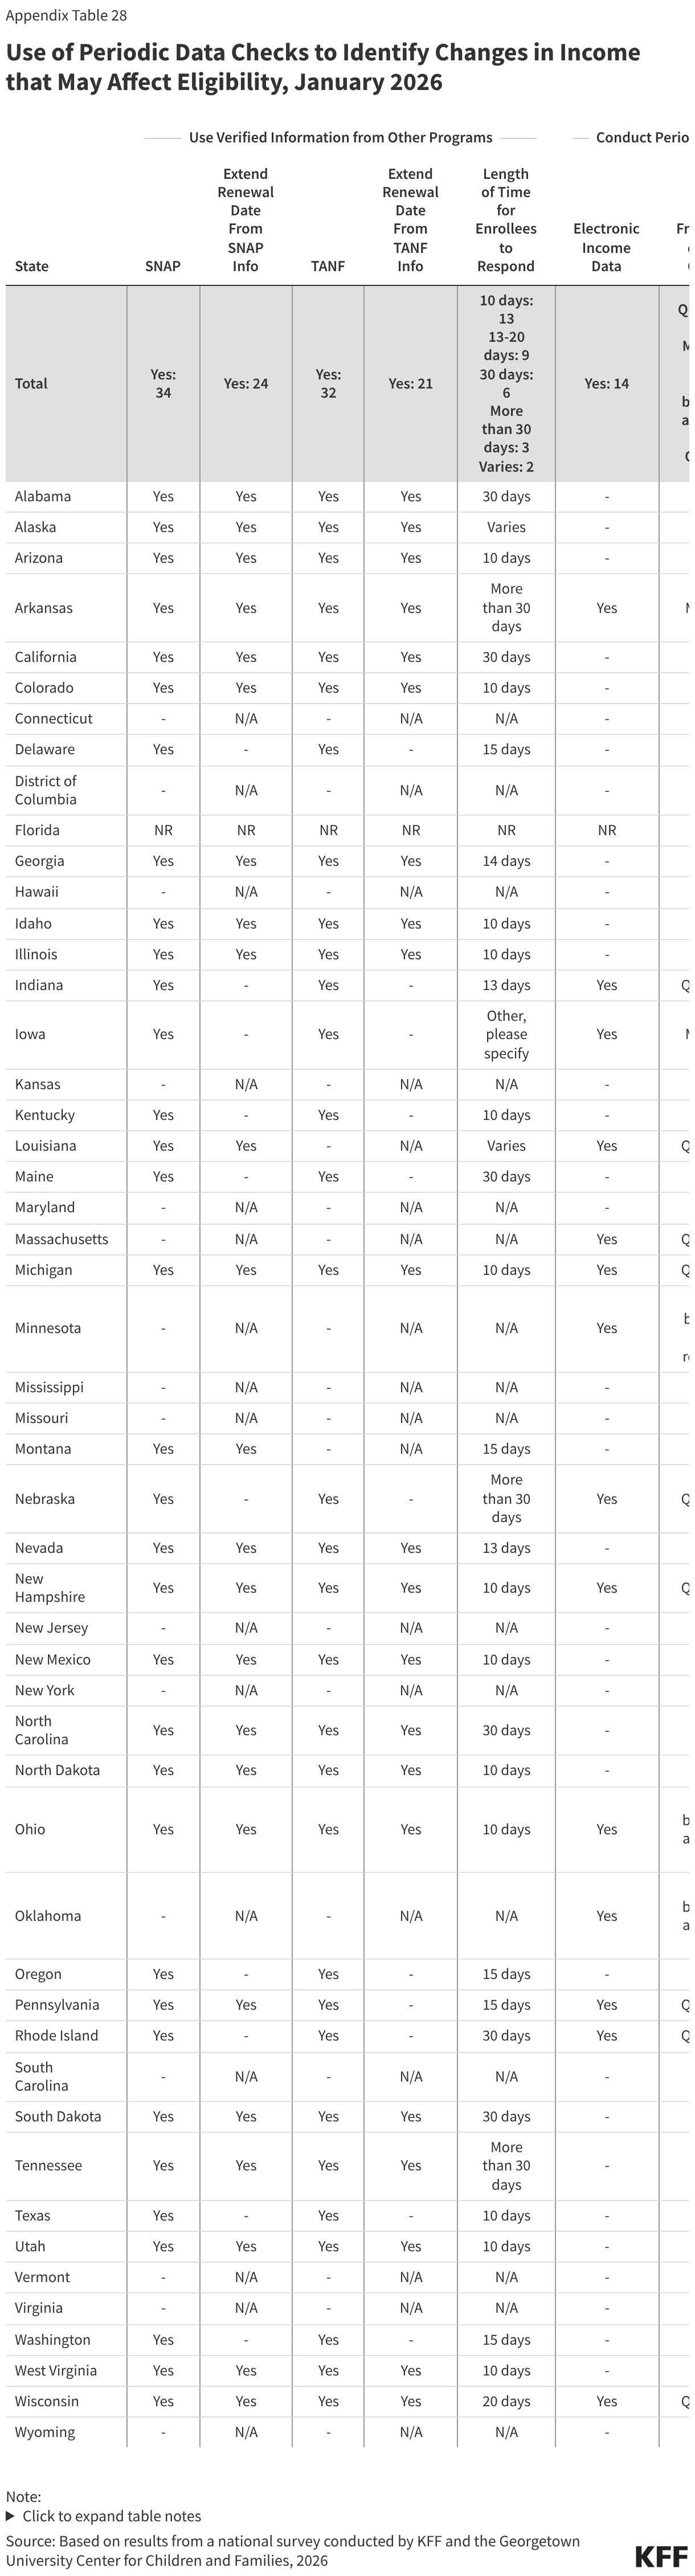
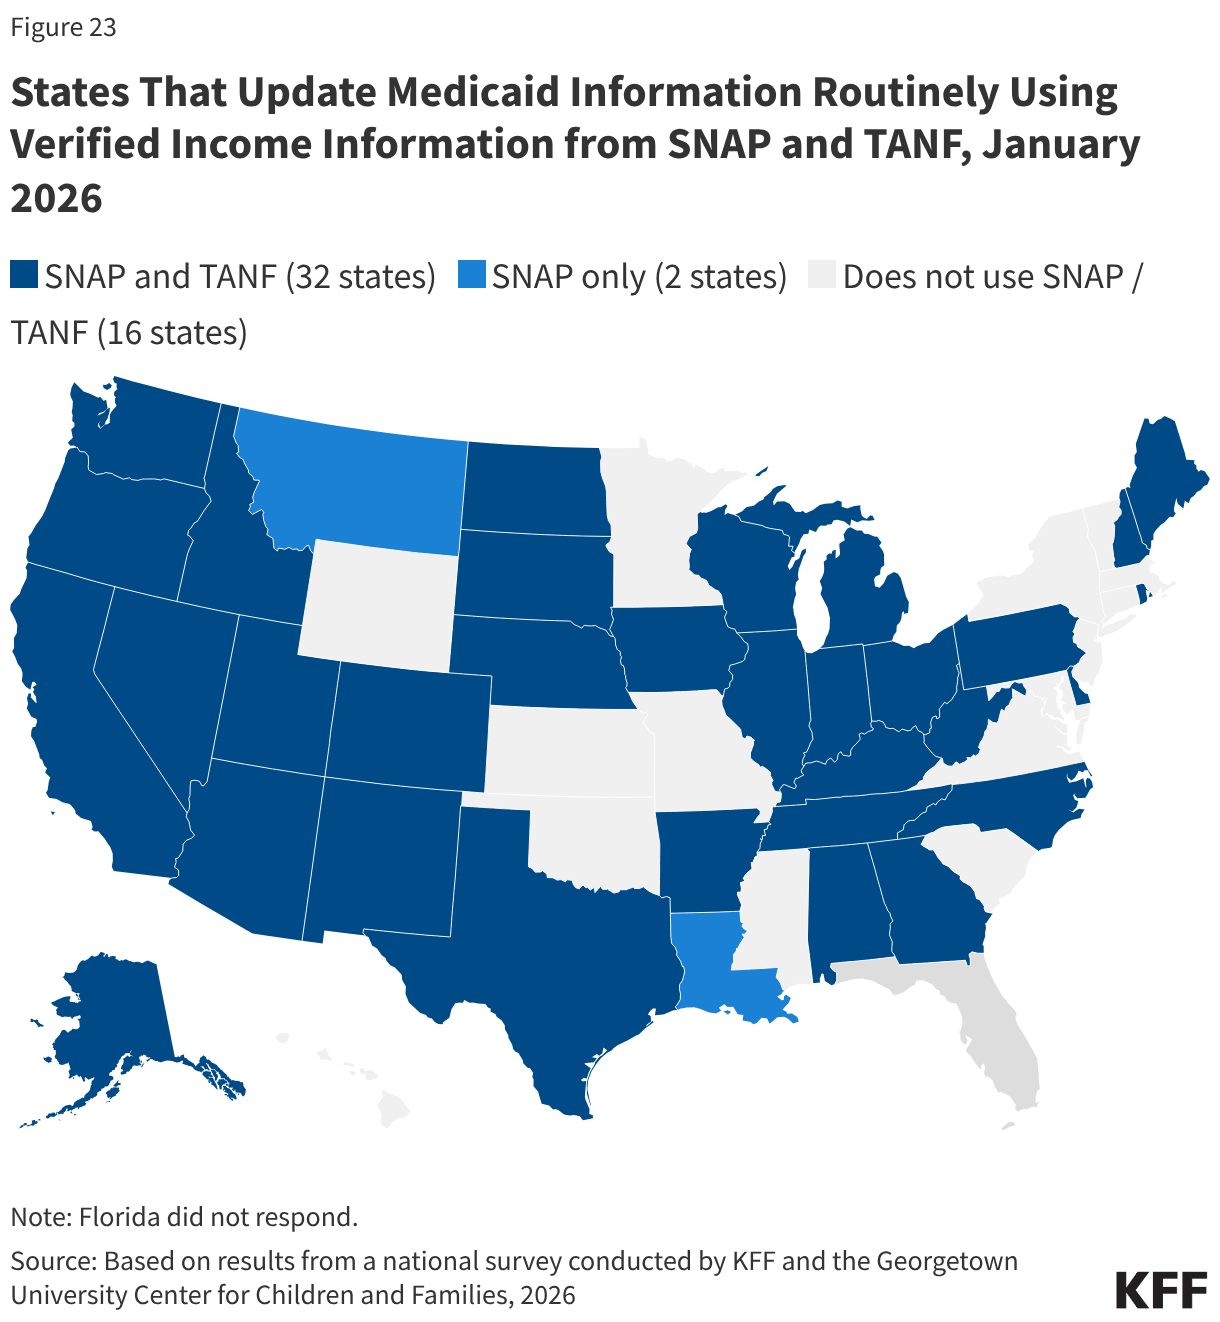
Two-thirds of states use verified information from SNAP (34 states) and TANF (32 states) to update Medicaid information on a routine basis (Figure 23). If states receive all the information from the other programs that is needed to verify ongoing eligibility for Medicaid without requesting information from the individual, the state may set a new 12-month renewal date, which 24 states do when they receive data from SNAP data and 21 states do with information from TANF. For enrollees subject to work requirements, states will likely need guidance from CMS on what data from SNAP and/or TANF they can use to verify compliance or exemption status and whether states can set a new 6-month renewal date if the information is provided between renewal periods. If, however, the data indicates the individual is no longer eligible, states may terminate coverage but must send a termination notice at least 10 days in advance of case closure to provide enrollees with time to submit documentation verifying ongoing eligibility. The E&E rule requires states to provide at least 30 days to respond to provide documentation if the data indicates the individual is no longer eligible; however, this provision is subject to the 10-year moratorium on implementation. Currently, only nine states provide at least a 30-day response period. The short timeline for returning information can result in churn and increase state and MCO administrative burden to disenroll and then re-enroll an individual.
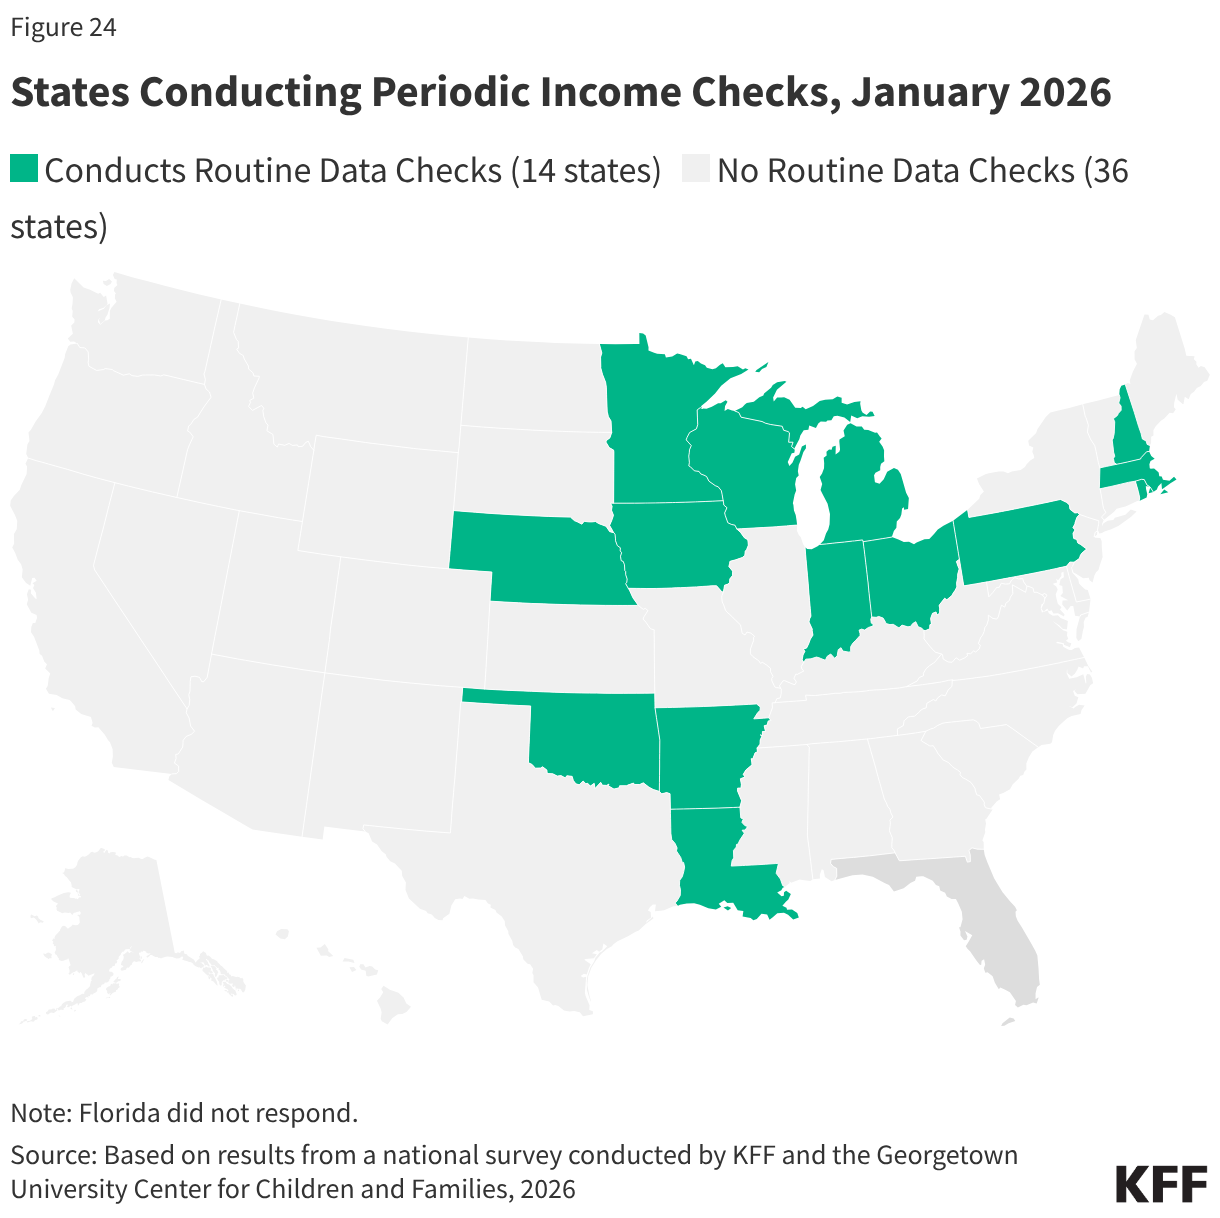
Fourteen (14) states (all expansion states, except Wisconsin) check other income data sources periodically to identify changes in circumstances, most often on a quarterly basis (Figure 24). Only five of these states provide 30 or more days for the individual to respond if the data check indicates the individual is no longer eligible. States are not required to conduct income checks between renewals, and without more CMS guidance, it is not clear how these periodic checks could impact semi-annual renewals or compliance with work requirements.
Premiums and Cost-Sharing
Current federal rules limit premiums and cost sharing in Medicaid and CHIP given enrollees’ limited ability to pay out of pocket costs. Under these rules, states may not charge premiums in Medicaid for enrollees with incomes less than 150% FPL without a waiver. Maximum allowable cost sharing varies by type of service and income in Medicaid. CHIP programs have more flexibility to charge premiums and cost sharing, but both Medicaid and CHIP limit total family out-of-pocket costs to no more than 5% of family income, and states are required to maintain tracking systems to cease cost-sharing once a family meets the cap.
Beginning in October 2028 states must implement mandatory cost sharing of up to $35 per service for ACA expansion adults with income between 100%-138% FPL. Certain services are exempt from cost sharing, including primary and preventive care, emergency services, family planning and pregnancy-related services, and mental health care and substance use disorder services. The law also excludes from cost sharing services received in federally-qualified health centers (FQHCs), certified community behavioral clinics, and rural health clinics. Prescription drugs are included in the mandate but the current rules limiting cost-sharing for prescription drugs remains in place. CMS guidance is needed to clarify any flexibility that states may have in determining whether some or all non-exempt services must require cost-sharing. The cap of 5% of household income still applies to total premiums and/or cost-sharing for all enrolled members of the household. The law also prohibits states from charging premiums to expansion adults subject to the new cost sharing requirements.
Cost Sharing for Parents and Expansion Adults
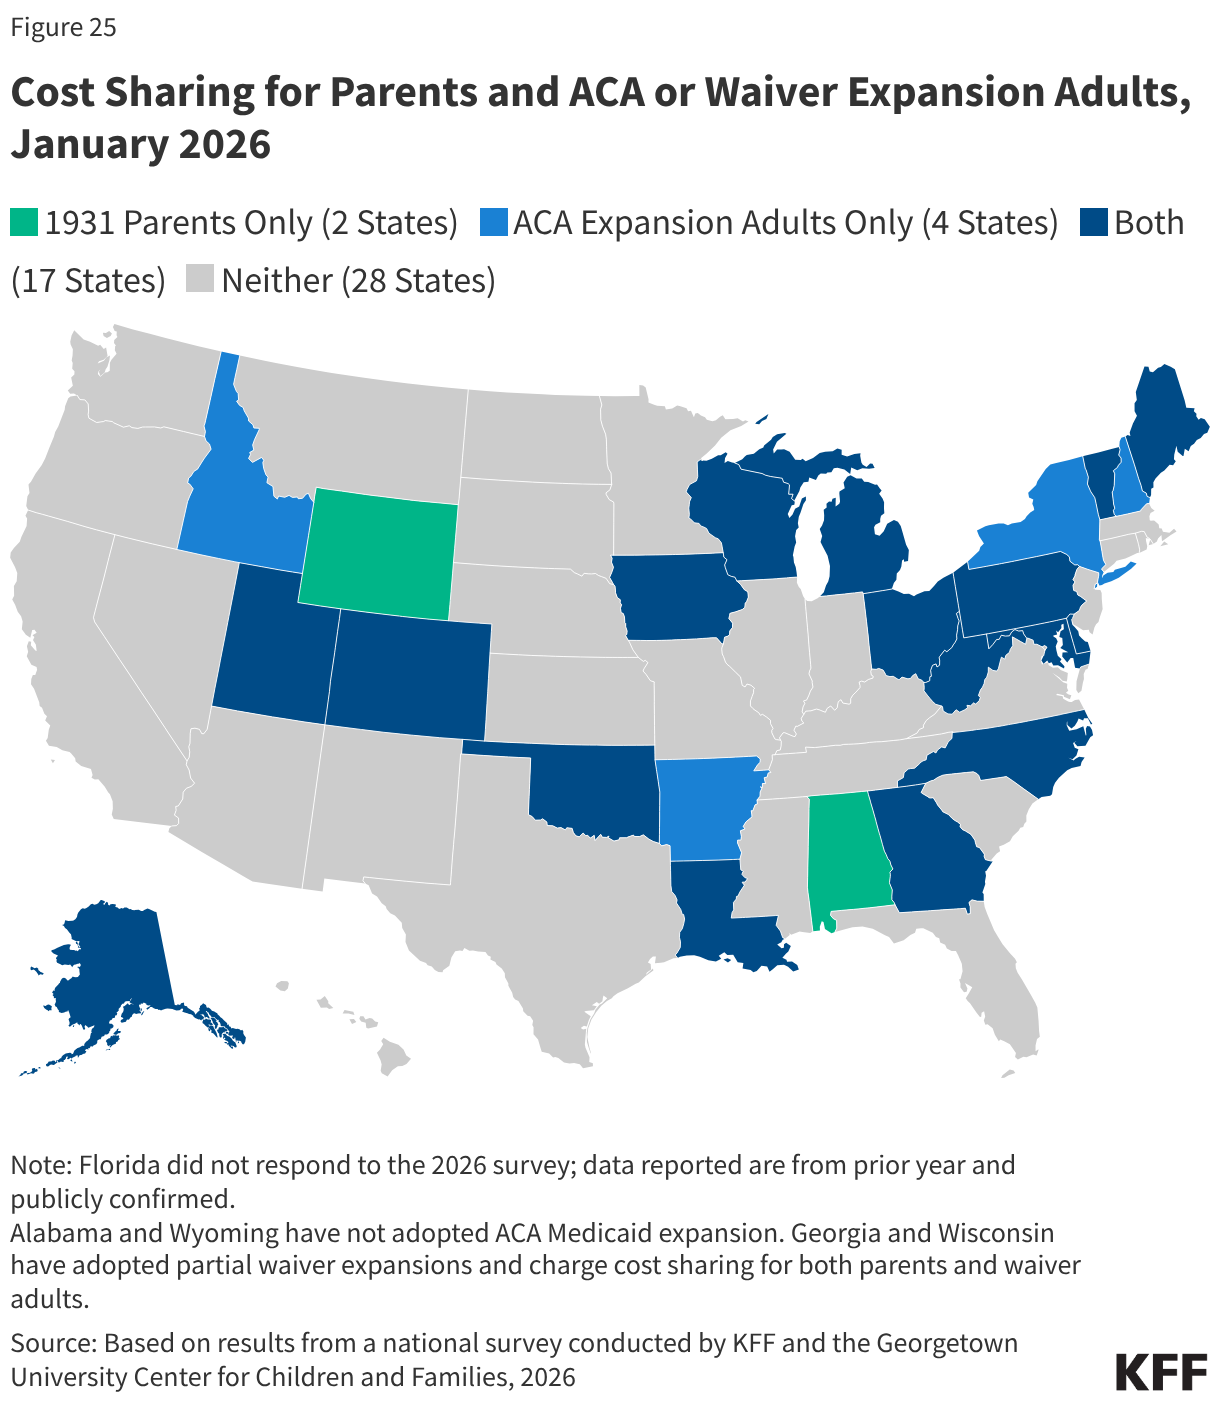
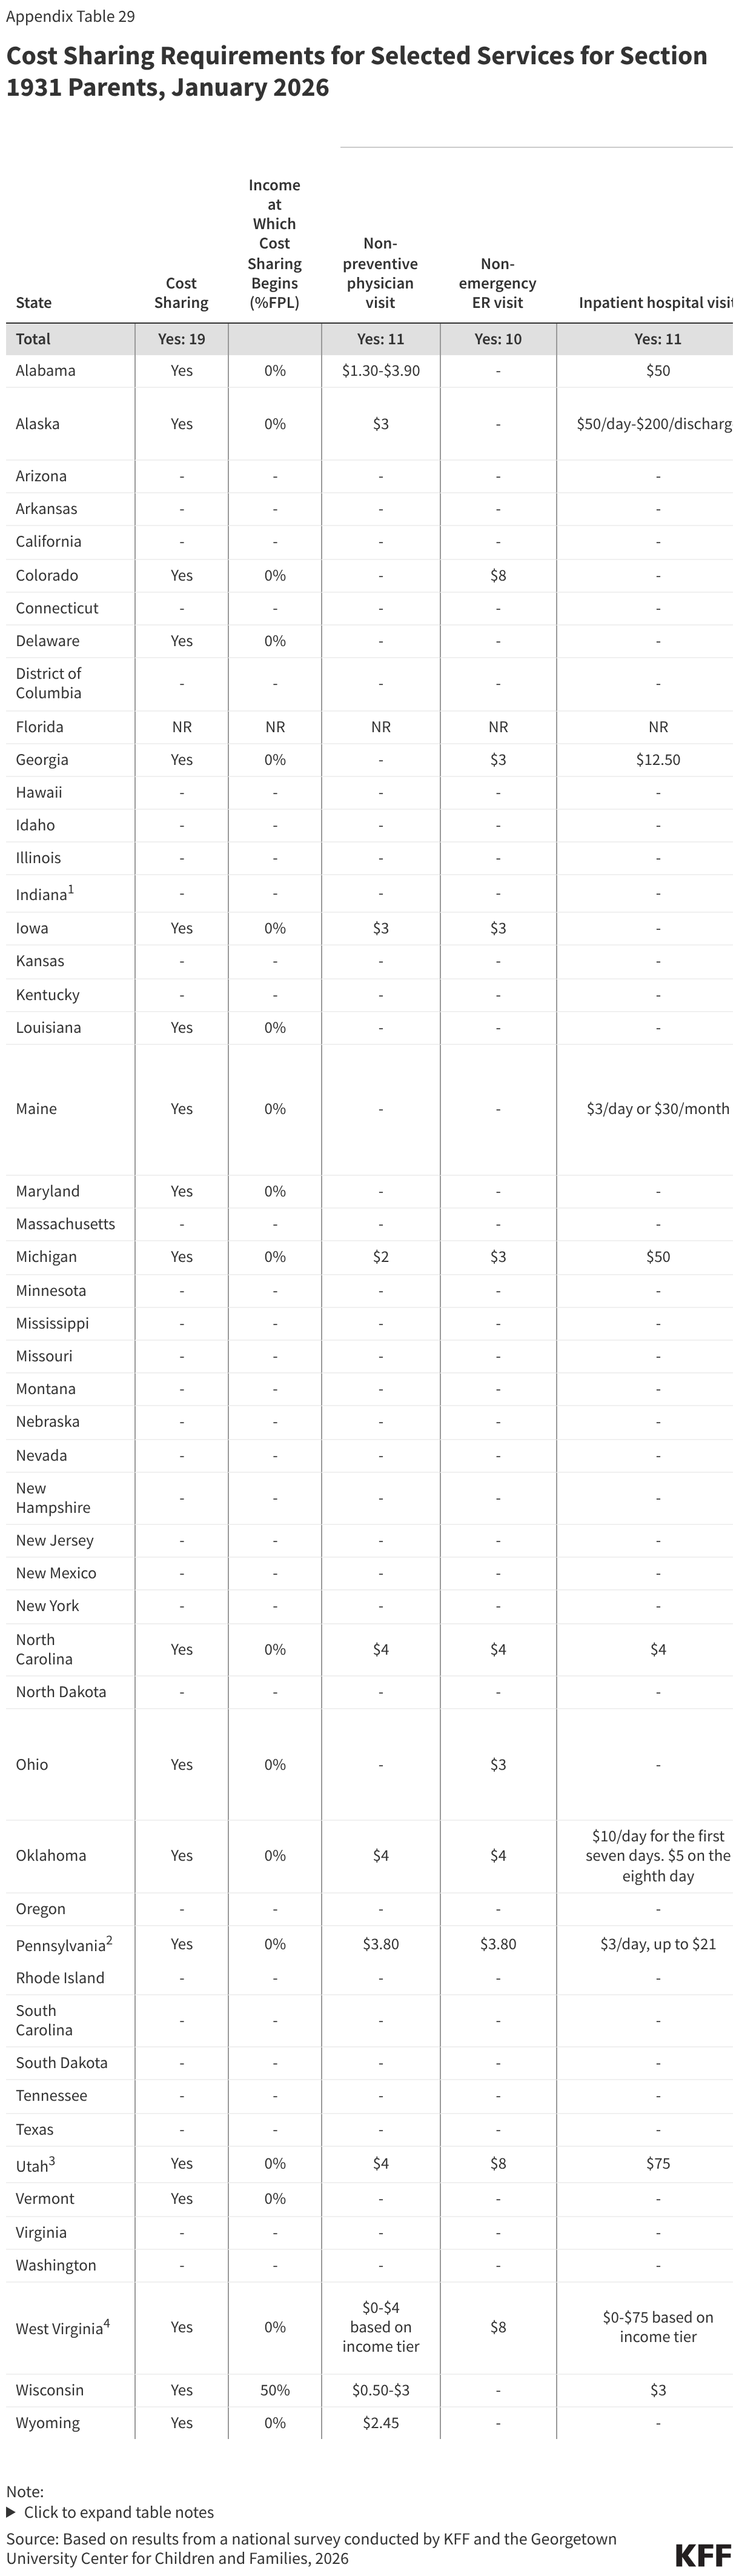
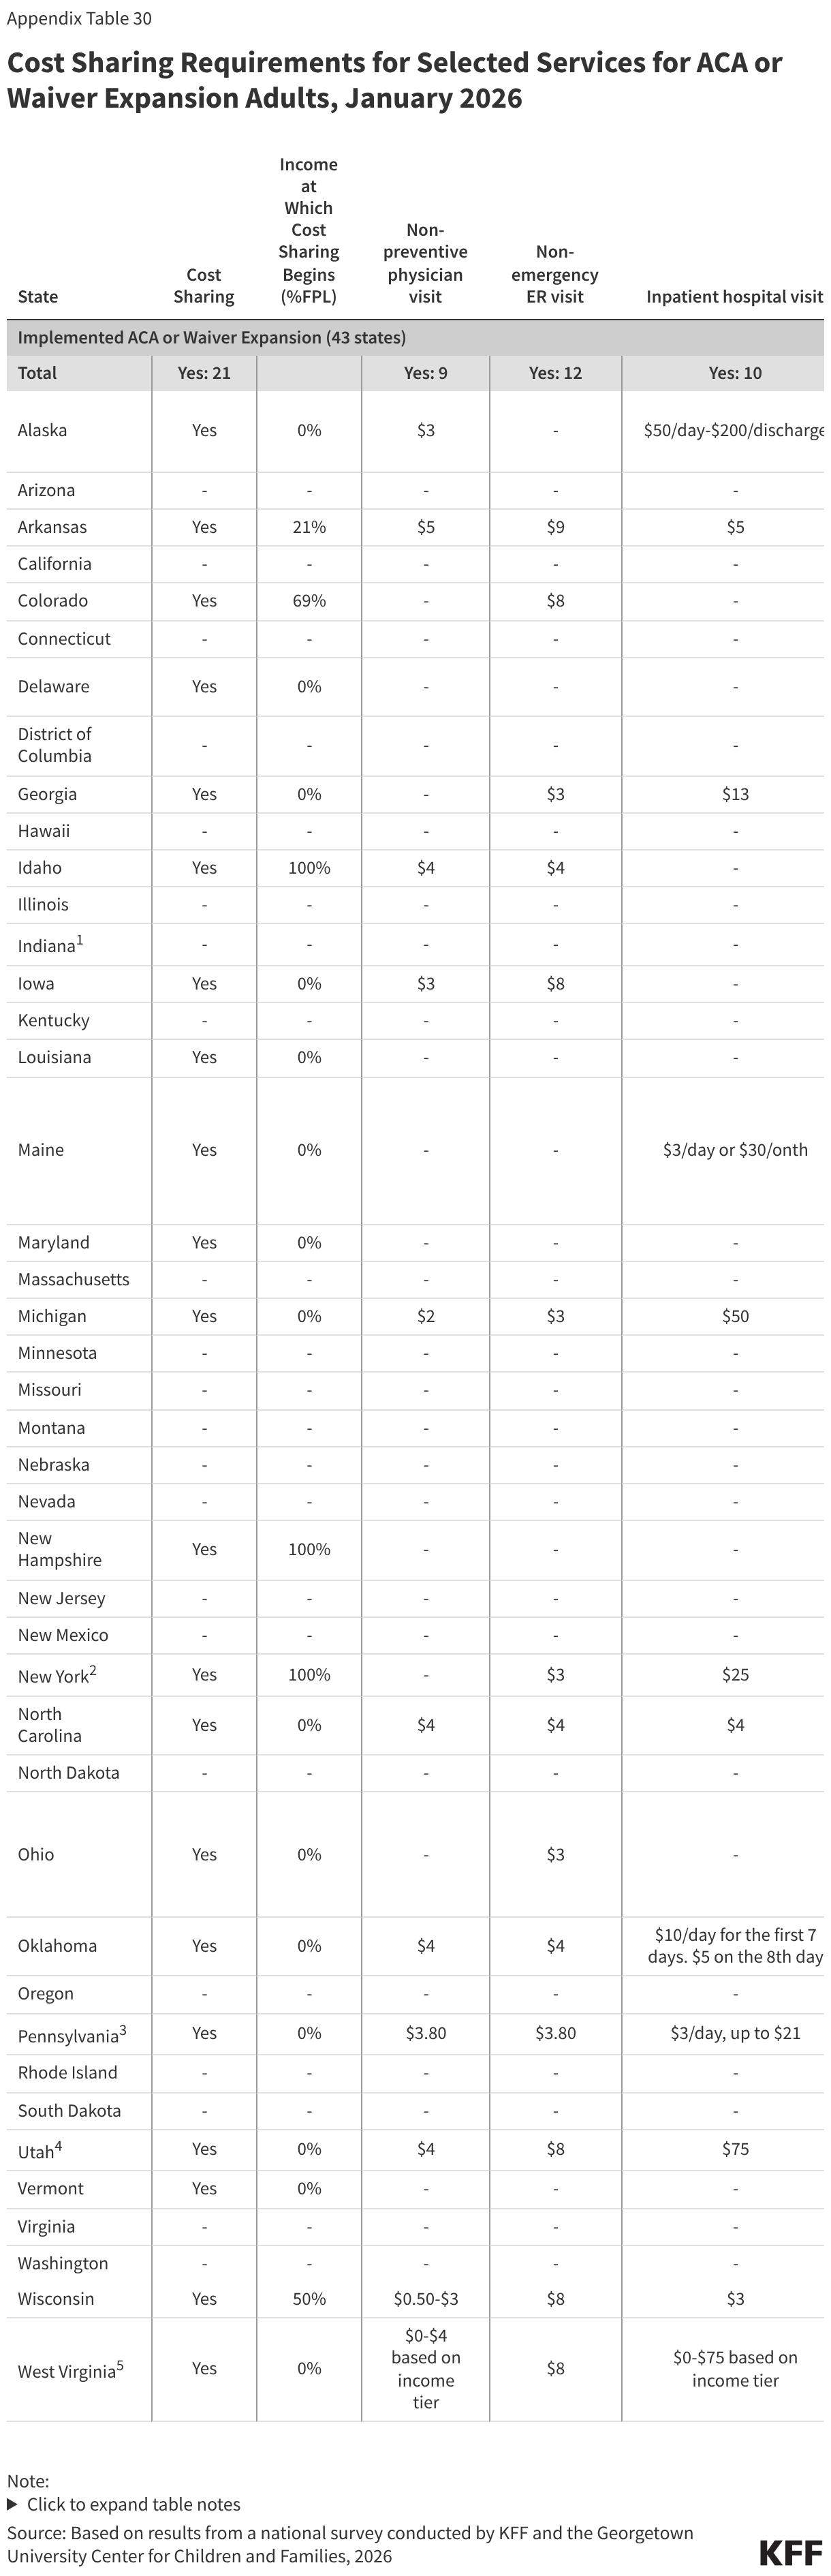
As of January 1, 2026, 19 states charge nominal cost-sharing to Section 1931 parents, and 21 states charge cost sharing to ACA or waiver expansion adults, while the remaining states do not charge cost-sharing (Figure 25). Cost sharing applies to all Section 1931 parents regardless of income, except in Wisconsin, which imposes cost sharing on parents with income 50% FPL or higher. Fifteen states charge cost-sharing to ACA or waiver expansion enrollees regardless of income. Three states limit cost-sharing to ACA expansion enrollees with income 100% FPL or above. Generally, charges among expansion states are well under $10 per service; however, four states charge more than $35 for any service. Alaska, Michigan, Utah, and West Virginia charge copays for a hospital inpatient stay of $50 or $75 per admission.
Children’s Premiums
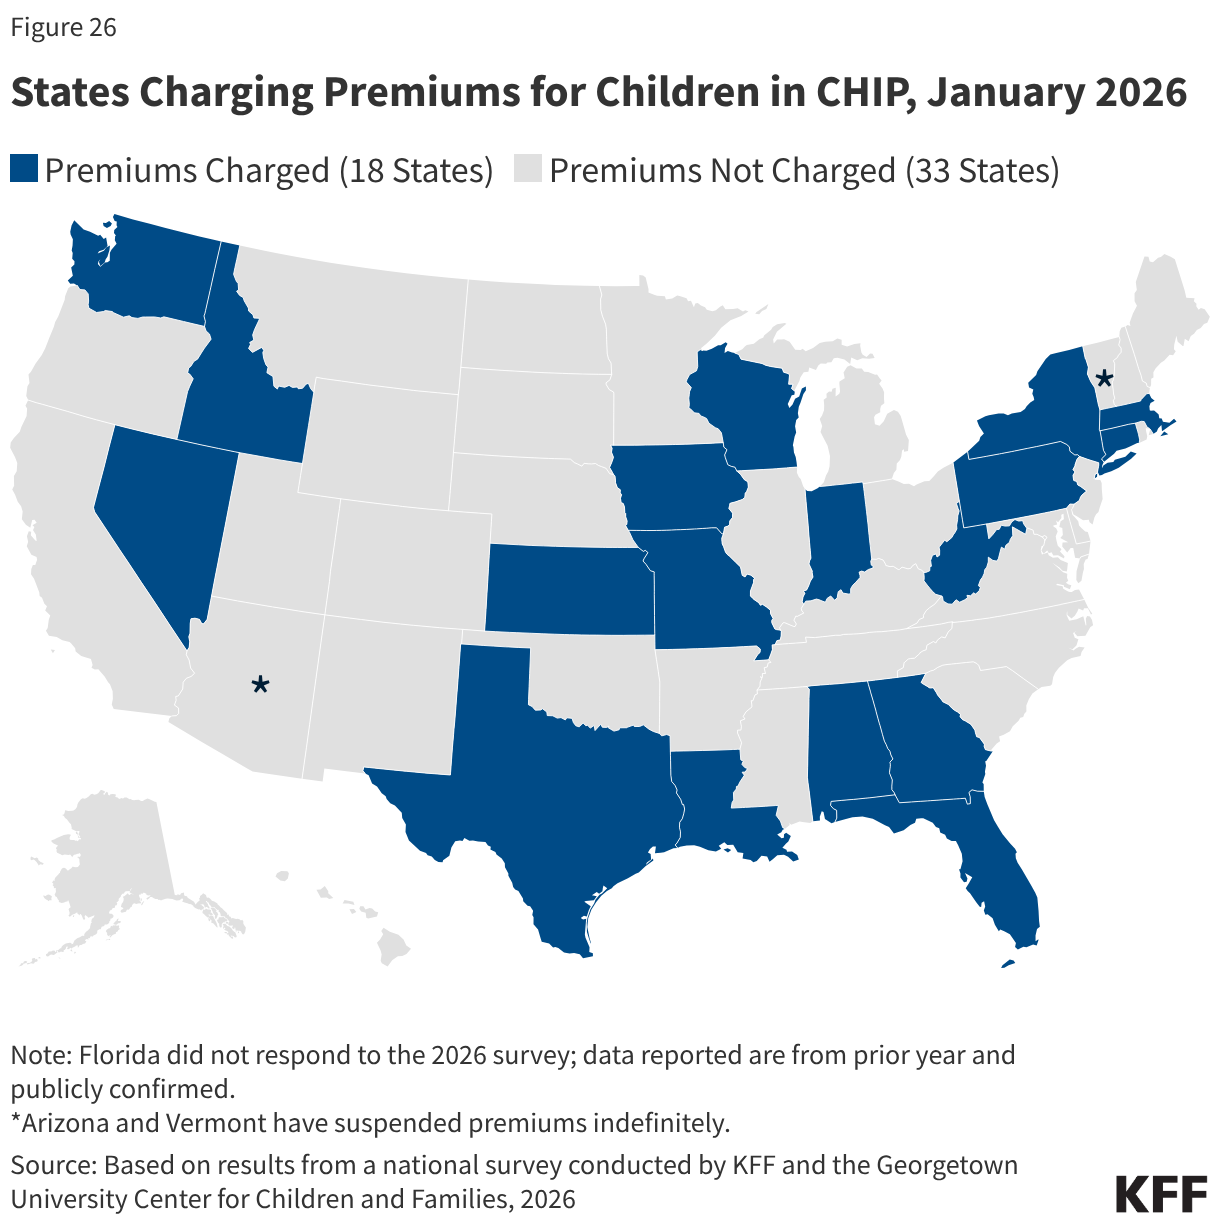
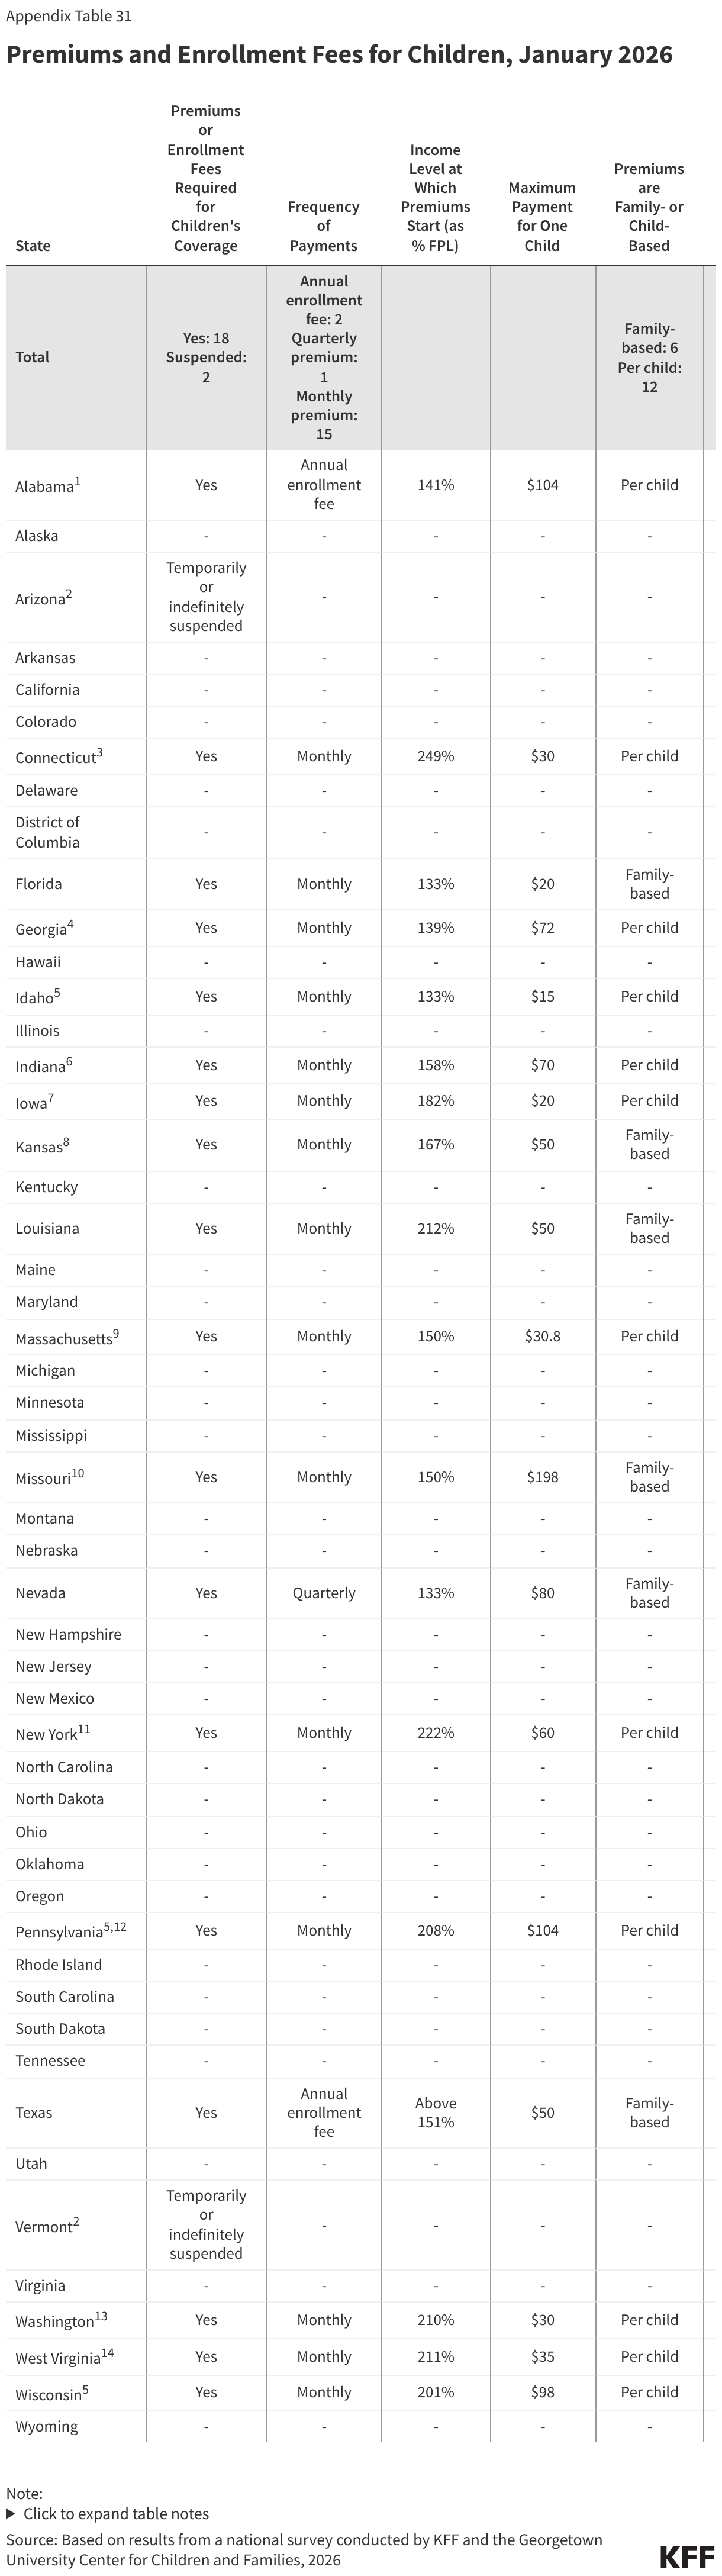
Eighteen (18) states continue to charge premiums to children in CHIP in 2026 (Figure 26). That number is down from 30 states that charged premiums to children in CHIP and/or Medicaid in 2020. Only three states charge premiums at the lowest income of 133% FPL allowed in CHIP, while the median income at which premiums start is 163% FPL or $44,531 annually for a family of three. Alabama and Texas charge annual enrollment fees, Nevada charges quarterly premiums, and the remaining states charge monthly premiums. Six states charge a family-based premium regardless of the number of children. A dozen (12) states charge per child premiums with a maximum family premium in nine of those states. Nine states require prepayment of the first month in CHIP prior to enrollment. Once a child is enrolled, the 12-month continuous enrollment provision protects children from disenrollment following a missed premium payment.