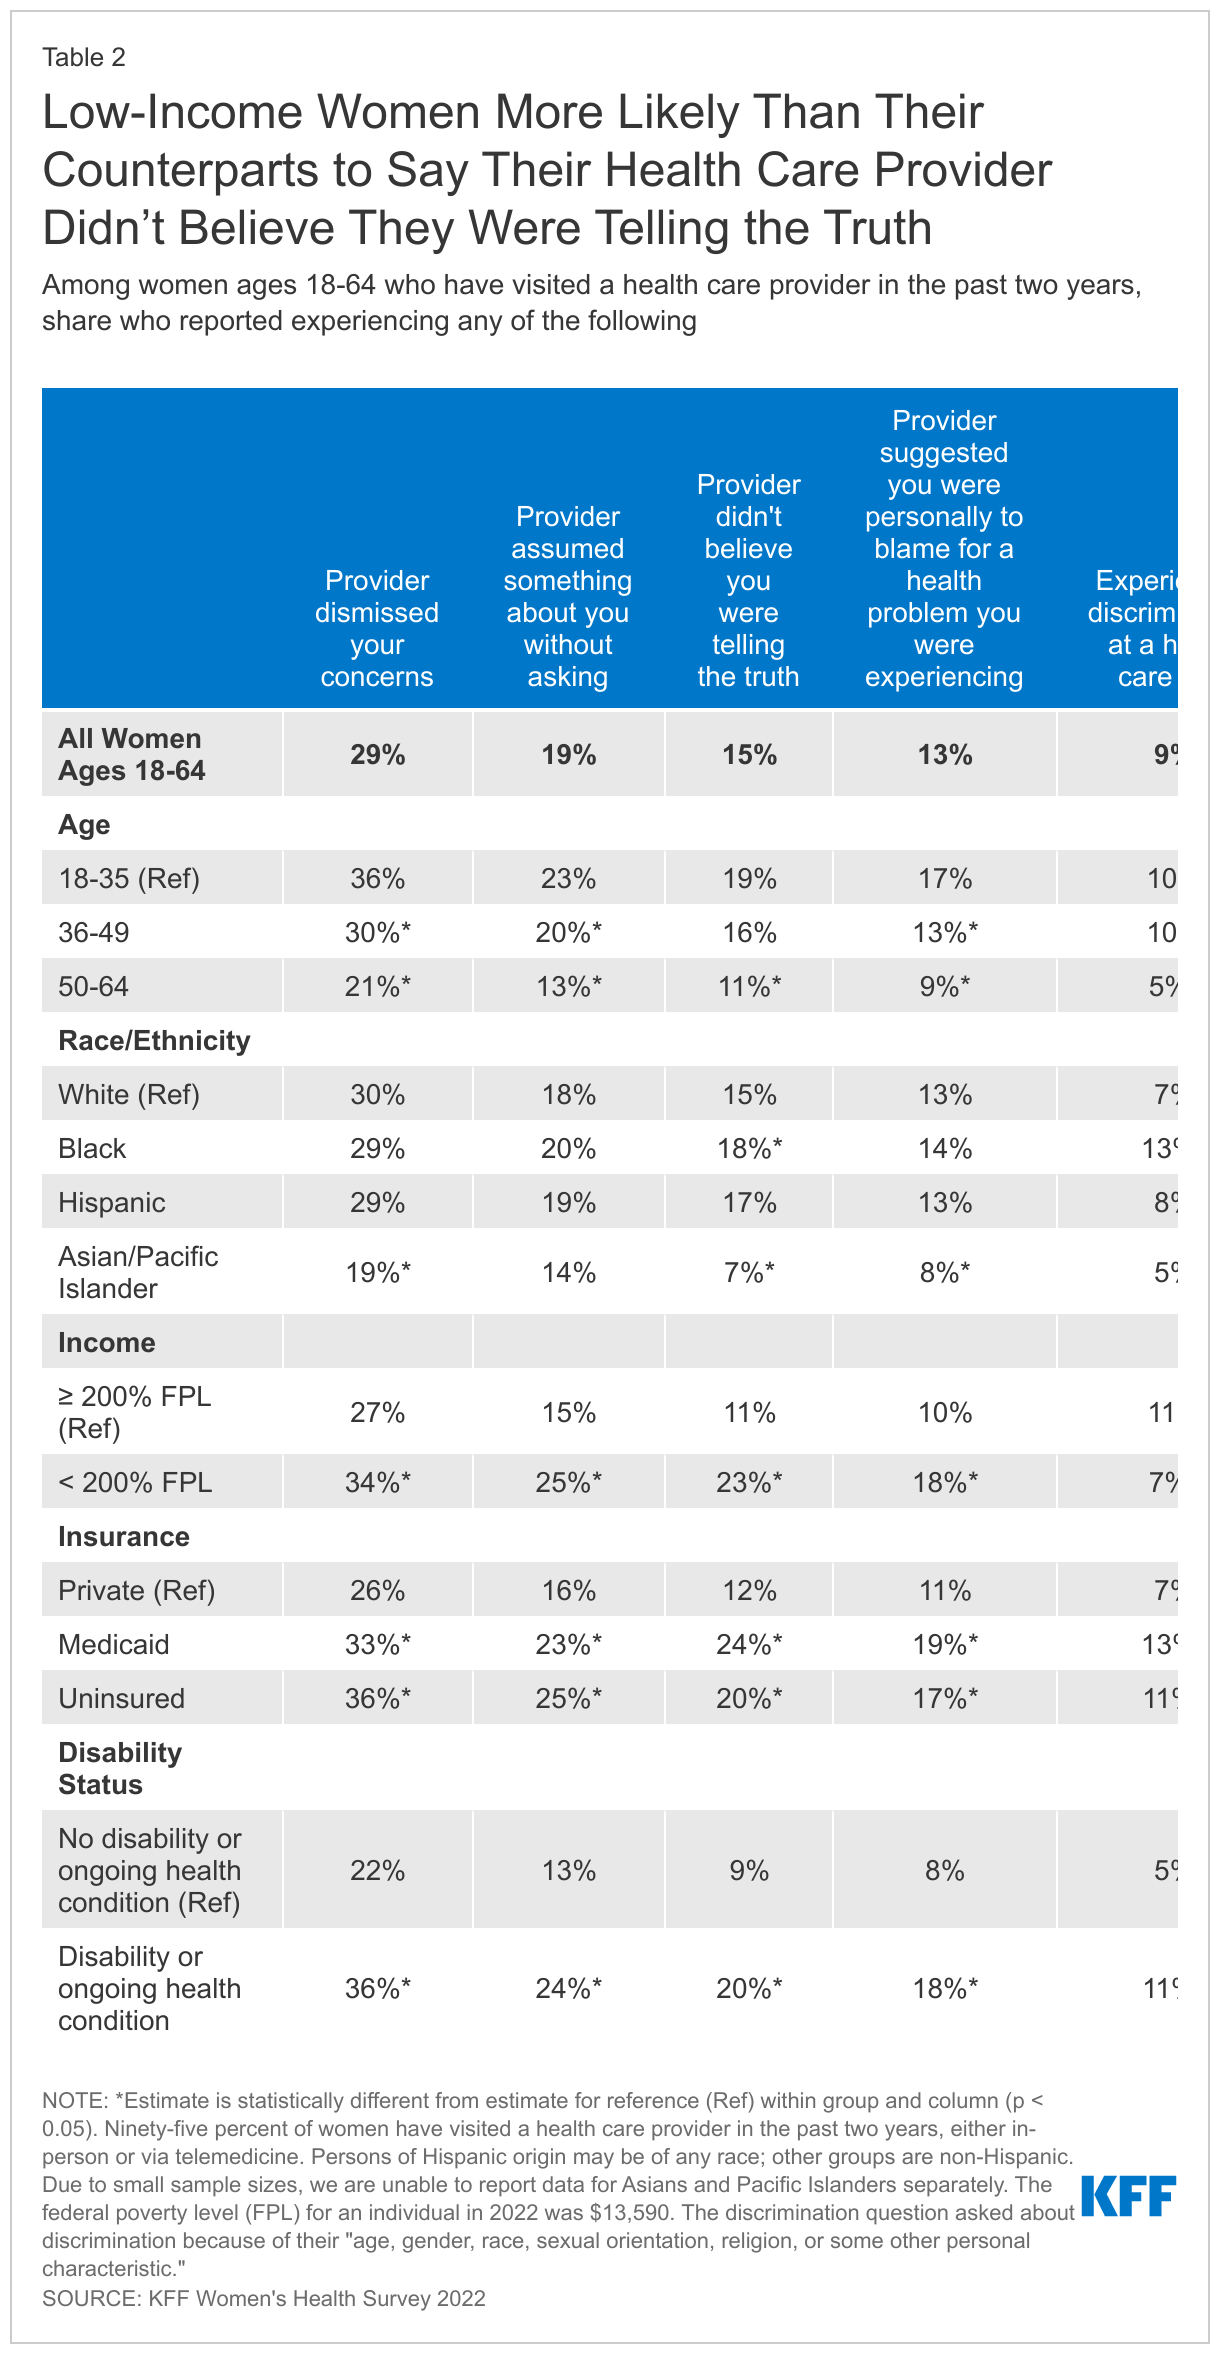
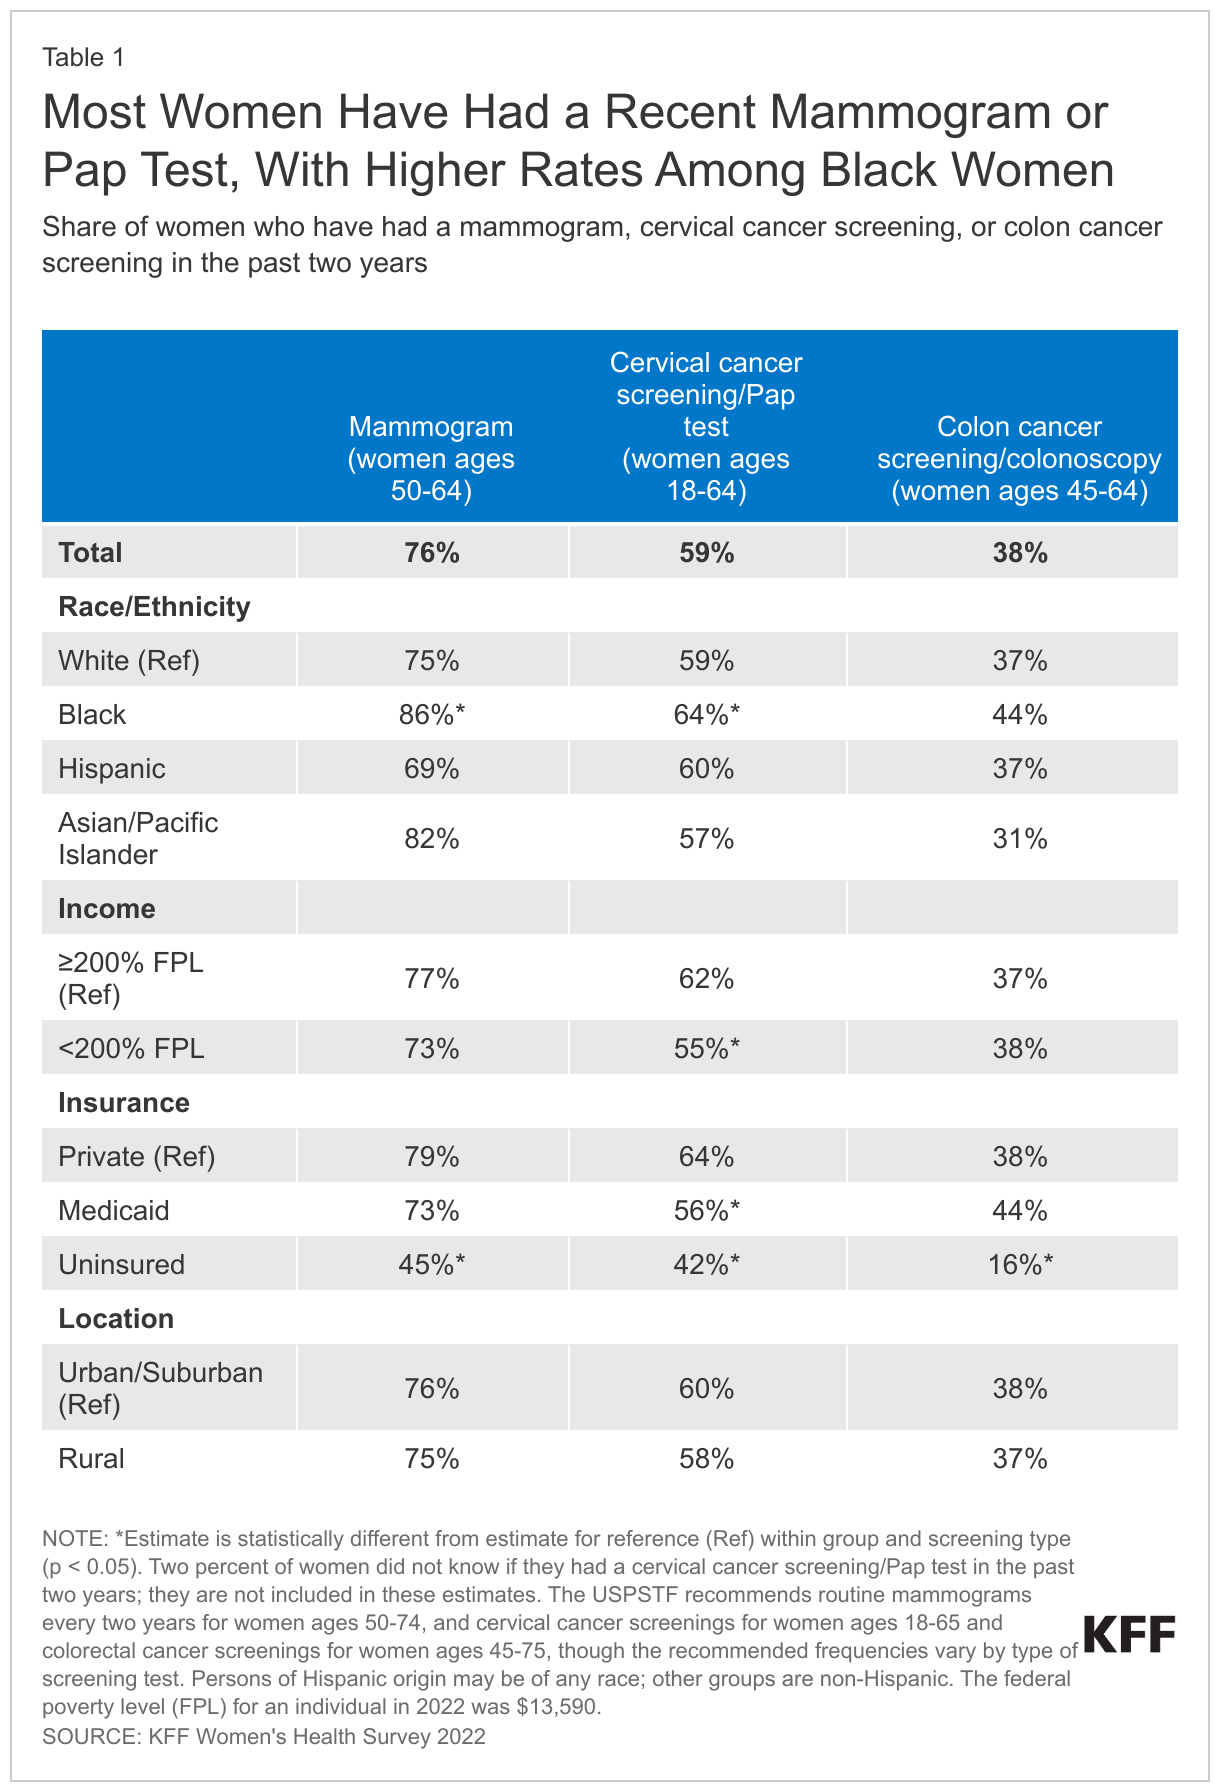
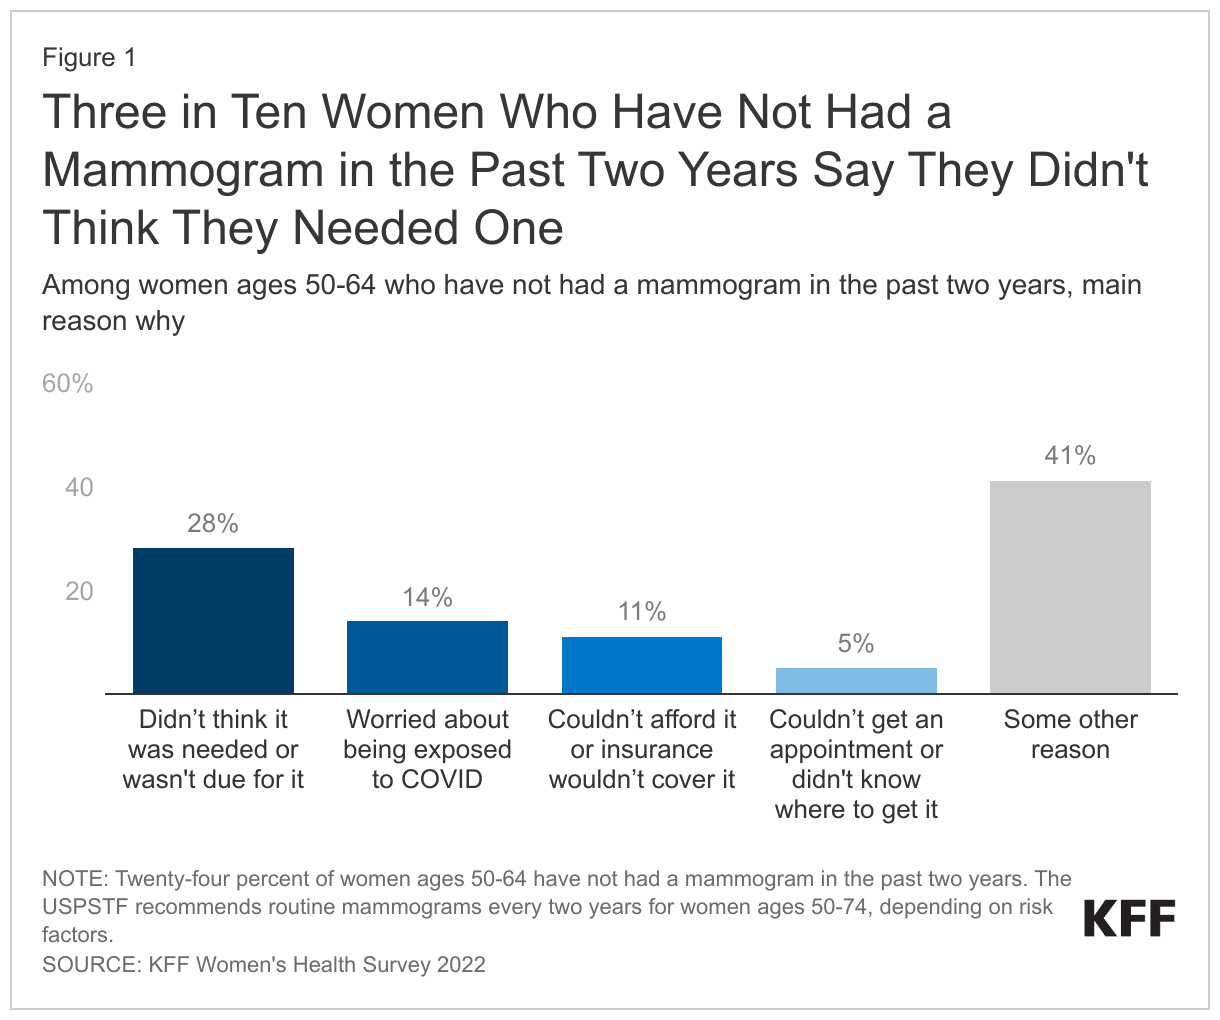
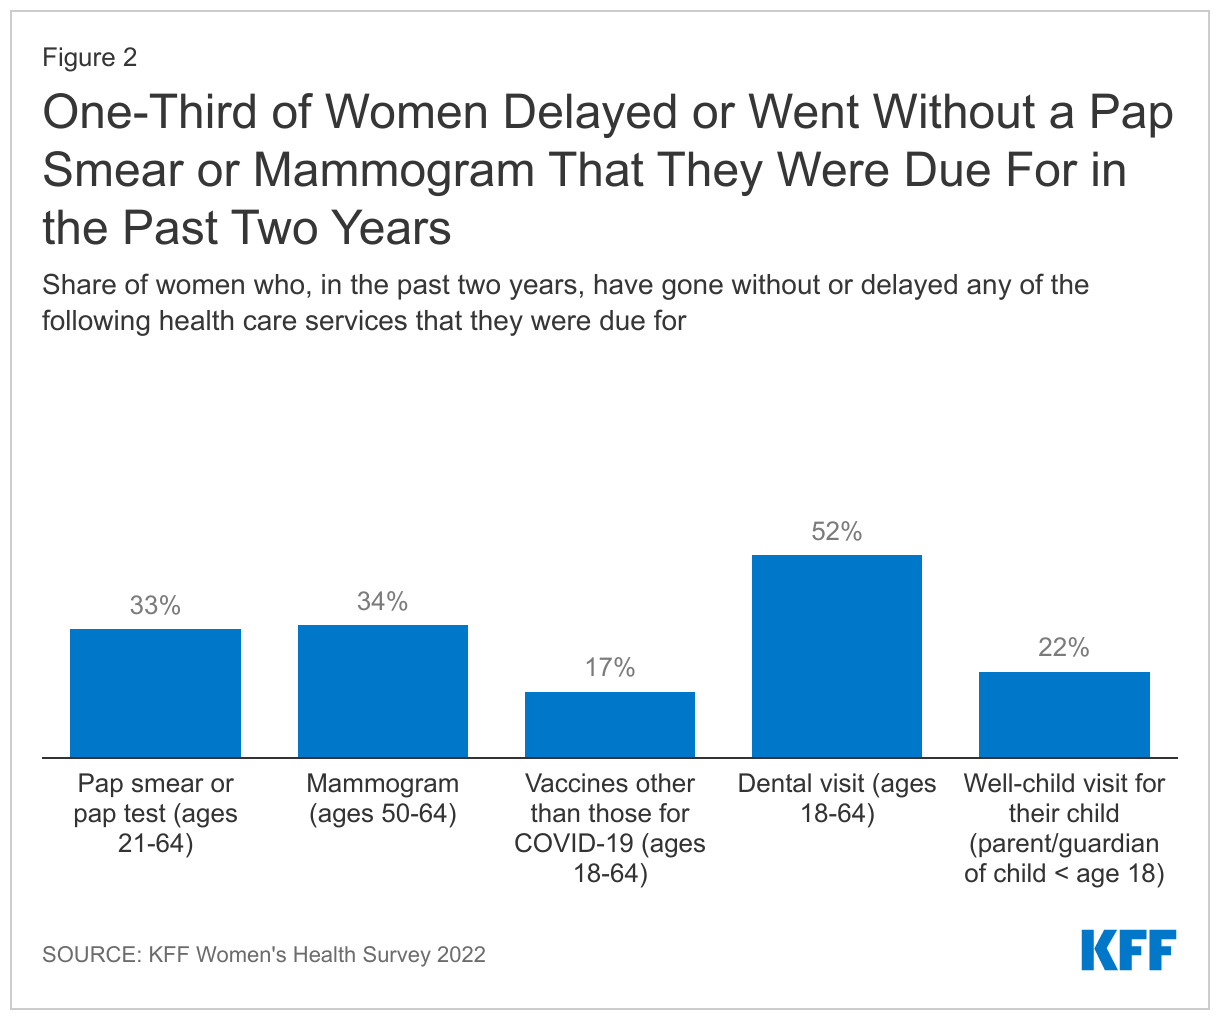
Rural Hospitals Face Renewed Financial Challenges, Especially in States That Have Not Expanded Medicaid

Published: Feb 23, 2023

Policymakers have had ongoing concerns about the financial health of rural hospitals and the implications  for access to care and the local economy. Rural hospital finances improved during the COVID-19 pandemic as a result of government relief funds. However, industry reports suggest that the outlook for the hospital sector as a whole deteriorated in 2022 as these funds have gone away and due to ongoing effects of the pandemic (such as labor shortages), rising prices, and investment losses. Concerns about the viability of rural hospitals have been cited as one factor that could potentially motivate lawmakers to expand Medicaid in the eleven states that have not already done so. These non-expansion states collectively account for about one-third (34%) of rural hospitals, based on our analysis of 2021 hospital cost report data.

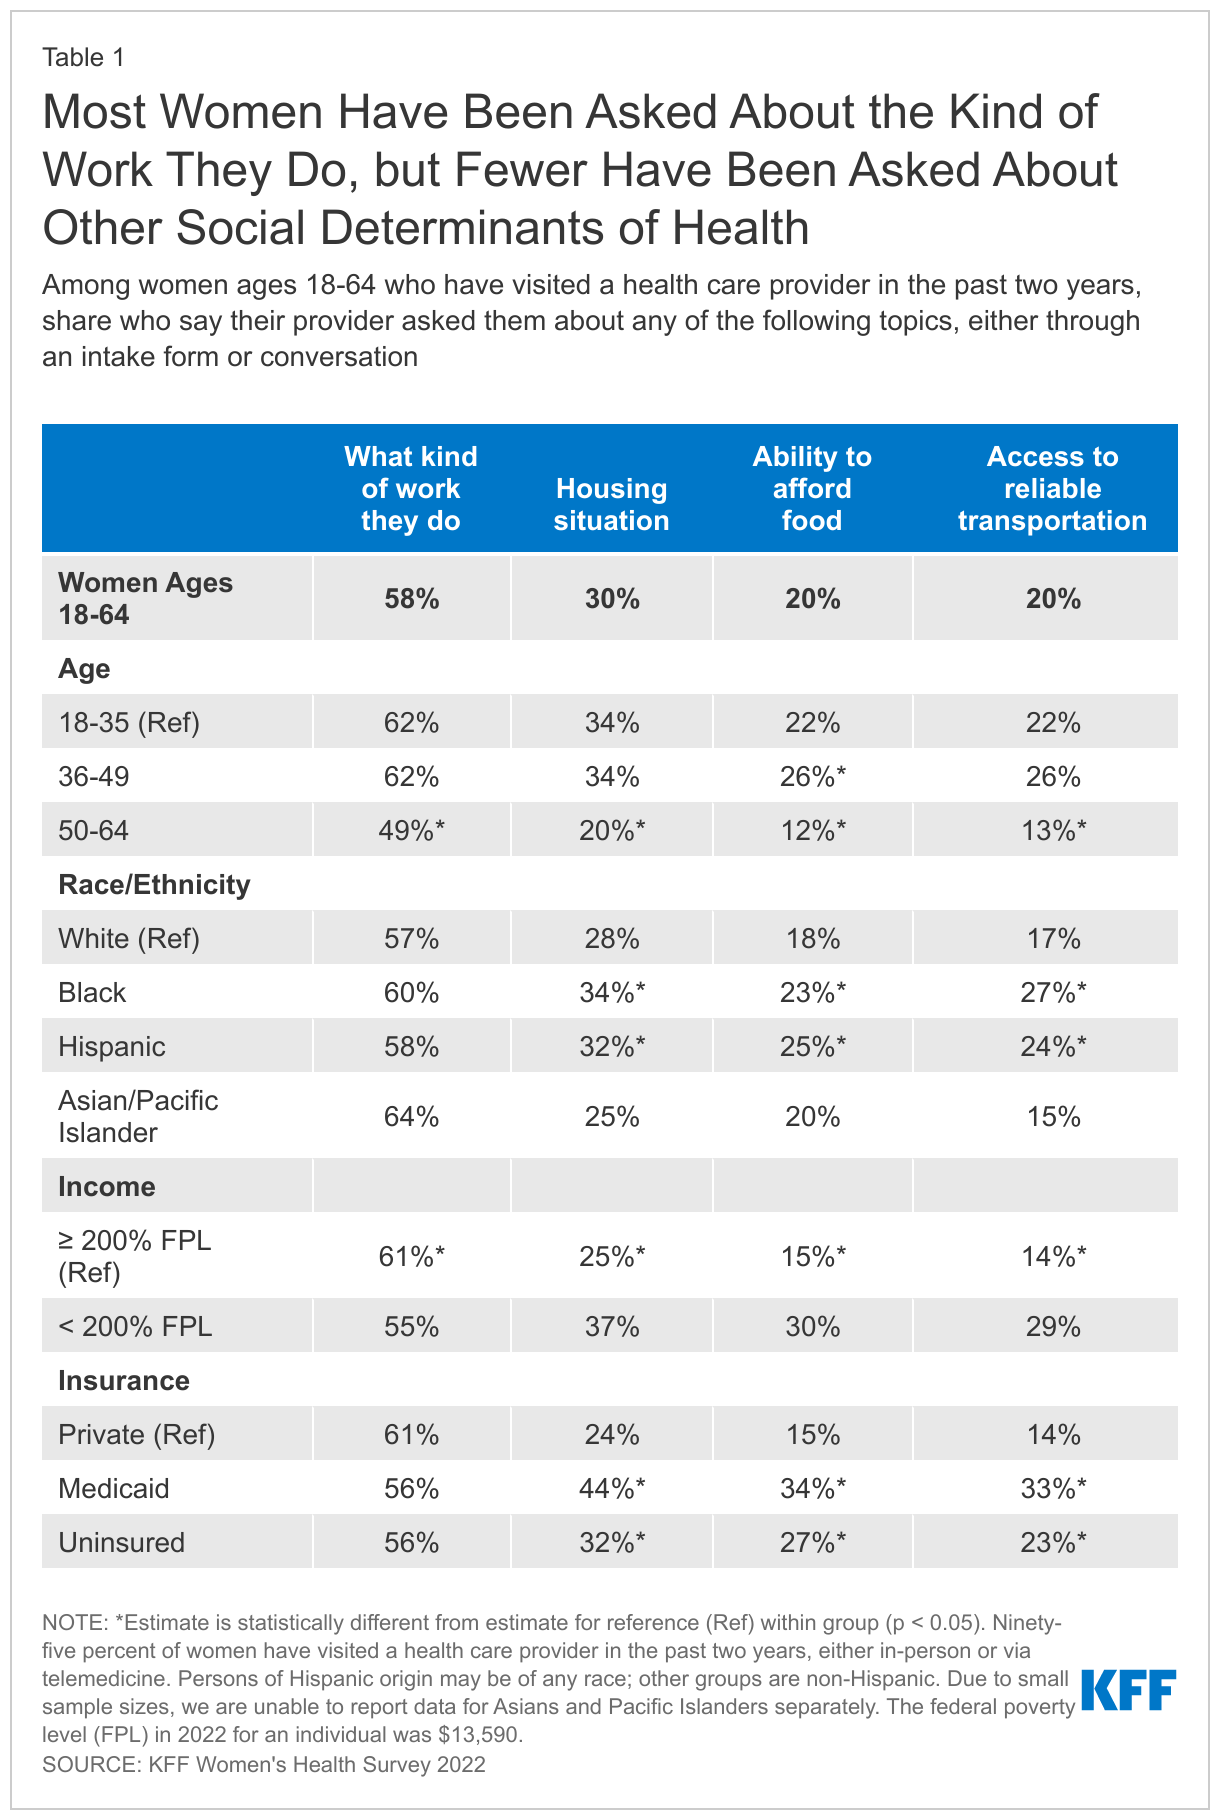
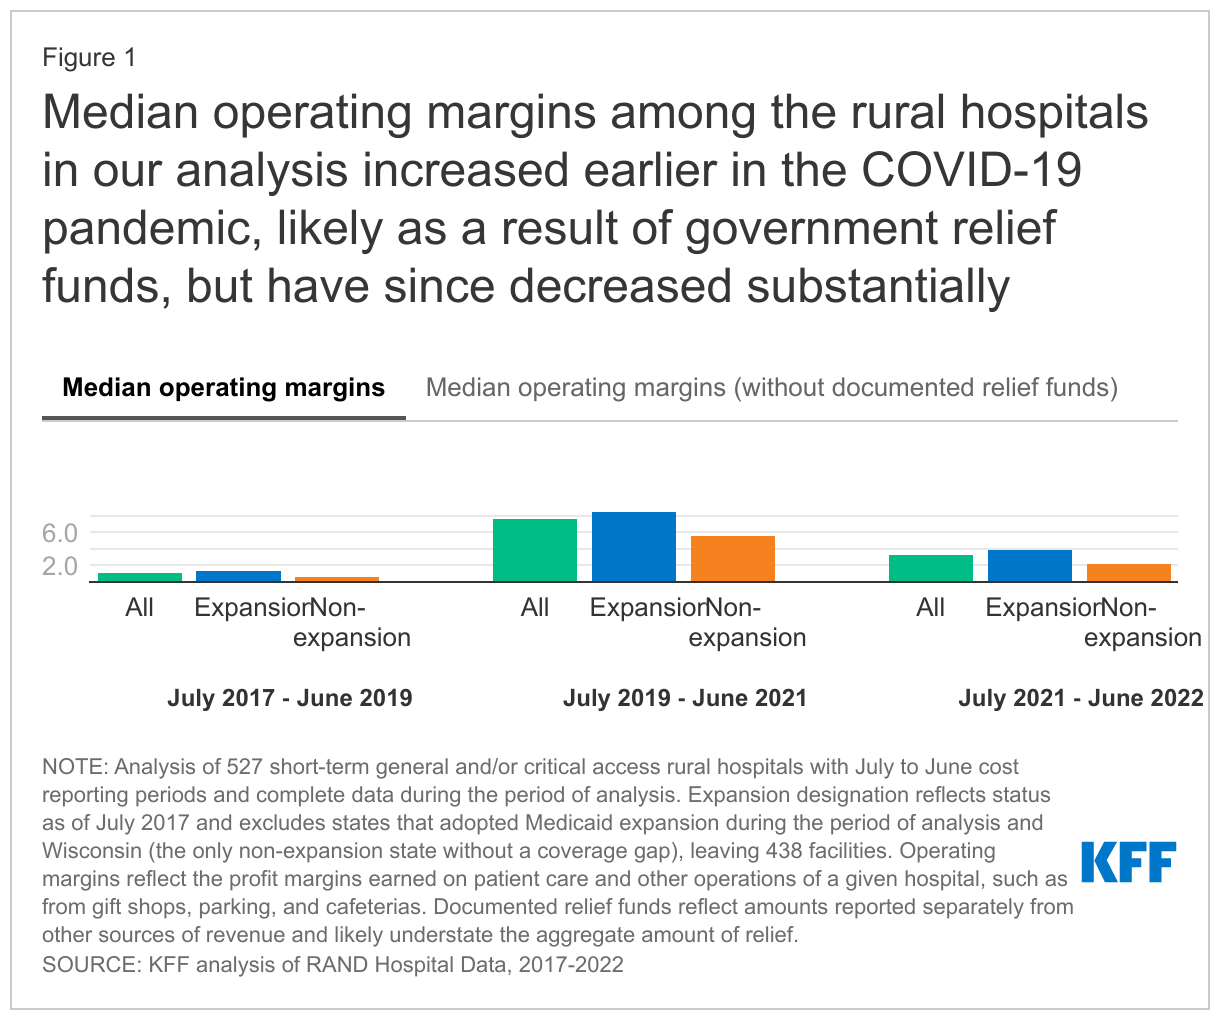
In this data note, we provide a background on rural hospital finances and use hospital cost report data to describe operating margins among rural hospitals before and during the COVID-19 pandemic (see Methods for details). We find that median operating margins among the rural hospitals in our analysis increased earlier in the COVID-19 pandemic, likely as a result of government relief funds, but that these facilities face renewed financial challenges, especially in states that have not expanded Medicaid (Figure 1). Among rural hospitals in non-expansion states, median operating margins were 2.1 percent during the July 2021-June 2022 period and were -0.7 percent when excluding documented relief funds. In Medicaid expansion states, median operating margins dropped, but remained positive even after excluding documented relief funds.

Median operating margins among the rural hospitals in our analysis increased earlier in the COVID-19 pandemic, likely as a result of government relief funds, but have since decreased substantially

Rural hospital finances leading into the pandemic

Rural hospitals have faced unique financial challenges that precede the COVID-19 pandemic. Among other challenges, rural hospitals tend to have low patient volumes—given that they serve small populations and residents increasingly travel to urban facilities to receive their care—which may lead to higher costs on average and may limit the ability of rural facilities to offer specialized services. From 2010 to 2019, 114 rural hospitals eliminated inpatient services or closed altogether, while others eliminated specific service lines, such as obstetric units. According to our analysis, in 2019, the year before the beginning of the COVID-19 pandemic, median operating margins were 1.5% among rural hospitals, compared to more than three-times that rate (5.2%) among other hospitals (data not shown).

Although rural hospitals face a common set of challenges, operating margins varied substantially across facilities. For example, we found that about two-fifths (41%) of rural hospitals had negative operating margins in 2019, though about one-third (32%) had operating margins at or above 5.0% in the same year (data not shown). One previous study found that median margins on patient care are greater among large versus small rural hospitals, though another analysis found that closures were less likely among Critical Access Hospitals (rural facilities that are eligible for cost-based reimbursement from Medicare on the basis of having 25 or fewer acute inpatient beds and either meeting distance requirements from the nearest hospital or being deemed a necessary provider by the state prior to 2006). The latter study also found that closures were more likely among for-profit hospitals, Medicare Dependent Hospitals (rural facilities that are eligible for greater Medicare reimbursement on the basis of having high Medicare inpatient shares and 100 or fewer beds), hospitals in the South, and hospitals in states that have not expanded Medicaid.

Median operating margins among rural hospitals were higher in expansion than non-expansion states in 2019 (2.0% versus 0.3%) based on our analysis (data not shown), which is consistent with research suggesting that expanding Medicaid has improved the financial performance of hospitals. The Affordable Care Act (ACA) expanded Medicaid coverage for most low-income adults to 138% of the federal poverty level, though a June 2012 Supreme Court decision effectively allowed states to decide whether to adopt the Medicaid expansion. Currently, eleven states have not expanded Medicaid, and they are largely in the South. Previous research has found that Medicaid expansion has resulted in decreases in uncompensated care, increases in operating margins, and decreases in closures of hospitals and obstetric units. Medicaid expansion improves hospital finances by extending coverage to uninsured patients who would otherwise qualify for hospital charity care or be unable to pay their bills. Among studies that have evaluated the effect of Medicaid expansion on urban and rural hospitals separately, most reported that improvements in financial performance have been concentrated among rural hospitals. Although research suggests that expanding Medicaid has improved the financial performance of rural hospitals, it may not be a panacea. For instance, while median operating margins among rural hospitals were higher in expansion than non-expansion states in 2019 (2.0% versus 0.3%), they were still lower than median operating margins among non-rural hospitals in expansion states (4.2%) (data not shown).

The financial performance of rural hospitals improved substantially early in the pandemic, likely as a result of government relief funds. Median operating margin among rural hospitals increased from 1.0% during July 2017-June 2019 to 7.7% during July 2019-June 2021 based on our analysis of a subset of hospitals (see Methods for details). Rural hospital closures had been increasing since 2017 before peaking at 19 closures in 2020 (the largest number since at least 2005) and then dropping to 2 closures in 2021 (the smallest number since at least 2005).

The large improvement in the financial performance of rural hospitals likely reflects the receipt of government relief funds, including dollars that were targeted specifically towards rural hospitals. Subtracting out relief funds documented in hospital cost reports lowers median operating margins during July 2019-June 2021 from 7.7% to 3.9%, according to our analysis. It appears that some hospitals did not separately or completely report relief funds, meaning that our estimates may overstate what operating margins would have been in the absence of relief funds, and potentially substantially so. In other words, relief funds likely played an even more substantial role in supporting rural hospital operating margins than suggested by our analysis.

Rural hospitals now face renewed financial challenges. After increasing substantially earlier in pandemic, median operating margins among the rural hospitals in our analysis fell from 7.7% in July 2019-June 2022 to 3.3% in the July 2021-June 2022 period. When subtracting out relief funds documented in hospital cost reports, median operating margins were slightly lower than pre-pandemic levels during the July 2021-June 2022 period and would likely have been even lower if accounting for relief funds that were not specifically documented by hospitals. Industry reports suggest that the outlook for hospitals and health systems deteriorated in 2022, which is only partially reflected in our analysis of July 2021-June 2022 data. In this context, it is not clear whether hospital closures may reemerge as an issue facing rural communities. There were seven hospital closures in 2022, which was greater than the number in 2021 (2 closures), but still less than the average number from 2005-2022 (10.3).

Median operating margins among rural hospitals were lower in non-expansion states than in expansion states in each period of our analysis, leaving these facilities in weaker financial standing to confront the challenges that have faced the hospital sector in recent months. For example, during the July 2021-June 2022 period, median operating margins among rural hospitals in our analysis fell to 2.1% in non-expansion states (compared to 3.9% in expansion states) and -0.7% when subtracting out documented relief funds (compared to 1.2% in expansion states).

Looking ahead

There may be additional challenges for rural hospitals on the horizon. First, key sources of COVID-19 relief have been largely depleted. This includes Phase 4 Provider Relief Funds—which were intended to be greater for smaller providers—and American Rescue Plan (ARP) rural funds, both of which may have helped sustain rural hospitals during July 2021-June 2022. Second on March 31, 2023, a provision will end that has required states to keep people in Medicaid continually enrolled during the pandemic in exchange for enhanced federal matching funds. A KFF analysis estimated that between 5 and 14 million people could lose Medicaid enrollment as a result, which may increase uncompensated care costs for rural and other hospitals. Finally, the Biden administration has announced plans to end COVID-19 emergency declarations on May 11, 2023. This would eliminate numerous health care policies and regulations that could have implications for hospital finances, such as a 20 percent increase in the Medicare payment rate for hospitalized patients who are diagnosed with COVID-19.

Policymakers have implemented a number of initiatives that are intended to support rural hospitals or restructure the rural health care delivery system. For example, in December 2022, Congress passed an omnibus spending bill that included a two-year extension of Medicare payment adjustments targeted towards rural hospitals. The federal government also recently implemented a new payment model, the Rural Emergency Hospital designation, which provides additional resources intended to sustain emergency and outpatient services at facilities that may no longer be able to support inpatient care. Finally, the Center for Medicare & Medicaid Innovation (CMMI) is testing the Pennsylvania Rural Health Model which provides rural hospitals with an all-payer global budget and is intended to reduce costs, increase quality, and improve the sustainability of rural hospital finances.

It is unclear whether current policy initiatives will be sufficient to sustain access to care in rural areas, especially in states that have not expanded Medicaid, where hospitals are facing greater financial challenges.

Methods

Our analysis is based on RAND Hospital Data, which is a cleaned and processed version of annual cost report data submitted by hospitals to the Healthcare Cost Report Information System (HCRIS). Every Medicare-certified hospital must submit a cost report, meaning that HCRIS data encompass all US hospitals except federal hospitals and some children’s hospitals. We conducted additional data cleaning, assigned cost report data to years based on the reporting period end date (which varies across facilities), and focused on short-term general and/or critical access hospitals. We identified rural areas based on a definition from the Federal Office of Rural Health Policy, which the Health Resources & Services Administration (HRSA) uses to determine eligibility for Rural Health Grants.

Operating margins reflect the profit margins earned on patient care and other operations of a given hospital, such as from gift shops, parking, and cafeterias. They are calculated by dividing the difference between operating revenues and expenses (also known as “net operating income”) by operating revenues. We excluded investment income and charitable contributions from operating revenues but included government appropriations, which may be critical for sustaining the operations of some hospitals.

We defined expansion and non-expansion states differently based on the period of analysis. When analyzing 2019 data, we defined expansion states to include all states that had expanded Medicaid through that year (including Virginia, which did so on January 1, and Maine, which did so on January 10, with coverage retroactive to July 2, 2018). We defined all remaining states as non-expansion states, except for Wisconsin, which covers individuals up to 100 percent of the federal poverty level and therefore does not have a coverage gap. We began with the same set of states when analyzing July 2017-June 2022 data but excluded seven states that expanded during that period (Idaho, Maine, Missouri, Nebraska, Oklahoma, Utah, and Virginia). All analyses included South Dakota as a non-expansion state, given that it expanded Medicaid after our period of analysis.

Our analysis of 2019 data included 2,117 rural hospitals and 2,179 urban hospitals and our analysis of trends included 527 rural hospitals, i.e., 25% of all rural hospitals with 2019 data. When evaluating operating margins by expansion status, we excluded hospitals from some states (as described above), leaving 2019 data for 1,201 and 845 hospitals from expansion and non-expansion states, respectively, and trend data for 305 and 133 hospitals, respectively. For our trend analysis, we focused on rural hospitals with July to June reporting periods, given that this was the second-most common reporting period and, as of February 2023, RAND Hospital Data from 2022 were rarely available for the most common reporting period (January to December).  We also focused on hospitals with complete data from June 2017-June 2022. We found similar patterns (but different operating margins) when evaluating the much larger group of hospitals with complete 2018-2021 data (1,938 facilities or about 92% of all rural hospitals with 2019 data). Among those hospitals, operating margins increased from 1.2% in 2018-2019 to 7.7% in 2020-2021 (or 2.4% when excluding documented relief funds).  Among the hospitals in our trend analysis, operating margins increased from 1.0% in 2018-2019 to 7.7% in 2020-2021 (or 3.9% when excluding documented relief funds). Median operating margins were also higher among hospitals in expansion versus non-expansion states during the 2018-2019 and 2020-2021 periods when evaluating the larger group of hospitals with complete 2018-2021 data. The magnitude of this difference during the 2020-2021 period was smaller overall (8.3% among expansion states versus 6.5% among non-expansion states compared to 8.5% versus 5.6% in our trend analysis) but larger after removing documented relief funds (3.5% versus 0.0% compared to 4.9% versus 2.6% in our trend analysis).

This work was supported in part by Arnold Ventures. KFF maintains full editorial control over all of its policy analysis, polling, and journalism activities.

News Release

New KFF Trackers Document State and Federal Reproductive Rights Litigation Across the Country

Published: Feb 23, 2023

KFF has created two new trackers to follow swift-moving reproductive rights litigation in the state and federal courts. The tools, which are currently tracking the status of 21 state cases in 15 states and eight federal cases, will be updated regularly as the litigation proceeds.

Major cases pending in federal and state courts could impact access to abortion and contraceptive care for millions across the US. In fact, a federal district court is considering a case that holds the future of medication abortion nationwide in the balance and the Department of Health and Human Services has appealed a case that has blocked contraceptive access without parental consent for teens in Texas. In addition, abortion bans in 14 states have been challenged in 20 ongoing cases in state courts.

Use the state tracker to follow the progression of each state case in the context of whether state abortion bans are in effect. Explore the federal tracker to keep up with litigation in federal courts that involves access to contraception and abortion, including the federal regulations or policies being challenged and the bases for the challenges.

A Look at Recent Medicaid Guidance to Address Social Determinants of Health and Health-Related Social Needs

Published: Feb 22, 2023

While there are limits, states can use Medicaid to address social determinants of health (SDOH), or associated health-related social needs. Health-related social needs (HRSN) are an individual’s unmet, adverse social conditions (e.g., housing instability, homelessness, nutrition insecurity) that contribute to poor health and are a result of underlying social determinants of health (conditions in which people are born, grow, work, and age). To expand opportunities for states to use Medicaid to address health-related social needs, CMS recently issued new guidance that builds on guidance released in 2021. This guidance supports the current Administration’s goal to advance health equity as well as end hunger by 2030 and stem increases in homelessness during the COVID-19 pandemic. This policy watch discusses the new opportunities available to states to address HRSN through managed care and through Section 1115 demonstration waivers.

How can states use managed care to address HRSN?

In January 2023 CMS released guidance that paves the way for interested states to allow Medicaid managed care plans to offer services, like housing and nutrition supports, as substitutes for standard Medicaid benefits (referred to as “in lieu of” services (or ILOS)). Under federal rules, states may allow Medicaid managed care organizations (MCOs) the option to offer services or settings that substitute for standard Medicaid benefits, if the substitute service is medically appropriate and cost-effective. For example, a state could authorize in-home prenatal visits for at-risk pregnant beneficiaries as an alternative to traditional office visits. These alternative services must be voluntary for the MCO (to offer) and for the beneficiary (to receive). Costs of the ILOS are built into managed care rates. The new guidance establishes financial guardrails and new requirements for ILOS and clarifies these substitute services can be preventive in nature instead of an immediate substitute (e.g., providing a dehumidifier to an individual with asthma before emergency care is needed). The share of total managed care payments spent on ILOS should not exceed 5%.

This guidance follows the approval of a California proposal to use ILOS to offer a range of health-related services through managed care. Managed care plans provide enhanced care management and “community supports” to targeted high-need beneficiaries. Community supports address social drivers of health and build on and scale work from previous pilot programs and waivers. Service examples include housing transition and navigation services, housing deposits, housing sustaining services (e.g., landlord coordination, assistance with housing recertification), home modifications, medically tailored meals, asthma remediation, and sobering centers.

How can states address HRSN through 1115 waivers?

In December 2022, CMS presented guidance about how states can address HRSN through Section 1115 demonstration waivers. HRSN services that will be considered under the new framework include housing supports, nutrition supports, and HRSN case management (and other services on a case-by-case basis). Under Section 1115, states may have more flexibility to define target populations and services compared to the ILOS option (e.g., states cannot cover rent/temporary housing under ILOS) as well as the ability to add the services to the benefit package and require that plans must offer the services to eligible enrollees. HRSN services must be medically appropriate (using state-defined clinical and social risk factors) and be the choice of the beneficiary. The new CMS guidance specifies spending for HRSN cannot exceed 3% of total annual Medicaid spend. State spending on related social services (before the waiver) must be maintained or increased. To strengthen access, in some cases, states must also meet minimum provider payment rate requirements (for primary care, behavioral health, and OB/gyn services). CMS indicates HRSN spending will not require offsetting savings (that may otherwise be required for services authorized/financed under Section 1115). Although states may gain some flexibility under Section 1115 authority not available under ILOS, 1115 waivers often involve long and complex negotiations between states and CMS and changes in Administration can affect the approval and direction of these waivers.

This guidance follows the approval of waivers in four states (Arizona, Arkansas, Massachusetts, and Oregon) that authorize evidence-based HRSN services to address food insecurity and/or housing instability for specific high-need populations. CMS approved Medicaid coverage of rent/temporary housing for up to 6 months for certain high-need individuals as well as other new/unique housing and nutrition supports (e.g., meal support, including for a household with a child or pregnant woman identified as high risk). CMS also approved federal expenditures to build the capacity of community-based, non-traditional HRSN service providers, that may require technical assistance and infrastructure support to become Medicaid providers.

What to watch?

Going forward, it will be important to follow how HRSN initiatives are funded, implemented, and measured in terms of outcomes. While health programs like Medicaid can play a supporting role, these initiatives are not designed to replace other federal, state, and local social service programs but rather to complement and coordinate with these efforts. The new guidance released by CMS expands opportunities for states to cover HRSN without seeking an 1115 demonstration waiver. While optional for plans to provide HRSN ILOS, the guidance creates a new pathway for states to finance HRSN services on an ongoing basis through managed care. For states pursuing the ILOS option, areas to watch include which health-related services states gain approval to integrate under managed care authority and whether / how many managed care plans opt to offer optional HRSN services. Under Section 1115, areas to watch include which HRSN services states obtain approval for, how states define target populations, as well as how states demonstrate compliance with accompanying Section 1115 requirements (e.g., maintaining state spending on related social services, meeting minimum provider payment rate requirements). Across initiatives/authorities, it will be important to track how states and plans work with community-based organizations and coordinate with relevant state and local agencies and to follow state and federal efforts to monitor and evaluate HRSN programs, including the utilization of HRSN services and the impact of these initiatives on health outcomes and Medicaid spending. Whether states are able to sustain funding streams for HRSN longer term and how future changes in Administration may affect the ability to pursue these initiatives through waivers will be important to watch.

Women’s Experiences with Provider Communication and Interactions in Health Care Settings: Findings from the 2022 KFF Women’s Health Survey

Published: Feb 22, 2023

Issue Brief

Introduction

Women’s health outcomes are shaped not only by access to care, health insurance, and affordability, but also by the social and economic factors that drive health, discrimination, and experiences within the health care system, which have become a larger focus in providing equitable health care in recent years. One of the Institute of Medicine’s six domains of healthcare quality is patient-centered care: providing care that is respectful of and responsive to individual patient preferences, needs, and values and ensuring that patient values guide all clinical decisions. Measures of patient experience and Consumer Assessment of Healthcare Providers and Systems (CAHPS) Surveys have also become more widely used among health care organizations and clinics interested in assessing the patient-centeredness of the care they deliver and areas of improvement. in the health care system, which have become a larger focus in providing equitable health care in recent years.

This brief presents findings from the 2022 KFF Women’s Health Survey (WHS) on women’s experiences with the health care system including screening for social determinants of health, provider communication and interactions, and discrimination. The KFF WHS is a nationally representative survey of 5,145 self-identified women ages 18 to 64, conducted May 10 – June 7, 2022. See the Methodology section for more details.

Summary of Findings

  • Among women ages 18-64 who have seen a health care provider in the past two years:
    • Twenty-nine percent report that their doctor had dismissed their concerns in that time period, 15% reported that a provider did not believe they were telling the truth, 19% say their doctor assumed something about them without asking, and 13% say that a provider suggested they were personally to blame for a health problem. A higher share of women (38%) than men (32%) report having had at least one of these negative experiences with a health care provider.
    • One in ten (9%) women ages 18-64 say that they have experienced discrimination because of their age, gender, race, sexual orientation, religion, or some other personal characteristic during a health care visit in the past two years.
    • Few women report being asked about social and economic factors that may influence health. While 58% report that in the past two years their provider asked them about what kind of work they do, far fewer report having been asked about their housing situation (30%), their ability to afford food (20%), or access to reliable transportation (20%). Women with Medicaid and those with low incomes are more likely to say they have been asked about these last three indicators than women with private insurance and those with higher incomes.
  • Communication is an important component of health care quality; however, 21% of women (including 38% of uninsured women), say it is difficult to find a doctor who explains things in a way that is easy to understand.
  • Just over one-third (35%) of women ages 40-64 say their health care provider ever talked to them about what to expect in menopause.

Screening for Social Determinants of Health

In recent years, the social determinants of health have been recognized as critical factors that shape health outcomes. These factors include housing, transportation, nutrition, and financial well-being. Although there are no formal recommendations for routine screening for social determinants of health, a recent review conducted for the U.S. Preventive Services Task Force found that screening for risk factors including housing, food security, and transportation shows positive effects on health outcomes. In fact, six health professional organizations specifically encourage social risk screening and referrals in clinical settings (American Academy of Family Physicians, American Academy of Pediatrics, American College of Obstetricians and Gynecologists, American College of Physicians, American Diabetes Association, and American Osteopathic Association).

HRSA-funded federally qualified health centers (FQHCs), which provide primary care services in underserved areas, must report whether they screen patients for social risk factors and if so, the total number of patients that screened positive for food insecurity, housing insecurity, financial strain, and lack of transportation/access to public transportation. One study found that the majority of FQHCs collected this type of information, but some evidence suggests these screenings may be less common in other health care settings. Medicaid contracts are also increasingly requiring managed care plans to screen for the social determinants of health and many plans report being engaged in activities to address enrollees’ social needs.

Nearly three in five (58%) women who have visited a doctor in the past two years say they were asked about the kind of work they do, but only one in five were asked about their ability to afford food (20%) or access to reliable transportation (20%).

Fifty-eight percent of women who have seen a health care provider in the past two years report that their provider asked about what kind of work they do in the past two years (Table 1).

Most Women Have Been Asked About the Kind of Work They Do, but Fewer Have Been Asked About Other Social Determinants of Health

Three in ten (30%) women who have seen a health care provider in the past two years report having been asked about their housing situation, with higher shares among uninsured women (32%), women with Medicaid coverage (44%), and women with low incomes (37%).

Fewer women report that their provider asked them about their ability to afford food (20%) or access to reliable transportation (20%). A larger share of uninsured women (27% and 23%, respectively) and women with Medicaid (34% and 33%, respectively) say they were asked about these two topics than women with private insurance (15% and 14%, respectively).

Black and Hispanic women are more likely than White women to say they were asked about their housing situation, ability to afford food, and access to reliable transportation. Women ages 18-35 are more likely than women ages 50-64 to say they have been asked about all of these topics by their provider in the past two years.

A higher share of women in 2022 say that in the past two years their health care provider asked them about their housing, ability to afford food, and access to transportation than did in 2020 (19%, 13%, and 13%, respectively).

Provider Communication

Communication is an important component of health care quality but one in five (21%) women say it is difficult to find a doctor who explains things in a way that is easy to understand.

Approximately one in four younger women (23%), women with a high school degree or less (23%), Hispanic women (24%), and women with low incomes (26%) have found it difficult to find a doctor who explains things in a way that is easy to understand (Figure 1). This share was highest among uninsured women, where more than one-third (36%) say it is difficult. These findings could reflect language barriers experienced by people with limited English proficiency, and difficulties faced by people with lower health literacy.

Large Shares of Hispanic, Low-income, and Uninsured Women Say it is Difficult to Find a Doctor who Provides Clear Explanations

Menopause is a topic that has received little attention and there is a lack of information about what to expect during menopause.

One aspect of women’s health that is often not discussed with clinicians is menopause and what women can expect during this transition. Just over one-third (35%) of women ages 40-64 say their health care provider ever talked to them about what to expect in menopause (Figure 2), with wide variation by current menstrual status. Forty-two percent of women who have gone through menopause, 39% of those currently going through menopause, and 19% of premenopausal women say a provider has ever talked to them about what to expect in menopause. Providing information about what to expect during menopause can ease women’s concerns about the changes they may experience after their reproductive years and offer women options for clinical interventions.

Just Four in Ten Perimenopausal Women Say a Health Care Provider Talked to Them About What to Expect in Menopause

Provider Interactions

Women are more likely than men to report experiencing certain negative provider interactions.

Negative interactions within the health care system can contribute to poorer health outcomes, distrust of the health care system, and health inequities. Among women and men ages 18-64 who have visited a health care provider in the past two years, 29% of women ages 18-64 report that their doctor had dismissed their concerns during that time, compared to 21% of men (Figure 3). Fifteen percent of women said they have had a provider not believe they were telling the truth, compared to 12% of men. Nine percent of women who have visited a health care provider in the past two years said they had experienced discrimination because of their age, gender, race, sexual orientation, religion, or some other personal characteristic, compared to 5% of men.

A similar share of women (19%) and men (16%) who have been to a doctor in the past two years say their doctor assumed something about them without asking in the past two years. The same share of women and men say that a provider suggested they were personally to blame for a health problem (13%). Overall, a higher share of women than men say they have had at least one of these experiences in the past two years (38% vs. 32%).

More Women Than Men Report Having Had a Negative Interaction with a Health Care Provider in the Past Two Years

Among women who have visited a health care provider in the past two years, larger shares of those who are covered by Medicaid or uninsured, or who have low incomes, or a disability or ongoing health condition report having had each of these four negative experiences with their provider during that time period.

Thirty-six percent of women with a disability or ongoing health condition report that a health care provider had dismissed their concerns in the past two years compared to 22% of women who do not (Table 2). A higher share of Black women (18%) who have seen a provider in the past two years say that their provider did not believe they were telling the truth than White women (15%), and a higher share of White women than Asian/Pacific Islander (7%) women say the same. More than four in ten women ages 18-35 (46%), uninsured (46%), with Medicaid coverage (44%), or with a disability or ongoing health condition (45%) who have been to a doctor in the past two years report having had at least one of these interactions.

The impacts of bias, racism, and discrimination in health care has garnered increased attention in recent years and is recognized as having detrimental effects on women’s health. Some women report experiencing discrimination at higher rates than others. Twice as many women (10%) ages 18-49 say they have experienced discrimination during a health care visit as women ages 50-64 (5%) (Table 2). A larger share of Black women ages 18-64 who have visited a health care provider in the past two years reports experiencing discrimination than White women (13% vs. 7%). Women with low incomes and those with Medicaid or who are uninsured also report experiencing discrimination because of their age, gender, race, sexual orientation, religion, or some other personal characteristic at higher rates than their counterparts.

Our discrimination survey question aims to understand people’s perceptions of various actions and experiences as discrimination. Whereas some other surveys have asked respondents about experiencing “unfair treatment” in a variety of different settings or in general, our survey takes a different approach by asking one specific question about perceived discrimination in the context of a health care visit in the past two years. People may experience different types of unfair treatment but not necessarily describe it as discrimination. As a result, surveys that ask about unfair treatment more broadly tend to have higher shares of respondents who say they have experienced that.

Low-Income Women More Likely Than Their Counterparts to Say Their Health Care Provider Didn’t Believe They Were Telling the Truth

Conclusion

The role of social determinants on health outcomes has garnered increased recognition in recent years. Providers are increasingly discussing factors with their patients that shape access to health care and health outcomes such as food insecurity and transportation challenges, although ensuring providers have resources with which to connect patients to address these social determinants is still a challenge. Gender bias and racial discrimination in the health care system can contribute to health disparities and poorer health outcomes. Women are more likely than men to report having experienced some type of health care bias, particularly those who are in poorer health, younger, or have low incomes.

Efforts to improve provider communication and interactions and address discrimination could improve women’s experiences with the health care system, alleviate some of the barriers many women still experience when they seek care, and reduce health disparities.

Methodology

Overview

The 2022 KFF Women’s Health Survey is a nationally representative survey of 6,442 people ages 18 to 64, including 5,201 females (self-reported sex at birth) and 1,241 males, conducted from May 10, 2022, to June 7, 2022. The objective of the survey is to help better understand respondents’ experiences with contraception, potential barriers to health care access, and other issues related to reproductive health. The survey was designed and analyzed by researchers at KFF (Kaiser Family Foundation) and fielded online and by telephone by SSRS using its Opinion Panel, supplemented with sample from IPSOS’s KnowledgePanel.

Questionnaire design

KFF developed the survey instrument with SSRS feedback regarding question wording, order, clarity, and other issues pertaining to questionnaire quality. The survey was conducted in English and Spanish. The survey instrument is available upon request.

Sample design

The majority of respondents completed the survey using the SSRS Opinion Panel (n=5,202), a nationally representative probability-based panel where panel members are recruited in one of two ways: (1) through invitations mailed to respondents randomly sampled from an Address-Based Sample (ABS) provided by Marketing Systems Group through the U.S. Postal Service’s Computerized Delivery Sequence. (2) from a dual-framed random digit dial (RDD) sample provided by Marketing Systems Group.

In order to have large enough sample sizes for certain subgroups (females ages 18 to 35, particularly females in the following subgroups: lesbian/gay/bisexual; Asian; Black; Hispanic; Medicaid enrollees; low-income; and rural), an additional 1,240 surveys were conducted using the IPSOS KnowledgePanel, a nationally representative probability-based panel recruited using a stratified ABS design. (Note that due to small sample sizes, data for Asians are combined with data for Pacific Islanders for this survey.)

Data collection

Web Administration Procedures

The majority of surveys completed using the SSRS Opinion Panel (n=5,056) and all of the surveys completed using the KnowledgePanel (n=1,240) were self-administered web surveys. Panelists were emailed an invitation, which included a unique passcode-embedded link, to complete the survey online. In appreciation for their participation, panelists received a modest incentive in the form of a $5 or $10 electronic gift card. All respondents who did not respond to their first invitation received up to five reminder emails and panelists who had opted into receiving text messages from the SSRS Opinion Panel received text message reminders.

Overall, the median length of the web surveys was 13 minutes.

Phone Administration Procedures

In addition to the self-administered web survey, n=146 surveys were completed by telephone with SSRS Opinion Panelists who are web reluctant. Overall, the median length of the phone surveys was 28 minutes.

Data processing and integration

SSRS implemented several quality assurance procedures in data file preparation and processing. Prior to launching data collection, extensive testing of the survey was completed to ensure it was working as anticipated. After the soft launch, survey data were carefully checked for accuracy, completeness, and non-response to specific questions so that any issues could be identified and resolved prior to the full launch.

The data file programmer implemented a “data cleaning” procedure in which web survey skip patterns were created in order to ensure that all questions had the appropriate numbers of cases. This procedure involved a check of raw data by a program that consisted of instructions derived from the skip patterns designated on the questionnaire. The program confirmed that data were consistent with the definitions of codes and ranges and matched the appropriate bases of all questions. The SSRS team also reviewed preliminary SPSS files and conducted an independent check of all created variables to ensure that all variables were accurately constructed.

As a standard practice, quality checks were incorporated into the survey. Quality control checks for this study included a review of “speeders,” reviewing the internal response rate (number of questions answered divided by the number of questions asked) and open-ended questions. Among all respondents, the vast majority (97%) answered 96% or more of the survey questions they received, with no one completing less than 91% of the administered survey (respondents were informed at the start of the survey that they could skip any question).

Weighting

The data were weighted to represent U.S. adults ages 18 to 64. The data include oversamples of females ages 18 to 35 and females ages 36 to 64. Due to this oversampling, the data were classified into three subgroups: females 18 to 35, females 36 to 64, and males 18 to 64. The weighting consisted of two stages: 1) application of base weights and 2) calibration to population parameters. Each subgroup was calibrated separately, then the groups were put into their proper proportions relative to their size in the population.

Calibration to Population Benchmarks

The sample was balanced to match estimates of each of the three subgroups (females ages 18 to 35, females ages 36 to 64, and males ages 18 to 64) along the following dimensions: age; education (less than a high school graduate, high school graduate, some college, four-year college or more); region (Northeast, Midwest, South, West); and race/ethnicity (White non-Hispanic, Black non-Hispanic, Hispanic-born in U.S., Hispanic-born Outside the U.S., Asian non-Hispanic, Other non-Hispanic). The sample was weighted within race (White, non-Hispanic; Black, non-Hispanic; Hispanic; and Asian) to match population estimates. Benchmark distributions were derived from 2021 Current Population Survey (CPS) data.

Weighting summaries for females ages 18 to 35, females ages 36 to 64, and males ages 18 to 64 are available upon request.

Finally, the three weights were combined, and a final adjustment was made to match the groups to their proper proportions relative to their size in the population (Table 1).

Margin of Sampling Error

The margin of sampling error, including the design effect for subgroups, is presented in Table 2 below. It is important to remember that the sampling fluctuations captured in the margin of error are only one possible source of error in a survey estimate and there may be other unmeasured error in this or any other survey.

KFF Analysis

Researchers at KFF conducted further data analysis using the R survey package, including creating constructed variables, running additional testing for statistical significance, and coding responses to open-ended questions. The survey instrument is available upon request.

Rounding and sample size

Some figures in the report do not sum to totals due to rounding. Although overall totals are statistically valid, some breakdowns may not be available due to limited sample sizes or cell sizes. Where the unweighted sample size is less than 100 or where observations are less than 10, figures include the notation “NSD” (Not Sufficient Data).

Statistical significance

All statistical tests are performed at the .05 confidence level. Statistical tests for a given subgroup are tested against the reference group (Ref.) unless otherwise indicated. For example, White is the standard reference for race/ethnicity comparisons and private insurance is the standard reference for types of insurance coverage. Some breakouts by subsets have a large standard error, meaning that sometimes even large differences between estimates are not statistically different.

A note about sex and gender language

Our survey asked respondents which sex they were assigned at birth, on their original birth certificate (male or female). They were then asked what their current gender is (man, woman, transgender, non-binary, or other). Those who identified as transgender men are coded as men and transgender women are coded as women. While we attempted to be as inclusive as possible and recognize the importance of better understanding the health of non-cisgendered people, as is common in many nationally representative surveys, we did not have a sufficient sample size (n >= 100) to report gender breakouts other than men and women with confidence that they reflect the larger non-cisgender population as a whole. The data in our reproductive health reports use the respondent’s sex assigned at birth (inclusive of all genders) to account for reproductive health needs/capacity (e.g., ever been pregnant) while the data in our other survey reports use the respondent’s gender.

Many Women Use Preventive Services, but Gaps in Awareness of Insurance Coverage Requirements Persist: Findings from the 2022 KFF Women’s Health Survey

Published: Feb 22, 2023

Issue Brief

Updated July 19, 2023, to reflect the addition of data on receipt of cervical cancer screenings (Table 1) and STI and HIV tests (Table 2). 

Key Takeaways

  • Three in four (76%) women ages 50-64 report that they had a mammogram in the past two years, with higher shares of Black women (86%) and substantially lower shares of uninsured women (45%).
  • Forty-four percent of uninsured women ages 50-64 who have not had a mammogram in the past two years say this is because they could not afford one.
  • Six in ten (59%) women ages 18-64 report that they had a cervical cancer screening (Pap test) in the past two years, with higher shares among Black women (64%) and women with higher incomes (≥ 200% of the federal poverty level) (62%) or private insurance (64%) and lower shares of uninsured women (42%).
  • Thirty-eight percent of women ages 45-64 report having a colon cancer screening (colonoscopy) in the past two years, including slightly higher shares of Black women (44%) and women with Medicaid (44%) and a lower share of uninsured women (16%).
  • Many women ages 18-64 went without or delayed health care services they were due for in the past two years, most commonly for dental care (52%).
  • Few women ages 18-64 have had an STI test such as for chlamydia or herpes (28%) or an HIV test (25%) in the past two years, with considerably higher shares among women who are Black, LGBT+, or who have Medicaid.
  • The Affordable Care Act (ACA) requires most health insurance plans to cover birth control for women without cost sharing; however, more than four in ten (43%) women ages 18-64 are unaware of this coverage requirement. Smaller shares were unaware that an annual check-up for women (19%) and cervical cancer screenings (20%) are also required to be covered.
  • Women with higher incomes and those with higher educational attainment are more likely than women with lower incomes and less educational attainment to know that annual check-ups for women and cervical cancer screenings must be covered without cost sharing. Knowledge of no-cost coverage of birth control for women was similar across education levels.

Introduction

Evidence-based preventive services can improve health by identifying illnesses earlier, managing them more effectively, and treating them before they progress into more complicated and debilitating conditions. Since 2010, the Affordable Care Act (ACA) has required most private health insurance plans to cover a range of recommended preventive services for adults without any patient cost-sharing. Over the years, there have been numerous updates and additions to the range of services covered under this policy, and today the slate includes a number of cancer screenings, immunizations, and behavioral health services such as tobacco cessation and weight management services. Some services are specific to women, including annual checkups, prenatal tests, screening for intimate partner violence, and prescription contraceptive services. Despite the policy’s wide reach, there have been several legal challenges over elements of the preventive services requirement since it initially took effect, including in a pending case, Braidwood Management Inc. v. Becerra.

This data note presents findings from the 2022 KFF Women’s Health Survey (WHS) on women’s receipt of cancer screenings and other preventive services and differences between subgroups of women. We also present data on women’s and men’s awareness of federal requirements for private insurance coverage of preventive services. The KFF WHS is a nationally representative survey of 5,145 self-identified women and 1,225 men ages 18 to 64, conducted May 10 – June 7, 2022. See the Methodology section for more details.

Preventive Screenings

Use of preventive services can lead to early identification of conditions when they are more responsive to medical interventions. This is especially true for certain types of cancers and cardiovascular conditions. For example, the USPSTF recommends routine mammograms every two years for women ages 50-741  to detect breast cancer, depending on risk factors; cervical cancer screenings for women ages 18-65, though the recommended frequency ranges from every three years to every five years depending on the person’s age and the type of screening test; and colorectal cancer screenings for women ages 45-75, though the recommended frequency ranges from yearly to every ten years depending on the type of screening test. These services are covered in full by most private plans under the ACA’s preventive services coverage requirements and by most state Medicaid programs.

The majority of women ages 50-64 say they have had a mammogram in the past two years, with higher rates among Black women. 

Three-quarters (76%) of women ages 50-64 report having had a mammogram in the past two years (Table 1). A higher share of Black women (86%) report having a mammogram than White women (75%) and Hispanic women (69%). A considerably higher share of insured women (78%) than those who are uninsured (45%) had a mammogram in the past two years. The survey did not find any statistically significant differences in recent mammogram rates by low- vs. higher-income or urbanicity/rurality.

Most women ages 18-64 report that they have had a cervical cancer screening/Pap test in the past two years, with higher rates among Black women and those with higher incomes and private insurance.

Six in ten (59%) women ages 18-64 report having had a cervical cancer screening/Pap test in the past two years (Table 1). A higher share of Black women (64%) report having a cervical cancer screening than White women (59%). A higher share of women with private insurance (64%) had a cervical cancer screening than those with Medicaid (56%) or the uninsured (42%). Women with higher incomes (62%) were also more likely to have had a screening than those with lower incomes (< 200% of the federal poverty level) (55%). There were no statistically significant differences in recent cervical cancer screening rates by urbanicity/rurality.

Fewer women ages 45-64 have had a recent colon cancer screening/colonoscopy in the past two years, with lower rates among the uninsured.

Fewer than two in five (38%) women ages 45-64 report having a recent colon cancer screening/colonoscopy in the past two years (Table 1). A higher share of women with Medicaid coverage (44%) and private health insurance (38%) reported having a colon cancer screening in the past two years than uninsured women (16%). There were no statistically significant differences in recent colon cancer screening rates among women of different races/ethnicities, income, or urban/rural residence.

Most Women Ages 50-64 Have Had a Recent Mammogram or Pap Test, With Higher Rates Among Black Women

Many women ages 50-64 have not had a mammogram in the past two years because they didn’t think they needed one or that they were not due for one.

Among women ages 50-64 who have not had a mammogram in the past two years, 28% say the main reason was that they didn’t think they needed one or they were not due for one (Figure 1). Fourteen percent say they did not get a mammogram because they were worried about being exposed to COVID-19 and 11% say they couldn’t afford it or that insurance wouldn’t cover it. Smaller shares say they couldn’t get an appointment or didn’t know where to get it (5%). Four in ten (41%) report that they did not get a mammogram in the past two years for some other reason.

One in Ten Women Who Have Not Had a Mammogram in the Past Two Years Say They Didn't Think They Needed One

The share of women who did have not had a mammogram in the past two years because they couldn’t afford it or because insurance would not cover it is higher among uninsured than insured women (44% vs. 5%) and higher among low-income women than higher-income women (18% vs. 8%) (data not shown).

Many women went without or delayed health care services they were due for in the past two years. 

Most notably, more than half (52%) of women ages 18-64 report that they delayed or went without a dental visit (Figure 2). One-third of women ages 21-64 went without or delayed getting a pap smear. Seventeen percent went without or delayed vaccines other than those for COVID-19. More than one in five (22%) women ages 18-64 with children under 18 say their child went without or delayed a well-visit.

One-Third of Women Delayed or Went Without a Pap Smear or Mammogram That They Were Due For in the Past Two Years


Despite clinical recommendations for routine STI and HIV testing, few women have had a recent test.

Routine STI and HIV screenings are important for early detection, treatment, and preventing transmission. STI and HIV tests are covered without cost-sharing in private plans under the ACA’s preventive services coverage requirements and are typically covered by Medicaid programs. However, fewer than three in ten women ages 18-64 have had an STI test such as for chlamydia or herpes (28%), or an HIV test (25%) in the past two years (Table 2). Recent STI and HIV testing rates are higher among women ages 36-49, those who identify as LGBT+2 , Black and Hispanic women, lower-income women, and women with Medicaid.

Fewer Than Three in Ten Women Have Had an STI or HIV Test in the Past 2 Years, With Much Higher Rates Among Black Women

Knowledge of the Affordable Care Act

For ten years, the Affordable Care Act has required most health plans to cover recommended preventive health care services and medications at no cost to the enrollee. Although most people are aware of some of these benefits, over a decade later, a sizeable share is still unaware, particularly about coverage for contraception.

More than two in five (43%) women ages 18-64 did not know that most health insurance plans must cover the full cost of birth control for women, and more than one-third (37%) incorrectly responded that vasectomies must be covered. Although most plans are required to cover contraception for women, and without cost sharing, contraception for men such as male condoms and vasectomies is not required to be covered (Figure 3).

One in five women did not know that an annual check-up for women (19%) or a cervical cancer screening (20%) must be covered without cost sharing, and one-third (32%) incorrectly believed erectile dysfunction medication must be covered.

A higher share of women than men correctly identified that the benefits specifically for women (an annual check-up, cervical cancer screenings, and birth control) are required to be covered without cost sharing. A higher share of men than women correctly responded that vasectomies are not required to be covered. There was no statistically significant difference between the share of women and men who correctly responded that erectile dysfunction medication is also not required to be covered without cost sharing.

Most People Know Insurance Coverage Requirements for Preventive Services, but Fewer are Aware of Contraceptive Coverage Requirement

Knowledge about the ACA’s no-cost preventive services coverage requirements varies by sociodemographic characteristics.

A smaller share of younger women than older women know that most health plans are required to cover annual check-ups and cervical cancer screenings without cost sharing, but a higher share of younger women than older women know that vasectomies are not required to be covered without cost sharing (Table 3). In addition, a smaller share of women with less education and lower incomes are aware of the coverage requirements for check-ups and cervical cancer screenings than their counterparts. Awareness of birth control coverage requirements was similar across education levels.

Knowledge of Insurance Coverage Requirements for Certain Health Care Services Varies by Age, Income, and Education

Conclusion

Coverage for preventive services is an established part of health plan benefits for most people in the United States today. However, this survey finds that not all women are aware of the no-cost coverage requirements for some preventive services, notably contraception. Lack of awareness of these coverage requirements means that some people may be less likely to obtain these services due to concerns about cost sharing. The outcome of a pending legal case could jeopardize the federal government’s authority to require plans to cover preventive services. Should the court ultimately rule in favor of the plaintiffs, millions of people who now have guaranteed coverage of preventive services without cost sharing could see this benefit eroded in the future.

Methodology

Overview

The 2022 KFF Women’s Health Survey is a nationally representative survey of 6,442 people ages 18 to 64, including 5,201 females (self-reported sex at birth) and 1,241 males, conducted from May 10, 2022, to June 7, 2022. The objective of the survey is to help better understand respondents’ experiences with contraception, potential barriers to health care access, and other issues related to reproductive health. The survey was designed and analyzed by researchers at KFF (Kaiser Family Foundation) and fielded online and by telephone by SSRS using its Opinion Panel, supplemented with sample from IPSOS’s KnowledgePanel.

Questionnaire design

KFF developed the survey instrument with SSRS feedback regarding question wording, order, clarity, and other issues pertaining to questionnaire quality. The survey was conducted in English and Spanish. The survey instrument is available upon request.

Sample design

The majority of respondents completed the survey using the SSRS Opinion Panel (n=5,202), a nationally representative probability-based panel where panel members are recruited in one of two ways: (1) through invitations mailed to respondents randomly sampled from an Address-Based Sample (ABS) provided by Marketing Systems Group through the U.S. Postal Service’s Computerized Delivery Sequence. (2) from a dual-framed random digit dial (RDD) sample provided by Marketing Systems Group.

In order to have large enough sample sizes for certain subgroups (females ages 18 to 35, particularly females in the following subgroups: lesbian/gay/bisexual; Asian; Black; Hispanic; Medicaid enrollees; low-income; and rural), an additional 1,240 surveys were conducted using the IPSOS KnowledgePanel, a nationally representative probability-based panel recruited using a stratified ABS design. (Note that due to small sample sizes, data for Asians are combined with data for Pacific Islanders for this survey.)

Data collection

Web Administration Procedures

The majority of surveys completed using the SSRS Opinion Panel (n=5,056) and all of the surveys completed using the KnowledgePanel (n=1,240) were self-administered web surveys. Panelists were emailed an invitation, which included a unique passcode-embedded link, to complete the survey online. In appreciation for their participation, panelists received a modest incentive in the form of a $5 or $10 electronic gift card. All respondents who did not respond to their first invitation received up to five reminder emails and panelists who had opted into receiving text messages from the SSRS Opinion Panel received text message reminders.

Overall, the median length of the web surveys was 13 minutes.

Phone Administration Procedures

In addition to the self-administered web survey, n=146 surveys were completed by telephone with SSRS Opinion Panelists who are web reluctant. Overall, the median length of the phone surveys was 28 minutes.

Data processing and integration

SSRS implemented several quality assurance procedures in data file preparation and processing. Prior to launching data collection, extensive testing of the survey was completed to ensure it was working as anticipated. After the soft launch, survey data were carefully checked for accuracy, completeness, and non-response to specific questions so that any issues could be identified and resolved prior to the full launch.

The data file programmer implemented a “data cleaning” procedure in which web survey skip patterns were created in order to ensure that all questions had the appropriate numbers of cases. This procedure involved a check of raw data by a program that consisted of instructions derived from the skip patterns designated on the questionnaire. The program confirmed that data were consistent with the definitions of codes and ranges and matched the appropriate bases of all questions. The SSRS team also reviewed preliminary SPSS files and conducted an independent check of all created variables to ensure that all variables were accurately constructed.

As a standard practice, quality checks were incorporated into the survey. Quality control checks for this study included a review of “speeders,” reviewing the internal response rate (number of questions answered divided by the number of questions asked) and open-ended questions. Among all respondents, the vast majority (97%) answered 96% or more of the survey questions they received, with no one completing less than 91% of the administered survey (respondents were informed at the start of the survey that they could skip any question).

Weighting

The data were weighted to represent U.S. adults ages 18 to 64. The data include oversamples of females ages 18 to 35 and females ages 36 to 64. Due to this oversampling, the data were classified into three subgroups: females 18 to 35, females 36 to 64, and males 18 to 64. The weighting consisted of two stages: 1) application of base weights and 2) calibration to population parameters. Each subgroup was calibrated separately, then the groups were put into their proper proportions relative to their size in the population.

Calibration to Population Benchmarks

The sample was balanced to match estimates of each of the three subgroups (females ages 18 to 35, females ages 36 to 64, and males ages 18 to 64) along the following dimensions: age; education (less than a high school graduate, high school graduate, some college, four-year college or more); region (Northeast, Midwest, South, West); and race/ethnicity (White non-Hispanic, Black non-Hispanic, Hispanic-born in U.S., Hispanic-born Outside the U.S., Asian non-Hispanic, Other non-Hispanic). The sample was weighted within race (White, non-Hispanic; Black, non-Hispanic; Hispanic; and Asian) to match population estimates. Benchmark distributions were derived from 2021 Current Population Survey (CPS) data.

Weighting summaries for females ages 18 to 35, females ages 36 to 64, and males ages 18 to 64 are available upon request.

Finally, the three weights were combined, and a final adjustment was made to match the groups to their proper proportions relative to their size in the population (Table 1).

Margin of Sampling Error

The margin of sampling error, including the design effect for subgroups, is presented in Table 2 below. It is important to remember that the sampling fluctuations captured in the margin of error are only one possible source of error in a survey estimate and there may be other unmeasured error in this or any other survey.

KFF Analysis

Researchers at KFF conducted further data analysis using the R survey package, including creating constructed variables, running additional testing for statistical significance, and coding responses to open-ended questions. The survey instrument is available upon request.

Rounding and sample size

Some figures in the report do not sum to totals due to rounding. Although overall totals are statistically valid, some breakdowns may not be available due to limited sample sizes or cell sizes. Where the unweighted sample size is less than 100 or where observations are less than 10, figures include the notation “NSD” (Not Sufficient Data).

Statistical significance

All statistical tests are performed at the .05 confidence level. Statistical tests for a given subgroup are tested against the reference group (Ref.) unless otherwise indicated. For example, White is the standard reference for race/ethnicity comparisons and private insurance is the standard reference for types of insurance coverage. Some breakouts by subsets have a large standard error, meaning that sometimes even large differences between estimates are not statistically different.

A note about sex and gender language

Our survey asked respondents which sex they were assigned at birth, on their original birth certificate (male or female). They were then asked what their current gender is (man, woman, transgender, non-binary, or other). Those who identified as transgender men are coded as men and transgender women are coded as women. While we attempted to be as inclusive as possible and recognize the importance of better understanding the health of non-cisgendered people, as is common in many nationally representative surveys, we did not have a sufficient sample size (n >= 100) to report gender breakouts other than men and women with confidence that they reflect the larger non-cisgender population as a whole. The data in our reproductive health reports use the respondent’s sex assigned at birth (inclusive of all genders) to account for reproductive health needs/capacity (e.g., ever been pregnant) while the data in our other survey reports use the respondent’s gender.

Endnotes

  1. The Women’s Preventive Service Initiatives (WPSI) recommends that average-risk women initiate mammography screening no earlier than age 40 and no later than age 50. ↩︎
  2. For more information, see our brief LGBT+ People’s Health Status and Access to Care. ↩︎
News Release

Nearly Half of Young Women Report Negative Interactions with Health Care Providers

Published: Feb 22, 2023

Among women ages 18-35 with a clinical visit in the past two years, more than four in 10 (46%) report experiencing a negative interaction with a health care provider, according to a new analysis of 2022 KFF Women’s Health Survey (WHS) data. These interactions included a provider either dismissing patients’ concerns, assuming something about them without asking, believing they were lying, blaming them for their health problems, or discriminating against them because of their age, gender, race, sexual orientation, religion, or some other personal characteristic.

Similar rates of women in low-income households (45%), uninsured women (46%), and women with a disability or ongoing health condition (45%) experienced at least one of these negative interactions. Negative interactions with health care providers can lead to poorer health outcomes, distrust of the health care system, and health inequities.

Analysts also found some statistically significant differences in the experiences of men and women. Somewhat more women than men report that their health care providers either dismissed their concerns (29% vs. 21%), didn’t believe they were telling the truth (15% vs. 12%) or discriminated against them during their visit (9% vs. 5%).

Additional findings from the analysis include the following:

Menopause received little attention in clinical visits. Only one-third (35%) of women ages 40-64 say their health care provider ever talked to them about what to expect in menopause, ranging from 42% of women who have gone through menopause, 39% of those currently going through menopause, and 19% of premenopausal women.

Screening for social determinants of health is infrequent in clinical settings, despite their impact on the health and wellbeing of patients. While nearly three in five (58%) women who have visited a health care provider in the past two years say they were asked about the kind of work they do, only one in five (20%) were asked about their ability to afford food or their access to reliable transportation.

The KFF WHS is a nationally representative survey of 5,145 self-identified women and 1,225 self-identified men ages 18 to 64, conducted May 10 – June 7, 2022.

Read “Women’s Experiences with Provider Communication and Interactions in Health Care Settings” for more information.

We’ve also released the data note “Many Use Preventive Services, but Not All Women Are Aware of Insurance Coverage Requirements,” which presents findings from the 2022 KFF WHS on women’s receipt of cancer screenings and other preventive services as well as knowledge of insurance coverage requirements for these services.

CMS Prior Authorization Proposal Aims to Streamline the Process and Improve Transparency

Authors: Kaye Pestaina, Justin Lo, Karen Pollitz, and Rayna Wallace
Published: Feb 21, 2023

The Center for Medicare and Medicaid Services (CMS) has issued a proposed rule designed to address the administrative hassles of prior authorization by requiring certain payers to implement an automated process, meet shorter time frames for decision making, and improve transparency. The proposal applies to payer processes mainly in public programs, with more limited application to health insurance marketplaces and no requirements on employer-sponsored coverage. The proposal launches the government’s next step in addressing a longstanding goal to improve health care administration through “interoperable” systems based on the use of standardized protocols for payers and providers across federal health programs. As CMS seeks input on this proposal (as well as five separate requests for information and a separate proposal on prior authorization standards and coverage criteria for Medicare Advantage plans), we can expect that prior authorization and improved data sharing in health care will be front and center in upcoming policy discussions.

What is in the new prior authorization proposal and whom does it apply to?

Insurers use prior authorization to reduce payments for care that is not medically necessary or appropriate, which in turn helps to keep premiums down. However, prior authorization has come under increasing scrutiny for creating unnecessary burdens for providers, plans, and patients. Patients can find it challenging to know what services require prior authorization, the process and criteria plans use to make a prior authorization coverage decision, and whether providers are giving the needed information to a plan to determine coverage. Inefficient processes can delay decisions and consequently access to care, increasing health risks to patients. Improper denials may increase patient out-of-pocket costs or cause patients to abandon care. The process itself may have a chilling effect on individuals seeking out care and providers recommending it.

While some exceptions apply, CMS proposes to add new requirements for the prior authorization process and new timeframes for decision-making that apply to Medicare Advantage plans, Medicaid managed care plans, Medicaid fee-for-service (FFS) plans, Children’s Health Insurance Program (CHIP) managed care and fee-for-service arrangements, and Qualified Health Plans (QHP) on the federally facilitated health insurance marketplace (i.e., healthcare.gov). These payers (essentially insurers and, for Medicaid FFS, states) would have to meet new prior authorization rules that would apply to all items and services except prescription drugs. Most rules would not become effective until 2026. The major changes proposed include requiring these payers to:

Implement a standardized interface for prior authorization. CMS proposed to require affected payers to use a specific Application Programming Interface (API) to allow for more streamlined prior authorization processes. The specific API is called the “Fast Healthcare Interoperability Resources® (FHIR) Prior Authorization Requirements, Documentation, and Decision API” (or PARDD API). APIs generally are procedures that allow different software programs to communicate and share information. The PARDD API would be used to request and obtain information from plans and providers to automate the prior authorization process. Patients could also have access to this information about prior authorization requests and decisions.

Give information to providers about prior authorization status. Impacted payers would be required to send to the relevant provider information on whether a prior authorization request was approved, denied, or whether more information is needed. This information would have to include the specific reason for a denial. Currently some of the affected payers are only required to provide this information to the patient, but these rules would require all affected payers to notify the provider as well. For example, while current Medicaid managed care rules require provider notice, there are not equivalent rules for Medicare Advantage plans.

Provide shorter timeframes for making prior authorization decisions and notice of the decision to patients. Proposed rules would provide shorter timeframes for payers to make a prior authorization decision and provide notice to beneficiaries, aligning this timeframe across certain payers. For instance, timeframes for a standard prior authorization decision notice for Medicare Advantage plans and Medicaid managed care plans would shorten from 14 calendar days to 7 calendar days. No changes are proposed to equivalent timeframes for QHPs on the federal exchange (these would stay at 15 calendar days).

Publicly report specific prior authorization metrics annually. To provide more information about how prior authorization is used, impacted payers would be required to disclose annually on their website a list of all services requiring prior authorization and specific aggregated metrics. Metrics would include, among other items, the percentage of prior authorizations that were approved and denied, the percentage of prior authorization requests approved after appeal, and the average time for a prior authorization determination. The proposal does not require any specific format for the disclosure and none of the metrics call for specifics on the types of health care items and services approved and denied.

What other items are included in the proposal?

The proposal builds on earlier rulemaking, including a May 2020 final rule on interoperability and a now withdrawn interoperability regulation from December 2020. Generally, the proposal would require the information access rules described below to apply to Medicare Advantage plans, Medicaid managed care plans, Medicaid FFS plans, CHIP managed care and FFS arrangements, and Qualified Health Plans (QHP). In certain circumstances, state Medicaid and CHIP FFS programs and QHP issuers can apply for an exception from having to comply.

Patient information access. The May 2020 final rule required that certain payers allow patient electronic access to their own claims and encounter data (as well as some clinical data) through a standardized interface. This was designed to allow patients to share data with their providers and other payers via a health app. The new proposal adds requirements to include information about prior authorization and a requirement to annually report to CMS data about how patients use this Patient Access API.

Provider information access. To support care coordination, CMS proposes requiring affected payers to implement a standardized provider access interface. Providers could then obtain claims and encounter information about patients while they are enrolled in plans from the payer. The proposal also includes making available historic prior authorization decisions, which may reduce the likelihood of ordering duplicate or misaligned services and provide a more complete picture of a patient’s care. Payers must give patients the ability to opt out if they do not want their information exchanged via this interface.

Payer-to-payer data exchange. CMS proposes to change existing requirements that allow the exchange of certain patient information between different payers. In its new iteration, affected payers would be required to use a specific payer-to-payer data exchange standard. This would allow payers to exchange patient information including prior authorization decisions from a patient’s prior health insurer. This, for example, might reduce the burden when a patient must get a new prior authorization because they had to change health plans. The proposal does not include data sharing between payers of provider remittances and enrollee cost sharing, stating that this is “often considered proprietary” and would have limited impact on care. Also, instead of an opt out, the patient must affirmatively opt in to have their data exchanged between payers.

Five Requests for Information. Included in the proposal are five separate Requests for Information that request feedback on data information exchange:

  • development of standards for exchange of data on social risk factors (social determinants of health such as housing and food security);
  • use of APIs to facilitate electronic exchange of data for behavioral health services, a segment of health care that has lagged behind in electronic data exchange;
  • electronic exchange of information in traditional Medicare with non-hospital providers (such as suppliers of durable medical equipment);
  • improvement of prior authorization processes in maternal health across the care continuum, including the process for obtaining obstetric ultrasound and the use of a single authorization when a pregnant individual changes health plans; and
  • methods to increase adoption of the Trusted Exchange Framework, a set of principles for guiding data exchange policies and practices.

What are some of the key policy issues?

CMS estimates that the proposed APIs and other changes will create administrative efficiencies that could save providers more than $15 billion over 10 years (2026 to 2035). The use of new technology to streamline processes could carry both benefits and burdens. Key issues to evaluate include:

  • How will new electronic processes affect the patient experience in accessing care and information about cost and coverage? One policy issue implicated in these rules is whether reduced administrative burdens for providers means a better experience for patients. Are consumers able to take advantage of new technologies easily or will this create new action items that they will have to undertake on their own for the first time? Will patients without access to information through these proposed APIs be at a disadvantage under a new “modernized” prior authorization system? CMS does propose to require affected payers to provide educational materials to consumers about the new API functionality. Also, while the rules will require payers to allow consumers to use health apps to access their own information, there is no requirement to make these apps available. What incentive do payers and third-party developers have to offer these tools to consumers and encourage their use? Despite the potential for positive impact from automation through electronic processes, payers and providers have been slow to take up even the existing electronic data standard (ASC X12N 278) that might improve prior authorization processes.
  • What are the risks to patients once more of their data is available electronically? As more patient data is accessible electronically via health apps, risks increase of security breaches, compromised confidentiality of health information, and inappropriate use of patient data for marketing. While payers are subject to HIPAA privacy protections, once information is in the hands of a third-party application developer, it may not have the same federal legal protections. Additionally, other federal rules prohibit providers and other entities from blocking consumer access to certain clinical information. There may be tension between the goal of broader access to information to improve care and patient knowledge of costs and coverage and the risk of inappropriate use for other purposes. These issues will likely be taken into consideration as HIPAA and other federal privacy protections are potentially revised and updated, and oversight of health apps by the Federal Trade Commission and the Food and Drug Administration moves forward.
  • In addition to API technology, are there other ways to address administrative problems concerning prior authorization? Movement away from reliance on manual processes for prior authorization (phone, fax mail) will likely improve speed and coordination, but there may be additional ways to address prior authorization challenges. For example, the CMS proposal also seeks input on the use of “gold carding” designed to reduce the amount of prior authorization requests overall. Gold carding uses data about a provider’s record for compliance with prior authorization requests in the past and their patterns of utilization of specific services. Providers who meet threshold standards may be designated as gold card providers and exempt from some or all prior authorization requirements, resulting in the services they prescribe being subject to prior authorization less often.
  • How useful is the structure of new transparency reporting to provide accessible and actionable information about prior authorization? One area to evaluate is whether standardized mechanisms and formats for reporting data are more useful for regulators and the public to assess how prior authorization is working across payers. Are there alternative disclosure mechanisms to this CMS proposal to require non-standardized information be placed on each insurer website? For example, it may be easier to compare the types of services subject to prior authorization by payer if payers provide the information in a standardized format and in a standard location on an insurer website or publicly posted by CMS, though this would be more prescriptive. Another issue is the level of aggregation of the data payers must report about prior authorization, and whether it is enough to make an objective assessment about whether the prior authorization process is a barrier to receipt of specific types of care. Similar questions apply for existing ACA transparency reporting, which indicates that for plans offered on HealthCare.gov, roughly 9% of these marketplace plan denials for in-network claims relate to prior-authorization or referrals but with no other detail explaining differences in denial rates for this reason among plans, or the nature of claims subject to such denials.
  • What are the consequences of having API standards that do not apply to all payers? The promise of a more connected health system will likely require similar standards across plans, but the proposal does not reach the more than 150 million Americans in employer-sponsored coverage. While nothing prevents employers and issuers from adopting the same efficiencies and standards for employer coverage voluntarily, currently they can do this without a requirement to add consumer protections such as opt ins or opt outs for patients to control the disclosure of information or without requirements for patient education about how their data is used. Also, the proposal does not apply to traditional Medicare – which generally does not use prior authorization — but CMS has included in one of the new RFI’s questions about current and future use of APIs for this population to streamline the exchange of information for care coordination and other processes.
  • To what extent are the coverage criteria used to make prior authorization decisions a barrier to receipt of medically necessary care, and what would be the cost implications of changing or regulating those criteria? This proposal does not address the criteria used by payers to make prior authorization determinations. These issues could prove to be just as important as efforts to improve the efficiency of the prior authorization process. CMS has proposed a Medicare Advantage regulation to address and change standards about the criteria used to make coverage decisions, including prior authorization. For example, CMS has proposed to clarify that Medicare Advantage plans must follow the same coverage guidelines that traditional Medicare uses to make medical necessity decisions. In addition, plans can only use internal or proprietary clinical criteria for medical necessity decisions if they are based on evidence-based guidelines made publicly available to CMS, enrollees, and providers. Any loosening of prior authorization criteria would increase access to care, but also potentially have cost and premium implications.

The Medicaid and CHIP Payment and Access Commission (MACPAC) recently started work on a new project examining denials and appeals in Medicaid managed care. In 2023, the U.S. Department of Health and Human Services (HHS) Office of Inspector General (OIG) is expected to release findings from audits conducted to determine whether Medicaid managed care organizations were in compliance with federal requirements when issuing denials of requested care that required prior authorization.

A recent KFF analysis of Medicare Advantage plans shows how widely prior authorization is used. In 2021 alone, Medicare Advantage plans made 35 million requests for prior authorization. As the federal government starts to assess how prior authorization is used across a broader set of health insurance plans, we might see changes and broader oversight concerning this longstanding and common insurance practice.

The Commercialization of Covid Vaccines Is Coming. Here’s What It Means.

Published: Feb 18, 2023

In this commentary for Barron’s, KFF’s Cynthia Cox and Jennifer Kates explore what will happen with access and costs to COVID-19 vaccines for people with and without insurance once the relevant public health emergency ends on May 11.  They also explore the potential increased cost to the health care system overall.

News Release

Prescriptions to Treat Opioid Overdoses and Opioid Use Disorder Among Medicaid Enrollees Rose Sharply in the Years Leading Up to the Pandemic

Policymakers Are Increasing Access to Such Treatments Amid the Recent Surge in Overdose Deaths

Published: Feb 17, 2023

State Medicaid programs saw a doubling of prescriptions for medications used to treat Opioid Use Disorder (OUD) or rapidly reverse opioid overdoses from 2016 to 2019, finds a new KFF analysis.

KFF analysts studied the latest available Medicaid claims data — detailed and comprehensive administrative data that can help answer questions and inform policy — and found that the share of enrollees who received at least one medication used to treat OUD or reverse opioid overdose doubled from 0.6 percent to 1.2 percent over the period. In raw numbers, such prescriptions rose from 3.5 million in 2016 to 7.1 million in 2019.

Compared to Black and Hispanic enrollees, White enrollees were more likely to receive at least one treatment prescription and saw the largest percentage point increase over the period, suggesting the presence of racial disparities in access to prescription medication to treat OUD or reverse opioid overdoses.

The prescribing patterns in Medicaid mirror national trends, as policymakers in Washington and in state capitals around the country have implemented policies to increase access to treatment for OUD and reduce overprescribing of opioid prescriptions for pain. A provision in the federal omnibus legislation enacted in December will expand the number of providers who are able to prescribe buprenorphine for treating OUD.

Despite efforts to address the epidemic, deaths due to substance use disorder (SUD) have risen sharply during the pandemic.  Opioid overdose death rates increased by 38 percent from 2019 to 2020, with deaths involving illicitly manufactured synthetic opioids like fentanyl now driving the trend. The rise in deaths associated with drug overdose has disproportionately affected people of color.

Medicaid enrollees may be particularly impacted, as 21 percent have mild, moderate, or severe SUD, compared to 16 percent of commercially insured. In its role as a public program and the single largest payer of behavioral health services in the country, Medicaid is particularly well positioned to implement policy to improve the delivery, quality, and effectiveness of behavioral health services.

A second KFF analysis released today finds that 7.3 percent of Medicaid enrollees ages 12 to 64 had at least one clinically-identified SUD in 2019. Other data sources suggest that this may be an undercount because it is a measure of people who receive a diagnosis or prescription code that indicates the presence of a SUD. People with clinically-identified SUD were more likely to be male, White, over 25 years old, and qualify for Medicaid based on a disability or through Medicaid expansion.

Rates of clinically-identified SUD vary widely across states, not only because of prevalence, but also because of other factors, such as provider screening behavior and variation in Medicaid coverage of SUD services.

Understanding characteristics of Medicaid enrollees with SUD and receiving OUD prescription treatment can help shed light on longstanding gaps in access to care including under-identification and undertreatment of SUD and inform policies to address issues.

For more data and analyses on Medicaid and substance use disorder, visit kff.org

A Look at Changes in Opioid Prescribing Patterns in Medicaid from 2016 to 2019

Published: Feb 17, 2023

Key Takeaways

The opioid overdose epidemic, characterized by the rapid rise in opioid-involved overdoses and overdose-related deaths, began in the late 1990s, driven by increased prescribing of opioids to treat pain. In subsequent years, the epidemic evolved, and is now largely driven by synthetic opioid-involved deaths, including illicitly manufactured fentanyl. Medicaid enrollees have been particularly impacted by the opioid epidemic, with higher rates of substance use disorder (SUD) and prescribed opioids among Medicaid enrollees compared to people with other types of insurance. To combat the opioid overdose epidemic, policymakers have enacted legislation to reduce opioid prescriptions for pain and increase access to treatment for opioid use disorder (OUD), and the Consolidated Appropriations Act, passed in December 2022, vastly increased the number of providers authorized to prescribe controlled substance medication treatment to treat OUD.

This analysis builds on previous KFF work by using Medicaid claims data, administrative data on Medicaid enrollees’ health care utilization, for 2016-2019 to explore how prescriptions for opioids used to treat pain and those used to treat OUD or rapidly reverse overdose changed across states and enrollee demographic groups over time leading up to the COVID-19 pandemic. A full description of the data and methods can be found in the Methods section. Key findings include the following:

  • Opioid prescriptions declined overall from 2016 to 2019, driven by a 44% decline in the number of prescriptions for opioids used to treat pain. At the same time, prescriptions for medications used to treat OUD or rapidly reverse opioid overdose doubled, driven by an increase in buprenorphine prescriptions.
  • The share of enrollees receiving at least one opioid prescription for pain declined from 11.3% in 2016 to 7.2% in 2019, which drove the overall declines in utilization of opioids to treat pain. The magnitude of declines varied by state, eligibility group, and race/ethnicity.
  • The share of enrollees receiving at least one medication used to treat OUD or reverse opioid overdose doubled from 2016 to 2019. Compared to Black and Hispanic enrollees, White enrollees were more likely to receive at least one treatment prescription and saw the largest increase their share over the period, suggesting racial disparities in access to prescription medication to treat OUD or reverse overdose.

Background

The opioid overdose epidemic began in the late 1990s with the increased prescribing of opioids to treat pain. Then, the epidemic shifted in 2010 with sharp increases in deaths due to heroin overdose, and, since 2013, synthetic opioid-involved deaths, including deaths involving illicitly manufactured fentanyl, have increased rapidly, far surpassing deaths involving commonly prescribed opioids and heroin. Opioid overdose death rates continue to rise, increasing by 38% from 2019 to 2020, and the recent rise in deaths associated with drug overdoses has disproportionately affected people of color. Prescription opioids were still involved in 24% of all opioid overdose deaths in 2020, though this share has declined sharply since 2007 when prescription opioids were involved in 78% of all opioid overdose deaths.

The opioid epidemic was declared a nationwide public health emergency on October 26, 2017, and there have been various strategies at the state and national level to address the opioid crisis, including actions to reduce opioid overprescribing and guidelines from the Centers for Disease Control and Prevention (CDC) in 2016. Since then, states have enacted limits on opioid prescriptions for acute pain, including limits on prescription length or daily dosage, requirements for naloxone prescription alongside opioid pain prescriptions, prescription drug monitoring programs (PDMPs), and state policies that enhance PDMPs. In 2018, a KFF survey of state Medicaid programs found all states and DC had implemented at least one opioid-focused pharmacy management policy, with 40 states expecting to implement additional opioid-focused strategies the following year. These interventions have reduced the number of opioid prescriptions in recent years; however some argue the 2016 CDC guidelines, which were voluntary, were too strictly applied or misapplied by providers, making it more difficult for some individuals to access needed pain relief.

Policy efforts have also aimed to improve access to medications for OUD treatment, as they have been shown to substantially reduce overdose and mortality rates. However, most people with OUD do not receive recommended treatment, with some estimates suggesting a gap of almost 90%. Of the three drugs currently approved to treat OUD (methadone, buprenorphine, and naltrexone), only two—buprenorphine and naltrexone—are available through prescription and can be taken at home. Methadone for OUD treatment must be dispensed onsite through licensed opioid treatment programs. Buprenorphine was first authorized to treat OUD outside of opioid treatment programs in the early 2000’s through the Drug Addiction Treatment Act of 2000, which permitted practitioners who obtained a separate controlled substances license (also referred to as an X-waiver) to prescribe buprenorphine. Over time, efforts have focused on increasing the supply of buprenorphine providers, and the Consolidated Appropriations Act completely eliminated the X-waiver, thus substantially increasing the number of providers who are authorized to prescribe buprenorphine to treat OUD.

The Medicaid population may be particularly impacted, as 21% have mild, moderate, or severe SUD, compared to 16% of commercially insured. Medicaid enrollees also receive prescriptions for pain medications at higher rates compared to individuals with other insurance types. In its role as a public program and the single largest payer of behavioral health services in the country, Medicaid is particularly well positioned to implement policy to improve the delivery, quality, and effectiveness of behavioral health services. In recent years, many states have used Medicaid Section 1115 waivers and other program authorities to expand treatment options for enrollees with OUD as well as enacted various laws to increase access to naloxone and promote the use of naloxone in Medicaid.

The detailed and comprehensive claims data available for Medicaid can help answer questions and inform policy. This analysis builds on previous KFF work by using Medicaid claims data for 2016-2019 to explore how prescriptions for opioids used to treat pain and those used to treat OUD or rapidly reverse overdose changed across states and Medicaid enrollee demographic groups over time. We exclude methadone for OUD treatment, which is only dispensed from licensed opioid treatment programs, and cannot be obtained using a prescription (for more information, see Table 1 and Methods).

The number of Medicaid prescriptions for opioids in this analysis declined by 27% from 2016 to 2019, driven by a decline in the number of opioid prescriptions used to treat pain. The utilization of opioids prescriptions to treat pain declined by 44% from 2016 to 2019 (Figure 1). While still widely prescribed, opioids are also making up an increasingly smaller share of all Medicaid outpatient prescription drug claims. In this analysis, opioids overall accounted for 3.0% of all Medicaid outpatient prescription drug claims by 2019, down from 4.1% in 2016.

Number of Medicaid Outpatient Prescriptions for Opioids, 2016-2019

Medicaid prescriptions used to treat OUD or rapidly reverse opioid overdose doubled from 2016 to 2019 and made up an increasing share of all opioid prescriptions over the period. While most opioid prescriptions over the period were for opioids used to treat pain, prescriptions for drugs used to treat OUD (buprenorphine and naltrexone) or rapidly reverse opioid overdose (naloxone), doubled over the period, and together they made up 33% of all opioid prescriptions by 2019, up from 12% in 2016. Table 1 describes what prescription drugs are included and how drugs are categorized as prescriptions used to treat pain or prescriptions used to treat OUD or reverse opioid overdose in this analysis (for more information, see Methods).

Definitions and Classifications Used in this Analysis

What is driving the decline in opioid prescriptions used to treat pain?

The share of Medicaid enrollees who received at least one opioid prescription used to treat pain within the year declined from 11.3% in 2016 to 7.2% in 2019, or 4.1 percentage points (Figure 2). The number of opioid prescriptions among those with at least one opioid prescription used to treat pain remained relatively stable over the period, around 3 prescriptions per person. This suggests the decline in utilization results from fewer enrollees receiving any prescriptions rather than from enrollees who already receive opioid prescriptions receiving fewer prescriptions. The share of Medicaid enrollees who received at least one opioid prescription used to treat pain declined across all eligibility groups over the period. In 2016, pregnant women accounted for the largest share of enrollees receiving at least one opioid prescription used to treat pain (23.9%). However, from 2017 onward, individuals eligible for Medicaid based on a disability had the largest share, with 18.8% receiving at least one opioid prescription used to treat pain by 2019 compared to 15.6% of pregnant women, 15.3% of traditionally eligible adults, 13.0% of expansion adults, 7.9% of seniors, and 1.7% of children. While there are likely many factors at play, state policies implemented over the period to prevent opioid-related harms as well as the release of the 2016 CDC guidelines to address opioid overprescribing likely contributed to these declines.

Share of Medicaid Enrollees With at Least One Opioid Prescription Used to Treat Pain, 2016-2019

All states experienced declines in the share of Medicaid enrollees who received at least one opioid prescription to treat pain from 2016 to 2019, but the degree varied by state. The states that experienced the largest declines appear to be clustered around the Appalachian region, one of the areas hardest hit by the opioid epidemic. Of the top five states (TN, KY, OH, WV, MI) with the largest share of enrollees receiving at least one opioid prescription in 2016, the beginning of the study period, only one state (KY) remained in the top five states by 2019. On the other hand, states with the smallest declines over the period varied in location.

Share of Medicaid Enrollees with at Least One Opioid Prescription Used to Treat Pain in 2019

While all groups experienced a decline in the share of Medicaid enrollees receiving at least one opioid prescription used to treat pain from 2016 to 2019, White enrollees experienced the largest decline compared Black and Hispanic enrollees. White enrollees also had the highest share of enrollees with at least one opioid prescription used to treat pain in both 2016 and 2019 compared to all other racial/ethnic groups. In 2016, 14.9% of White Medicaid enrollees had at least one opioid prescription used to treat pain, compared with 12.6% of Black enrollees, the next highest group (Figure 4). By 2019, the share of White enrollees with at least one opioid prescription had fallen to 9.5% (a 5.4 percentage point decline) and the share for Black enrollees had fallen to 7.9% (a 4.7 percentage point decline). Multiple studies have shown racial disparities in opioid prescribing and pain management, and our findings suggest Black and Hispanic Medicaid enrollees are less likely to be prescribed opioids used to treat pain when compared with White enrollees.

Share of Medicaid Enrollees With at Least One Opioid Prescription Used to Treat Pain, by Race/Ethnicity

What is driving the increase in prescriptions used to treat OUD or reverse opioid overdose?

Prescriptions for buprenorphine, an OUD treatment, grew 92% from 2016 to 2019 and made up the vast majority (87% in 2019) of all pharmacy prescriptions used to treat OUD or reverse opioid overdose (Figure 1). This reflects state efforts over the period to increase access to buprenorphine as well as changes to buprenorphine prescribing limits over the period. While they make up a smaller share of all prescriptions in this analysis, the number of opiate antagonist prescriptions almost tripled from 2016 to 2019.

The share of Medicaid enrollees who received at least one prescription used to treat OUD or reverse opioid overdose within the year doubled, growing from 0.6% in 2016 to 1.2% in 2019 (Figure 5). At the same time, the number of OUD treatment or opioid overdose prescriptions per enrollee (among those who received any prescription for OUD treatment or overdose reversal) stayed relatively stable around 9 prescriptions per enrollee, suggesting the increase in utilization results from additional enrollees starting to receive medication for OUD treatment or to reverse opioid overdose over the period. It is important to note that this analysis looks at the utilization among all Medicaid enrollees in the analysis, not among enrollees with an OUD diagnosis, which is why the shares for treatment are small.

Share of Medicaid Enrollees With at Least One Prescription Used to Treat OUD or Opioid Overdose, 2016-2019

While all groups experienced in increase in the share of Medicaid enrollees receiving at least one prescription used to treat OUD or reverse opioid overdose from 2016 to 2019, White enrollees experienced the largest increase compared to Black and Hispanic enrollees. White enrollees also had the highest share of enrollees with at least one prescription for OUD treatment or opioid overdose in both 2016 and 2019 compared to all other racial/ethnic groups. In 2016, 1.1% of White Medicaid enrollees had at least one prescription to treat OUD or reverse overdose, compared with 0.2% of Black enrollees, the next highest group (Figure 6). By 2019, the share of White enrollees with at least one prescription to treat or reverse overdose had grown to 2.2% (a 1.1 percentage point increase) and the share for Black enrollees had grown to 0.7% (a 0.5 percentage point increase). Various studies have shown racial disparities in access to medications for OUD, especially for buprenorphine, and some studies suggest these disparities may have worsened during the COVID-19 pandemic. Further, continuity of treatment, as measured by the number of treatment or overdose reversal prescriptions per enrollee among enrollees receiving at least one treatment or overdose reversal prescriptions, remained mostly stable for White enrollees (around 11 prescriptions per person), but declined for Black enrollees (from around 6 prescriptions per person to 5) and Hispanic enrollees (from 7 prescriptions per person to 5).

Share of Medicaid Enrollees With at Least One Prescription Used to Treat OUD or Opioid Overdose, by Race/Ethnicity

Looking Ahead

There have been recent actions to address opioid overprescribing and misuse, including a 2022 update to the 2016 CDC guidelines for prescribing opioids for pain. The guidelines are voluntary and are intended to help providers navigate providing appropriate care to patients in pain, and the update reportedly provides for more flexibility and individualized treatment, no longer including strict duration and dosage limits that the earlier guidelines included. It is unclear at this time whether states will update their policies to reflect the eased restrictions on prescription opioids seen in the recent guidelines. Some groups are also taking steps to address racial disparities in pain management including developing new assessment tools and raising awareness of systemic racism in medicine.

There have also been recent federal efforts to increase access to medications that treat OUD or reverse opioid overdose. Following the onset of the COVID-19 pandemic, the federal government allowed for new flexibilities in OUD treatment to ease access barriers, for example allowing for take-home methadone doses and covering telehealth treatment, and the Biden administration has proposed making these flexibilities permanent. The Biden administration also released a model law to make access to naloxone more consistent across states, new buprenorphine practice guidelines that eliminate a training requirement many viewed as a barrier to treatment, and a National Drug Control Strategy to combat addiction and the opioid epidemic.

Further, the 2023 Consolidated Appropriations Act eliminated the X-waiver requirement for prescribing buprenorphine, which substantially increases the number of providers who are authorized to prescribe buprenorphine to treat OUD. The Act will also require all providers with a controlled substances license to obtain training on treating and managing patients with OUD and SUD. States and localities have also started to receive funds as part of the National Opioid Settlement, and it is required that states use at least 70% of the funding toward opioid remediation efforts, though there are concerns about a lack of transparency about how funds will be spent in some states.

Methods

Data: This analysis uses the 2016-2019 T-MSIS Research Identifiable RX line claims files merged with the demographic-eligibility files from the Chronic Condition Warehouse to include beneficiary demographic and enrollment information. The RX line files contain claims for prescription or over-the-counter drugs or other products covered by Medicaid or CHIP and provided by a pharmacy.

For 2019, the number of prescriptions identified in the T-MSIS claims is about 7 million fewer than what is reported in the State Drug Utilization Data (SDUD) which collects prescription drug rebate data submitted by states. The SDUD count is higher because the data include all rebate-eligible covered outpatient drugs, including any administered by a physician that states receive rebates for, which are excluded from the TMSIS RX files and because KFF made the state and enrollee exclusions detailed below. Prior KFF analyses used the SDUD data, but those data can’t be linked to enrollee information, which makes it impossible to analyze changes in prescribing patterns by enrollee characteristics.

Identifying Opioid Prescriptions: To identify all claims for opioid prescriptions, we used the NDC code on each drug claim to match in data from IBM’s Micromedex RED BOOK (downloaded in September 2021) about the therapeutic/pharmacologic category of the product. We included all drugs that were categorized as opiate agonists, opiate partial agonists, or opiate antagonists in the analysis. To separate out opioid prescriptions to treat pain vs. medications used to treat OUD or opioid overdose, we identified all prescriptions with the unique or primary agent buprenorphine (an opiate partial agonist) as well as all drugs categorized as opiate antagonists (naltrexone and naloxone). Naloxone is FDA approved to reverse opioid overdose but is included with other treatment prescriptions in this analysis. All other opiate agonists and partial agonists were categorized as pain medications. As methadone must typically be administered in a certified opioid treatment program (OTP) if it is being prescribed for OUD, we assume the small share of methadone prescriptions in the RX claims files (around 1% of all opioid prescriptions in 2019) were prescriptions to treat pain, not for treatment of OUD.

Enrollee Exclusion Criteria: We exclude partial-benefit enrollees, who do not generally have coverage for prescription drugs, and Medicare-Medicaid enrollees, who have primary drug coverage through Medicare. CHIP claims are included in this analysis.

State Exclusion Criteria: We calculated the change from year to year for each state across three different measures: number of opioid prescriptions, share of enrollees with at least one opioid prescription (opioid users), and number of opioid prescriptions per user. If any of those measures changed by more than 100% of the prior-year value, we excluded the state from the analysis, assuming the volatility reflected potential data quality issues. We excluded five states based on that criterion (AR, FL, MA, MS, VA). We also excluded states with total RX line volume (as assessed by the DQ Atlas) that was less than 50% of the national median which included three states (FL, MS, NC), two of which also met the prior criterion. In total, 6 states were excluded (AR, FL, MA, MS, NC, VA), and 44 states and DC were included in the main analysis.

For reporting by race/ethnicity, we excluded states with “High Concern/Unusable” DQ Atlas assessments in 2016 or 2019. Among states in the main analysis, 21 states were excluded from the race/ethnicity analysis only (AL, AZ, CO, CT, DC, HI, IA, KS, LA, MD, MO, MT, NE, NY, OR, RI, SC, TN, UT, WV, and WY), leaving 24 states for reporting by race/ethnicity (Figure 3 & Figure 6).

This work was supported in part by Well Being Trust. KFF maintains full editorial control over all of its policy analysis, polling, and journalism activities.