The Virginia Health Care Landscape
The Affordable Care Act (ACA) went into full effect on January 1, 2014, ushering in health insurance reforms and new health coverage options in Virginia and across the country. Although the Medicaid expansion debate is still underway in the state, Virginia is experiencing changes to its health care delivery system. This fact sheet provides an overview of the population health, health coverage, and health care delivery system in Virginia in the era of health reform.
Demographics
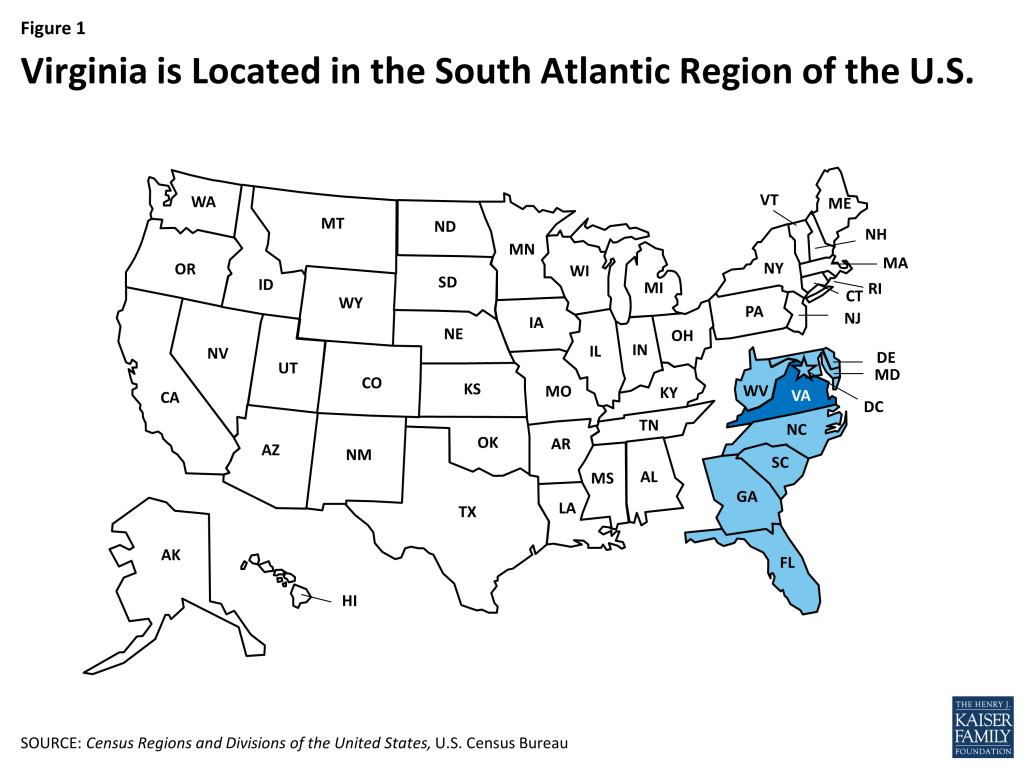
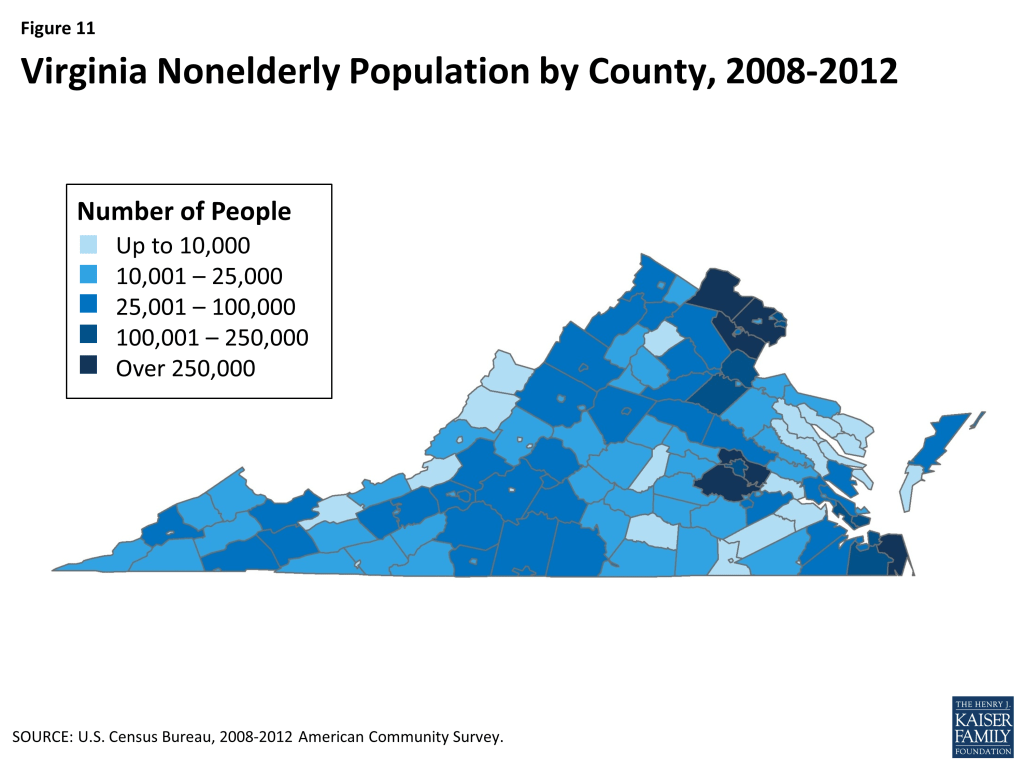
Virginia has a growing and increasingly diverse population. Virginia is one of eight states and DC located in the South Atlantic region of the U.S. (Figure 1).1 At almost 40,000 square miles, it is the 37th largest state.2 Virginia is home to nearly 8 million residents, making it the 12th most populous state in the U.S.3 In 2012, 65% of Virginians identified as White, which is similar to the U.S. average. However, Virginia has a higher percentage of Blacks (19%) than the U.S. overall (12%) and a smaller percentage of Hispanics (7% compared to 17% nationally)(Figure 2).4 The age distribution of Virginia’s population aligns with the age distribution of the overall U.S. population.5 Between 2000 and 2010, Virginia’s population increased 13.0%, compared to 9.7% nationally, making Virginia the 17th fastest-growing state in the U.S.6 Population growth in Virginia was concentrated in the state’s major metropolitan areas, including northern Virginia (which is considered a suburb of Washington, D.C.), Richmond, and the Hampton Roads area in the southeastern part of the state.7 Meanwhile, many of the state’s rural counties in the south and west have experienced a decrease in their populations. (See Figure 11 in the Appendix for nonelderly population by county.)
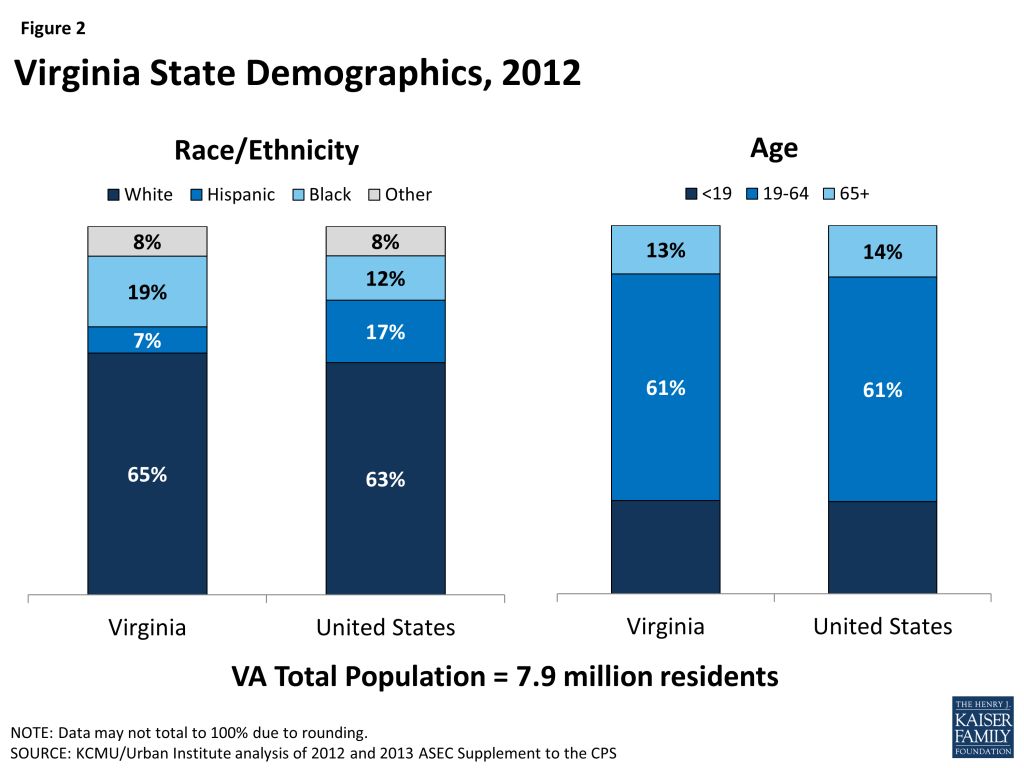
Hispanics are the fastest-growing racial/ethnic group in Virginia, with the population increasing 92% between 2000 and 2010, followed by the Asian population, which increased 70% during the same time period.8 Changes in the political dynamics of the state, including the outcomes of recent statewide and national elections, are attributed, in part, to the changing demographics of the population within Virginia.
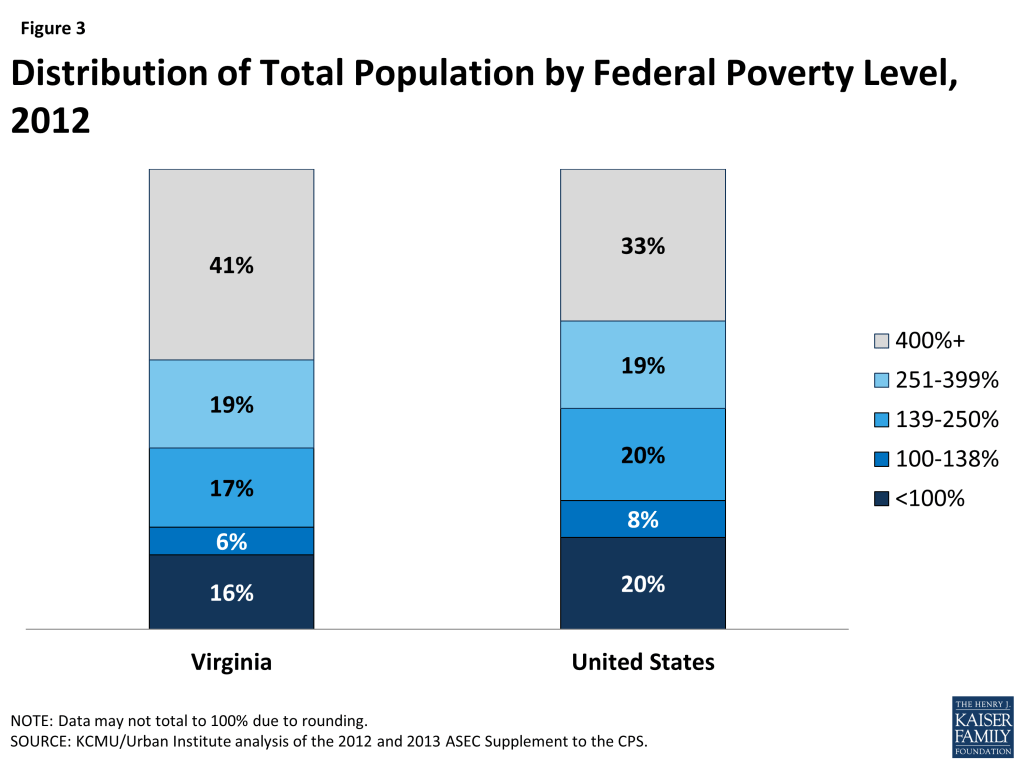
Virginia has lower unemployment and higher family incomes than the U.S. population overall. In March 2014, Virginia’s unemployment rate was 5%, which is lower than the national average (6.7%) and the 12th lowest unemployment rate among the states.9 The 2012 median household income in Virginia was nearly $62,000, which was the 9th highest among the states.10 Nearly one in six (16%) individuals in Virginia were living in poverty in 2012, which was the 12th lowest poverty rate among the states and well below the national average of 20% (Figure 3).11 Among states in the South Atlantic region, Virginia has the third highest median household income (behind MD and DC) and the second lowest poverty rate (behind MD). However, poverty rates vary across areas of the state. For example, poverty rates are lower in the state’s northern counties and the western counties outside of Richmond, than in the cities of Richmond and Norfolk and the rural counties of the south and southwest.12
State Economy
Virginia is experiencing moderate economic growth. In 2012, Virginia’s Gross Domestic Product (GDP) was $445.9 billion, which makes it the 10th largest state economy in the U.S.13 Like other states across the country, Virginia has experienced consecutive years of economic growth.14 However, from 2011 to 2012, Virginia’s real GDP increased by 1.1%, less than the national GDP (2.5%).15 Agriculture, manufacturing, and mining are major industries in the state, in addition to federal government and military activities and tourism.16 Like other states across the country, Virginia experienced budgetary challenges during the recent economic downturn, although, the state’s economy continues to improve. Virginia ended State Fiscal Year (SFY) 2013 with a $585 million budget surplus, the state’s fourth annual budgetary surplus and its largest since 2005.17
Population Health
The overall population health in Virginia is comparable to the national average. In 2013, Virginia ranked 26 among the 50 states in overall health, according to the United Health Care Foundation’s Annual Report, America’s Health Rankings.18 The shares of adults in Virginia who are overweight or obese, have been diagnosed with diabetes, or have asthma are similar to shares nationally, as are the death rates due to heart disease and cancer.19 ,20 ,21 ,22 ,23 Adults in Virginia were less likely than adults nationally to report being in fair or poor health or to have poor mental health.24 ,25 In addition, the proportion of adults in Virginia who are smokers is equal to the national average of 19%.26
Population health varies across Virginia’s counties, with the state’s northern counties, those to the west of Richmond, and those in the west along the Blue Ridge Mountains, faring better than the cities of Richmond and Norfolk and the rural counties along the northern peninsula, south, and southwest.27
Disparities in health and health care access exist in Virginia. Like other states across the country, measures of health status and access to and utilization of health care services in Virginia vary by race/ethnicity and patterns across these measures in Virginia closely align with national averages. Blacks (75 years) and Whites (79 years) in Virginia have a shorter life expectancy than Asians (87 years) and Hispanics (88 years).28 The mortality rates due to heart disease, cancer, and diabetes are higher for Blacks in Virginia than Whites.29 Further, nonelderly Black adults in Virginia are more likely to be overweight or obese (74% vs 61%), have diabetes (11% vs 7%), and report being in fair or poor health (19% vs 13%) than nonelderly White adults.30 Both nonelderly White (35%) and Black (33%) adults in the state are more likely to report experiencing frequent mental distress than nonelderly Hispanics (26%).31 While nonelderly Hispanic (58%) and Black (72%) adults are less likely than nonelderly White adults (77%) to have a usual source of care, nonelderly White adults (83%) are less likely than nonelderly Black (89%) and Hispanic (85%) adults to report having a primary care visit in the past two years.32
To address the state’s health disparities and promote health equity, the Virginia Department of Health’s Office of Minority Health & Health Equity published a Health Equity report in 2012.33 This report is a call to action for Virginia communities across the state to work together to improve the health of all races and ethnicities. Local programs and initiatives are also operating in the state. For example, Virginia Commonwealth University operates the Virginia Coordinated Care (VCC) Program, which aims to increase access to primary care, and the Mosby Partnership, which works to reduce health disparities among public housing residents in the Richmond area.34 In addition, to address geographic health disparities, Virginia’s Department of Health released the Virginia’s State Rural Health Plan in 2013, which is a three-five year action plan to enhance health systems throughout rural areas of the state.35
Coverage
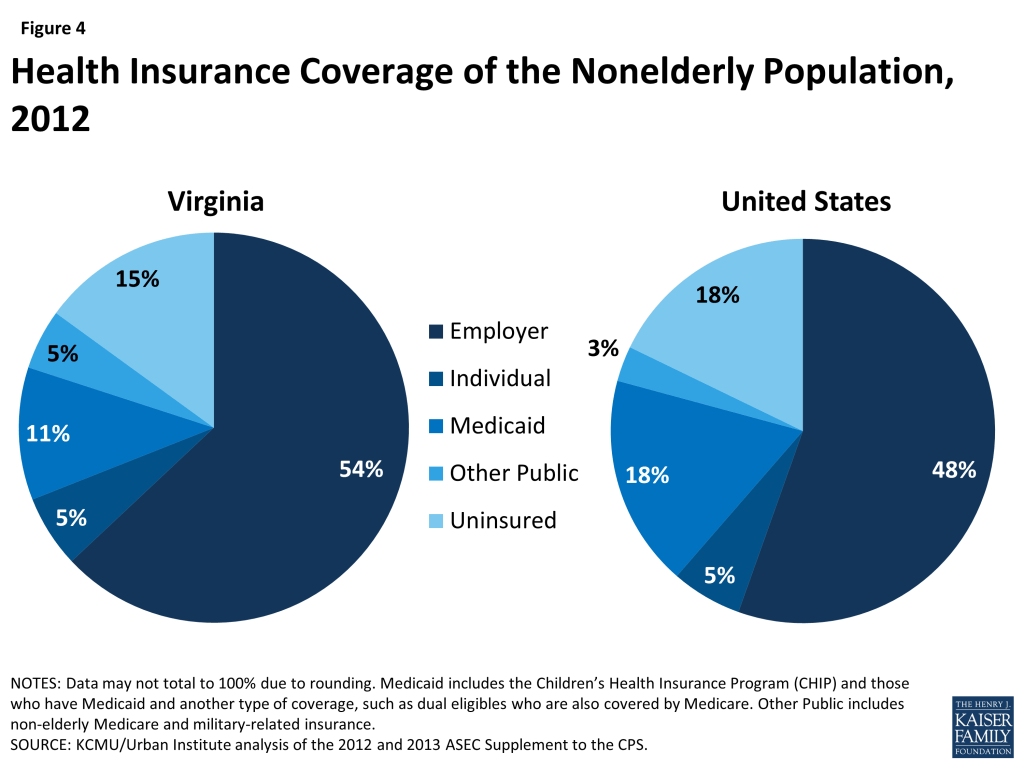
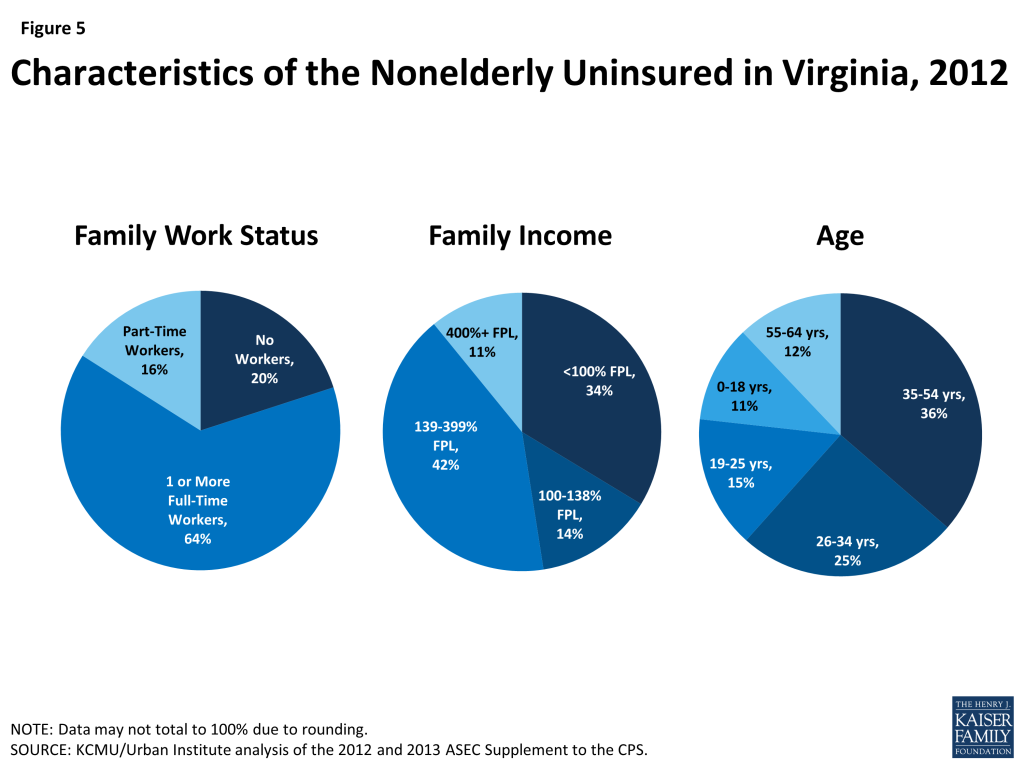
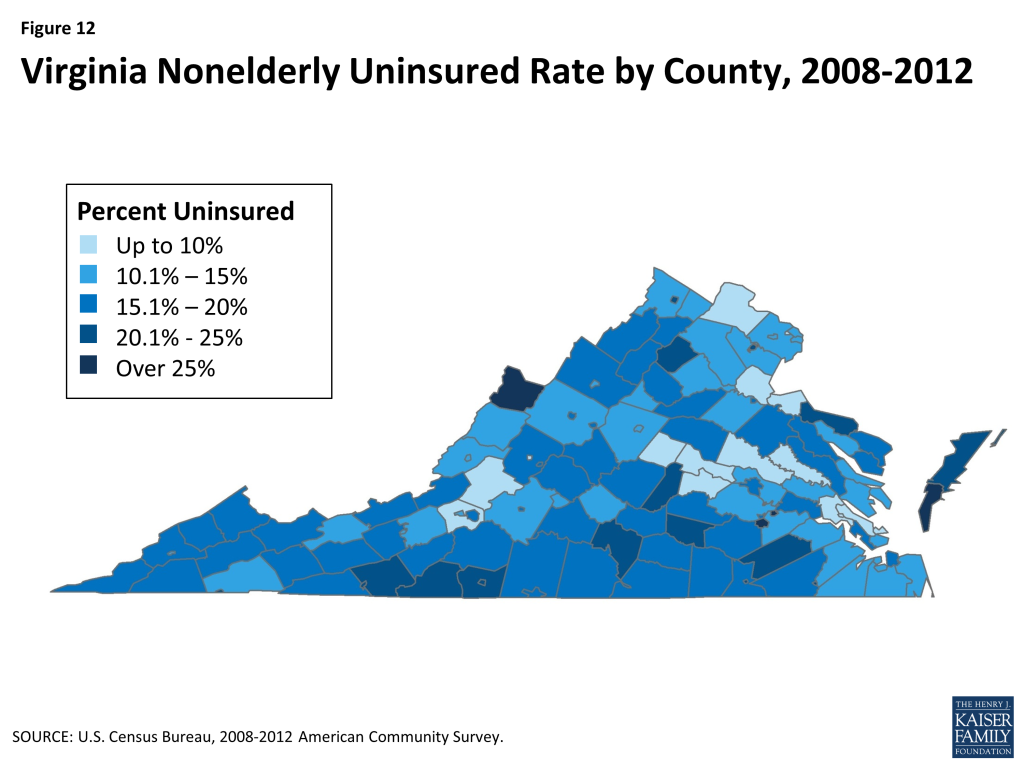
Over one million nonelderly individuals, or 13% of Virginia’s population, were uninsured in 2012 (Figure 4).36 This rate is lower than the U.S. average of 15%, which reflects the range of uninsured rates across the country from 4% in Massachusetts to 24% in Texas. People of color are disproportionately represented among the nonelderly uninsured in Virginia. Although only 19% of nonelderly Virginians identify as Black, they represent one-quarter (26%) of the state’s uninsured.37 Similarly, while only 8% of nonelderly Virginians identify as Hispanic, they represent one-fifth (19%) of the state’s uninsured. In addition, as shown in Figure 12 (Appendix), the nonelderly uninsured in Virginia are not equally distributed across the state’s counties, with the southern and northwestern regions having higher uninsured rates than other areas of the state. As in other states across the U.S., the majority of the uninsured have at least one full-time worker in their households, have income below 400% of the Federal Poverty Level (FPL), and are under age 55 (Figure 5).38
Among the 87% of Virginians with health insurance, the largest share (54% of the state population) have employer-sponsored coverage, followed by Medicare (13%), Medicaid (10%), and individual private insurance (5%)(Figure 4).39
Medicaid
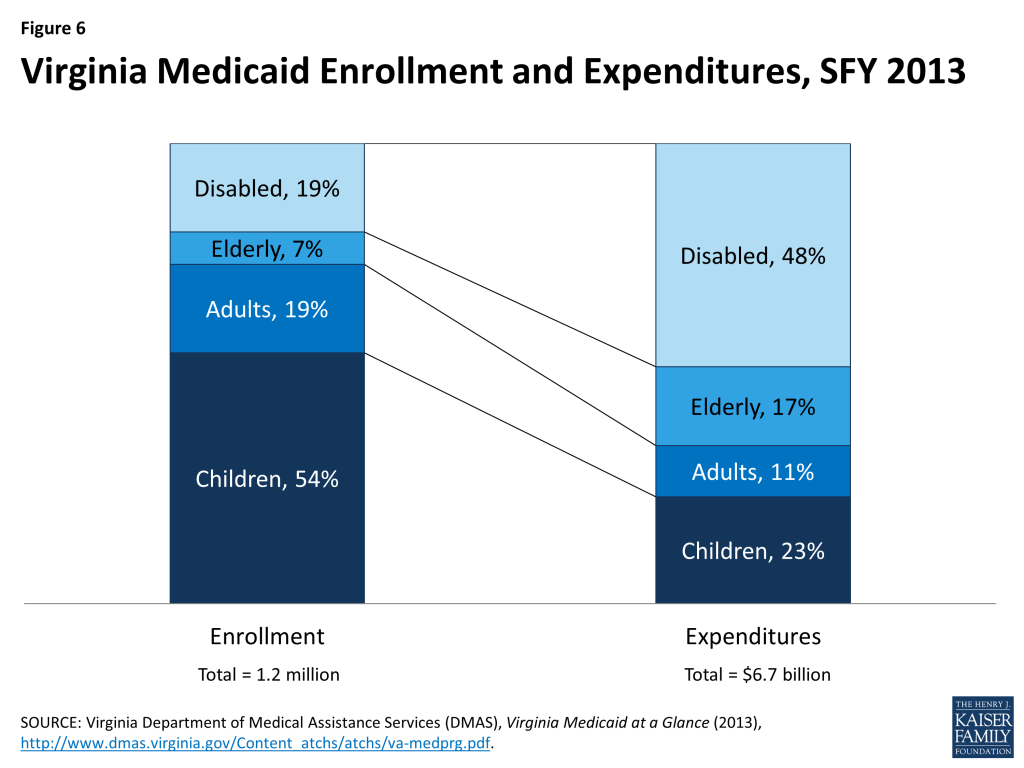
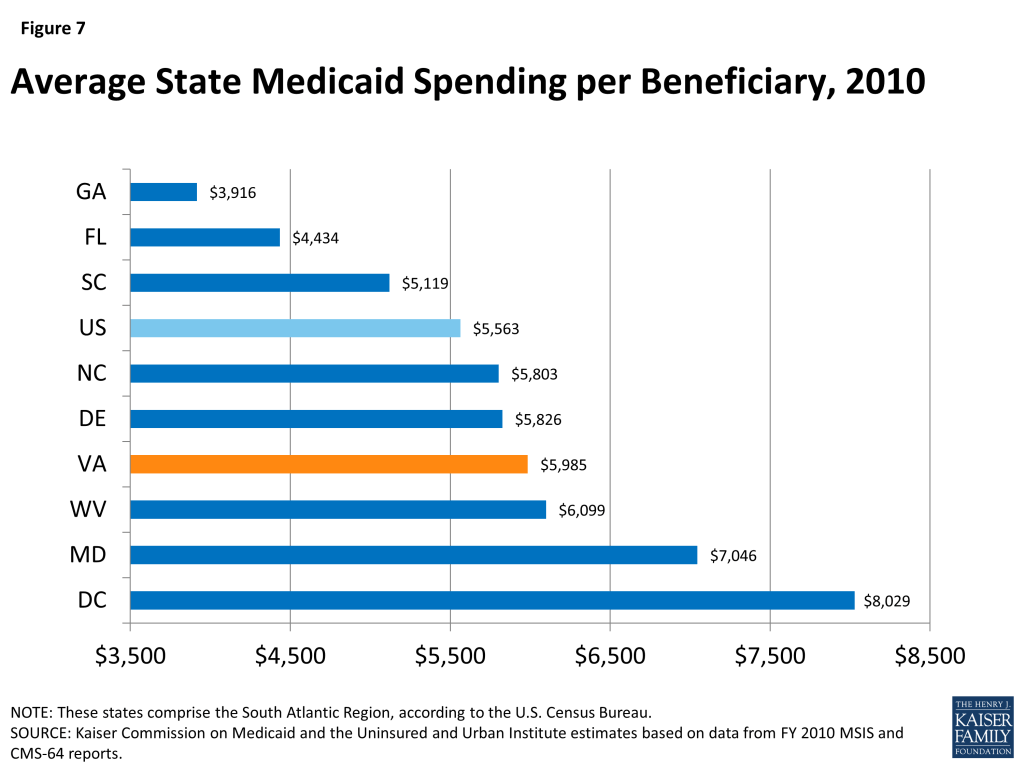
Similar to the national picture, the large majority of Medicaid enrollees in Virginia are children, but the elderly and individuals with disabilities account for most Medicaid spending. Based on data for SFY 2013, 54% of Medicaid enrollees were children, who accounted for 23% of expenditures (Figure 6).40 While, one-quarter (26%) of enrollees were elderly or people with disabilities who accounted for 65% of total program costs. Based on data from 2010 (the latest year for comparative data), average federal and state spending per beneficiary in Virginia was $5,985, slightly higher than the national average of $5,563 and slightly above other states in the South Atlantic Region (Figure 7).41
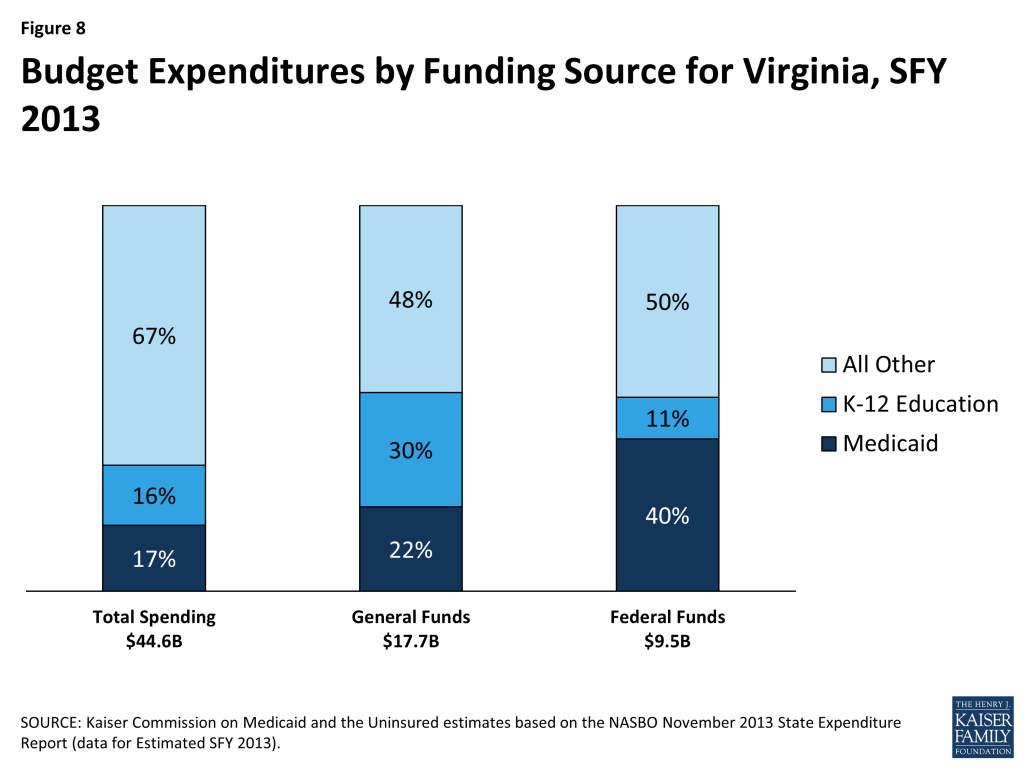
Medicaid costs are shared by the states and the federal government, with the federal government paying 50% of the cost of Virginia Medicaid; therefore, for every $1.00 that Virginia spends on Medicaid, the federal government sends an additional $1.00 to the state in matching funds.42 The combined federal and state spending on Medicaid in Virginia for SFY 2013 was $6.7 billion.43 This accounted for 17% of total state spending, 22% of state general funds, and 40% state spending of federal funds (Figure 8).44 Medicaid is the second largest source of state general fund spending behind elementary and secondary education, but the largest source of federal revenue flowing into the state.
Most Medicaid beneficiaries in Virginia are enrolled in managed care. Nearly 7 in 10 (69%) Medicaid beneficiaries in Virginia are enrolled in risk-based managed care.45 Seven managed care organizations serve Medicaid beneficiaries and the three largest plans, Anthem HealthKeepers Plus, Virginia Premier Health Plan, and Optima Family Care, account for nearly 85% of total Medicaid managed care enrollment.46 Although foster children were previously excluded from managed care, the state is currently transitioning them to Medicaid managed care, with an anticipated completion date of July 2014.47
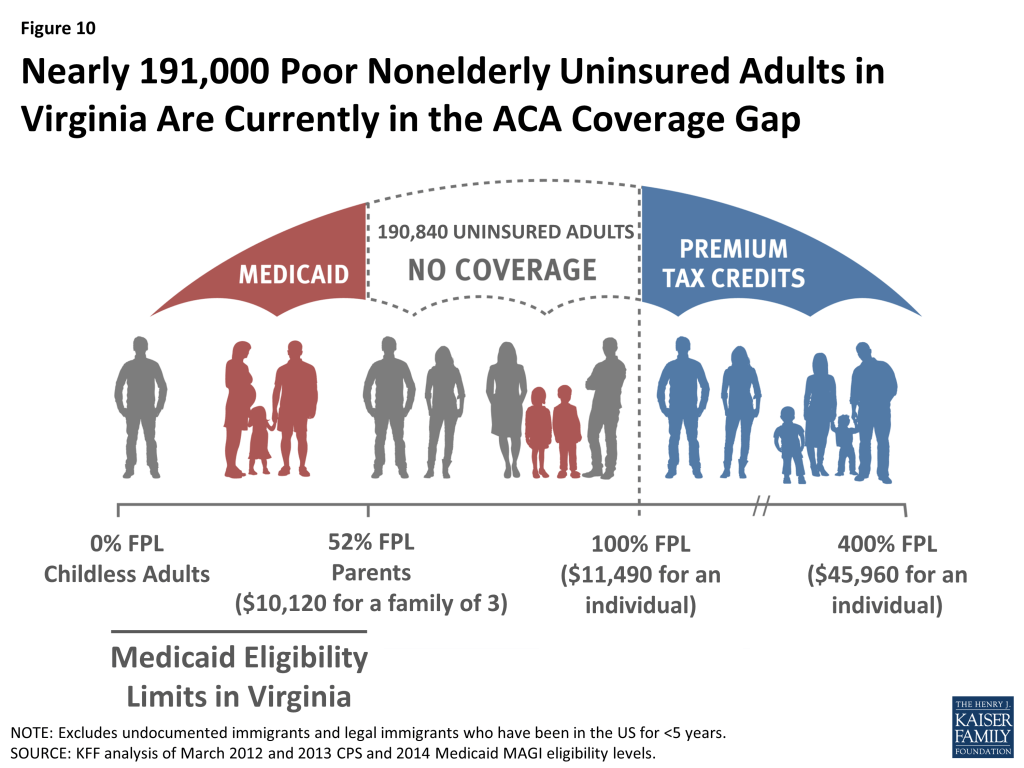
Virginia currently has limited Medicaid eligibility for adults. Pregnant women in Virginia with income up to 148% FPL ($28,904 for a family of 3 in 2014) are eligible for Medicaid in Virginia, which is the sixth lowest eligibility limit in the country.48 Meanwhile, parents of dependent children are only eligible for Medicaid if their income does not exceed 51% FPL ($10,120 for a family of 3 in 2014), the sixteenth lowest eligibility limit in the country, and adults without dependent children in the state are ineligible for coverage, regardless of income. Virginia provides coverage for children up to 205% FPL through the CHIP-funded Family Access to Medical Insurance Security (FAMIS) plan.49
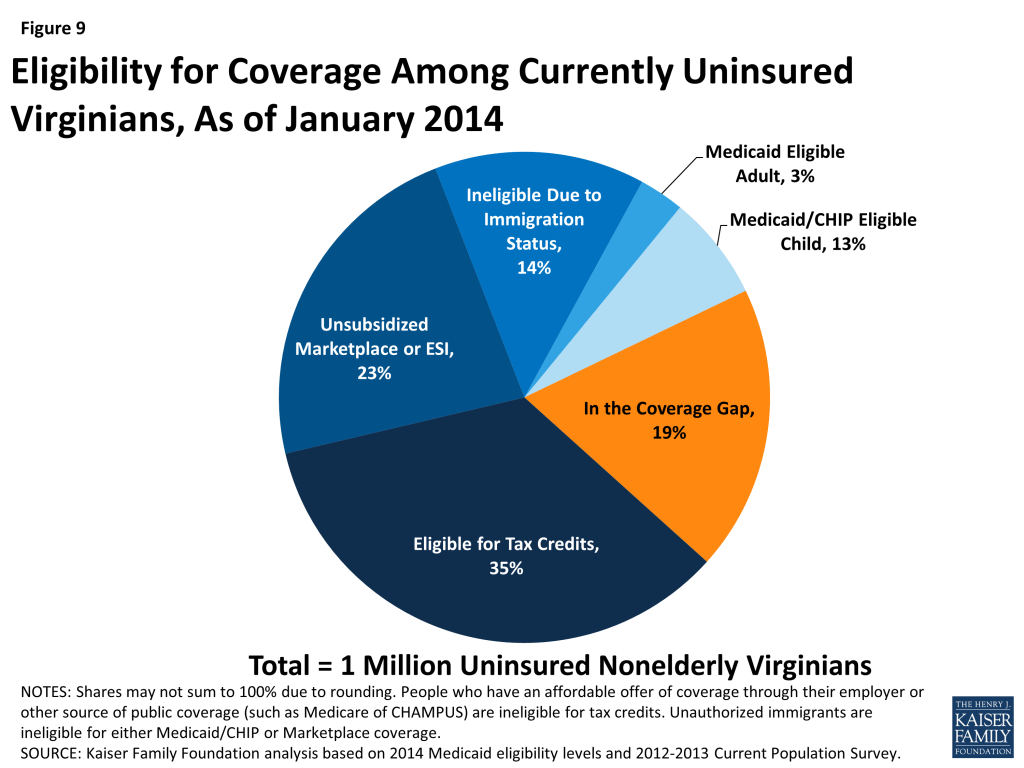
The ACA could extend financial assistance for coverage to a majority of uninsured Virginians. A main goal of the ACA is to extend health coverage to many of the 47 million nonelderly uninsured individuals across the country, including many of the 1 million nonelderly uninsured Virginians. The ACA accomplishes this through insurance market reforms and by establishing new coverage pathways, including an expansion of Medicaid to cover nearly all nonelderly individuals up to 138% FPL ($16,105 for an individual, $27,310 for a family of 3 in 2014), and by providing premium tax credits to many individuals between 100-400% FPL to purchase coverage on the Health Insurance Marketplaces. However, as a result of the Supreme Court decision on the ACA, the Medicaid expansion is now effectively a state option.50 Many currently uninsured nonelderly Virginians are eligible for premium subsidies in the Marketplace or Medicaid coverage, if the state expands its Medicaid program (Figure 9). Regardless of a state’s Medicaid expansion decision, all states must simplify and streamline their eligibility and enrollment processes under the ACA, which, along with ACA outreach efforts, will likely increase Medicaid enrollment among currently eligible but unenrolled individuals, especially children.
Without the Medicaid expansion, 191,000 currently uninsured adults (19% of the nonelderly uninsured in the state) who would have been eligible for Medicaid will remain in the coverage gap (Figure 10).51 In Virginia, the debate over the Medicaid expansion is still ongoing.52 If the state does not expand Medicaid, 191,000 individuals who have incomes below 100% FPL will be left out of coverage because they earn too much to qualify for Medicaid, but not enough to qualify for the premium subsidies for Marketplace coverage, which begin at 100% FPL. An additional 123,000 Virginians have incomes between 100-138% FPL and may currently be eligible for Marketplace subsidies.53 Virginia’s Governor Terry McAuliffe (D), who was elected in November 2013, has made Medicaid expansion one of his top priorities since taking office. On March 24, 2014, the start of the state legislature’s special session, Governor McAuliffe proposed expanding Medicaid in the state through a two-year pilot program, as part of his SFY 2015-2016 Budget proposal.54 On April 8, 2014, the State Senate approved the Governor’s Budget, but substituted his Medicaid expansion pilot program with its own pilot, called “Marketplace Virginia”.55 Marketplace Virginia would use federal Medicaid expansion funds to provide subsidies for up to 400,000 Virginians to purchase private health insurance, including those who are currently uninsured and some who are currently covered through other programs, such as pregnant women covered through the state’s CHIP program. The Governor and Democratic-controlled Senate are currently insisting on some form of Medicaid expansion in the state budget, while the Republican-controlled House of Delegates argues that the issue of Medicaid expansion should be debated separately from the state budget. Failure to pass a state budget could result in a state government shutdown on July 1, 2014.
If the state expands its Medicaid program, the federal government will pay 100% of the cost of coverage for those newly eligible through 2016, phasing down to 90% in 2020 and beyond. In January 2014, the Virginia Department of Medical Assistance Services released a report that estimated that Medicaid expansion would save the state $600 million through 2022.56 In advocating for the expansion, Governor McAuliffe and other supporters have emphasized the negative impact that foregoing federal dollars would have on the state’s safety-net providers.
Virginia is implementing new quality and performance measures to improve primary and preventive care and care coordination. In 2013, Virginia initiated two value-based purchasing programs in its Medicaid program: a pay-for-performance initiative designed to increase use of preventive services and an integration initiative that uses shared savings and shared risk arrangements between MCOs and providers to improve quality and financial performance.57 Managed care plans throughout the state are also experimenting with patient-centered medical home initiatives. For example, Virginia Premier Health Plan opened a “medical home” clinic in Roanoke to provide primary care and care coordination with specialists for Medicaid beneficiaries.58
Virginia is seeking to better coordinate care and control costs for its dual eligible beneficiaries, who often have complex and costly health care needs. In 2010, dual eligible beneficiaries, or individuals who are eligible for both Medicare and Medicaid, made up 14% of total Medicaid enrollment and accounted for $6 million (40%) of total Medicaid costs.59 In an effort to better integrate care and align financing for dual eligible beneficiaries, CMS is using new authority afforded under the ACA to launch demonstration projects in several states across the country that test new care coordination and delivery models. Virginia is one of 11 states that have been approved so far to participate in a duals demonstration project.60 Starting in April 2014, Virginia began enrolling 78,600 adult dual eligible beneficiaries in 104 localities, grouped into 5 regions, into capitated managed care plans through the duals demonstration project, called Commonwealth Coordinated Care.61 Commonwealth Coordinated Care includes the state’s home and community-based services (HCBS) waiver for seniors and persons with physical disabilities in the plans’ capitated rate, along with traditional Medicare and Medicaid benefits packages. Enrollment into the demonstration is voluntary for eligible beneficiaries, although they will be auto-enrolled into one of the demonstration plans, unless they take affirmative action to opt out. Savings are deducted prospectively from CMS and the state’s contributions to the Medicare and Medicaid capitated rates.
Health Insurance Marketplace
Virginia is one of 27 states in which the federal government has set up and is running the Health Insurance Marketplace.62 Despite initial plans to set up its own exchange, Virginia opted for a Federally Facilitated Marketplace. However, the state is retaining responsibility for managing and reviewing rates for health plans sold on the Marketplace. Eight insurance providers are offering 106 Qualified Health Plans in Virginia’s Marketplace.63 At $253 per month, Richmond has the 22nd lowest monthly premium for a Benchmark Health plan (defined as the second-lowest cost Silver plan in the rating area) among major cities across the country, before subsidies.64 Of the 823,000 individuals who could potentially enroll in the state’s Marketplace, 518,000 (63%) are estimated to be eligible for premium tax credits.65 As of April 19, 2014, 392,340 individuals had been determined eligible to enroll in a Marketplace plan, of whom 231,534 qualified for financial assistance and 216,356 selected a Marketplace plan.66
Outreach and enrollment support is being provided by the federal government and private organizations. The state of Virginia has not provided any support for outreach and enrollment for the Marketplace. All funding for these efforts has come from the federal government and private organizations, such as Enroll America.67 To assist with ACA outreach and enrollment, 22 of Virginia’s Federally Qualified Health Centers (FQHCs) were awarded $3.8 million for FYs 2013 and 2014 and the Virginia Poverty Law Center, Inc. and Advanced Patient Advocacy, LLC. have been awarded federal navigator grants totaling $1.76 million.68 ,69 Enrollment assistance programs are also building off of the state’s Project Connect program, which has assisted with Medicaid and CHIP enrollment through community organizations and health care providers. Despite these efforts, resources for application and enrollment assistance are considerably less in Virginia compared to states that expanded Medicaid and established their own Marketplaces.70
Safety Net
Virginia’s safety-net delivery system will continue to play an important role in providing health care to the state’s vulnerable population. Virginia’s community health centers and hospitals provide access to needed primary, preventive, and acute care services for low-income and underserved residents. There are no public hospitals owned or operated by local governments in the state and so Virginia’s two large academic medical centers, Virginia Commonwealth University (VCU) Medical Center in Richmond and the University of Virginia Medical Center in Charlottesville, serve as the state’s main safety-net hospitals. Several smaller private, not-for-profit hospitals also play a safety-net role. Seven of Virginia’s hospitals are designated as Critical Access Hospitals and provide 24-hour access to needed emergency medical services in rural areas of the state.71 In 2012, Virginia’s hospitals provided $2.3 billion in charity care, or about $2,300 per uninsured Virginian, the largest share of which was provided by the VCU and University of Virginia Medical Centers.72
Virginia is home to 24 FQHCs, which operated 150 sites, served 284,000 patients, and provided over 1 million patient visits in 2012.73 Thirty-nine percent of patients were uninsured, 22% had Medicaid, and over half (57%) were below 100% FPL.74 Virginia is also home to 57 free clinics that, in 2012, provided an additional 255,000 primary and specialty care visits, as well as 46,600 dental and 22,000 behavioral health care visits, mostly to uninsured patients.75
Despite Virginia’s existing safety-net, the state has Health Professional Shortage Areas (HPSAs) and unmet need for care. As of July 2013, Virginia had 90 HPSAs and only 72% of the primary health care need in the state was being met.76 The state had 50 mental health HPSAs and 83 dental HPSAs, and only 61% of the need for mental health and 47% of the need for dental care in the state was being met.77 Virginia is one of 12 states that have restricted autonomy, increased supervision, and increased licensure requirements for nurse practitioners, while 17 states allow nurse practitioners full autonomy and 21 states have more limited autonomy.78 Meanwhile, community health centers and free clinics report a 20% increase in uninsured patients over the past two years and free clinics report increased wait times, now up to four months for first-time appointments for new patients.79
Virginia is working to strengthen its mental health system. In response to the November 2013 tragedy in which Sen. R Creigh Deeds was attacked by his son, who then killed himself, both houses of the Virginia Legislature approved changes to the state’s mental health system, including increasing the amount of time an individual deemed to be a threat could be involuntarily held or held in emergency custody, additional funding for the state’s mental hospitals to increase capacity, and the establishment of a joint committee to study the state’s mental health system.80 However, the proposals for additional spending are on hold due to the impasse over the state budget. The state’s Office of the Inspector General issued a report in February 2014 concluding that the state spent $28 million for institutional care of patients who were clinically ready to be discharged to community mental health settings, which has further added to the perception that the mental health system is in need of reform.81
Looking Ahead
There is much to watch in Virginia. Individuals who have newly gained coverage in the Marketplace are beginning to interact with their new health plans; Governor McAuliffe and the state legislature are continuing negotiations over the state budget and a final decision on the Medicaid expansion; and the state’s safety-net providers will continue to adapt to the changing health coverage landscape and to provide care to the remaining uninsured. In addition, the state is experiencing changes in its health care delivery system, with the expansion of new models, such as the patient-centered medical home.82 It remains to be seen how these and other changes under the ACA will affect the health, health care access, and health care utilization of Virginians in the future.
Peter Cunningham of Virginia Commonwealth University, Department of Healthcare Policy and Research provided assistance in preparing this fact sheet.
Appendix
- U.S. Census Bureau, Census Regions and Divisions, http://www.census.gov/geo/maps-data/maps/pdfs/reference/us_regdiv.pdf. ↩︎
- World Atlas, United States, http://www.worldatlas.com/aatlas/infopage/usabysiz.htm. ↩︎
- Urban Institute and Kaiser Commission on Medicaid and the Uninsured estimates based on the Census Bureau’s March 2012 and 2013 Current Population Survey (CPS: Annual Social and Economic Supplements). ↩︎
- UI/KCMU estimates based on March 2012 and 2013 CPS. ↩︎
- UI/KCMU estimates based on March 2012 and 2013 CPS. ↩︎
- U.S. Census, Population Distribution and Change: 2000 to 2010 (March 2011), http://www.census.gov/prod/cen2010/briefs/c2010br-01.pdf. ↩︎
- Weldon Cooper Center for Public Service, Demographics Interactive Map: Population Growth (2000-2010) (University of Virginia), http://www.coopercenter.org/demographics/interactive-map/citycounty/3103. ↩︎
- Cai Qian, “A Decade of Change in Virginia’s Population” The Virginia News Letter vol. 87, no. 4(June 2011): 1-6, http://www.coopercenter.org/sites/default/files/publications/Virginia%20News%20Letter%202011%20Vol.%2087%20No%204.pdf. ↩︎
- Bureau of Labor Statistics, Unemployment Rates for State: Monthly Rankings Seasonally Adjusted, March 2014 (April 18, 2014), http://www.bls.gov/web/laus/laumstrk.htm and Bureau of Labor Statistics, The Employment Situation – March 2014 (April 4, 2014), http://www.bls.gov/news.release/pdf/empsit.pdf. ↩︎
- Amanda Noss, Household Income:2012, American Community Survey Briefs (September 2013), http://www.census.gov/prod/2013pubs/acsbr12-02.pdf. ↩︎
- UI/KCMU estimates based on March 2012 and 2013 CPS. ↩︎
- Bureau of the Census, Small Area Income and Poverty Estimates: Percent of total population in poverty, 2012: Virginia (March 12, 2014), http://www.ers.usda.gov/data-products/county-level-data-sets/poverty.aspx#.U1_XhfldUt4. ↩︎
- Bureau of Economic Analysis, Gross Domestic Product by State 2012 (June 6, 2013). ↩︎
- Bureau of Economic Analysis, Gross Domestic Product by State 2008-2012 (June 6, 2013). ↩︎
- Bureau of Economic Analysis, Widespread Economic Growth in 2012 (June 6, 2013), http://www.bea.gov/newsreleases/regional/gdp_state/gsp_newsrelease.htm. ↩︎
- University of Virginia, Industries of Virginia, http://vastudies.pwnet.org/pdf/Economics3.pdf. ↩︎
- Office of Governor Robert McDonnell, “Governor McDonnell Announces $585 Million Budget Surplus for FY 2013” (August 19, 2013), http://www.varoadtothefuture.virginia.gov/viewRelease.cfm?id=1948. ↩︎
- United Health Care Foundation, America’s Health Rankings: State Ranking Overview: 2013 (2013), http://www.americashealthrankings.org/rankings. ↩︎
- Overweight and obesity: 64% of adults in Virginia are overweight or obese, compared to 63% of adults nationally. KCMU analysis of the Center for Disease Control and Prevention (CDC)’s Behavioral Risk Factor Surveillance System (BRFSS) 2012 Survey Results. ↩︎
- Diabetes: 10.6% of adults in Virginia have been told by a doctor that they have diabetes, compared to a national average of 10.2%. KCMU analysis of the Center for Disease Control and Prevention (CDC)’s Behavioral Risk Factor Surveillance System (BRFSS) 2012 Survey Results. ↩︎
- Asthma: 8.4% of adults in Virginia have asthma, compared to 8.6% nationally. 2010 Behavioral Risk Factor Surveillance System (BRFSS), Table C1, analysis by Air Pollution and Respiratory Health Branch, National Center for Environmental Health Centers for Disease Control and Prevention, available at http://www.cdc.gov/asthma/brfss/2010/brfssdata.htm. ↩︎
- Heart Disease: The death rate due to heart disease in Virginia is 168.5/100,000, compared to the national average of 179.1/100,000. The Centers for Disease Control and Prevention (CDC), National Center for Health Statistics, Division of Vital Statistics, National Vital Statistics Report Volume 61, Number 4, Table 19, May 8, 2013. ↩︎
- Cancer: The death rate due to cancer in Virginia is 172.4/100,000, compared to the national average of 172.8/100,000. The Centers for Disease Control and Prevention (CDC), National Center for Health Statistics, Division of Vital Statistics, National Vital Statistics Report Volume 61, Number 4, Table 19, May 8, 2013. ↩︎
- Fair/Poor Health: 14.4% of nonelderly adults in Virginia report being in fair or poor health, compared to 16.2% nationally. KCMU analysis of the Center for Disease Control and Prevention (CDC)’s Behavioral Risk Factor Surveillance System (BRFSS) 2012 Survey Results. ↩︎
- Mental Health: 31% of adults in Virginia report having poor mental health, compared to 36% of adults nationally. KCMU analysis of the Center for Disease Control and Prevention (CDC)’s Behavioral Risk Factor Surveillance System (BRFSS) 2012 Survey Results. ↩︎
- KCMU analysis of the Center for Disease Control and Prevention (CDC)’s Behavioral Risk Factor Surveillance System (BRFSS) 2012 Survey Results. ↩︎
- Robert Wood Johnson Foundation and University of Wisconsin Population Health Institute, County Health Rankings & Roadmaps 2013: Virginia (2013), http://www.countyhealthrankings.org/sites/default/files/states/CHR2013_VA.pdf. ↩︎
- State Health Facts, Life Expectancy at Birth by State and by Race/Ethnicity (Kaiser Family Foundation, 2010), https://modern.kff.org/other/state-indicator/life-expectancy/?state=VA and https://modern.kff.org/other/state-indicator/life-expectancy-by-re/?state=VA. ↩︎
- The mortality rate for heart disease in Virginia is 163.5/100,000 for Whites and 208.2/100,000 for Blacks; the mortality rate in Virginia due to cancer is 169/100,000 for Whites and 205.9/100,000 for Blacks; and the mortality rate due to diabetes in Virginia is 15.7/100,000 for Whites and 36.1/100,000 for Blacks. Centers for Disease Control and Prevention, National Center for Health Statistics. Underlying Cause of Death 1999-2010 on CDC WONDER Online Database, released 2013. Data are from the Multiple Cause of Death Files, 1999-2010, as compiled from data provided by the 57 vital statistics jurisdictions through the Vital Statistics Cooperative Program (July 2013). ↩︎
- KCMU analysis of 2012 Behavioral Risk Factor Surveillance System (BRFSS) Survey Results. ↩︎
- KCMU analysis of 2012 BRFSS. ↩︎
- KCMU analysis of 2012 BRFSS. ↩︎
- Virginia Department of Health Office of Minority Health and Health Equity, Virginia Health Equity Report 2012, http://www.vdh.virginia.gov/OMHHE/2012HEReport/2012%20Hereport.html. ↩︎
- Virginia Commonwealth University, Virginia Coordinated Care Program, http://www.vcuhealth.org/vcc and Mosby Partnership, http://www.healthdisparities.vcu.edu/?id=1336&sid=10. ↩︎
- Virginia Department of Health, Virginia’s State Rural Health Plan (2013), http://www.va-srhp.org/docs/plan/2013Plan-final.pdf. ↩︎
- UI/KCMU estimates based on March 2012 and 2013 CPS. ↩︎
- UI/KCMU estimates based on March 2012 and 2013 ASEC Supplement to the CPS and Kaiser Commission on Medicaid and the Uninsured, Health Coverage and Care in the South in 2014 and Beyond, Appendix Table 3 (Kaiser Family Foundation, April 2014), https://modern.kff.org/disparities-policy/issue-brief/health-coverage-and-care-in-the-south-in-2014-and-beyond/. ↩︎
- UI/KCMU estimates based on March 2012 and 2013 CPS. ↩︎
- UI/KCMU estimates based on March 2012 and 2013 CPS. ↩︎
- Virginia Department of Medical Assistance Services (DMAS), Virginia Medicaid at a Glance (2013), http://www.dmas.virginia.gov/Content_atchs/atchs/va-medprg.pdf. ↩︎
- KCMU/UI estimates based on data from FY 2010 MSIS and CMS-64 reports, 2012. ↩︎
- For FY 2014: Federal Register, November 30, 2012 (Vol 77, No. 231), pp 71420-71423. ↩︎
- Virginia Department of Medical Assistance Services (DMAS), Virginia Medicaid at a Glance (2013). ↩︎
- KCMU estimates based on the NASBO November 2013 State Expenditure Report (data for Estimated SFY 2013). ↩︎
- Virginia Department of Medical Assistance Services, The History of Managed Care in Virginia, Version 2 (July 2012), http://www.dmas.virginia.gov/Content_atchs/mc/mc-hstry.pdf. ↩︎
- Virginia Department of Medical Assistance Services, Managed Care Coverage Map and MCO Characteristics Effective July 2013, http://www.dmas.virginia.gov/Content_atchs/mc/mc-mcc2.pdf. ↩︎
- Virginia Department of Medical Assistance Services, Virginia Medicaid Managed Care 2013 Annual Report: A year of Change Inside and Out, http://www.dmas.virginia.gov/Content_atchs/mc/apr-f8.pdf. ↩︎
- Based on data from the Centers for Medicare and Medicaid Services (CMS), State Medicaid and CHIP Income Eligibility Standards Effective January 1, 2014; accessed October 1, 2013. ↩︎
- KCMU estimates based on CMS, State Medicaid and CHIP Income Eligibility Standards Effective January 1, 2014 (October 1, 2013). ↩︎
- MaryBeth Musumeci, A Guide to the Supreme Court’s Affordable Care Act Decision (Kaiser Family Foundation, June 2012), https://modern.kff.org/health-reform/issue-brief/a-guide-to-the-supreme-courts-affordable/. ↩︎
- Kaiser Commission on Medicaid and the Uninsured, The Coverage Gap: Uninsured Poor Adults in States that Do Not Expand Medicaid (Kaiser Family Foundation, October 2013), http://modern.kff.org/health-reform/issue-brief/the-coverage-gap-uninsured-poor-adults-in-states-that-do-not-expand-medicaid/. ↩︎
- State Health Facts, “Status of State Action on the Medicaid Expansion Decision, 2014” (Kaiser Family Foundation, January 28, 2014), https://modern.kff.org/health-reform/state-indicator/state-activity-around-expanding-medicaid-under-the-affordable-care-act/. ↩︎
- Commission on Medicaid and the Uninsured, A Closer Look at the Impact of State Decisions Not to Expand Medicaid on Coverage for Uninsured Adults (Kaiser Family Foundation, April 2014), https://modern.kff.org/medicaid/fact-sheet/a-closer-look-at-the-impact-of-state-decisions-not-to-expand-medicaid-on-coverage-for-uninsured-adults/. ↩︎
- Governor Terry McAuliffe, “Governor McAuliffe Releases FY2015-16 Budget as Special Session Begins” (March 24, 2014), https://governor.virginia.gov/news/newsarticle?articleId=3650. ↩︎
- Virginia Senate Bill 5003 (April 8, 2014), http://legiscan.com/VA/bill/SB5003/2014/X1. ↩︎
- Rachel Weiner, “Medicaid Expansion in VA Gets a Boost” (Washington Post, January 22, 2014), http://www.washingtonpost.com/local/virginia-politics/medicaid-expansion-in-va-gets-a-boost/2014/01/22/9fcaea0c-83a9-11e3-9dd4-e7278db80d86_story.html. ↩︎
- Virginia Department of Medical Assistance Services, Virginia Medicaid Managed Care 2013 Annual Report: A year of Change Inside and Out. ↩︎
- VA Premier Health Plan, Inc, “Medical Home”, https://www.vapremier.com/medicalhome/patient-centered-medical-home/. ↩︎
- Kaiser Commission on Medicaid and the Uninsured and Urban Institute estimates based on data from FY 2010 MSIS, 2013, https://modern.kff.org/medicaid/issue-brief/medicaids-role-for-dual-eligible-beneficiaries/ ↩︎
- Kaiser Commission on Medicaid and the Uninsured, State Demonstration Proposals to Integrate Care and Align Financing and/or Administration for Dual Eligible Beneficiaries (Kaiser Family Foundation, April 2014), https://modern.kff.org/medicaid/fact-sheet/state-demonstration-proposals-to-integrate-care-and-align-financing-for-dual-eligible-beneficiaries/. For more information, see: MaryBeth Musumeci, Financial and Administrative Alignment Demonstrations for Dual Eligible Beneficiaries Compared: States with Memoranda of Understanding Approved by CMS (Kaiser Family Foundation, April 2014), https://modern.kff.org/medicaid/issue-brief/financial-alignment-demonstrations-for-dual-eligible-beneficiaries-compared/. ↩︎
- Virginia Department of Medical Assistance Services, Integrated Care for Medicare-Medicaid Enrollees, http://www.dmas.virginia.gov/Content_pgs/altc-enrl.aspx. ↩︎
- State Health Facts. “State Decisions for Creating Health Insurance Marketplaces” (Kaiser Family Foundation, May 28, 2013), http://modern.kff.org/health-reform/state-indicator/health-insurance-exchanges/. ↩︎
- State Health Facts, Total Number of Insurers Participating in the Individual Health Insurance Marketplace (Kaiser Family Foundation), https://modern.kff.org/health-reform/state-indicator/total-number-of-insurers-participating-in-the-individual-health-insurance-marketplace/. ↩︎
- This is the monthly premium for a single, 40-year-old at 250% FPL. With premium tax credits, the monthly premium drops to $193. To see how Virginia compares to other states, see: State Health Facts, “ 2014 Monthly Premiums for a Single 40-Year-Old at 250 Percent of Poverty in a Major City in Each State” (Kaiser Family Foundation), https://modern.kff.org/other/state-indicator/2014-monthly-premiums-for-a-single-40-year-old-at-250-percent-of-poverty-in-a-major-city-in-each-state/. ↩︎
- Gary Claxton, et al. State-by-State Estimates of the Number of People Eligible for Premium Tax Credits Under the Affordable Care Act (Kaiser Family Foundation, November 2013), https://modern.kff.org/health-reform/issue-brief/state-by-state-estimates-of-the-number-of-people-eligible-for-premium-tax-credits-under-the-affordable-care-act/. ↩︎
- Office of the Assistant Secretary for Planning and Evaluation (ASPE), Department of Health and Human Services (HHS), Health Insurance Marketplace: Summary Enrollment Report for the Initial Annual Open Enrollment Period (May 1, 2014), http://aspe.hhs.gov/health/reports/2014/MarketPlaceEnrollment/Apr2014/ib_2014Apr_enrollment.pdf. ↩︎
- John Holahan and Rebecca Peters, The Launch of the Affordable Care Act in Selected States: Insurer Participation, Competition, and Premiums (The Urban Institute, March 2014), http://www.urban.org/UploadedPDF/413040-The-Launch-of-the-Affordable-Care-Act-in-Selected-States-Insurer-Participation-Competition-and-Premiums.pdf. ↩︎
- HRSA, Virginia: Health Center Outreach & Enrollment Assistance, http://www.hrsa.gov/about/news/2013tables/outreachandenrollment/va.html. ↩︎
- CCIIO, Navigator Grant Recipients (October 2013), http://www.cms.gov/CCIIO/Programs-and-Initiatives/Health-Insurance-Marketplaces/Downloads/navigator-list-10-18-2013.pdf. ↩︎
- John Holahan and Rebecca Peters, The Launch of the Affordable Care Act in Selected States: Insurer Participation, Competition, and Premiums (March 2014). ↩︎
- Virginia Health Information, A Medical Profile, http://www.vhi.org/hguide_medicalprofile.asp. ↩︎
- Virginia Health Information, Industry Report: 2013, http://www.vhi.org/industry_reports.asp. ↩︎
- National Association of Community Health Centers (NACHC), Virginia Health Center Fact Sheet (April 11, 2014), https://www.nachc.com/client/documents/research/maps/VA14.pdf. ↩︎
- NACHC, Virginia Health Center Fact Sheet (2014). ↩︎
- Virginia Association of Free Clinics, http://www.vafreeclinics.org/how-we-help.asp. ↩︎
- Bureau of Clinician Recruitment and Service, Health Resources and Services Administration (HRSA), U.S. Department of Health & Human Services, HRSA Data Warehouse: Designated Health Professional Shortage Areas Statistics, as of July 29, 2013, http://ersrs.hrsa.gov/reportserver/Pages/ReportViewer.aspx?/HGDW_Reports/BCD_HPSA/BCD_HPSA_SCR50_Smry_HTML&rs:Format=HTML4.0 ↩︎
- HRSA, Designated Health Professional Shortage Areas Statistics, as of July 29, 2013. ↩︎
- American Association of Nurse Practitioners, State Practice Environment 2013, http://www.aanp.org/legislation-regulation/state-legislation-regulation/state-practice-environment. ↩︎
- Virginia Health Care Foundation, http://www.vhcf.org/data/. ↩︎
- Virginia Legislative Information System, SJ 47 Mental health; joint subcommittee to study services in the Commonwealth in twenty-first century (March 8, 2014), http://lis.virginia.gov/cgi-bin/legp604.exe?141+sum+SJ47. ↩︎
- Virginia Office of the State Inspector General, Virginia Department of Behavioral Health and Developmental Services, Discharge Assistance Program Performance Review (February 2014), http://osig.virginia.gov/media/2475/2014-bhds-005dap.pdf. ↩︎
- An example of a new patient-centered Medical home in the state is Virginia Coordinated Care program (VCC) operated by the Virginia Commonwealth University Medical Center. VCC manages the care of about 23,000 low income uninsured people (mostly in the Richmond area) by assigning them to primary care physicians who coordinates their other care needs. VCC recently started a complex care clinic to serve as a patient-centered medical home for VCC patients with chronic conditions and other complex medical needs. Virginia Coordinated Care Program, http://www.vcuhealth.org/vcc. ↩︎