How Are Health Centers Responding to the Funding Delay?
Health centers play an important role in our health care system, providing comprehensive primary care services as well as dental, mental health, and addiction treatment services to over 25 million patients in medically underserved rural and urban areas throughout the country. Health care anchors in their communities and on the front lines of health care crises, including the opioid epidemic and the current flu outbreak, health centers rely on federal grant funds to support the care they provide, particularly to patients who lack insurance coverage. However, the Community Health Center Fund (CHCF), a key source of funding for community health centers, expired on September 30, 2017, and has since been extended through only March 31, 2018. The CHCF provides 70% of grant funding to health centers. With these funds at risk, health centers have taken or are considering taking a number of actions that will affect their capacity to provide care to their patients. This fact sheet presents preliminary findings on how health centers are responding to the funding uncertainty.
A key source of federal funding for #communityhealthcenters expired on September 30, 2017 and has not been renewed for the long term. How are centers responding to the funding delay?
What Funding Is at Stake for Health Centers
The Community Health Center Fund represents 70% of federal grant funding for health centers. Established by the Affordable Care Act, the CHCF increased federal grant fund support for health centers, growing from $1 billion in 2011 to $3.6 billion in 2017.1 Authorized for five years beginning in 2010, and extended for two years through September 2017, the CHCF also provided a more stable source of grant funding for health centers that was separate from the annual appropriations process. Prior to the CHCF, federal 330 grant funds were appropriated annually. In fiscal year 2017, federal section 330 grant funding totaled $5.1 billion, $3.6 billion from the CHCF and $1.5 billion from the annual appropriation.
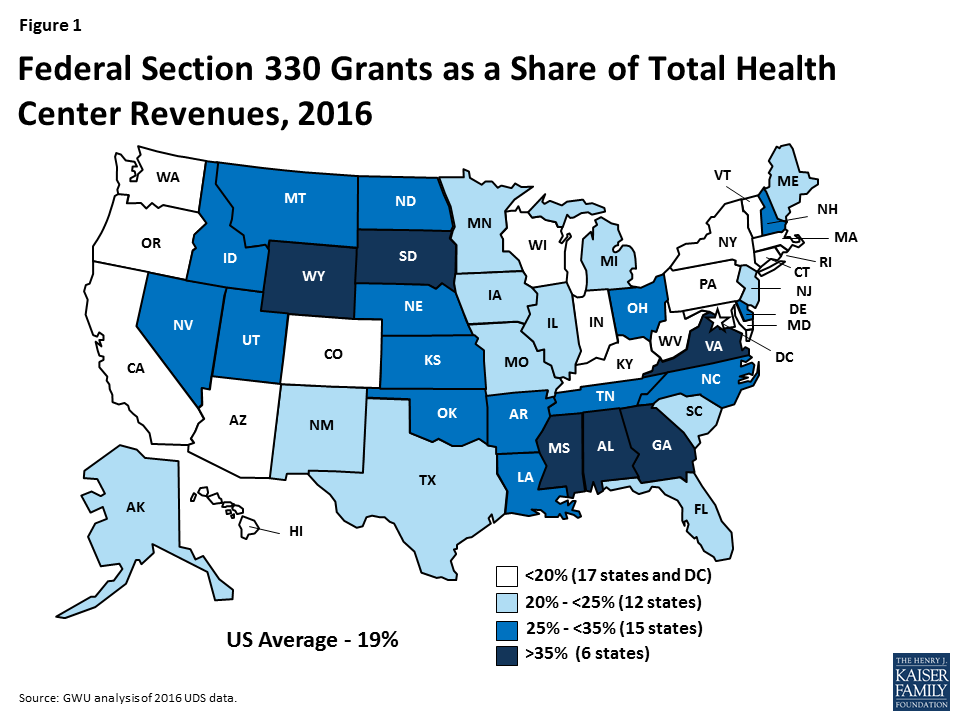
Federal health center grants represent nearly one-fifth of health center revenues. Federal Section 330 grant funds are the second largest source of revenues for health centers behind revenues from Medicaid. Overall, 19% of health center revenues (including US territories) come from federal grants; however, reliance on 330 grant funds varies across health centers. Federal grant funds are especially important for health centers in southern and rural non-expansion states where Medicaid accounts for a smaller share of revenue (Figure 1).2 These funds finance care for uninsured patients and support vital services, such as transportation and case management, that are not typically covered by insurance
How Are Health Centers Responding to the Loss of Federal Funds?
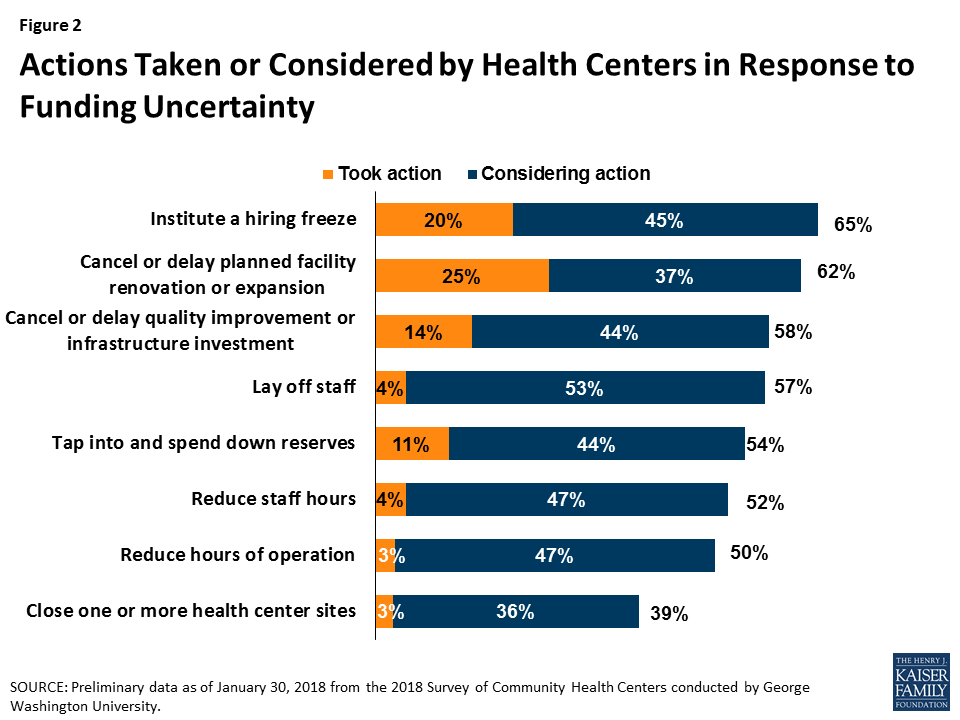
Health centers have taken or are considering taking a number of actions that will affect their ability to serve their patients. Overall, seven in ten responding health centers indicated they had taken or planned to take action to put off large expenditures or curtail expenses in face of reduced revenue. Some of these actions involve delaying or canceling capital projects and other investments or tapping into reserve funds. Other actions, however, have or will reduce the number of staff or the hours they work, which may in turn, affect the availability of services. Already 20% of health centers reported instituting a hiring freeze and 4% have laid off staff. Another 45% are considering a hiring freeze and 53% said they might lay off staff. While health centers seemed to focus on shorter-term actions that could easily be reversed were funding to be restored, 3% of responding health centers had already taken steps to close one or more sites and an additional 36% indicated they are considering doing so (Figure 2).
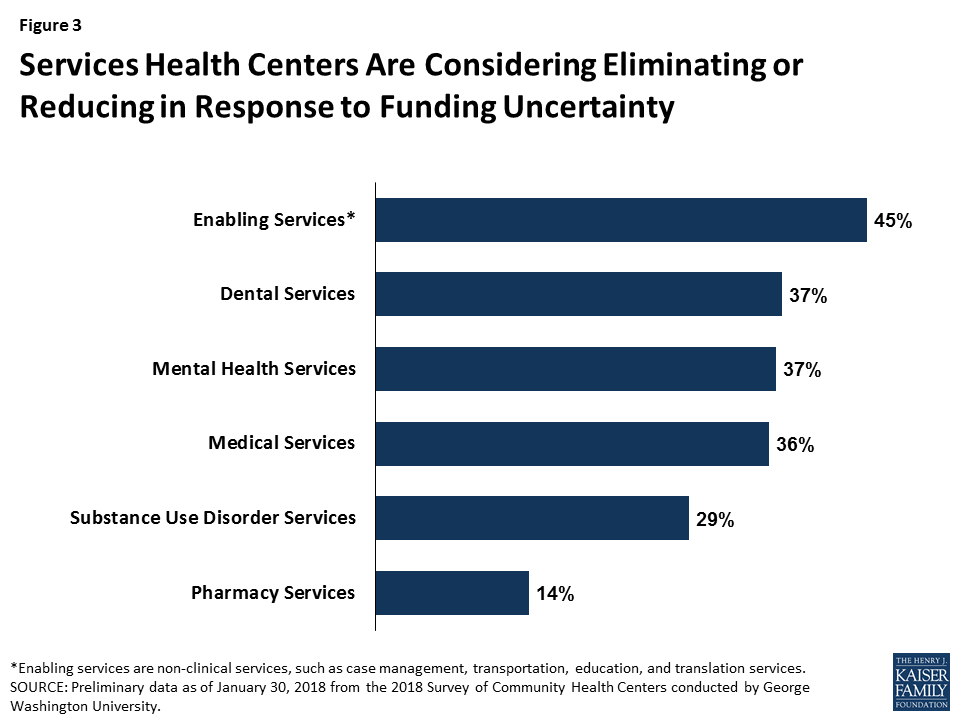
Health centers are considering cuts to patient services. While most health centers have not yet taken steps to cut or reduce patient care services, many reported they are weighing such actions if funding is not restored (Figure 3). Over four in ten indicated they might eliminate or reduce some enabling services, such as case management, translation, or transportation services. Additionally, over a third of reporting health centers indicated they might have to reduce the dental, medical, and/or mental health services they provide while 29% said cuts to addiction treatment services are being contemplated. Fewer health centers reported that cuts to pharmacy services might be made.
What Are the Implications of the Funding Delay?
Continued delays in restoring funding will likely lead to cuts in health center services and staff. To date, health centers have tried to mitigate the effects of the funding delay by forgoing major investments or dipping into reserve funds. However, the longer the funding delay continues, the greater the likelihood health centers will be compelled to cut services and staff, actions they are currently considering but have not yet adopted in large numbers. These cuts could reverse gains health centers have made in recent years in increasing patient care capacity and expanding the range of services they provide, particularly in the areas of mental health and addiction treatment. Health centers play a particularly important role in rural and medically underserved areas. The failure to reauthorize the CHCF and restore health center funding could jeopardize access to care for millions of vulnerable patients.
This analysis is based on preliminary data from the 2018 Survey of Community Health Centers designed by George Washington University’s Geiger Gibson/RCHN Community Health Foundation Research Collaborative and the Kaiser Family Foundation.
| Appendix Table 1: Health Center Delivery Sites, Patients, and Revenues, by State, 2016 | ||||||
| State | Number of Health Centers | Number of Delivery Sites | Total Patients | Total Patient Visits | Total Revenues | Federal BHPC Funding as Share of Total Revenues |
| Alabama | 14 | 128 | 347,694 | 1,084,685 | $173,627,218 | 44% |
| Alaska* | 28 | 183 | 113,027 | 545,430 | $316,966,135 | 20% |
| Arizona* | 21 | 159 | 548,487 | 2,080,644 | $506,266,156 | 16% |
| Arkansas* | 12 | 120 | 195,397 | 721,288 | $157,423,550 | 30% |
| California* | 176 | 1,529 | 4,438,827 | 20,078,878 | $4,922,877,855 | 12% |
| Colorado* | 20 | 202 | 594,959 | 2,446,065 | $571,663,876 | 17% |
| Connecticut* | 16 | 250 | 373,182 | 1,943,325 | $376,031,580 | 14% |
| Delaware* | 3 | 15 | 49,900 | 171,842 | $37,114,507 | 35% |
| District of Columbia* | 8 | 60 | 178,324 | 874,310 | $239,842,150 | 10% |
| Florida | 48 | 535 | 1,397,966 | 5,276,142 | $1,033,408,471 | 21% |
| Georgia | 35 | 225 | 457,644 | 1,437,176 | $294,596,676 | 37% |
| Hawaii* | 14 | 75 | 152,155 | 715,612 | $181,561,177 | 15% |
| Idaho | 14 | 87 | 171,126 | 658,290 | $174,323,258 | 26% |
| Illinois* | 45 | 402 | 1,265,889 | 4,665,853 | $897,271,451 | 21% |
| Indiana* | 25 | 183 | 473,237 | 1,675,508 | $343,283,730 | 20% |
| Iowa* | 14 | 72 | 188,969 | 680,595 | $163,280,598 | 25% |
| Kansas | 18 | 61 | 193,843 | 582,658 | $123,037,617 | 29% |
| Kentucky* | 23 | 232 | 423,515 | 1,609,691 | $344,167,330 | 20% |
| Louisiana* | 34 | 229 | 384,893 | 1,409,006 | $288,753,388 | 31% |
| Maine | 18 | 130 | 186,039 | 818,065 | $179,110,303 | 23% |
| Maryland* | 17 | 126 | 313,411 | 1,478,011 | $370,440,582 | 14% |
| Massachusetts* | 39 | 288 | 751,918 | 3,839,821 | $1,044,753,296 | 11% |
| Michigan* | 39 | 262 | 672,753 | 2,554,782 | $580,783,107 | 21% |
| Minnesota* | 16 | 77 | 174,811 | 675,680 | $171,499,152 | 22% |
| Mississippi | 21 | 203 | 295,052 | 887,060 | $177,107,230 | 41% |
| Missouri | 28 | 228 | 527,054 | 1,925,230 | $431,807,263 | 23% |
| Montana* | 17 | 79 | 106,342 | 407,084 | $104,950,776 | 34% |
| Nebraska | 7 | 48 | 84,556 | 296,136 | $72,574,862 | 26% |
| Nevada* | 5 | 35 | 88,962 | 275,210 | $73,240,156 | 25% |
| New Hampshire* | 11 | 42 | 89,280 | 380,772 | $89,972,159 | 25% |
| New Jersey* | 23 | 144 | 511,947 | 1,892,603 | $330,427,532 | 24% |
| New Mexico* | 17 | 195 | 320,163 | 1,482,714 | $298,922,222 | 23% |
| New York* | 65 | 654 | 2,038,538 | 9,468,465 | $2,023,496,947 | 12% |
| North Carolina | 38 | 229 | 508,599 | 1,771,333 | $370,692,573 | 33% |
| North Dakota* | 4 | 22 | 40,331 | 133,261 | $35,312,258 | 29% |
| Ohio* | 45 | 271 | 667,007 | 2,326,809 | $465,135,801 | 29% |
| Oklahoma | 20 | 98 | 200,937 | 699,203 | $155,357,831 | 34% |
| Oregon* | 31 | 212 | 383,691 | 1,723,557 | $570,120,560 | 15% |
| Pennsylvania* | 44 | 264 | 774,921 | 2,660,676 | $588,427,739 | 19% |
| Rhode Island* | 8 | 55 | 164,057 | 683,021 | $162,316,505 | 16% |
| South Carolina | 22 | 176 | 374,257 | 1,386,551 | $349,309,120 | 23% |
| South Dakota | 5 | 48 | 69,137 | 239,716 | $55,349,502 | 35% |
| Tennessee | 29 | 182 | 396,877 | 1,413,029 | $244,800,059 | 32% |
| Texas | 73 | 466 | 1,309,020 | 4,918,538 | $1,100,636,445 | 22% |
| Utah | 13 | 56 | 151,250 | 496,233 | $125,521,294 | 28% |
| Vermont* | 11 | 66 | 171,828 | 677,293 | $147,117,961 | 14% |
| Virginia | 26 | 145 | 304,756 | 1,093,227 | $217,530,129 | 38% |
| Washington* | 27 | 306 | 1,035,629 | 4,188,973 | $1,084,448,992 | 12% |
| West Virginia* | 27 | 301 | 430,084 | 1,682,705 | $338,912,992 | 19% |
| Wisconsin | 17 | 115 | 303,266 | 1,147,896 | $296,292,458 | 14% |
| Wyoming | 6 | 10 | 17,582 | 53,786 | $17,277,753 | 44% |
| US Total | 1,337 | 10,280 | 25,413,089 | 102,334,438 | $23,419,142,282 | 18%1 |
| NOTES: * Medicaid expansion state. 1 US Total excludes territories. SOURCE: GWU analysis of 2016 UDS data | ||||||
- C. Stephen Redhead et al., Discretionary Spending Under the Affordable Care Act, (Congressional Research Services, 2017), available at https://fas.org/sgp/crs/misc/R41390.pdf (Accessed online January 230, 2018) ↩︎
- Peter Shin et al, What are the Possible Effects of Failing to Extend the Community Health Center Fund? (George Washington University, 2017), available at https://publichealth.gwu.edu/sites/default/files/images/GG%20Health%20Center%20Fund%20Brief_9.18_Final.pdf ↩︎