Most Nonprofit Hospitals and Health Systems Analyzed Had “Adequate” or “Strong” Days of Cash on Hand in 2022, Though About One in Ten Did Not
Introduction
Policymakers, employers, insurers and others have expressed concern about the cost of hospital care in the United States, which totaled $1.4 trillion in 2022, contributing to higher health insurance premiums; lower wages for workers; and greater out-of-pocket spending, medical debt, and barriers to care for patients. At the same time, hospital industry representatives and others have pointed to recent financial challenges facing the sector and have pushed for increases in Medicare and Medicaid reimbursement levels and lobbied against legislation that would reduce hospital revenues, such as through site-neutral payment reform. Operating margins decreased by a large amount between 2021 and 2022. Industry reports suggest that operating margins have improved in 2023 but tend to remain below pre-pandemic levels.
However, operating margins capture only one component of the financial health of hospitals and health systems. This data note examines “days cash on hand”—another measure of financial standing that estimates the number of days that an entity could cover their cash expenses using available reserves. Hospitals and health systems with more days of cash on hand are better able to weather financial challenges, such as low operating margins. This analysis includes nonprofit hospitals and health systems from 2019 through 2022 based on data from S&P Global, a credit rating agency. The S&P data in this analysis include an estimated 56 percent of all nonprofit hospitals and 65 percent of all nonprofit hospital beds but underrepresent entities that are likely to be more financially vulnerable, such as relatively small hospitals, rural hospitals, and hospitals with relatively low commercial prices. See Methods for more details. Highlights include the following:
- In 2022, most nonprofit hospitals and health systems analyzed (73%) had at least “strong” days of cash on hand, though about one in ten (9%) had “vulnerable” or “highly vulnerable” levels. This is based on S&P’s standard categories for days cash on hand, which it uses along with other financial measures, such as operating margins and debt burden, to assign credit ratings to nonprofit hospitals and health systems.
- The majority of nonprofit hospitals and health systems with negative margins in this analysis (60%) had at least “strong” days cash on hand. As might be expected, most nonprofit hospitals and health systems with “vulnerable” or “highly vulnerable” days cash on hand in this analysis (81%) had negative operating margins.
- The average days of cash on hand among nonprofit hospitals and health systems analyzed was similar in 2022 (218 days) to pre-pandemic levels (225 days in 2019).
- The financial reserves (unrestricted cash and investments) of nonprofit hospitals and health systems analyzed increased early in the pandemic before falling in 2022; the latter trend coincided with decreases in the value of stocks and other investments that have likely stabilized or increased with 2023 market improvements.
Discussions about hospitals’ financial challenges often focus on operating margins, though days of cash on hand provide different and complementary information about the financial standing of hospitals and health systems. Operating margins provide useful information about the short-term financial standing of a given hospital or health system, i.e., the extent to which they are earning a profit on patient care and other operating activities. However, two entities with the same operating margins in a given year may be in a much different financial position depending, for example, on their days of cash on hand. Hospitals and health systems with more days of cash on hand are better able to weather financial challenges, such as low operating margins for a period of time. This may be especially salient in the aftermath of the pandemic. Hospitals and health systems with more days of cash on hand also have access to more resources internally that can be used to invest in operations, and they may be able to qualify for lower interest rates when borrowing money, all else equal, both of which may facilitate their growth and competitiveness over the long term. Although having a high level of days cash on hand points to one source of financial strength, it is possible that a given hospital or health system may also have challenges that are captured by other metrics, such as low operating margins or a high debt burden.
Results
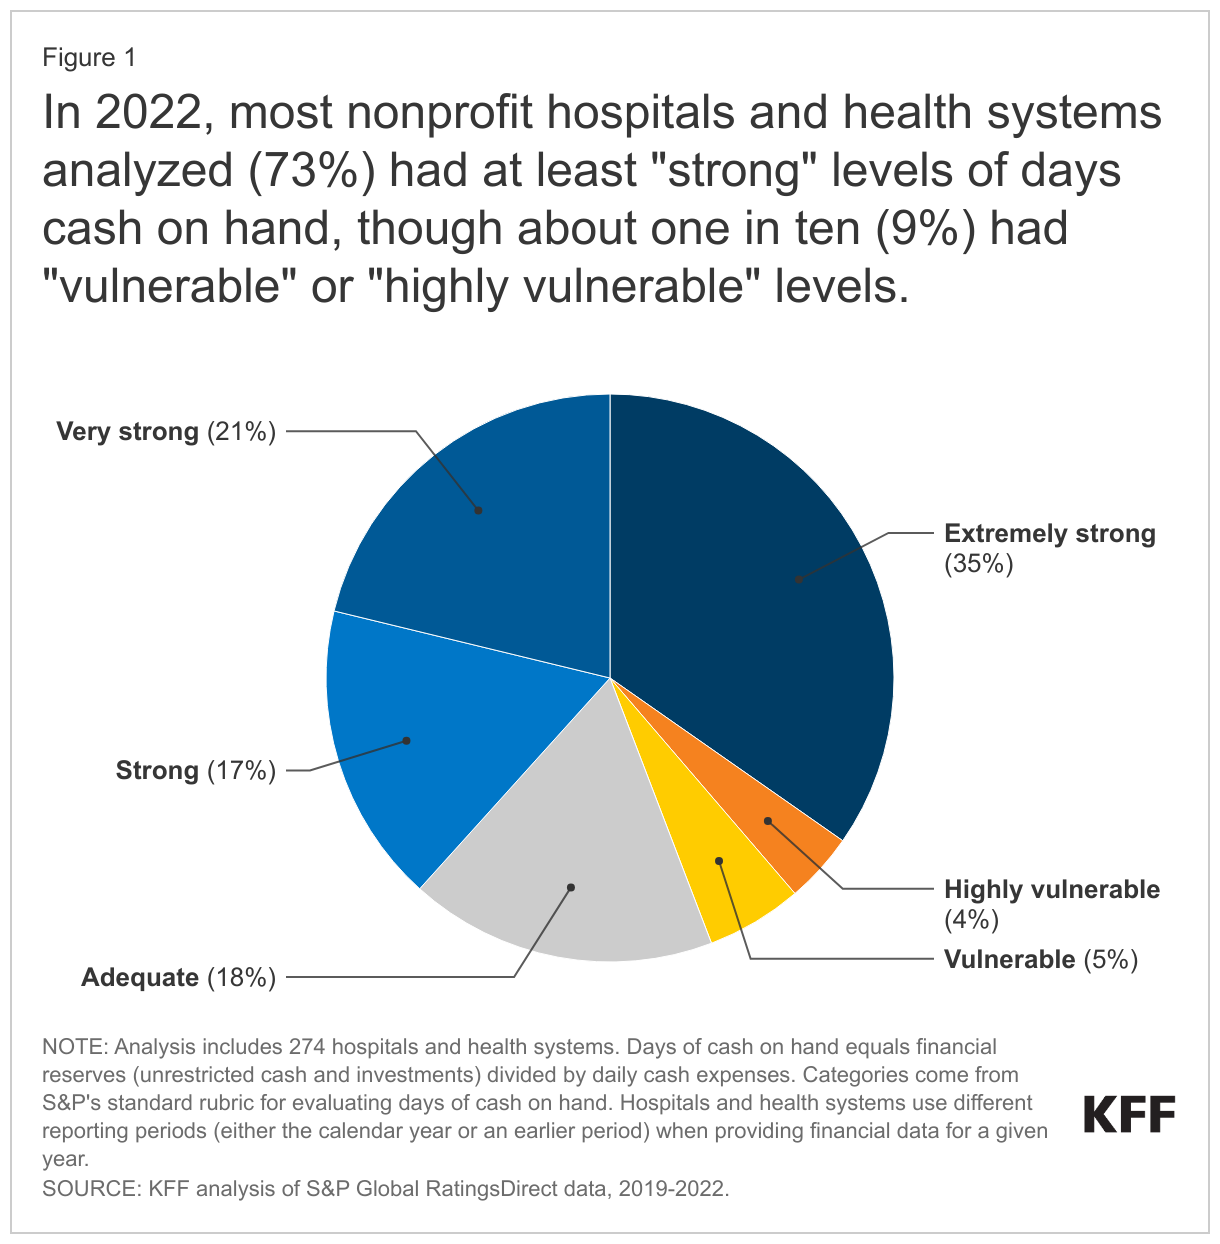
In 2022, most nonprofit hospitals and health systems analyzed (73%) had at least “strong” levels of days cash on hand, though about one in ten (9%) had “vulnerable” or “highly vulnerable” (less than “adequate”) levels. Days of cash on hand is defined as financial reserves (unrestricted cash and investments) divided by daily cash expenses. Categories of this measure (e.g., “strong”) are based on S&P’s standard rubric for evaluating days cash on hand, which it uses along with other financial measures to assign credit ratings to nonprofit hospitals and health systems. Credit ratings indicate the likelihood that entities will be able to repay their long-term debt. S&P’s categories correspond to a range of days cash on hand. For example, “strong” levels correspond to 150-200 days for systems (160-205 days for stand-alone hospitals) and “adequate” levels correspond to 100-150 days for systems (110-160 days for stand-alone hospitals) (See Methods for the complete list). S&P may adjust these categories based on other available information, such as reports that a system is planning to spend some of its reserves on upcoming infrastructure projects.
The total share of nonprofit hospitals and health systems that are “vulnerable or highly vulnerable” in the US is likely to be larger than this estimate derived from S&P data because certain types of hospitals that are more likely to have financial challenges are underrepresented, such as small hospitals, rural hospitals, and hospitals with relatively low commercial prices (see Methods for details about the sample).
The majority of nonprofit hospitals and health systems with negative operating margins in this analysis had at least “strong” levels of days cash on hand in 2022, though, as might be expected, having fewer days of cash on hand among nonprofit hospitals and health systems was associated with negative operating margins in 2022. Sixty percent of the nonprofit hospitals and health systems with negative operating margins in this analysis had at least “strong” levels of days cash on hand in 2022. Hospitals and health systems with more days of cash on hand are better able to weather operating losses, all else equal. Nonetheless, about four out of five (81%) nonprofit hospitals and health systems in this analysis with “vulnerable” or “highly vulnerable” days of cash on hand had negative operating margins in 2022.
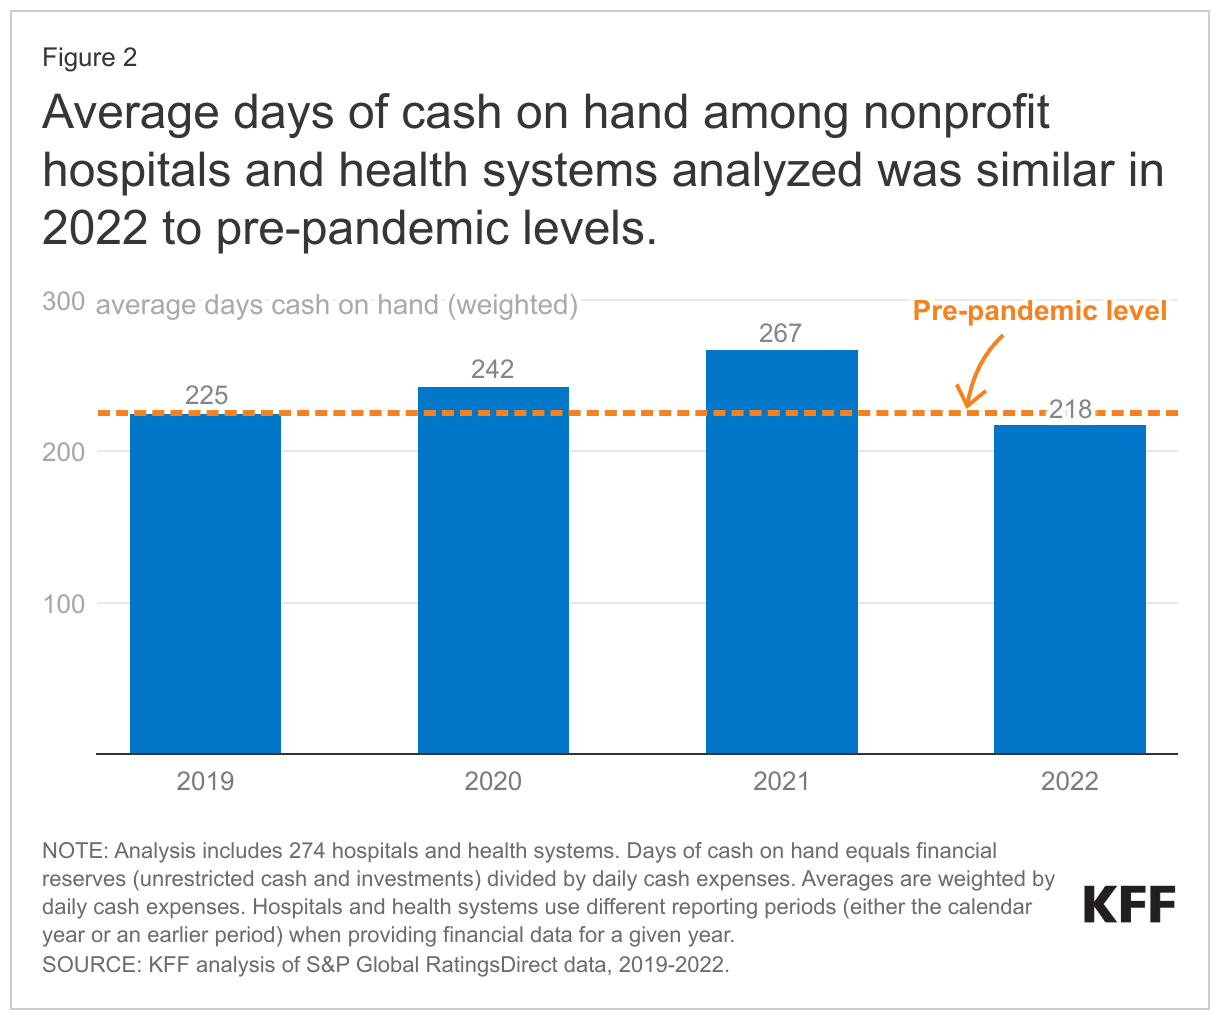
Average days of cash on hand among nonprofit hospitals and health systems analyzed was similar in 2022 to pre-pandemic levels. The nonprofit hospitals and health systems in this analysis had an average of 225 days of cash on hand in 2019 and nearly the same number, 218 days of cash on hand, in 2022, when weighting entities by their daily cash expenses. In the years between, average days cash on hand increased (from 225 days in 2019 to 267 days 2021) before decreasing to an amount close to pre-pandemic levels. To put this in context, S&P generally considers 218 days to be a “very strong” level of days cash on hand. As noted above, it is likely that this analysis excludes nonprofit hospitals and health systems with relatively few days of cash on hand on average, though the hospitals in this analysis encompass a large portion of the nonprofit sector, including an estimated 56 percent of nonprofit hospitals and 65 percent of nonprofit hospital beds.
Financial reserves and daily cash expenses among nonprofit hospitals and health systems analyzed increased by a similar rate from 2019 to 2022. Financial reserves are defined to include all cash and investments (such as stocks) that are “unrestricted” (i.e., available for any purpose), while daily cash expenses reflect annual operating expenses minus non-cash expenses (i.e. depreciation and amortization), divided by 365 (see Methods for more on definitions). From 2019 to 2022, total financial reserves and daily cash expenses among nonprofit hospitals and health systems grew by a similar rate: 23% and 27%, respectively (data not shown). Daily cash expenses increased throughout this period likely due in part to increases in labor costs and increases in the cost of medical and other supplies as a result of high inflation rates. Financial reserves increased at a faster rate than expenses in 2020 and 2021 before dropping in 2022. Financial reserves may grow due to many factors, including profits from patient care and other operating activities, income from investments (such as stock dividends), increases in the market value of investments, profits from the sale of investments, income from selling off nonfinancial assets (such as property or joint venture businesses), and new loans (to the extent that they exceed the amount repaid on existing loans). Financial reserves may decrease for similar but opposite reasons and other factors, such as spending on new buildings, medical equipment, and information systems. Growth in the size of hospitals and health systems through mergers and acquisitions could also contribute to increases in both financial reserves and daily cash expenses over time.
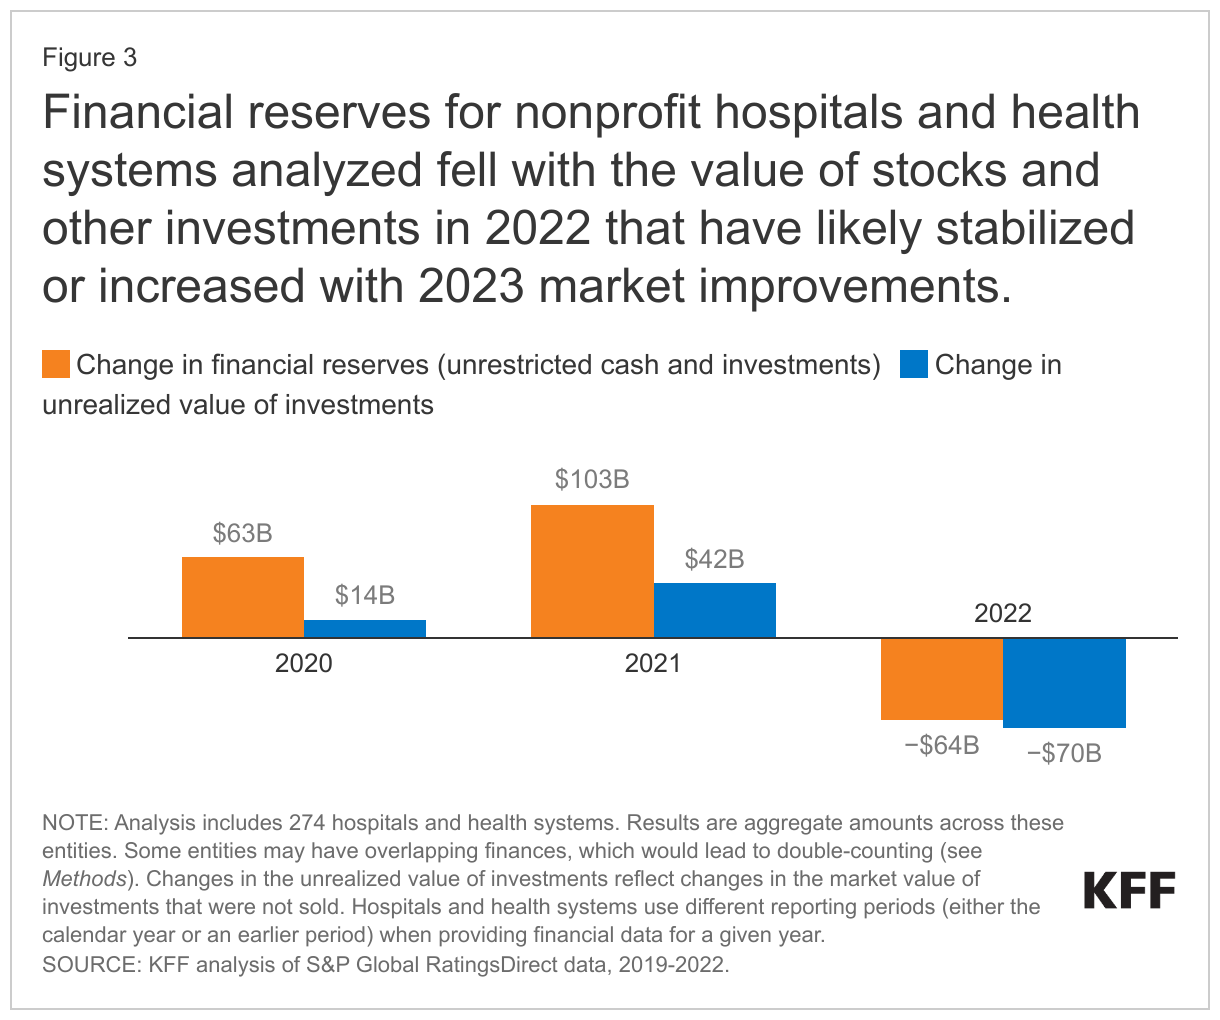
Financial reserves for nonprofit hospitals and health systems analyzed fell with the value of stocks and other investments in 2022 that have likely stabilized or increased with 2023 market improvements. Financial reserves fell by $64 billion in 2022 among the nonprofit hospitals and health systems in this analysis while the market value of their stocks and other financial investments decreased by $70 billion. If stocks and other financial investments had instead retained their value in 2022, then financial reserves would have increased by $6 billion rather than decreasing by $64 billion among the nonprofit hospitals and health systems in this analysis (and average days of cash on hand would have fallen by 22 days rather than 49 days in that year).
The value of financial investments among nonprofit hospitals and health systems have likely stabilized or increased with 2023 market improvements. For example, the S&P 500 increased by 24 percent in calendar year 2023 after decreasing by 20 percent in calendar year 2022. Nonetheless, data are not yet available to provide a full picture of how nonprofit hospital and health system stock portfolios and other investments have performed in 2023.
While financial reserves decreased in 2022, they increased by a larger amount earlier in the pandemic, leading to an overall increase from $446 billion in 2019 to $548 billion in 2022 among the nonprofit hospitals and health systems in this analysis, a $102 billion change. Hospitals and health systems received large amounts of government relief during the COVID-19 pandemic that may have contributed to this increase in financial reserves. Had hospitals not received pandemic relief dollars, operating losses, as applicable, would need to have been covered with existing financial reserves or cash obtained through other means (such as by taking out new loans or selling assets, like property). Pandemic relief dollars and other one-time sources of operating revenue, together known as “nonrecurring operating revenues”, totaled $52 billion from 2019 through 2022 among the nonprofit hospitals and health systems in this analysis, most of which, $29 billion, was received in 2020. It is likely that pandemic relief dollars made up the large majority of these nonrecurring operating revenues, as totals jumped from $13 million in 2019 to $29 billion in 2020 (i.e., the beginning of the pandemic) among the nonprofit hospitals and health systems in this analysis (before falling to $14 billion in 2021 and $8 billion in 2022).
Discussion
Many nonprofit hospitals and health systems had at least “strong” levels of days cash on hand in 2022, and averages among a large number of nonprofit entities were similar in 2022 to pre-pandemic levels. This result adds some nuance to recent stories about the financial challenges facing hospitals and health systems, which have informed policy debates about government reimbursement and funding for these entities. Although operating margins dropped by a large amount in 2022—likely due to the erosion of pandemic relief funds, costs associated with labor shortages, and increased supply expenses due to high inflation rates, among other factors—many nonprofit hospitals and health systems had a large financial cushion as of 2022 to help weather these challenges. Reports suggest that operating margins have improved in 2023—perhaps due to decreases in labor expenses and increases in volume and reimbursement rates, among other factors—but that they tend to remain below pre-pandemic levels. As hospitals continue to adjust to these financial challenges, those with more days of cash on hand will be better positioned to absorb operating losses, all else equal.
About ten percent of nonprofit hospitals and health systems in this analysis had “vulnerable” or “highly vulnerable” levels of days cash on hand in 2022, and it is likely that the percent would be higher if the analysis included all nonprofit hospitals and health systems in the US. While this analysis includes more than half of all nonprofit hospitals, it underrepresents certain types of hospitals that may be more likely to have financial challenges, such as small hospitals, rural hospitals, and hospitals with relatively low commercial prices. About four in five of the entities in this analysis with “vulnerable” or “highly vulnerable” levels of days cash on hand also had negative operating margins. This subset of nonprofit hospitals and health systems could be especially challenged to maintain current services or remain open. At the same time, 60 percent of the nonprofit hospitals and health systems in this analysis with negative operating margins had at least "strong" days cash on hand, suggesting some capacity to manage through challenging times.
Better, more complete, and standardized information about the days of cash on hand at hospitals and health systems could provide policymakers with a greater understanding of the financial status of these entities and which entities have a weaker or stronger footing. The federal government does not currently collect standardized information about days of cash on hand, which is why this analysis relies on data provided by S&P. Information about profitability is often based on cost reports submitted by many hospitals to the federal government, but cost reports are less standardized than the data used for this analysis and are missing key details that are necessary to provide reliable information about days of cash on hand. Some states have begun to fill in gaps in financial data by requiring that hospitals and health systems report additional and more standardized information. Such information would improve the understanding of how financially vulnerable hospitals are performing and inform policy pertaining to hospital costs and finances.
Methods
Data. We obtained financial data for a large number of nonprofit entities from S&P Global RatingsDirect, which collects and standardizes information from audited financial statements as part of their process for generating credit ratings. These financial data typically encompass every component of a given health system, including hospitals, other providers, and, in some cases, health plans (the largest example being Kaiser Permanente). Hospitals and health systems use different reporting periods for their audited financial statements in a given year. For 2022, the three most common reporting periods accounted for the large majority (96%) of hospitals and health systems in our analysis: January 2022 to December 2022 (39% of hospitals and health systems), July 2021 to June 2022 (33%), and October 2021 to September 2022 (25%). When focusing on entities with calendar year reporting periods, we found a slightly larger decrease in average days of cash on hand (from 226 to 214 days).
In some instances, S&P data may include entities with overlapping financial data (e.g., a health system and a subset of the health system that was recently acquired and continues to receive a credit rating), which would lead to double-counting. We attempted to identify these cases by flagging: (1) entities with the same ultimate parent organization in S&P's data and (2) entities that were matched to the same health system based on information from the American Hospital Association (AHA) Annual Survey Database (see below). In those rare instances, we retained the larger entity.
We relied on the American Hospital Association (AHA) Annual Survey Database to help create and describe our sample (see below). We matched S&P entities to AHA data using a combination of name, ZIP code, and state. We linked S&P entities that could not be matched based on these variables through a manual review process. Our matches could be inaccurate in some instances for a variety of reasons. For example, S&P and AHA data could identify system membership differently in certain scenarios, in which case we may include some hospitals that are not part of the financial data for a given system or exclude some hospitals that are.
Measures. Our analysis focuses on days of cash on hand, which equals financial reserves divided by daily cash expenses. Financial reserves are defined to include all unrestricted cash and investments (such as stocks) but to exclude restricted cash and investments, which are legally constrained to serve a particular purpose (such as to fund the construction of a new facility). Daily cash expenses are defined as (operating expenses – depreciation and amortization) / 365. Categories of days cash on hand are based on S&P’s standard rubric (though the agency may adjust these categories based on other available information, such as reports that a system is planning to spend some of its reserves on upcoming infrastructure projects). Categories include the following:
- Extremely strong: >275 days for standalone hospitals; >250 days for systems
- Very strong: 205-275 days for standalone hospitals; 200-250 days for systems
- Strong: 160-205 days for standalone hospitals; 150-200 days for systems
- Adequate: 110-160 days for standalone hospitals; 100-150 days for systems
- Vulnerable: 80-110 days for standalone hospitals; 70-100 days for systems
- Highly vulnerable: <80 days for standalone hospitals; <70 days for systems
Our analysis includes average days of cash on hand weighted by daily cash expenses as well as some total dollar amounts (e.g., aggregate financial reserves). Larger health systems, by definition, contribute more to weighted averages and total dollar amounts. For example, the five largest health systems accounted for 22% percent of total daily cash expenses in 2022. The number of and trends in days of cash on hand were similar when looking at medians (224 in 2019 and 217 in 2022), which do not give additional weight to larger health systems. Similarly, most nonprofit hospitals and health systems in this analysis trended in the same direction as aggregate dollar amounts, with most exhibiting overall increases in financial reserves and daily cash expenses from 2019 and 2022 (84% and 98% of entities, respectively). Although there tended to be an increase in cumulative financial reserves from 2019 through 2022, most entities (88%) experienced decreases in financial reserves in 2022 and in the market value of financial investments (94% of entities) in that year. Nearly half (46%) of those with decreases in financial reserves in 2022 also had larger decreases in the market value of financial investments.
From 2020 through 2022, days cash on hand was higher than it otherwise would have been by what was likely a small number of days due to the deferral of Social Security payroll taxes under the Coronavirus, Aid, Relief and Economic Security (CARES) Act. In particular, employers were allowed to defer their share of these taxes that would otherwise have been due from March 27 through December 31, 2020. They were required to pay at least half of the deferred amount by December 31, 2021 and any remainder by December 31, 2022. We evaluated the magnitude of this benefit based on cleaned financial data for eight health systems in Massachusetts with October to September reporting periods. Among these health systems, the payroll tax deferral had the largest effect on days cash on hand in 2021 (ranging from zero to six days for an average of four days) and the smallest effect in 2022 (ranging from zero to three days for an average of one day). About four in ten (39%) hospitals and health systems evaluated in this data note had calendar year reporting periods; the payroll tax deferral should not have affected days cash on hand for these entities in 2022 if it were fully repaid by December 31, 2022, as required. S&P data on financial reserves and days cash on hand do not include Medicare advance payments.
Sample. We excluded some S&P hospitals and health systems from our analysis. First, we dropped for-profit hospitals and health systems. For-profit entities tend to maintain low financial reserves—and therefore have low days of cash on hand—as they face pressure to return excess cash to stockholders through dividends. Second, we excluded public hospitals and health systems, as there are a relatively small number of these entities in S&P data. Third, we excluded hospitals and health systems that were missing data for at least one year from 2019 through 2022. Fourth, we excluded hospitals and health systems when most of the reporting period for a given year fell in the prior calendar year (e.g., April 2021 to March 2022 reporting periods for 2022). Fifth, we dropped a small number of entities that appeared to overlap with others. Sixth, we dropped a small number of entities based in the US Territories. Finally, we dropped entities that we were unable to match to AHA data, which helped us narrow the sample to private, nonprofit hospitals and health systems. We defined nonprofit systems as those in which a majority of member hospitals were nonprofit.
After these changes, our analysis included 274 nonprofit hospitals and health systems. Based on our match to AHA data, these entities accounted for an estimated 56 percent of nonprofit hospitals in 2021 and 65 percent of nonprofit hospital beds.
Our analysis encompasses a large portion of nonprofit hospitals and health systems, but it excludes, among other entities, those that have not applied for a credit rating through S&P. To evaluate how representative our data are, we compared the characteristics of nonprofit hospitals with cost report data that could and could not be matched to S&P entities based on: (1) RAND Hospital Data, which is a cleaned and processed version of annual cost report data submitted by Medicare-certified hospitals to the Healthcare Cost Report Information System (HCRIS), (2) the RAND Price Transparency Study, and (3) AHA data. We found that our sample underrepresents small hospitals, rural hospitals, hospitals that are not part of a multihospital system, and hospitals with relatively low commercial prices. Excluded hospitals also had lower operating margins on average in 2022 but appeared to be similar to included hospitals based on Medicaid inpatient discharge shares. Our analysis excluded government hospitals, which tend to have lower days of cash on hand, as well as for-profit hospitals, which tend to maintain less financial reserves due to their organizational structure.
Although our analysis includes a distinct set of hospitals and health systems, it also encompasses a large portion of the nonprofit sector. Other, more comprehensive hospital data, such as HCRIS or AHA survey data, do not include reliable information about days of cash on hand. For example, cost reports collect information at the hospital level, but financial reserves are often held at the system level. In those scenarios, cost report data would understate the financial reserves that are available to the hospital.
This work was supported in part by Arnold Ventures. KFF maintains full editorial control over all of its policy analysis, polling, and journalism activities.
Nancy Kane, an independent consultant, provided input for this analysis.