10 Essential Facts About Medicare’s Financial Outlook
Medicare, the nation’s federal health insurance program for 57 million people age 65 and over and younger people with disabilities, often plays a major role in federal health policy and budget discussions. This was the case in discussions leading up to enactment of the Affordable Care Act (ACA), which, in addition to expanding health insurance coverage, included changes to Medicare that reduced program spending. Medicare is likely to be back on the federal policy agenda as Congress debates repealing and replacing the ACA, and also if policymakers turn their attention to reducing entitlement spending as part of efforts to reduce the growing federal budget deficit and debt.
By many measures, Medicare’s financial status has improved since the ACA passed in 2010, and repealing the ACA’s provisions related to Medicare would increase program spending and worsen the financial outlook for the program. But even if the Medicare savings and revenue provisions in the ACA are retained, Medicare faces long-term financial pressures associated with higher health care costs and an aging population. To sustain Medicare for the long run, policymakers may need to consider additional program changes to modify program revenues, benefits, spending, and financing.
This brief presents 10 facts and figures about Medicare’s financial status today and the outlook for the future.
1. Medicare isn’t “going broke” even though it does face financial challenges.
When some policymakers talk about Medicare as being “bankrupt” or “going broke” they are referring to the status (or “solvency”) of Medicare’s Hospital Insurance (Part A) trust fund, out of which beneficiaries’ hospital bills are paid. When spending on benefits exceeds revenues (primarily payroll taxes), and assets in the trust fund account are fully depleted, Medicare will not have sufficient funds to pay all Part A benefits. Currently, Medicare’s actuaries estimate that there will be sufficient funds available to pay for hospital insurance benefits in full until 2028 (Figure 1). At that point, Medicare will be able to cover 87% of costs covered under Part A through payroll tax revenues—but the Medicare program will not cease to operate.
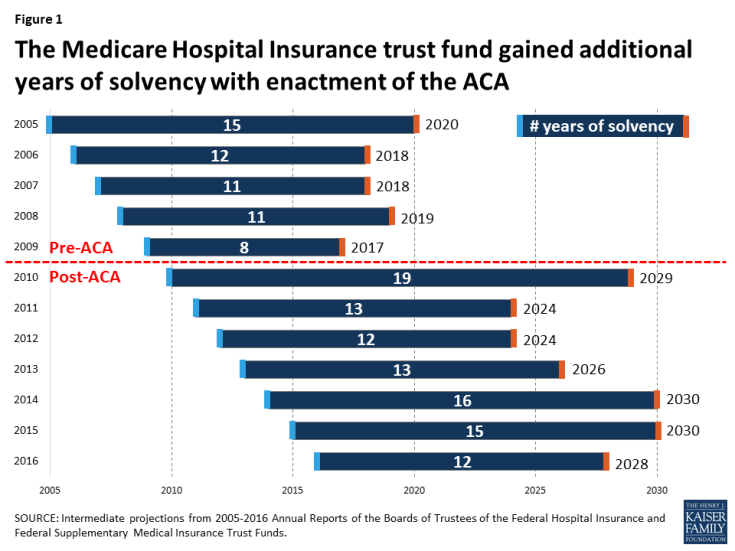
Figure 1: The Medicare Hospital Insurance trust fund gained additional years of solvency with enactment of the ACA
2. The aging of the U.S. population, along with higher health care costs, are contributing to the growth in Medicare spending over time.
Between 2010 and 2050, the population ages 65 and older will double, from about 40 million to 84 million people. The number of people ages 80 and older will nearly triple over these years from about 11 million to about 31 million, while the number of people in their 90s and 100s is projected to quadruple from 2 million to 8 million by 2050 (Figure 2). Because Medicare per capita spending rises with age and people age 80 and over account for a disproportionate share of Medicare spending, their higher numbers will place upward pressure on both total and per capita Medicare spending.
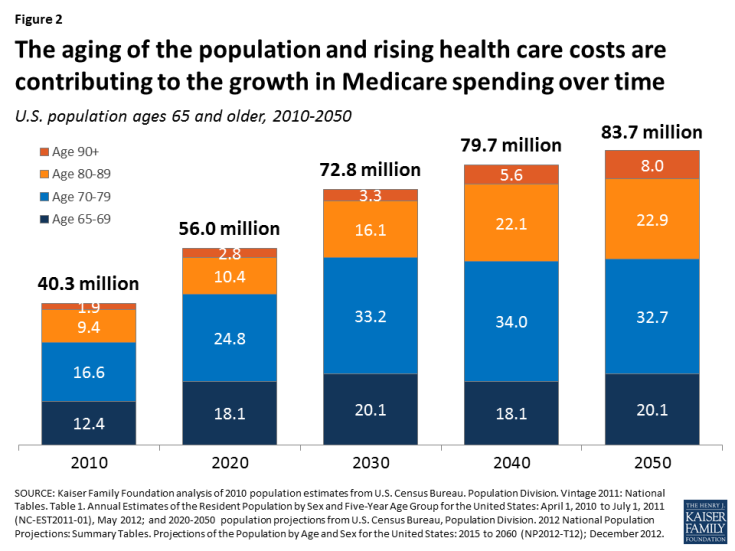
Figure 2: The aging of the population and rising health care costs are contributing to the growth in Medicare spending over time
3. The ACA helped to reduce Medicare spending growth in the years following its enactment.
With provisions in the ACA to reduce Medicare payments to providers and Medicare Advantage plans and bring in additional revenues, Medicare total and per capita spending growth rate has been lower in recent years than in the decade prior to ACA. The overall program spending growth rate fell from 9.0% between 2000 and 2010 to 4.4% between 2010 and 2015, even as the baby boom generation started aging onto Medicare beginning in 2011. Average annual growth in spending per beneficiary averaged 1.4% between 2010 and 2015, down from 7.4% between 2000 and 2010 (Figure 3).
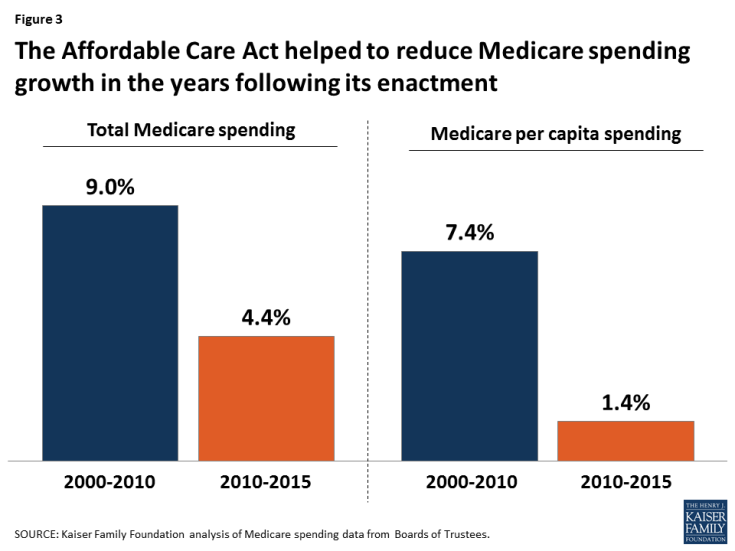
Figure 3: The Affordable Care Act helped to reduce Medicare spending growth in the years following its enactment
4. Repealing the ACA, including all Medicare provisions, would increase Medicare spending.
According to CBO, repealing the ACA in its entirely would add $802 billion to Medicare spending over 10 years (Figure 4). Medicare spending would rise primarily as a result of repealing the ACA’s reductions to payments to providers and Medicare Advantage plans. An increase in Medicare spending would likely lead to higher premiums, deductibles, and cost sharing for beneficiaries, and would accelerate the projected insolvency date of the Medicare Hospital Insurance trust fund.
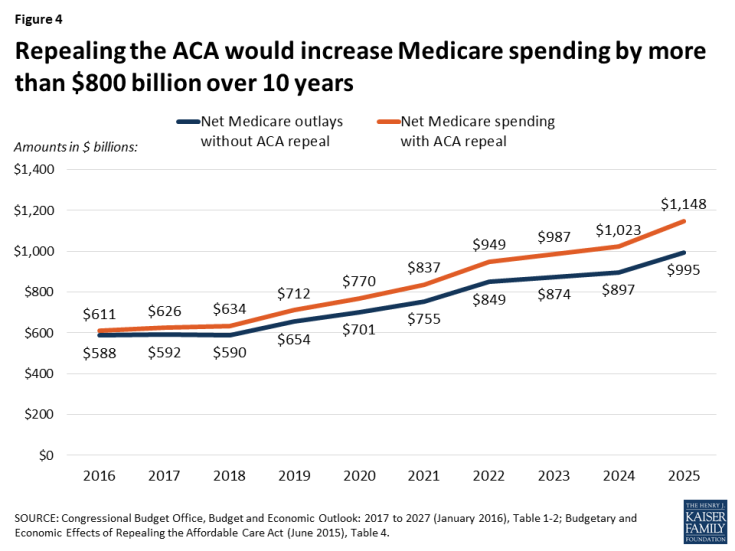
Figure 4: Repealing the ACA would increase Medicare spending by more than $800 billion over 10 years
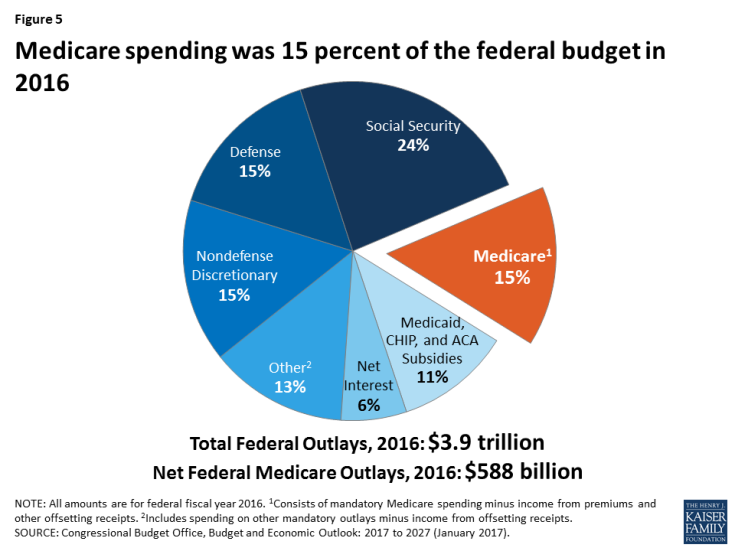
5. Medicare spending was 15 percent of the federal budget in 2016.
Net Medicare spending in 2016 (that is, spending on benefits minus premiums from beneficiaries and other receipts) was $588 billion. This represents 15% of the $3.9 trillion federal budget that year, or $1 out of every $7 in federal spending (Figure 5).
6. Medicare spending is projected to increase gradually as a share of the federal budget and the nation’s economy over the next 10 years.
In 2027, Medicare spending will account for 18% of the federal budget—or $1 out of every $6 in federal spending—and 4.2% of the economy (Figure 6). Between 2017 and 2027, net Medicare spending will nearly double, from $592 billion to $1.2 trillion.
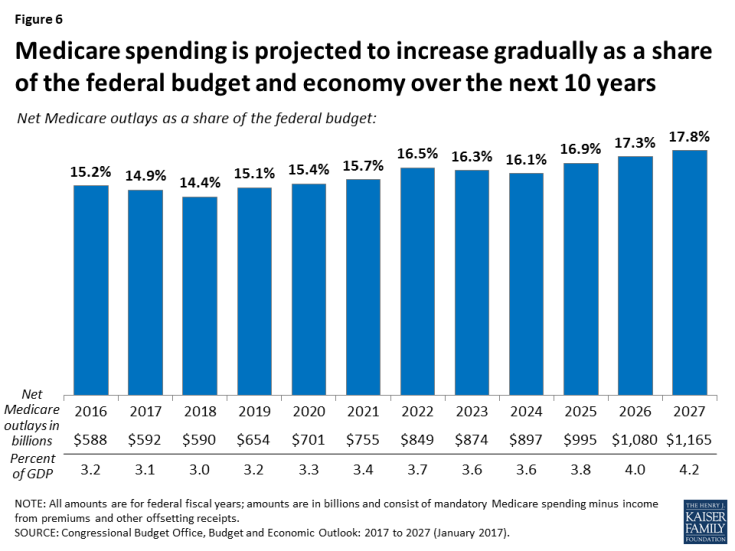
Figure 6: Medicare spending is projected to increase gradually as a share of the federal budget and economy over the next 10 years
7. Medicare spending is projected to increase at a faster rate in the coming years than in the five years following enactment of the ACA.
Average annual growth in total Medicare spending is projected to be 7.1% between 2015 and 2025, faster than the 4.4% average annual growth rate between 2010 and 2015 (Figure 7). On a per capita basis, Medicare spending is expected to grow at an average annual rate of 4.3% between 2015 and 2025, faster than the 1.4% growth rate between 2010 and 2015.
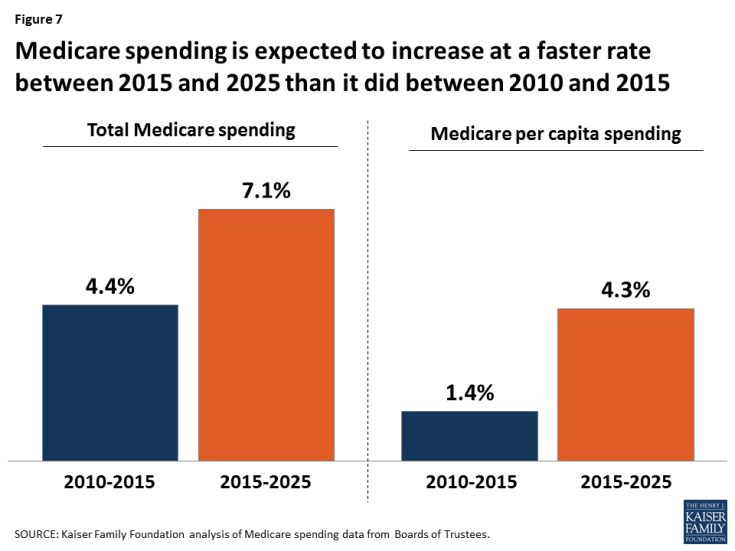
Figure 7: Medicare spending is expected to increase at a faster rate between 2015 and 2025 than it did between 2010 and 2015
8. Spending on Part D prescription drug coverage is expected to grow faster than spending on other Medicare-covered benefits over the next 10 years.
Rising spending on prescription drugs poses a challenge for Medicare. Medicare’s actuaries project a comparatively higher per capita growth rate in the coming years for Part D than for the other parts of the program. Between 2015 and 2025, per capita spending growth is projected to be 5.8% for Part D, compared to 3.2% for Part A, which covers hospital benefits, and 4.6% for Part B, which covers physician and outpatient services (Figure 8). The faster growth rate expected for Part D spending is primarily due to higher costs associated with expensive specialty drugs.
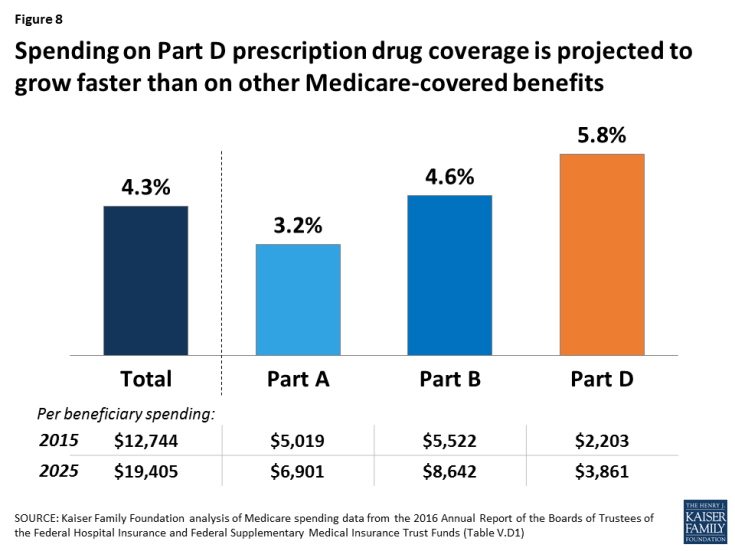
Figure 8: Spending on Part D prescription drug coverage is projected to grow faster than on other Medicare-covered benefits
9. Medicare spending is projected to increase as a share of the economy over the long run, but the ACA helped to moderate the long-range projections.
According to CBO’s most recent long-term projections, net Medicare spending will grow from 3.2% of GDP in 2016 to 5.7% in 2046 (Figure 9). Prior to the ACA, Medicare spending was projected to grow more rapidly as a share of the nation’s economy, reaching 8.5% by 2046.

Figure 9: Medicare spending is increasing as a share of the economy, but the ACA helped to moderate long-run projections
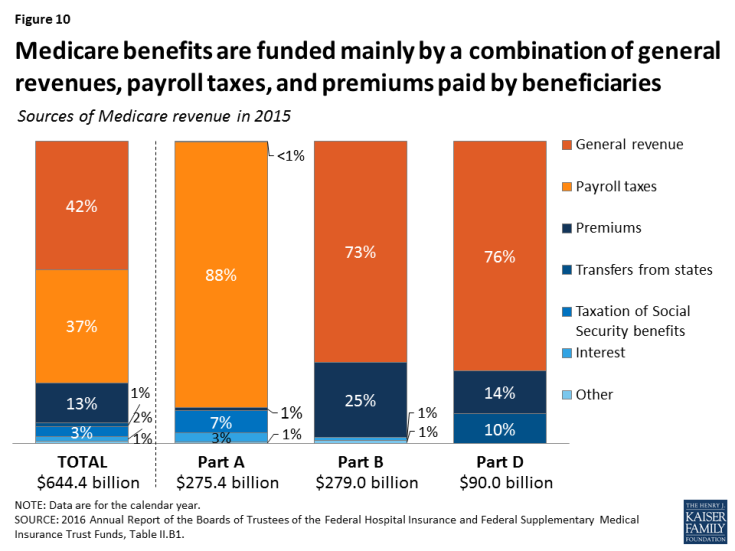
10. Medicare benefits are funded mainly by a combination of general revenues, payroll taxes, and premiums paid by beneficiaries.
The Hospital Insurance (Part A) trust fund is only one part of Medicare, and therefore only one part of Medicare’s financial picture. While Part A is funded primarily by payroll taxes, benefits for Part B physician services and Part D prescription drugs are paid for separately through a combination of general revenues and beneficiary premiums (Figure 10). Because the revenues needed to fund Part B and Part D program costs are set each year in advance, the trust fund for these parts of Medicare does not face a funding shortfall at any point in the future. But higher projected spending for benefits covered under Part B and Part D will increase the amount of general revenue funding and beneficiary premiums required to cover costs for these parts of the program in the future.

