Women’s health outcomes are shaped not only by access to care, health insurance, and affordability, but also by the social and economic factors that drive health, discrimination, and experiences within the health care system. When people feel discriminated against or are treated disrespectfully in healthcare settings, they are more likely to avoid medical care, which can lead to worse health outcomes, especially among more at-risk populations.
This data note presents findings from the 2024 KFF Women’s Health Survey on women’s experiences with disrespectful and unfair treatment as well as negative interactions with providers during health care visits in the past two years. The 2024 KFF Women’s Health Survey was fielded from May 15 to June 18, 2024, and was developed and analyzed by KFF staff. It is a nationally representative survey of 5,055 women and 1,191 men ages 18 to 64. See the methodology for detailed definitions, sampling design, and margins of sampling error.
Disrespectful or Unfair Treatment
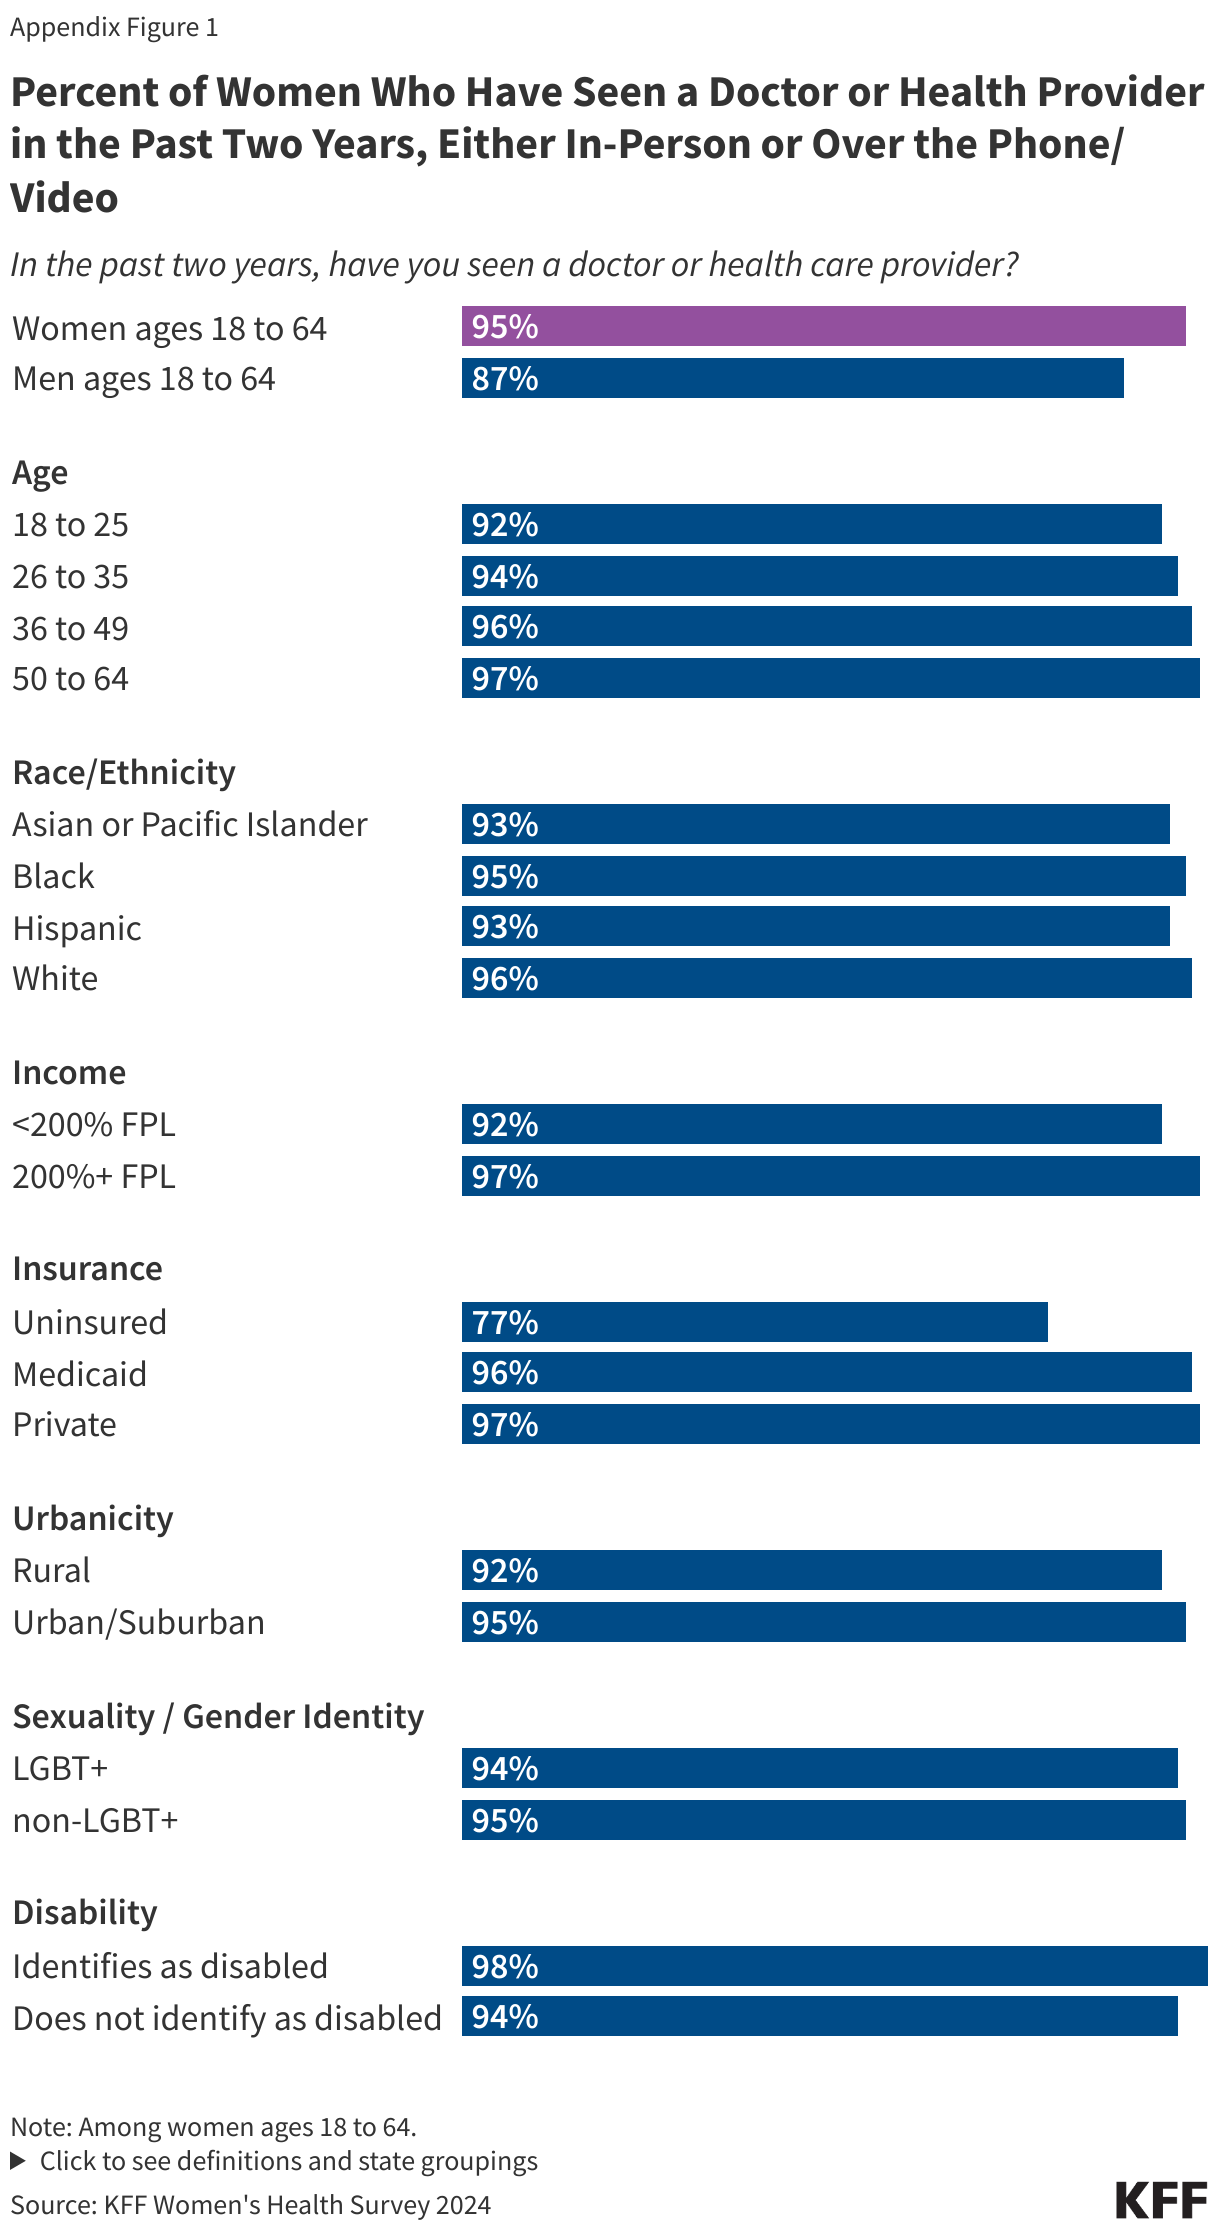
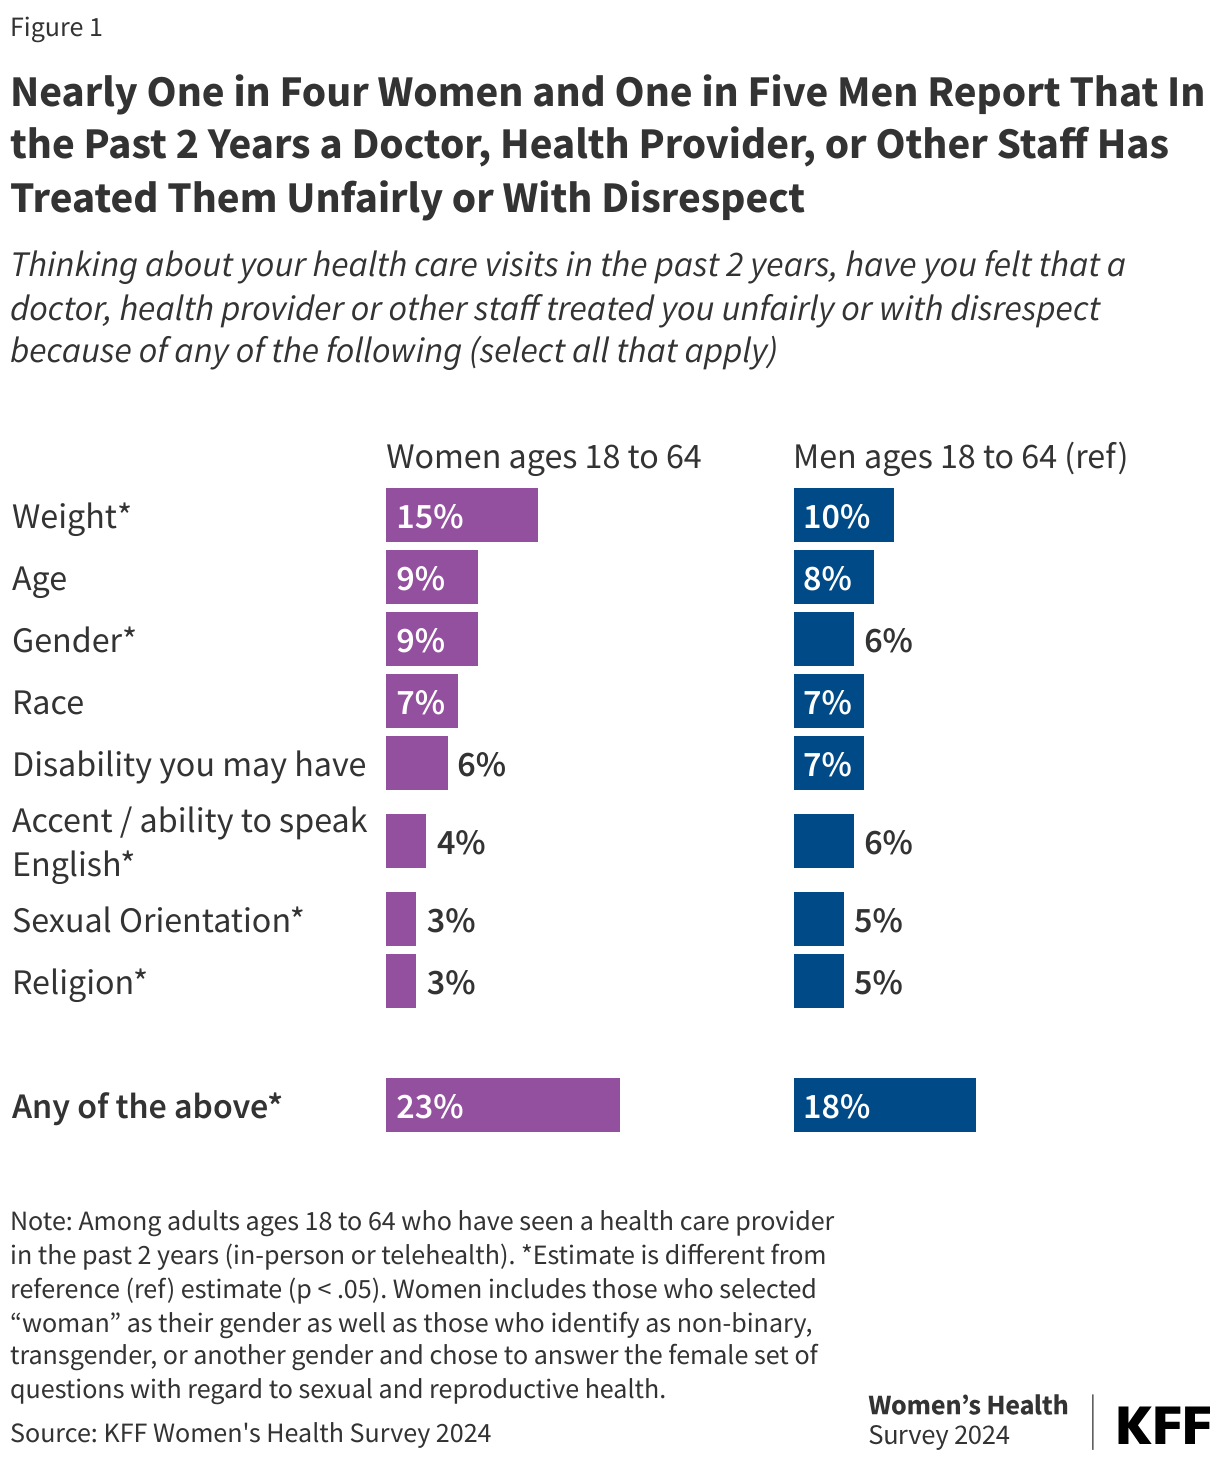
The majority of women (95%) and men (87%) ages 18 to 64 report having seen a health care provider, either in-person or via telehealth over the past two years (Appendix Figure 1). However, among those who have seen a provider, nearly one in four women ages 18 to 64 (23%) report that a doctor, health provider, or other staff has treated them unfairly or with disrespect in the past two years, a rate that is somewhat higher than the share reported by men (18%) (Figure 1). For both men and women, weight is the most common reason identified as to why they were treated unfairly or with disrespect. Overall, one in seven (15%) women say that they were treated unfairly or with disrespect because of their weight, and one in 10 (9%) identified their age and/or gender as the reason why they were treated poorly. Seven percent of women report they were treated unfairly or with disrespect because of their race.
Overall, somewhat larger shares of Black (26%) and Hispanic (25%) women report that they have been treated unfairly or with disrespect by a doctor, health provider, or other staff in the past 2 years compared to White women (21%) (Figure 2). One in five Black women (19%) report that they have been treated unfairly or with disrespect because of their race. One in 10 (9%) Hispanic women and 7% of Asian or Pacific Islander women also identify their race as the reason why they were treated poorly by a health provider while only 2% of White women identify their race as the reason. Larger shares of Black and Hispanic women report that their accent or ability to speak English was the reason they were treated unfairly or with disrespect compared to White women.
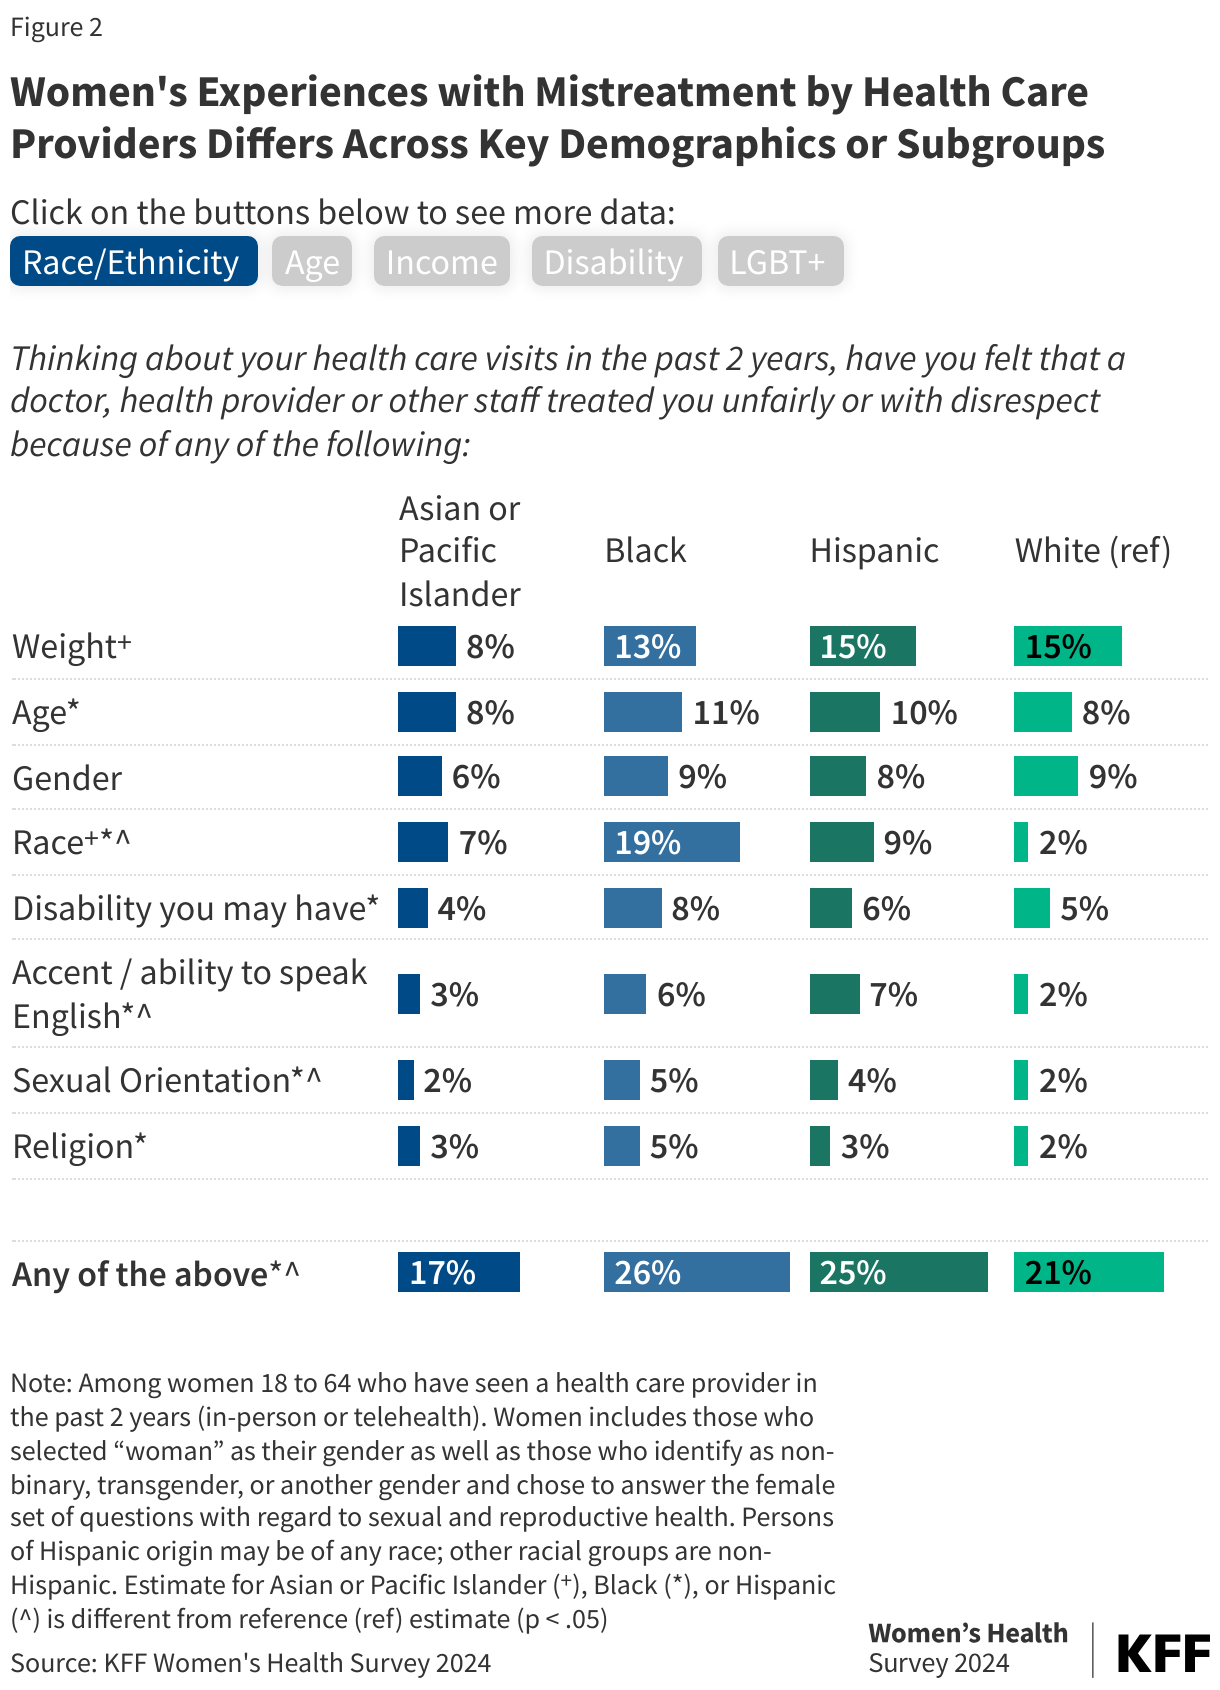
Women's Experiences with Mistreatment by Health Care Providers Differs Across Key Demographics or Subgroups
Click on the buttons below to see more data:
Race/Ethnicity
Age
Income
Disability
LGBT+
Thinking about your health care visits in the past 2 years, have you felt that a doctor, health provider or other staff treated you unfairly or with disrespect because of any of the following:
Among women 18 to 64 who have seen a health care provider in the past 2 years (in-person or telehealth). Women includes those who selected “woman” as their gender as well as those who identify as non-binary, transgender, or another gender and chose to answer the female set of questions with regard to sexual and reproductive health. Estimate for Ages 18 to 25 (*), Ages 26 to 35 (^), or Ages 36 to 49 (<sup>+</sup>) is different from reference (ref) estimate (p < .05).
KFF Women's Health Survey 2024
Women's Experiences with Mistreatment by Health Care Providers Differs Across Key Demographics or Subgroups
Click on the buttons below to see more data:
Race/Ethnicity
Age
Income
Disability
LGBT+
Thinking about your health care visits in the past 2 years, have you felt that a doctor, health provider or other staff treated you unfairly or with disrespect because of any of the following:
Among women 18 to 64 who have seen a health care provider in the past 2 years (in-person or telehealth). Women includes those who selected “woman” as their gender as well as those who identify as non-binary, transgender, or another gender and chose to answer the female set of questions with regard to sexual and reproductive health. Two hundred percent (200%) of the federal poverty level (FPL) in 2024 for an individual was $29,160. *Estimate is different from reference (ref) estimate (p < .05)
KFF Women's Health Survey 2024
Women's Experiences with Mistreatment by Health Care Providers Differs Across Key Demographics or Subgroups
Click on the buttons below to see more data:
Race/Ethnicity
Age
Income
Disability
LGBT+
Thinking about your health care visits in the past 2 years, have you felt that a doctor, health provider or other staff treated you unfairly or with disrespect because of any of the following:
Among women 18 to 64 who have seen a health care provider in the past 2 years (in-person or telehealth). Women includes those who selected “woman” as their gender as well as those who identify as non-binary, transgender, or another gender and chose to answer the female set of questions with regard to sexual and reproductive health. Individuals who identify as disabled selected "yes," when asked, "Do you identify as a disabled person or a person with a disability?" *Estimate is different from reference (ref) estimate (p < .05)
KFF Women's Health Survey 2024
Women's Experiences with Mistreatment by Health Care Providers Differs Across Key Demographics or Subgroups
Click on the buttons below to see more data:
Race/Ethnicity
Age
Income
Disability
LGBT+
Thinking about your health care visits in the past 2 years, have you felt that a doctor, health provider or other staff treated you unfairly or with disrespect because of any of the following:
Among women 18 to 64 who have seen a health care provider in the past 2 years (in-person or telehealth). Women includes those who selected “woman” as their gender as well as those who identify as non-binary, transgender, or another gender and chose to answer the female set of questions with regard to sexual and reproductive health. LGBT+ includes individuals who identify as lesbian or gay, bisexual, transgender, non-binary, or something else. *Estimate is different from reference (ref) estimate (p < .05)
KFF Women's Health Survey 2024
Women of reproductive age (18 to 49), women with lower incomes, LGBT+ women, and women who identify as disabled are more likely to report that they have been treated unfairly or with disrespect compared to women 50 to 64, women with higher incomes, non-LGBT+ women and women who do not identify as disabled. Among women who identify as disabled one in five women (19%) say they were treated poorly due to a disability they have.
Across the majority of subgroups, weight is the most common reason identified by women about why they were treated unfairly or with disrespect. Weight stigma and discrimination can reduce the quality of care patients receive and patient satisfaction. It can also lead to an increase in stress for a patient and affect their short- and long-term health outcomes. Similar shares of White (15%), Hispanic (15%), and Black (13%) women identify their weight as the reason why they were treated poorly by a health provider in the past two years, while only 8% of Asian or Pacific Islander women say the same. Twice as many LGBT+ women (26%) women and women who identify as disabled (24%) compared to non-LGBT+ women (13%) and women who do not identify as disabled (13%) say that weight was the reason they were treated unfairly or with disrespect by a health care provider.
Negative Health Care Experiences
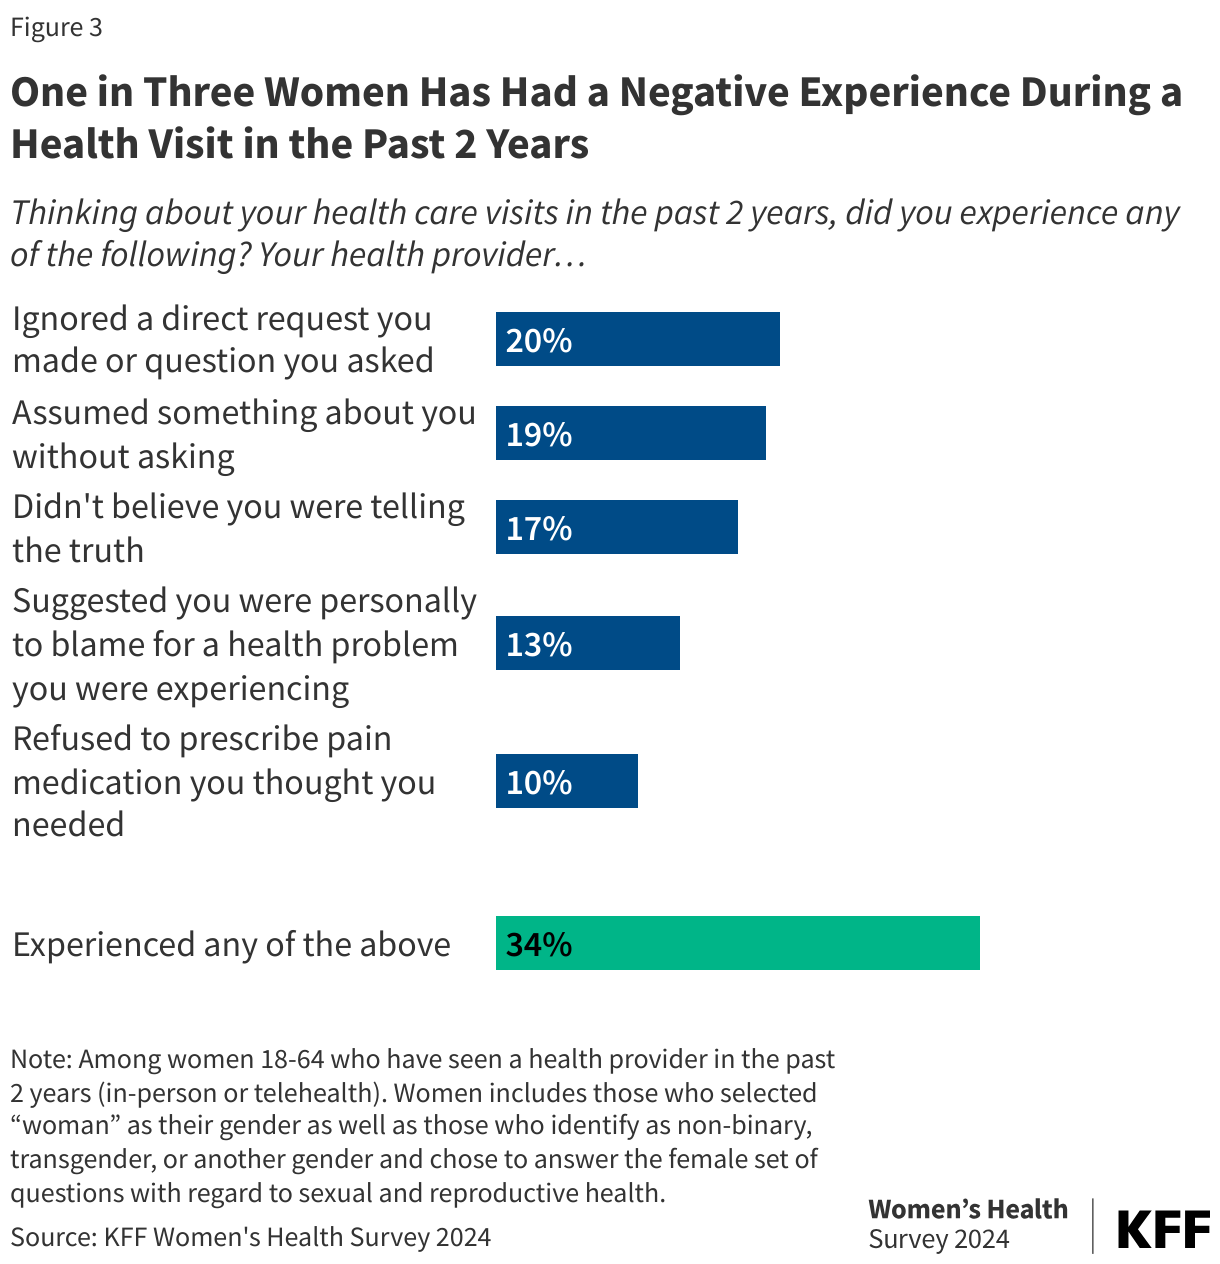
One in three women (34%) who have seen a provider in the past two years report having at least one of several negative experiences (Figure 3). One in five women (20%) said a health provider has ignored a direct request they made or question they asked, and another one in five (19%) report that a provider has assumed something about them without asking. Nearly one in five women say that a provider didn’t believe they were telling the truth, and one in seven (13%) say their provider suggested they were personally to blame for a health problem they were experiencing. One in 10 women say their provider has refused to prescribe them pain medication they thought they needed.
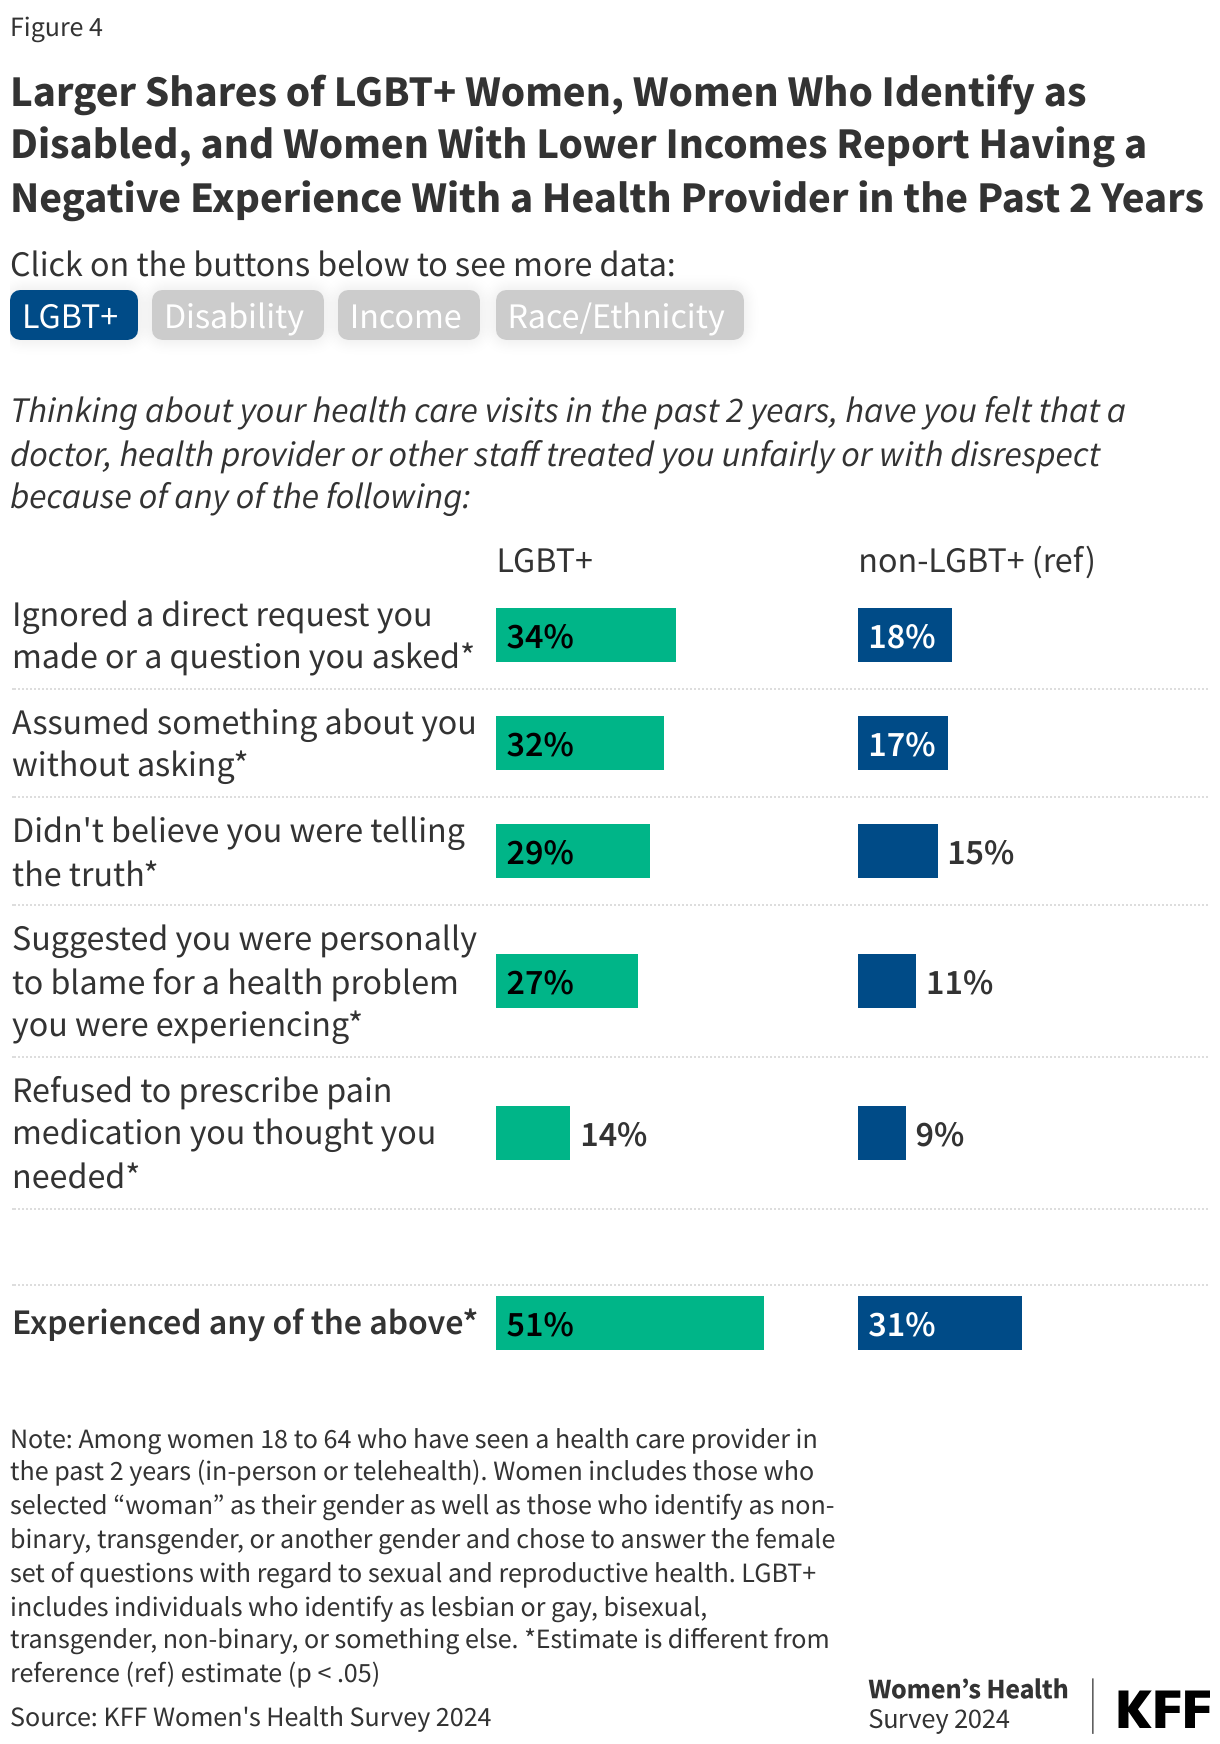
Significantly larger shares of LGBT+ women and women who identify as disabled have had a negative experience with a health care provider in the past two years (Figure 4). About half of LGBT+ women (51%) and women with disabilities (47%) report having had a negative experience with a health provider in the past two years. Across all five of the negative experiences asked about on the survey, larger shares of LGBT+ women and women who identify as disabled say they have experienced each compared to non-LGBT+ women and women who do not identify as disabled. Prior KFF research has found that LGBT+ adults are more likely than non-LGBT+ adults to report adverse consequences because of negative interactions with health providers and are more likely to take steps to mitigate or prepare for unfair treatment when receiving care.
Similarly, larger shares of women with lower incomes report having had a negative experience with a health provider in the past two years compared to women with higher incomes.
Larger Shares of LGBT+ Women, Women Who Identify as Disabled, and Women With Lower Incomes Report Having a Negative Experience With a Health Provider in the Past 2 Years
Click on the buttons below to see more data:
LGBT+
Disability
Income
Race/Ethnicity
Thinking about your health care visits in the past 2 years, have you felt that a doctor, health provider or other staff treated you unfairly or with disrespect because of any of the following:
Among women 18 to 64 who have seen a health care provider in the past 2 years (in-person or telehealth). Women includes those who selected “woman” as their gender as well as those who identify as non-binary, transgender, or another gender and chose to answer the female set of questions with regard to sexual and reproductive health. Individuals who identify as disabled selected "yes," when asked, "Do you identify as a disabled person or a person with a disability?" *Estimate is different from reference (ref) estimate (p < .05)
KFF Women's Health Survey 2024
Larger Shares of LGBT+ Women, Women Who Identify as Disabled, and Women With Lower Incomes Report Having a Negative Experience With a Health Provider in the Past 2 Years
Click on the buttons below to see more data:
LGBT+
Disability
Income
Race/Ethnicity
Thinking about your health care visits in the past 2 years, did you experience any of the following? Your health provider...
Among women 18 to 64 who have seen a health care provider in the past 2 years (in-person or telehealth). Women includes those who selected “woman” as their gender as well as those who identify as non-binary, transgender, or another gender and chose to answer the female set of questions with regard to sexual and reproductive health. Two hundred percent (200%) of the federal poverty level (FPL) in 2024 for an individual was $29,160. *Estimate is different from reference (ref) estimate (p < .05)
KFF Women's Health Survey 2024
Larger Shares of LGBT+ Women, Women Who Identify as Disabled, and Women With Lower Incomes Report Having a Negative Experience With a Health Provider in the Past 2 Years
Click on the buttons below to see more data:
LGBT+
Disability
Income
Race/Ethnicity
Thinking about your health care visits in the past 2 years, did you experience any of the following? Your health provider…
Among women 18 to 69 who have seen a health care provider in the past 2 years (in-person or telehealth). Women includes those who selected “woman” as their gender as well as those who identify as non-binary, transgender, or another gender and chose to answer the female set of questions with regard to sexual and reproductive health. Persons of Hispanic origin may be of any race; other racial groups are non-Hispanic. <br>*Estimate for Asian or Pacific Islander women is different from reference (ref) estimate (p < .05). **Estimate for Black women is different from reference (ref) estimate (p < .05). ^Estimate for Hispanic women is different from reference (ref) estimate (p < .05)
KFF Women's Health Survey 2024