Declines in Uncompensated Care Costs for The Uninsured under the ACA and Implications of Recent Growth in the Uninsured Rate
Issue Brief
Summary
The increase in the uninsured rate in recent years, as well as loss of coverage during the pandemic, has led to attention on the consequences of being uninsured. The need for medical care to test, treat, or prevent COVID-19 has also highlighted the potential consequences of uncompensated care for uninsured people. Uncompensated care costs occur because, although people who are uninsured use less care than people with coverage, most who are uninsured have limited income or resources and cannot afford the high cost of medical care, if and when they do need or use health care.
To understand the potential implications of coverage shifts for uncompensated care, this analysis uses the Medical Expenditure Panel Survey (MEPS) to examine how uncompensated care costs for the uninsured changed following implementation of the ACA’s coverage provisions in 2014. We define uncompensated care as costs not covered by the individual’s health insurance (if they had insurance at some point in the year) or out-of-pocket payments. We consider uncompensated care across a wide range of services and settings and compare average annual costs over two time periods, 2011-2013 and 2015-2017, to assess the effect of the ACA’s major coverage expansion. We also examine changes in sources of payment for uncompensated care costs between the two periods. Key findings include:
- Reflecting a significant decline in the share and number of people who were uninsured at any point in the year, the average annual share of nonelderly individuals who had any uncompensated care costs fell by more than a third following ACA implementation, going from 7.3 percent in 2011-2013 down to 4.8 percent in 2015-2017. This change represents a decline in the number of people with uncompensated care costs from 20.2 million to 13.1 million.
- Correspondingly, the aggregate annual cost of uncompensated care provided to uninsured individuals dropped by a third following implementation of the ACA’s coverage provisions, from an average of $62.8 billion per year in 2011-2013 to $42.4 billion in 2015-2017. The cost of implicitly subsidized uncompensated care—or care that had no payment source, including a non-health insurance source—dropped from $21.6 billion to $15.1 billion per year on average before and after the ACA, respectively.
- Despite declines in total amounts, the distribution of total aggregate spending for the uninsured (including amounts paid out-of-pocket and expenses uncompensated) was similar across the two periods, with the majority (approximately 70%) uncompensated and about 20% paid out of pocket by uninsured people both before and after the ACA.
- Uncompensated care costs declined across most provider and service types, and the distribution of costs of uncompensated care by service type was similar both before and after the ACA, with hospitals continuing to be the site of care for approximately 60% of uncompensated care
While this analysis finds significant declines in uncompensated care across providers and services following the ACA coverage expansions, the nation still faces sizable uncompensated care costs. As detailed elsewhere, while providers incur significant costs in caring for the uninsured, the bulk of their costs are compensated through a web of complex funding streams that are financed largely with public dollars. However, these approaches may be inefficient, may not target funds to providers with the most uncompensated care, or may still leave uninsured people with bad debt, credit issues, or even bankruptcy. Provider charity covers some of the remaining uncompensated care costs, and a very small share, estimated to account for less than one percent of private insurance payments, is potentially covered through cost-shifting to those with private insurance. Even before the pandemic, the uninsured rate in the United States had ticked up in recent years; potential losses of coverage due to pandemic-related job loss could exacerbate these losses and reverse to some extent the significant coverage gains seen since the full implementation of the ACA in 2014. At the same time, recent efforts – including reopening of ACA enrollment by the Biden Administration and enhanced premium subsidies and new incentives for states to expand Medicaid under the American Rescue Plan – could increase the number of people covered.
Introduction
The economic downturn caused by the COVID-19 pandemic could potentially lead to more people in the United States being uninsured. In addition to posing challenges to these individuals’ ability to access needed health care and be protected from medical debt, rising uninsured rates could exacerbate issues with uncompensated care costs associated with providing health care to the uninsured. Though uninsured people use less care than their insured counterparts, when they do use care and cannot pay for it themselves, the cost of that care is uncompensated. Providers may absorb these costs as bad debt or tap into other funding sources to cover some of the costs. However, these approaches may be inefficient, may not target funds to providers with the most uncompensated care, or may still leave uninsured people with bad debt, credit issues, or even bankruptcy.
Over the years, the federal government, states, and localities have devoted considerable resources to pay providers for care they provide to uninsured patients through several program efforts (e.g., community health centers, Veterans Health Administration, and indigent care programs) and also through direct financial support (e.g., Medicaid Disproportionate Share Hospital (DSH) payments, and uncompensated care pools). However, the policy that has had the largest impact on reducing uncompensated care costs is arguably the enactment of the Affordable Care Act, which expanded health insurance coverage and helped shrink the nation’s uninsured rate to the lowest level in recorded history. Other research has documented declines in uncompensated care for specific types of providers, but to date there is no assessment of system-wide changes in uncompensated care for the uninsured after the ACA.
In this brief, we look at how uncompensated care costs for the uninsured changed following implementation of the ACA’s major coverage provisions in 2014. Specifically, building on previous analyses, we use Medical Expenditure Panel Survey (MEPS) data to examine health care costs associated with care provided to uninsured people ages 0-64 before and after the ACA coverage provisions took effect. We also examine sources of payment for uncompensated care costs and the allocation of these costs across types of providers and services. Additional details on the methods underlying the analysis are in the Methods Overview below and in the technical appendix at the end of the brief.
Methods
We use 2011-2017 data from the Medical Expenditure Panel Survey Household Component (MEPS-HC), a nationally representative survey of the civilian noninstitutionalized population conducted by the Agency for Healthcare Research and Quality that collects detailed information on monthly health insurance coverage and health care utilization and spending. We focus on uncompensated care costs among people ages 0-64 who were uninsured for part or all of a given year during the study period, since nearly all adults ages 65 and older are covered by Medicare. We estimate average annual per capita and total uncompensated care costs for nonelderly people before and after ACA implementation, pooling years of data for pre- and post-ACA implementation time periods (e.g., 2011-2013 and 2015-2017) to increase the precision of our estimates.1
We define uncompensated care as costs not covered by health insurance or out-of-pocket payments (see Figure 1). Our definition of uncompensated care includes two components. The first is alternative sources of payment, which include payments made on behalf of an uninsured person from sources other than comprehensive health insurance plans and out-of-pocket payments. These include payments from publicly run or regulated sources, such as VA and CHAMPVA, other federal sources (such as the Indian Health Service), other state and local sources (such as state and local health departments), and non-health insurance programs such as workers compensation. Alternative sources of payment also include payments from other private sources and unclassified sources (see appendix for details on these sources).

The second component of our definition of uncompensated care is implicitly subsidized care, which represents care received by the uninsured not covered by a directly identifiable source of payment linked to an individual patient. For example, when providers receive lower payments for treating an uninsured patient than they would have otherwise received if the patient was privately insured, we consider that implicitly subsidized care. Implicitly subsidized care may reflect charity care, private grant programs, medical debt, Medicaid DSH payments, state and local support for public hospitals, and other government spending. Our estimates of implicitly subsidized care are based on a provider’s expected private payments for care if an uninsured patient had been privately insured minus any actual payments the providers received from the patient in out-of-pocket payments or payment from other private or unclassified sources. More detail on the process for estimating these costs, including adjustments to reconcile differences between the MEPS-HC and the National Health Expenditure Accounts and to account for medical inflation and population growth, can be found in the technical appendix, along with specifics on the analysis and its limitations.
Changes in the Number and Share of People with Uncompensated Care Costs
Like prior research, we find that the uninsured rate among nonelderly individuals dropped significantly following implementation of the ACA’s coverage provisions. Based on analysis of MEPS, the average annual share of the nonelderly who were ever uninsured during the year in 2015-2017 was 19.6 percent, down from 25.5 percent in 2011-2013. This represents a decline in the number of people who were uninsured at some point during the year from 70.7 million to 53.3 million over the period. We also found a similar decrease in the share of individuals uninsured for the full year (Table 1).
Consistent with the decline in uninsured rates, we find that the average annual share of nonelderly individuals who had any uncompensated care costs significantly fell by more than a third following ACA implementation, going from 7.3 percent in 2011-2013 down to 4.8 percent in 2015-2017. This change represents a decline in the number of people with uncompensated care costs from 20.2 million to 13.1 million (Table 1).
| Table 1: Uninsurance and Uncompensated Care Among Nonelderly People Ages 0 to 64, 2011-2013 and 2015-2017 | |||||
| 2011-2013 | 2015-2017 | ||||
| % | # | % | # | ||
| Uninsured in any month of the year1 | 25.50% | 70,700,000 | 19.60% | 53,300,000 | *** |
| Uninsured all months of the year2 | 14.70% | 40,600,000 | 8.70% | 23,700,000 | *** |
| Uninsured some months but not all months of the year2 | 10.90% | 30,100,000 | 10.90% | 29,700,000 | |
| Any uncompensated care during the year | 7.30% | 20,200,000 | 4.80% | 13,100,000 | *** |
| NOTES:1 Estimates for numbers uninsured or with any uncompensated care costs are rounded to the nearest 100,000. All estimates are annual averages for each three-year period.2 For MEPS participants who were not in scope for all 12 months of the year, measures of uninsurance during the year are based on the months when they were eligible for the survey.*/**/*** Estimate is significantly different from estimate for 2011-2013 at the 0.10/0.05/0.01 level, using two-tailed tests.SOURCE: Medical Expenditure Panel Survey-Household Component, 2011-2013 and 2015-2017. | |||||
Changes in Uncompensated Care Costs for Uninsured People
Reflecting the decline in the uninsured rate, we find aggregate uncompensated care costs for the uninsured decreased by a third following implementation of the ACA’s coverage provisions. Uncompensated care costs include expenditures not covered directly by the individual’s health insurance (if they had any at some point in the year) or out-of-pocket spending. In 2015-2017, we estimate average annual aggregate uncompensated care costs for all uninsured (including full-year uninsured and for the periods when part-year uninsured lacked coverage) totaled $42.4 billion, down from $62.8 billion in 2011-2013 (Figure 2). In both 2011-2013 and 2015-2017, about one-third of uncompensated care costs were implicitly subsidized, or not linked to a specific funding source; the balance was paid by alternative (non-health insurance) sources, which included payments from federal programs (e.g., Indian Health Service), state and local governments, and other sources.
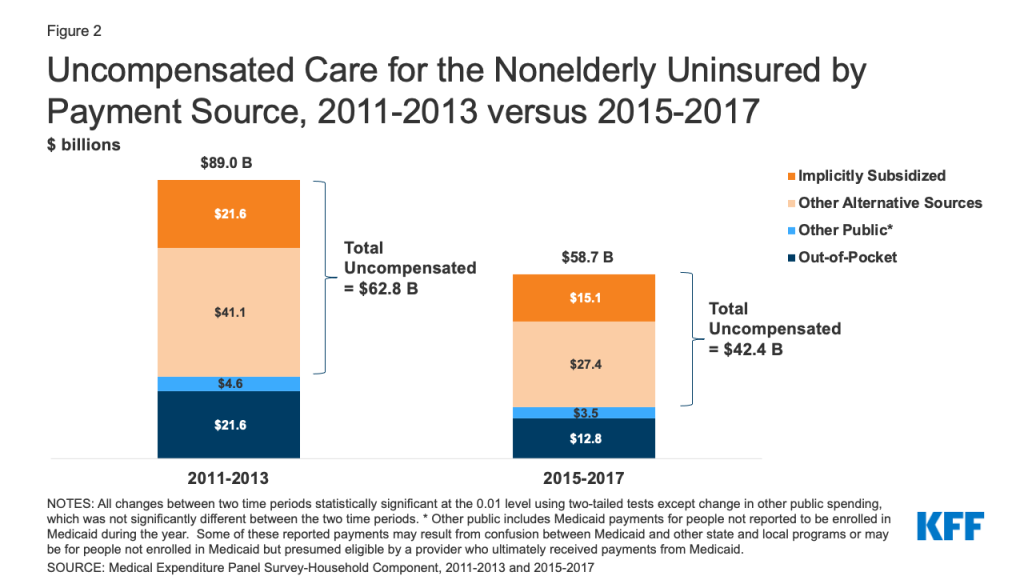
Despite declines in total amounts, the majority of aggregate expenses incurred by uninsured people were uncompensated in both 2011-2013 and 2015-2017. The distribution of aggregate spending for the uninsured was similar across the two periods. Uncompensated care costs accounted for about 70 percent of total average annual medical expenditures for the uninsured estimated at $89.0 billion and $58.7 billion, respectively, before and after ACA implementation. These totals reflect aggregate spending for the full-year uninsured and part-year uninsured for the periods when they lacked coverage. Through out-of-pocket payments, the uninsured themselves paid 21.8 percent ($12.8 billion) of the population’s annual average aggregate expenditures in 2015-2017. Remaining direct expenditures ($3.5 billion, or 6.0 percent) in 2015-2017 was composed of other public spending.2
Changes in Uncompensated Care Costs by Setting
Uncompensated care costs fell by an equal percentage in hospital and community settings following the ACA, but hospitals continue to shoulder the majority of these costs (Table 2). Between 2011-2013 and 2015-2017, annual average uncompensated care costs dropped by about a third in both hospital settings (from $36.9 billion to $25.1 billion, a 32% decline) and community settings (from $19.7 billion to $13.4 billion, also a 32% decline). Hospitals, however, continued to bear the bulk of uncompensated care costs, likely reflecting both the high cost of hospital care and laws requiring hospitals to treat and stabilize all patients, regardless of insurance status. In 2015-2017, hospital uncompensated care costs totaled $25.1 billion, about 60 percent of overall uncompensated care costs. The balance of costs was incurred for community-based providers ($13.4 billion) and prescription drugs ($3.9 billion). Among community-based providers, office-based visits to physicians, nurses, and physician assistants accounted for the largest share of uncompensated care costs, at about $7.1 billion.
| Table 2: Uncompensated Care Costs for the Nonelderly (Age 0-64) Uninsured by Place and Type of Service, 2011-2013 and 2015-2017 | |||
| 2011-2013 | 2015-2017 | ||
| $ Billions | $ Billions | ||
| Total uncompensated care costs | $62.8 | $42.4 | *** |
| Hospital settings | $36.9 | $25.1 | *** |
| Community settings | $19.7 | $13.4 | *** |
| Office-based visits | $17.0 | $10.8 | *** |
| Physician, nurses, physician assistants | $12.0 | $7.1 | *** |
| Other providers | $5.0 | $3.6 | * |
| Home health | $0.3 | $0.3 | |
| Dental | $1.9 | $1.2 | *** |
| Other medical1 | $0.4 | $1.2 | ** |
| Prescription Drugs | $6.2 | $3.9 | ** |
| NOTES:1 Other medical includes glasses and contact lenses, ambulance services, disposable supplies, and durable medical equipment. */**/*** Estimate is significantly different from estimate for 2011-2013 at the 0.10/0.05/0.01 level, using two-tailed tests.SOURCE: Medical Expenditure Panel Survey-Household Component, 2011-2013 and 2015-2017. | |||
Changes in Uncompensated Care Per Capita Among the Nonelderly Uninsured
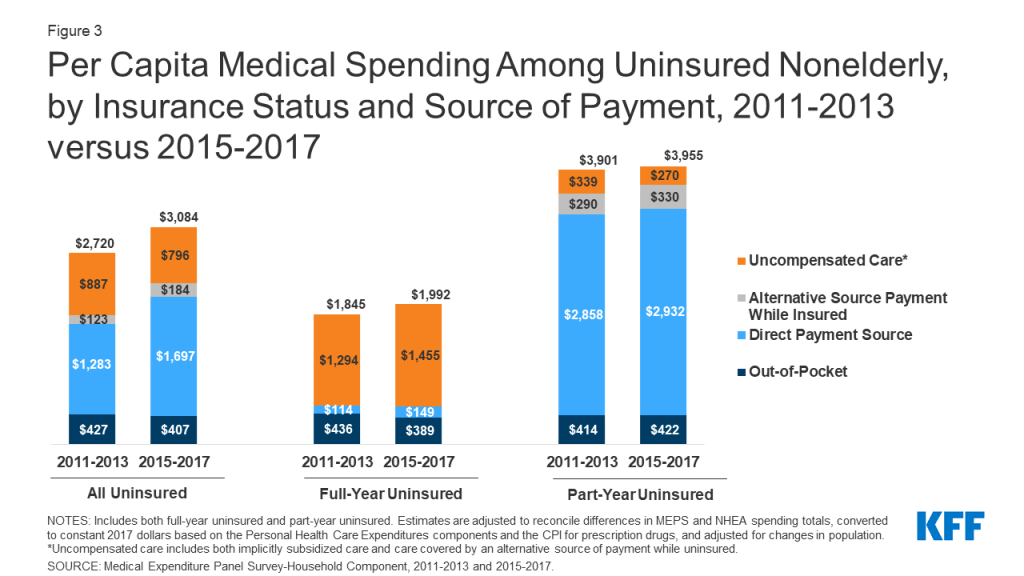
Though aggregate uncompensated care has declined in the wake of the ACA, the share of health care spending that ends up uncompensated for those who remain uninsured did not decline following the ACA. On an average per capita basis, total spending among people who were uninsured at some point during the year (including spending while insured or uninsured) went from $2,720 in 2011-2013 to $3,084 in 2015-2017 (Figure 3), with uncompensated care costs accounting for a third ($887) of average per capita costs before the ACA and about a quarter ($796) after the ACA. The distribution of spending that was out-of-pocket, covered by insurance or alternative sources while insured, and uncompensated shifted slightly after the ACA, largely due to the part-year uninsured (who have some payment through insurance in the months when they are insured) accounting for a larger share of the uninsured. When looking at average per capita costs among the full-year uninsured, nearly three quarters of their average per capita spending was uncompensated care in both periods, with out-of-pocket spending constituting the majority of their remaining expenditures both before and after the ACA (Figure 3).
As in the past, people who are uninsured for the full year have much lower health care spending from all sources than those with coverage for some or all of the year. As shown in Table 1 (above), most people who are uninsured at some point during the year do not have any uncompensated care when they are uninsured. Many delay or avoid using care, even when needed, and others may use care but pay out of pocket for that care. In addition, on an average per capita basis, uninsured people had significantly lower per capita spending than the full-year insured, which was estimated to be an average of $5,591 in 2015-2017 (data not shown). Among the uninsured, per capita spending was twice as high for those who were uninsured for only part of the year compared to those who were uninsured all year both before and after the ACA (Figure 3). The higher spending of the part-year uninsured is due to their spending while insured, which accounted for the majority of their expenditures.
Looking Ahead
The ACA brought about a significant decline in provider uncompensated care costs in caring for the uninsured. This result was anticipated given the major coverage expansion afforded by the ACA. However, the ACA did not offer universal health insurance coverage and not all states adopted the Medicaid expansion. As a consequence, while uncompensated care costs declined by nearly a third following implementation of the ACA’s major coverage provisions in 2014, these costs continue to be considerable. We estimate uncompensated care costs totaled $42.4 billion in 2015-2017, with $15.1 billion of those costs implicitly subsidized, or not tied to any payment source such as non-health insurance sources of payment.
Importantly, multiple programs sponsored by federal, state, and local governments help health care providers offset a sizable share of these costs. However, these approaches may be inefficient, may not target funds to providers with the most uncompensated care, or may still leave uninsured people with bad debt, credit issues, or even bankruptcy. Provider charity covers some of the remaining uncompensated care costs, and a very small share, estimated to account for less than one percent of private insurance payments, is potentially covered through cost-shifting to those with private insurance. Research examining trends in private hospital payments and changes in the uninsured, as well as research examining private insurance payment rates and market power among large hospitals with high uninsured patient mix, has not found a consistent, close link between the uninsured and increase private payment rates to offset uncompensated care costs.
Uncompensated care costs may be on the rise. Since 2017, the last year of our study period, the uninsured rate increased both in 2018 and 2019, growing by a million and a half people during that two-year period, which likely brought about an uptick in uncompensated care costs. Further, the widespread job losses resulting from the COVID-19 pandemic in 2020 threaten to put health insurance coverage at risk for millions of workers and their families. As of February 2021, the unemployment rate stood at 6.2 percent, nearly double the pre-pandemic level, and many workers have left the labor force. While many who lose employer coverage could become eligible for Medicaid or ACA marketplace subsidies, some may not enroll, and others may continue to be ineligible for coverage. The need for medical care to test, treat, or prevent COVID-19 has also highlighted the potential consequences of uncompensated care for uninsured people.
A rise in uncompensated care costs is always a concern but particularly so now given that the expected increase in these costs occurs at a time when state and local governments face declining revenues because of the pandemic-induced recession. A drop in revenues could jeopardize funding for existing programs that help offset uncompensated care costs, just as some providers have incurred significant financial losses from COVID-19. While the federal government has made provider relief funds available to reimburse providers for treating patients with COVID-19, there is no guaranteed allotment of funds for uninsured patients, and limited funds have been paid out to offset costs for uninsured patients to date.
Given the heightened need for health care among many due to the pandemic, additional coverage loss at a time of shrinking resources to cover health care expenses could further challenge the ability of the health care system to meet needs. At the same time, recent efforts – including reopening of ACA enrollment by the Biden Administration and enhanced premium subsidies and new incentives for states to expand Medicaid under the American Rescue Plan – could increase the number of people covered and put reduced pressure on providers and government sources of financing for uncompensated care.
Michael Karpman and Teresa A. Coughlin are with the Urban Institute. Rachel Garfield is with KFF.
Appendix
Technical Appendix
In this appendix, we provide a more detailed description of our study data, methods, and limitations, including our approach for estimating uncompensated care costs.
Data
We use 2011-2017 data from the Medical Expenditure Panel Survey Household Component (MEPS-HC), a nationally representative survey of the civilian noninstitutionalized population conducted by the Agency for Healthcare Research and Quality. The MEPS-HC collects detailed information on monthly health insurance coverage and health care utilization and spending. Expenditure data reported by MEPS-HC participants are validated using information collected through the MEPS Medical Provider Component (MPC), which follows up with a sample of respondents’ health care providers and pharmacies to collect information on charges and payments. MPC data are used to edit and impute spending in the MEPS-HC.
Definition of Uncompensated Care Costs
We identify uninsured patients’ spending that reflects uncompensated care costs, which include payments made on behalf of an uninsured person from sources other than comprehensive health insurance plans and out-of-pocket payments. Our definition of uncompensated care costs includes two components: 1) alternative sources of payment for care and 2) implicitly subsidized care. Below we describe how we identify spending while uninsured; define uninsured spending from alternative sources; calculate implicitly subsidized care; and apply adjustments to the data to reconcile differences in estimated expenditures between the MEPS-HC with the National Health Expenditure Accounts (NHEA) and to account for inflation and population growth.
Identifying spending while uninsured
We consider spending for medical events (e.g., provider visits, prescription fills) to be uninsured if the person was not insured in the month when the event occurred and the spending was not covered by private insurance (including TRICARE), Medicare, or Medicaid/CHIP. We merge monthly insurance status data from the MEPS-HC full-year consolidated file to each medical event file to determine whether individuals were uninsured when the event occurred. We calculate spending while uninsured for the following medical events:3
- Prescription drugs
- Hospital inpatient stays
- Hospital emergency room visits
- Hospital outpatient visits
- Office-based physician visits, including visits to physician-supervised health care professionals such as nurse practitioners and physician assistants
- Office-based non-physician provider visits
- Home health visits
- Dental visits
- Other medical expenses, which includes spending on durable medical equipment, disposable medical supplies, ambulance services, and vision care
For most types of medical events, we use the event month to determine coverage status at the time of care. For hospital inpatient stays, we use coverage status based on the month of the beginning of the stay. For prescription medicines, we link the prescription fills to other medical events (if applicable) and base coverage status on the month of those events. For prescribed medicines that cannot be linked to other events and for “other” medical expenses in which event month is unavailable, we randomly assign the drug fill or expense to a month within the survey round and year in which the fill or expense occurred. This approach allows us to assess total uninsured and insured spending by service and payer for people who were uninsured for part or all of the year.
Defining uninsured spending from alternative sources
Alternative sources of payment include the following payments made for care while uninsured:
- VA or CHAMPVA
- Other federal sources, including Indian Health Service, military treatment facilities, and other care provided by federal government
- Other state and local sources, including community clinics, state and local health departments, and state programs other than Medicaid
- Workers compensation
- Other private sources, including private insurance payments reported for people without comprehensive private health insurance coverage during the year
- Other unclassified sources, including auto, homeowners, and liability insurance and other unknown sources
Private insurance coverage in the MEPS-HC is defined as having a major medical plan covering hospital and physician services. Some payments classified as “other private” may be from single-service plans.
Our definition of alternative sources excludes “other public” spending reported in the MEPS, which represents Medicaid payments for people not reported to be enrolled in Medicaid during the year. Some of these reported payments may result from confusion between Medicaid and other state and local programs or may be for people not enrolled in Medicaid but presumed eligible by a provider who ultimately received payments from Medicaid.
We assume that payment from alternative sources are negotiated between payers and providers such that any difference between charges and payments represent a contractual discount accepted by the provider. Therefore, there is no implicit subsidy for care covered by these sources.
Calculating implicitly subsidized care
As noted in the brief, our estimates of implicitly subsidized care are based on the expected private payments for care if an uninsured person was privately insured minus their actual payments made out-of-pocket and from other private or unclassified sources.
We first sum the total charges and payments for each service, excluding prescription medicines, among full-year privately insured nonelderly people with no reported public coverage or public spending during the year. We then take the ratio of average total payments to average total charges for each service. This payment-to-charge ratio represents the average share of charges for each service that we would expect to be covered by private insurance. We do not calculate a payment-to-charge ratio or implicitly subsidized care for prescription drugs because the MEPS-HC does not provide data on charges.
Next, we identify uninsured spending for each service that is eligible for implicitly subsidized care among people who were uninsured for part or all of the year. Eligible charges and payments are based on whether the service was only paid for out-of-pocket and/or covered by other private or unidentified sources. Charges and payments while uninsured are considered ineligible if fully or partially covered by Medicare, Medicaid, private insurance, other public sources, or other indirect sources.
For each service, we multiply the total eligible charges while uninsured by the privately insured payment-to-charge ratio to calculate the expected payment for the service if the uninsured person was privately insured. We then subtract actual out-of-pocket or private payments from expected privately insured payments for each service; this difference represents implicitly subsidized care.
Applying NHEA, inflation, and population adjustments
The MEPS-HC captures less aggregate medical spending than the National Health Expenditure Accounts (NHEA) data, even after accounting for difference in populations and medical expenditure categories across sources. We adjust expenditures by payer and service type to more closely reflect NHEA aggregate expenditure totals based on adjustment factors developed by Bernard et al. for reconciling MEPS and NHEA expenditures in 2012. Adjustment factors are available for the following payers: private insurance, Medicare, Medicaid, defense, VA, and workers’ compensation; no adjustment is made for other public payers and other sources. We also do not adjust out-of-pocket expenditures, which is not measured directly in the NHEA but is instead a residual category of expenditures. We instead assume out-of-pocket expenditures reported in the MEPS-HC are more accurate. Consistent with this approach, NHEA adjustments for implicitly subsidized care are calculated only for the share of eligible uninsured spending paid by other private insurance because there is no adjustment for out-of-pocket spending or spending from other unclassified sources. For each payer, NHEA adjustments are made for the following service categories: hospital, physician, non-physician providers, dental care, home health care, prescription drugs, and other medical equipment.
We inflate all spending to constant 2017 dollars for each service type based on appropriate price indices. We use the Personal Health Care Expenditure components of the NHEA for hospital care, physician/clinical services, other professional services, dental care, home health care, and durable medical equipment. We adjust prescription drug spending for inflation using the Consumer Price Index for prescription drugs. After these adjustments are made, we sum implicitly subsidized care and indirect uninsured spending across payment sources and service types to calculate uncompensated care costs overall, by payer, and by service type. We apply the same NHEA and inflation adjustments to insured spending. Finally, we adjust all estimates to account for population growth based on Census Bureau population projections .
Analysis and Limitations
We compare average annual per capita and total uncompensated care costs for nonelderly people ages 0 to 64 between 2011-2013 and 2015-2017, the periods just before and just after implementation of the ACA’s major coverage provisions in 2014. We pool three years of data in each period to increase the precision of our estimates. All analyses use survey weights and survey design variables to calculate standard errors that reflect the complex design of the MEPS.
Though approximately one-third of self-reported expenditures in the MEPS-HC are validated based on the MPC, there is still potential for measurement error in estimated expenditures and the MPC does not collect spending data from dental providers, non-physician providers, or medical equipment. Studies have also found measurement error in self-reported health insurance coverage in the MEPS, which may affect our estimates of spending among the uninsured and, consequently, uncompensated care costs.
Endnotes
- We exclude 2014 from our analysis of uncompensated care costs in the pre- and post-ACA periods because it is a transition year when the ACA’s major coverage provisions were implemented. ↩︎
- MEPS identifies these expenditures as Medicaid payments that were made for individuals not reported to be enrolled in the program at any time during the year. Some of these reported payments may result from confusion between Medicaid and other state and local programs or may be for people not enrolled in Medicaid but presumed eligible by a provider who ultimately received payments from Medicaid. Agency for Healthcare Research and Quality, MEPS HC-201: 2017 Full-Year Consolidated Data File (Rockville, MD: Agency for Healthcare Research and Quality, August 2019), https://meps.ahrq.gov/data_stats/download_data_files_detail.jsp?cboPufNumber=HC-201. ↩︎
- Because the MEPS is a survey of the civilian noninstitutionalized population, it does not collect expenditure data for some services, such as long-term care provided in institutional settings and residential treatment for mental health and substance use disorders. ↩︎