State and Local Coverage Changes Under Full Implementation of the Affordable Care Act
Medicaid Enrollment Increases Under the ACA
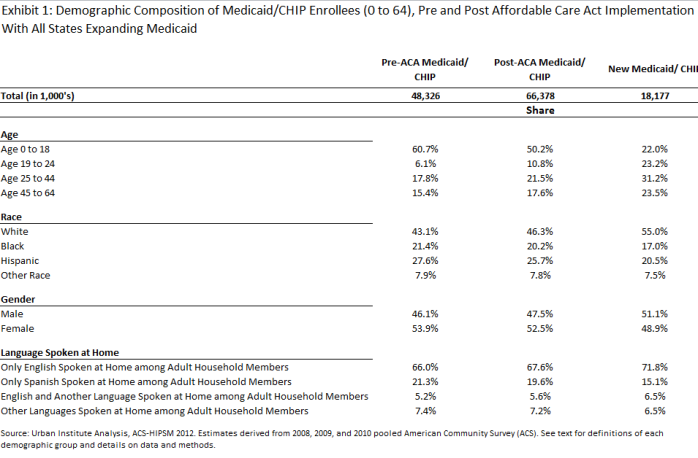
The demographic composition of Medicaid enrollees shifts under the ACA
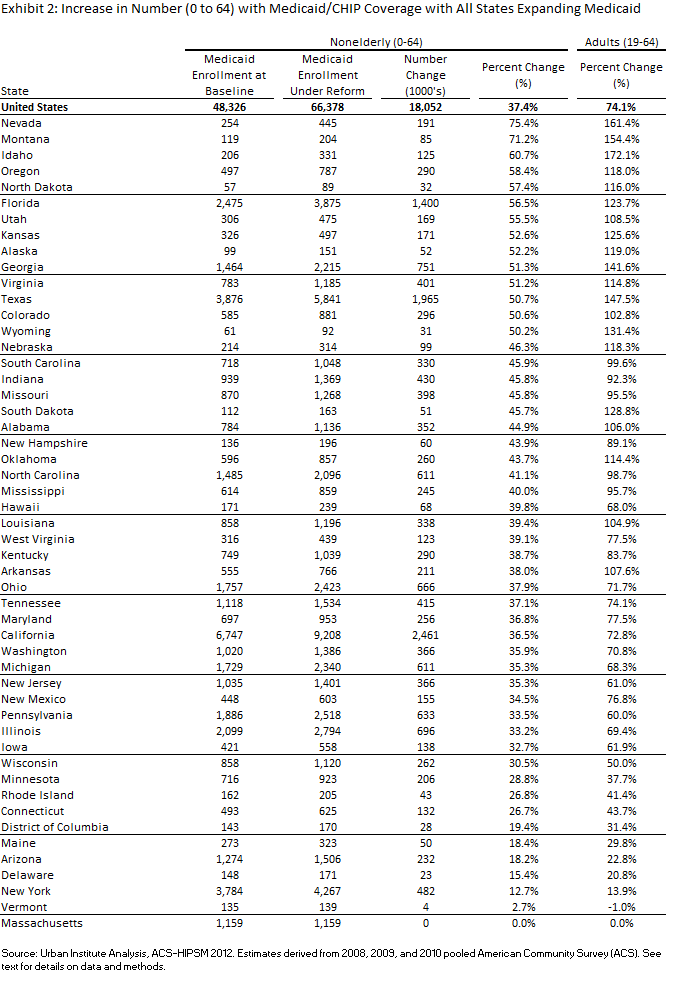
Nationally, our model projects a 37.4 percent increase in Medicaid/CHIP enrollment under the ACA, with total enrollment rising from 48.3 million to 66.4 million.1 This enrollment includes both people newly-eligible for Medicaid coverage and also new enrollment among adults and children currently eligible for Medicaid coverage but not enrolled. The composition of individuals gaining Medicaid enrollment is projected to differ from the current distribution of individuals covered by Medicaid/CHIP, primarily due to the increased coverage of nonelderly adults, particularly those without dependent children, who have historically been excluded from coverage.2 For example, 78.0 percent of new enrollees are adults, compared to 39.3 percent of current enrollees (Exhibit 2.1). Children will represent a smaller share of Medicaid/CHIP beneficiaries than they currently do. Currently, children represent a majority of enrollees in 45 states, but after the ACA implementation, only 24 states will have more than half of their enrollees under the age of 19 (data not shown).
New Medicaid enrollees will also differ from current enrollees in terms of their race/ethnicity as well as language spoken at home. For example, 55.0 percent of new Medicaid/CHIP enrollees are white non-Hispanic, compared to 43.1 percent of current enrollees (Exhibit 2.1). With full implementation of the ACA, the share of the Medicaid/CHIP population that would be living in a Spanish-speaking household is expected to decline.3 Specifically, 71.8 percent of new enrollees live in households in which all adults speak only English at home compared to 66.0 percent of current Medicaid/CHIP enrollees.
Medicaid enrollment increases across and within states under the ACA
Our model projects that with full implementation of the Medicaid expansion under the ACA, Medicaid enrollment increases will vary substantially across states.4 A total of 14 states are projected to experience enrollment increases in excess of 50 percent,5 while seven states are projected to expand their Medicaid/CHIP enrollment by less than 20 percent under the ACA (Exhibit 2.2).6 The current differences among states in the expansiveness of Medicaid/CHIP eligibility for adults are reflected in the varying projected changes in Medicaid/ CHIP growth among adults. Overall, Medicaid/CHIP enrollment is expected to increase among adults by 74.1 percent, ranging from under 15 percent in New York and Vermont to over 150 percent in Montana, Nevada, and Idaho (Exhibit 2.2).7 Exploratory multivariate analysis indicates that higher Medicaid/CHIP enrollment growth is projected in states with a smaller share of their population enrolled in Medicaid/CHIP at baseline and a higher proportion of individuals with incomes below 138 percent of the FPL (data now shown).8
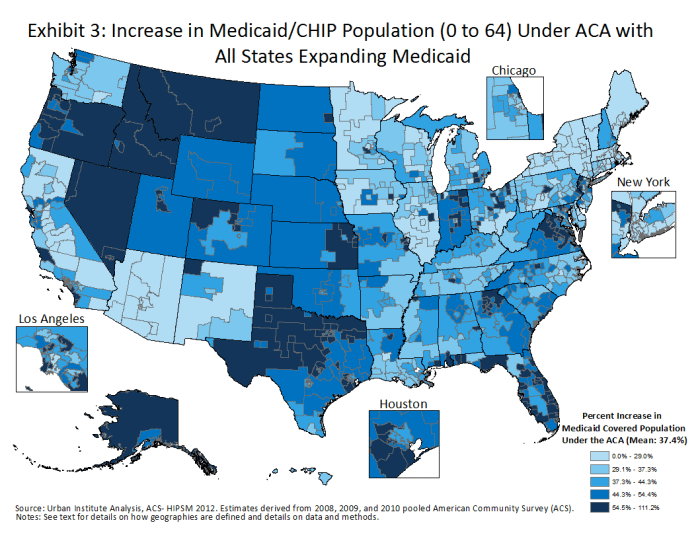
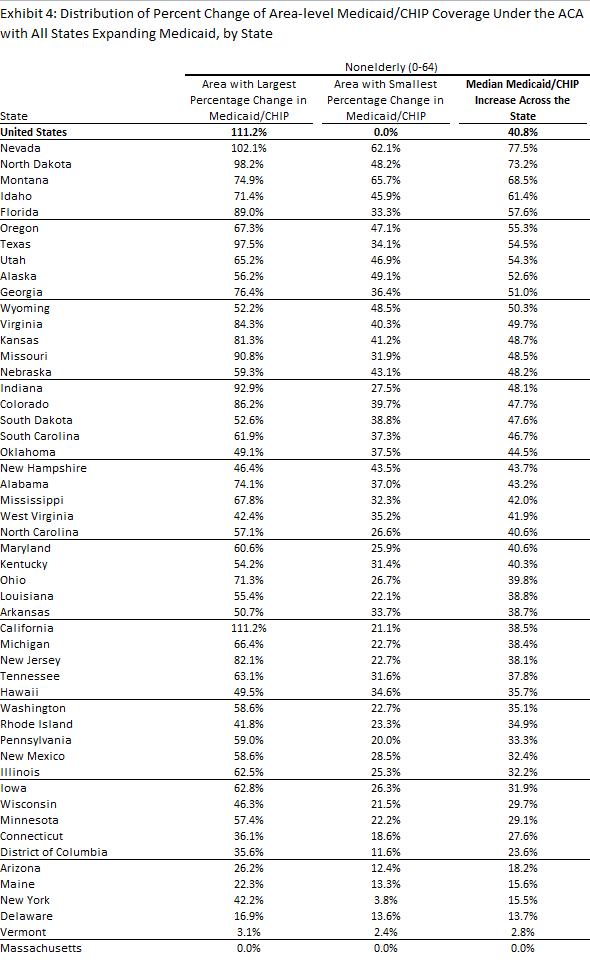
The increases in Medicaid/CHIP enrollment projected under the ACA relative to current levels vary not only by state, but also across areas within states (Exhibit 2.3). State boundaries can only account for approximately 60 percent of the total variation in Medicaid/CHIP enrollment growth seen across areas.9 In many states, areas of both high and low Medicaid/CHIP enrollment growth are found. California, where the median area in terms of Medicaid/CHIP enrollment growth is 38.5 percent, contains one local area with 111.2 percent projected growth in enrollment and another with 21.1 percent projected growth, which is below the national median (Exhibit 2.4).
Outside of Massachusetts, Medicaid/CHIP enrollment is anticipated to increase in each area of the country under the ACA, particularly among adults who may not have been eligible in the past. Nearly 40 percent of all local areas are projected to experience a doubling of their adult Medicaid/CHIP population, while 20 areas across the nation are expected to experience a tripling of their adult Medicaid/CHIP population under the ACA (data not shown).10 Most of the areas with large projected increases in their adult Medicaid/CHIP population are in states that are expected to experience well above average enrollment increases in Medicaid/CHIP.
Medicaid demographic composition changes on the local level
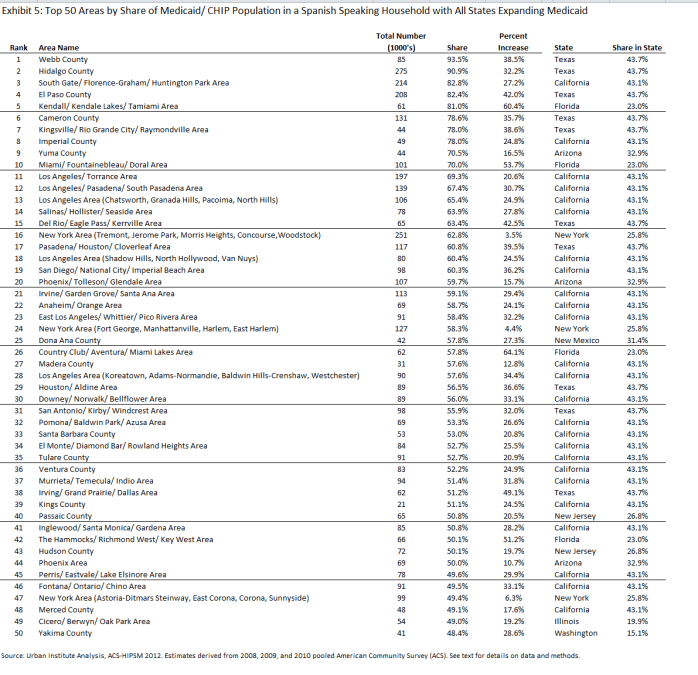
There is also local area variation in the composition of Medicaid enrollment after ACA implementation. For example, the share in Spanish-speaking households varies substantially across local areas, and areas in seven different states are expected to have at least half of their post-ACA Medicaid enrollees in households in which the adults speak only Spanish [Arizona (3 areas), California (22 areas), Florida (4 areas), New Jersey (2 areas), New York (2 areas), and Texas (10 areas)]. These areas face an increase in the number of Medicaid enrollees with potential linguistic barriers to both enrollment and care. For some areas with a large share of the projected Medicaid population in Spanish speaking households after ACA implementation, this will represent a major increase in the number of Medicaid enrollees with potential linguistic barriers. For example, in the Kendall/ Kendale Lakes/ Tamiami area of Florida, the Medicaid population in Spanish speaking households would be projected to increase by 60.4 percent (Exhibit 2.5).
Impact of the ACA on the Uninsured
Projected declines in the uninsured across and within states
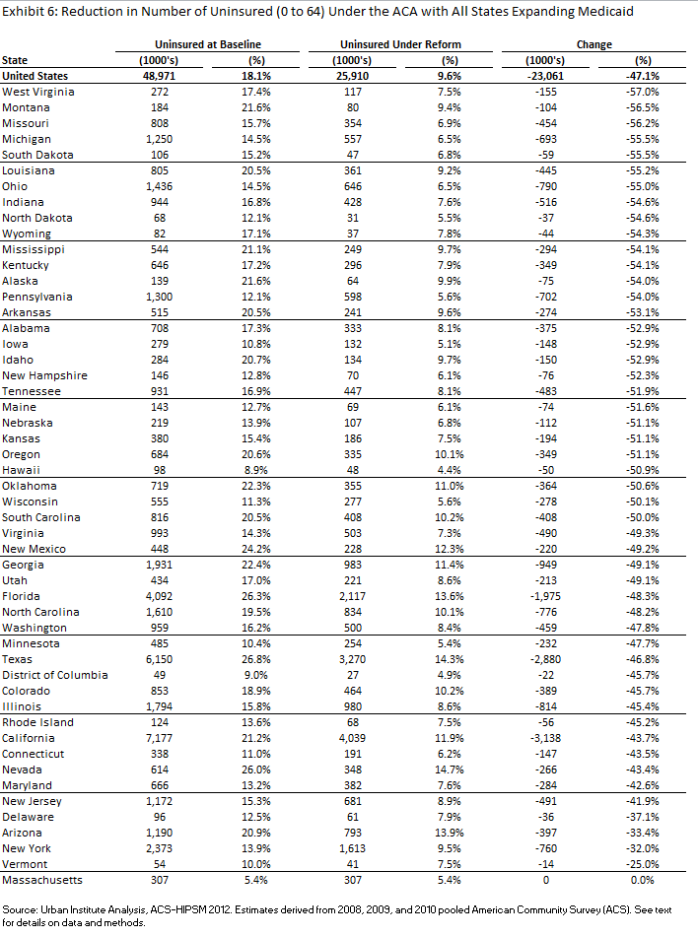
With full implementation of the ACA, the uninsured rate would decline by 47.1 percent nationally. Every state will experience a decrease in the uninsured of at least 25 percent, although it will vary as a consequence of different current uninsured rates and expected post-ACA uninsured rates.11 Uninsured rates currently vary from under 10 percent in Massachusetts, Hawaii, and the District of Columbia, to over 25 percent in Texas and Nevada. They will vary less after reform, with every state below 15 percent, and 7 states below 6 percent (Exhibit 2.6).
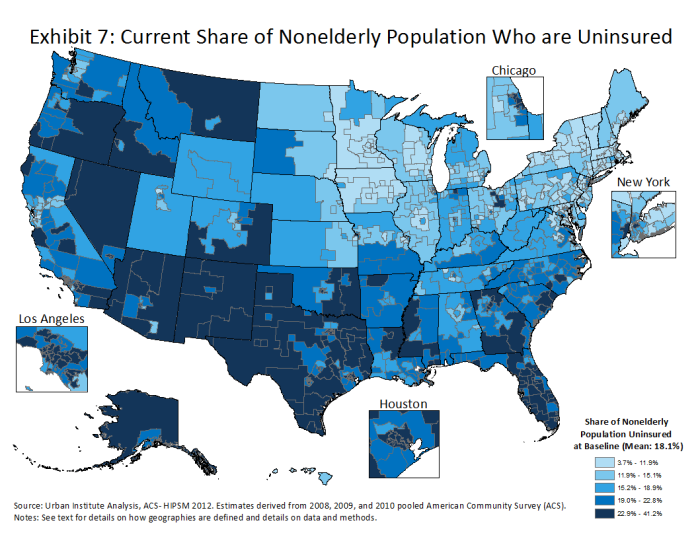
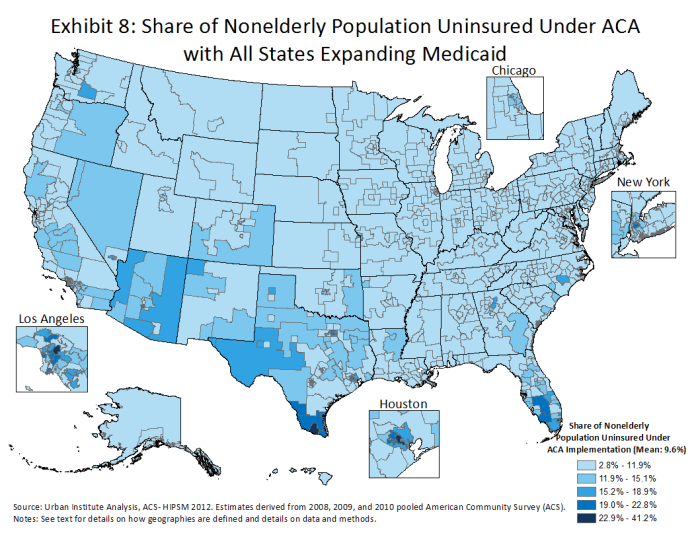
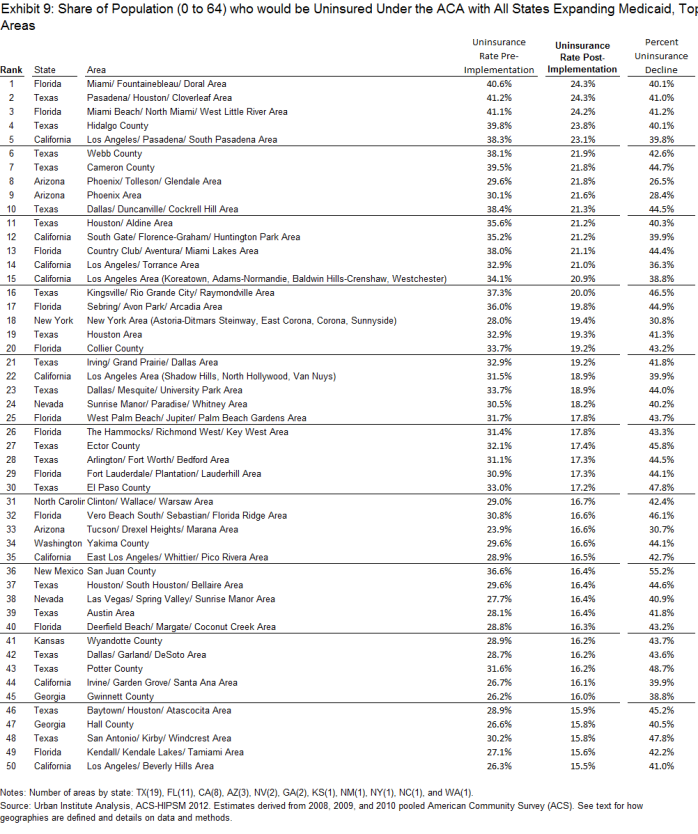
The rates of uninsured also vary widely within certain states (Exhibit 2.7). Currently, 264 of the 781 local areas have an uninsured rate of 20 percent or higher. The ACA would greatly compress the distribution of uninsured rates across areas both within and between states (Exhibit 2.8). With the exception of MA, all areas are expected to experience a decrease in the number of uninsured under the ACA. Uninsured rates of over 20 percent are expected to persist in sixteen areas which are located in the four states of AZ, CA, FL, and TX (Exhibit 2.9). As would be expected, areas that are projected to experience larger declines in the number of uninsured are also projected to experience higher increases in Medicaid/CHIP enrollment.12
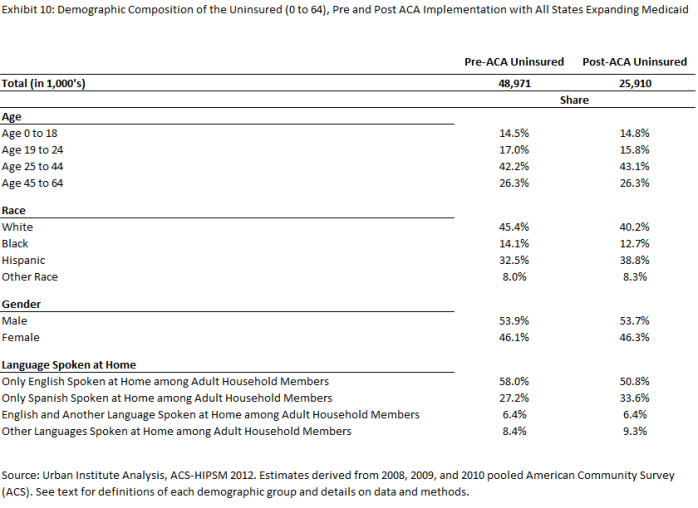
Characteristics of the uninsured under the ACA. The composition of the uninsured is also expected to change under the ACA. For example, proportionately fewer of the remaining uninsured will be between the ages of 19 and 24 nationwide. Additionally, a higher proportion of the remaining uninsured will be Hispanic and in Spanish-speaking households (Exhibit 2.10).
Example: Projected Changes in Texas and Illinois
The data permit detailed estimates to be constructed for each state. As an example of how these estimates can be used to understand variation within states, we analyze results from two states, Texas and Illinois. Both states show wide variation in the effects of the ACA among local areas. Texas has 59 different local areas within the state, and Illinois has 29 local areas.
Texas
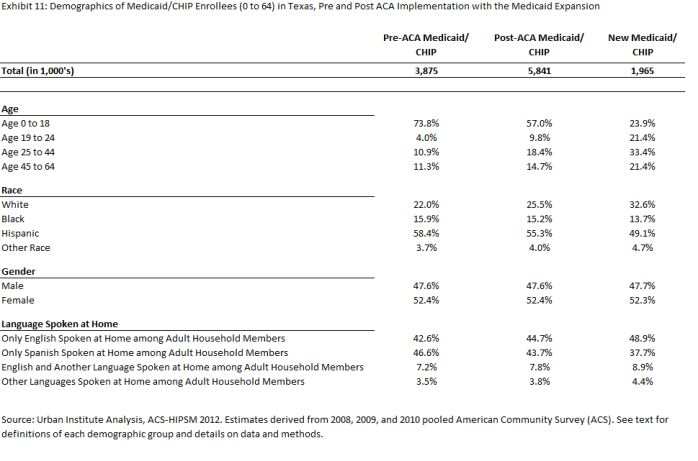
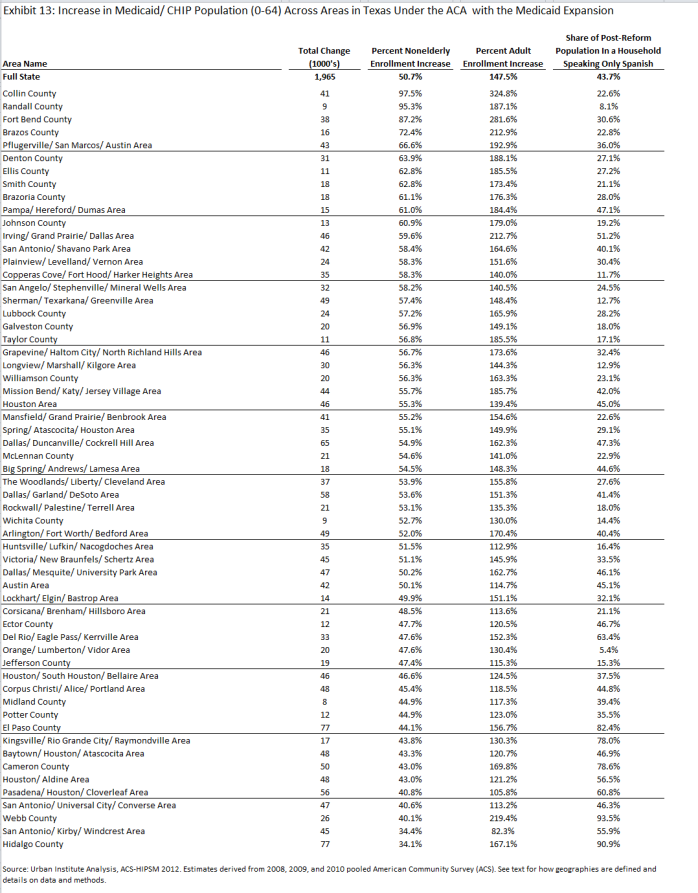
With full implementation of the Medicaid expansion in Texas, Medicaid/CHIP enrollment is projected to increase by 50.7 percent (from 3.9 million to 5.8 million), with 76.1 percent of the new enrollment occurring among adults ages 19 to 64. On average, the Texas Medicaid/CHIP population under full ACA implementation is projected to be more likely to be white non-Hispanic and to speak English relative to the pre-implementation Medicaid population (Exhibit 2.11).
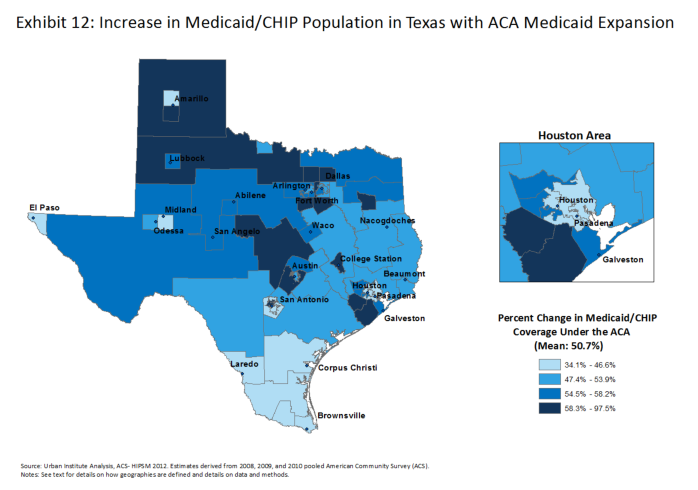
In Texas, under full implementation of the ACA, Medicaid/CHIP growth rates are expected to vary between 34.1 and 97.5 percent across local areas (Exhibit 2.12). The areas within Texas that would experience the largest growth in Medicaid/CHIP enrollment under the ACA include Collin, Randall, Fort Bend, and Brazos Counties, each in very different parts of the state. Growth in Medicaid coverage of adults drives most growth in total enrollment in local areas with large increases. Overall, Medicaid enrollment among nonelderly adults would grow by 147.5 percent in Texas under the ACA , with growth rates between 82.3 and 324.8 percent for areas within Texas (Exhibit 2.13).
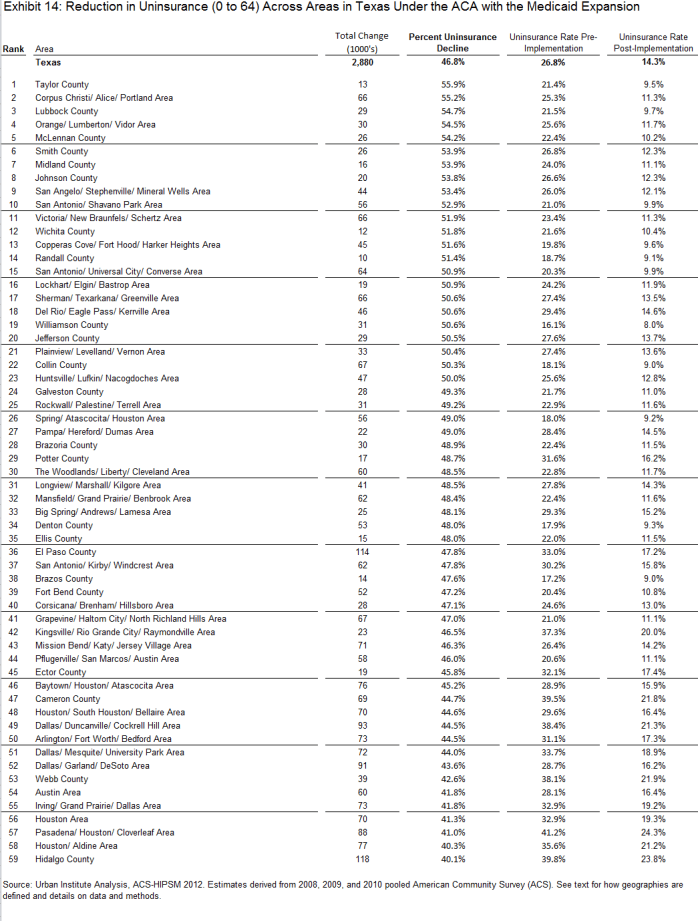
With full implementation of the ACA, the uninsured rate is projected to fall by 46.8% percent in Texas. Each of the 59 local areas within Texas are expected to see a decline of 40 percent or greater in their uninsured rate, and 22 areas would see their uninsured rate decline by more than 50 percent (Exhibit 2.14). Fully 35.4 percent of the total expected decline in the uninsured would occur in the counties containing Texas’ three largest cities of Houston (Harris County), Dallas (Dallas County), and San Antonio (Bexar County), which together account for 1.0 million of the expected 2.9 million expected to gain coverage in Texas under the ACA (data not shown). With ACA implementation that includes the expansion of Medicaid, the uninsured rate in the state of Texas would be 14.3 percent, higher than the expected national rate of 9.6 percent, but a marked decline compared to the pre-reform rate in Texas of 26.8 percent (Exhibit 2.14).
Illinois
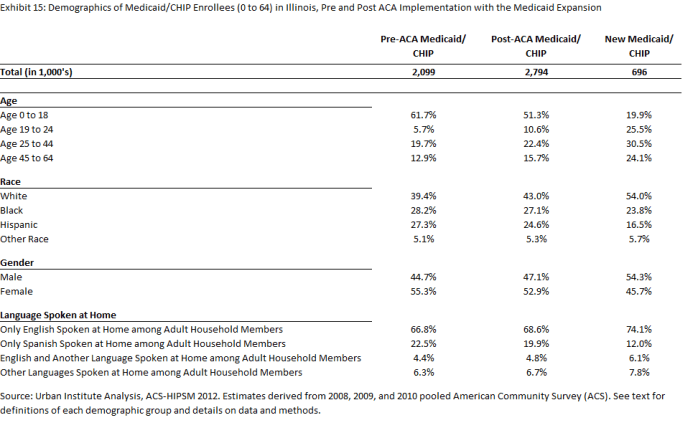
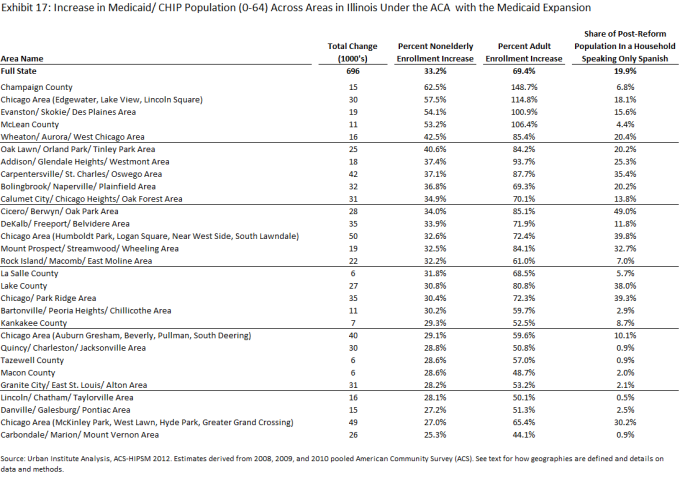
In Illinois, with full implementation of the ACA and the Medicaid expansion, Medicaid/CHIP enrollment is expected to increase by over 33 percent, or by about 696,000 new enrollees. Among nonelderly adults 19-64, enrollment is expected to increase by 69.4 percent. Total Medicaid enrollment post-ACA is estimated to be almost 2.8 million individuals, with the large majority of new enrollees expected to be white, non-Hispanic and adult. Unlike in Texas, the majority of new enrollees are projected to reside in households where everyone speaks English (Exhibit 2.15).
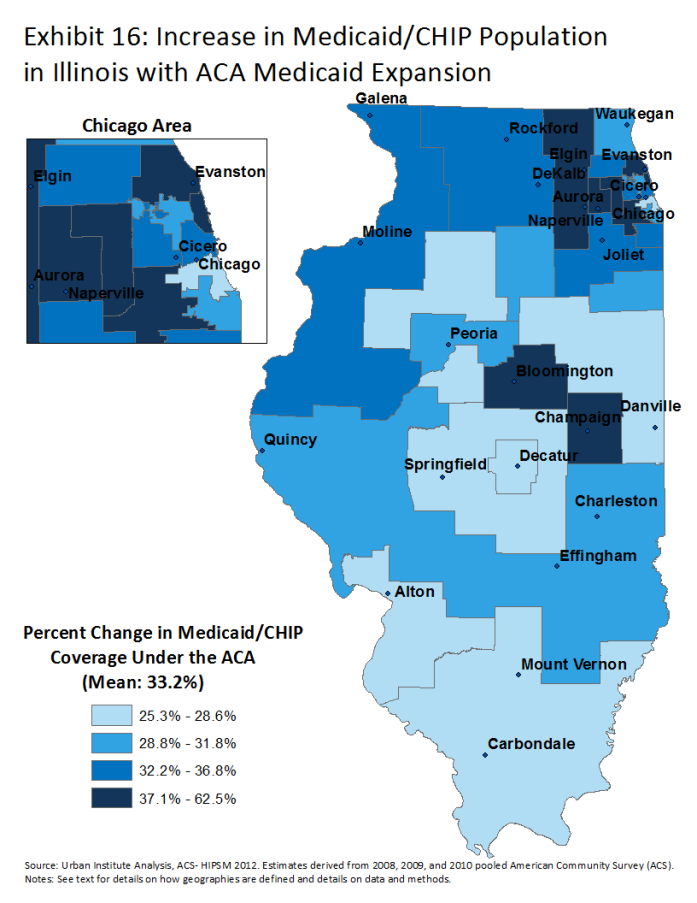
With full implementation of the ACA in Illinois, Medicaid/CHIP growth rates are expected to vary between 25.3 and 62.5 percent (Exhibit 2.16). The area in Illinois with the largest projected increase in Medicaid/CHIP enrollment under the ACA is Champaign County. Other than McLean County in the central part of the state, the remaining top five areas are all part of the greater-Chicago region. More so than in Texas where, with several exceptions, most areas can anticipate a high share of post-reform Medicaid enrollees to come from Spanish speaking households, the language distribution in Illinois is much more varied across areas. Some areas, especially in the greater-Chicago region, are projected to have a high share of Medicaid enrollees in Spanish speaking households. The Cicero/ Berwyn/ Oak Park Area slightly west of Chicago would have almost half their Medicaid enrollees in such households, whereas 9 areas are projected to have less than 5 percent of their enrollees in such households (Exhibit 2.17).
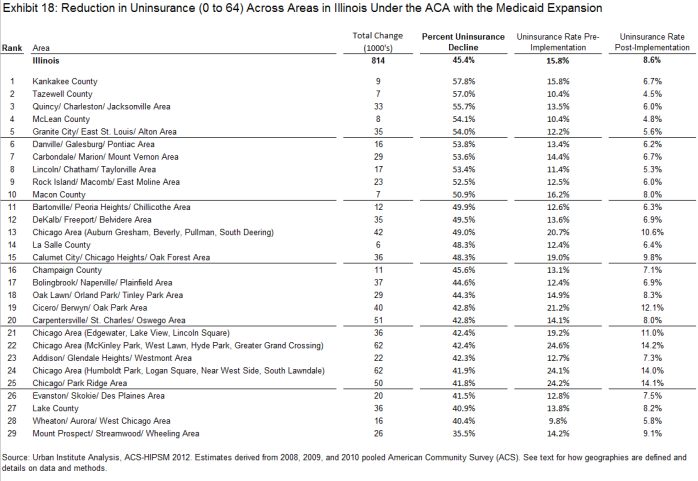
The uninsured rate in Illinois is projected to decrease 45.4 percent, or by about 814,000 individuals, with the full implementation of the ACA. Every area is expected to experience a decrease in their uninsured rate greater than 35 percent. In over 10 areas, the decline is projected to exceed 50 percent. The post-reform rate of uninsured is not expected to be uniform across areas. Three areas within Chicago are expected to have uninsured rates persisting above 14 percent, whereas two counties in the central part of the state, Tazewell and McLean County, are projected to have rates below 5 percent (Exhibit 2.18).
Policy Implications
Health systems will need to prepare for coverage expansions and changes in the composition of the Medicaid population
We find substantial variation within states in the projected size of Medicaid enrollment gains under the ACA and in the composition of the population that would be newly covered by Medicaid/CHIP. Particular attention will be needed to assess whether Medicaid provider networks are sufficient to meet the needs of the new populations who would be served under the ACA. Most of those gaining Medicaid are expected to be adults, whose service needs likely differ substantially from those of the children who currently predominate in many state Medicaid programs.
Our analysis suggests that health care networks in certain areas may face greater linguistic complexity with respect to the Medicaid/CHIP enrollees they would be serving under the ACA. Given that prior research has shown that language barriers can have a significant negative impact on access and use of care, it will be important to consider the geographic concentration of certain language groups in designing provider networks and services.13
Increases in Medicaid, as well as private insurance gains anticipated under the ACA, may put pressure on local health care systems to provide adequate access to care.14 Many of those newly insured under Medicaid may have primary care needs that had not been well addressed in the prior period when they were uninsured.15 Our estimates show substantial local variation in both the number of new Medicaid enrollees and their characteristics. With the growth in the Medicaid population that is expected under the ACA, it will be important to track the extent to which supply of services keeps pace with demand. While the ACA includes provisions to address provider capacity within Medicaid, such as increased financing for federally qualified health centers and increases in primary care reimbursement rates, other policy changes may be needed to meet the health care needs of Medicaid enrollees.
Medicaid/CHIP Enrollment Gains have Potential to Expand Access to Care
Almost 73 percent of the new Medicaid coverage expected under the ACA draws from the ranks of the uninsured (data not shown). Currently, these groups go without needed care at much higher rates than those who have Medicaid coverage. Therefore, the acquisition of Medicaid coverage under the ACA should reduce the extent of unmet health needs and financial health burdens experienced by the low-income population and increase the extent to which they receive preventive and other types of needed care. However, the declines in the uninsured that are estimated here depend on full implementation of the ACA. The states that choose not to expand Medicaid will experience much smaller increases in Medicaid enrollment and associated declines in the uninsured than reflected in these estimates, which will place greater demands on the safety net. Moreover, this analysis shows that even with full implementation of the ACA, local areas in AZ, CA, FL, and TX can still expect to have one in every five people without health insurance coverage. The adequacy of the safety net will remain an important policy concern, particularly in local areas where high rates of the uninsured persist.
Conclusion
Our ACS-based simulation projects that an additional 18.1 million would enroll in Medicaid/CHIP coverage under full implementation of the ACA, assuming all states expand Medicaid eligibility to 138 percent FPL. Our analysis provides new information on the extent to which these gains would vary across the country and show how the demographic and socioeconomic characteristics of the population covered by Medicaid/CHIP could change under the ACA. This analysis also highlights the extent to which uninsured rates could decline across states and in all local areas. Capacity and access issues will be important on the local levels as individuals who were previously uninsured now have coverage, and their needs may differ based on the changing demographic of enrollees. Without full implementation of the ACA, many states and local areas will continue to see higher uninsured rates.


