Patterns in COVID-19 Cases and Deaths in Long-Term Care Facilities in 2020
Data Note
In the recent months, the US has experienced record-breaking highs of new coronavirus cases and deaths in nearly every state across the country, and new overall cases and deaths have been higher in January 2021 than at any other point in the pandemic. Research suggests that increased community-level cases are associated with increased long-term care cases. A rise in cases in LTC facilities (LTCFs) is particularly concerning, given that those who live in LTCFs are more vulnerable to severe illness and death from the virus than the general population. In recognition of their high-risk status, LTCF residents and staff have been prioritized for vaccine distribution. However, initial reports indicate slower-than-anticipated rollout, with some reports of high levels of vaccine hesitancy among LTCF staff members. These delays will likely mean additional deaths due to COVID-19 in LTCFs.
This analysis assesses when new LTCF cases and deaths were highest in states across the country, as well as how national trends in LTCF COVID-19 cases/deaths compare to national trends in overall COVID-19 cases/deaths. This piece is limited to data from 2020 since a full month of 2021 data was not available at the time of analysis. Thus, the findings in this data note reflect only when LTCF cases and deaths were highest in 2020. It is likely that many states will hit peak new cases and deaths in LTCFs in early 2021, surpassing the 2020 highs. This analysis finds that, mirroring total COVID-19 cases and deaths trends, LTCF cases were highest in December 2020 and LTCF deaths were highest in April 2020. However, there is a great deal of state variation in these findings, with many states reporting highest new LTCF deaths in December 2020. Our analysis builds on other research examining recent surges in LTCF cases and deaths by providing state-level data, including data through the end of 2020, and comparing LTCF trends to overall trends.
This analysis draws on state-reported data from 42 states to examine patterns in LTCF COVID-19 cases and deaths across the country, including 38 states that report trend-able data on cases and 39 states that report trend-able data on deaths. Detailed state-level data on average weekly new cases and deaths from April – December 2020 is available in Tables 1 and 2. Data reported in this paper is as of the week of December 27th. See Methods box for more details. For a closer look at long-term care trends prior to September, see Key Questions About the Impact of Coronavirus on Long-Term Care Facilities Over Time.
When Did States Report Highest New COVID-19 Cases and Deaths in Long-Term Care Facilities in 2020?
Cases
Approximately three-quarters of reporting states with trend-able data (28 of 38) experienced their highest average weekly number of new coronavirus cases in long-term care facilities in November or December 2020 (Table 1). Among the 38 states that reported at least four months of trend-able data on LTCF cases since April 2020, four states reported highest average weekly new cases in November 2020, and 24 states reported their highest average weekly new cases in December 2020. This pattern aligns with timing of when many states experienced their highest state-wide new cases and deaths.
A small number of states, concentrated in the Northeast and Southeast, saw highest new cases in LTCFs earlier in the year (Figure 1 and Table 1). Six states experienced their highest average weekly new LTCF cases in Spring of 2020, defined as April or May 2020 (CT, DC, GA, MA, NJ, and RI), with 5 of these 6 states experiencing highest new cases in April 2020 (Table 1). New York, whose early LTCF outbreaks were comparable to those in NJ or CT, does not report data on cases in long-term care facilities. Another four states experienced their highest new LTCF cases in Summer 2020, defined as June, July, or August 2020 (AL, DE, LA, and SC). All other states experienced highest new LTCF cases in the last two months of 2020, coinciding with the recent community-level surges.
Deaths
Over half of reporting states (21 of 39 states) reported their highest average weekly new COVID-19 deaths in long-term care facilities in the last two months of 2020, mostly in December (Table 2). 39 states have reported at least four months of trend-able data on LTCF deaths since April 2020. Of these states, three reported highest average weekly new deaths in November, while nearly half (18 states) reported highest new deaths in December 2020.
States that had reported highest new COVID-19 LTCF deaths in the Spring of 2020 were clustered in the Northeast region of the country, while most of the states that reported highest new LTCF deaths in December 2020 were in the West and the Midwest (Figure 2). States in the Northeast were most likely to experience highest new LTCF deaths sometime in Spring 2020 (April or May) while states in the Southeast were more likely to experience highest new LTCF deaths in Summer 2020 (June- August). Three of the 39 states included in this trend analysis for deaths experienced highest new deaths in November 2020, two of which were Mountain-area states (MT and ND). The remaining 18 states, primarily in the Midwest, West coast, and a few states in the South, experienced their highest new LTCF deaths due to COVID-19 in December 2020.
National Patterns in Long-Term Care Cases and Deaths
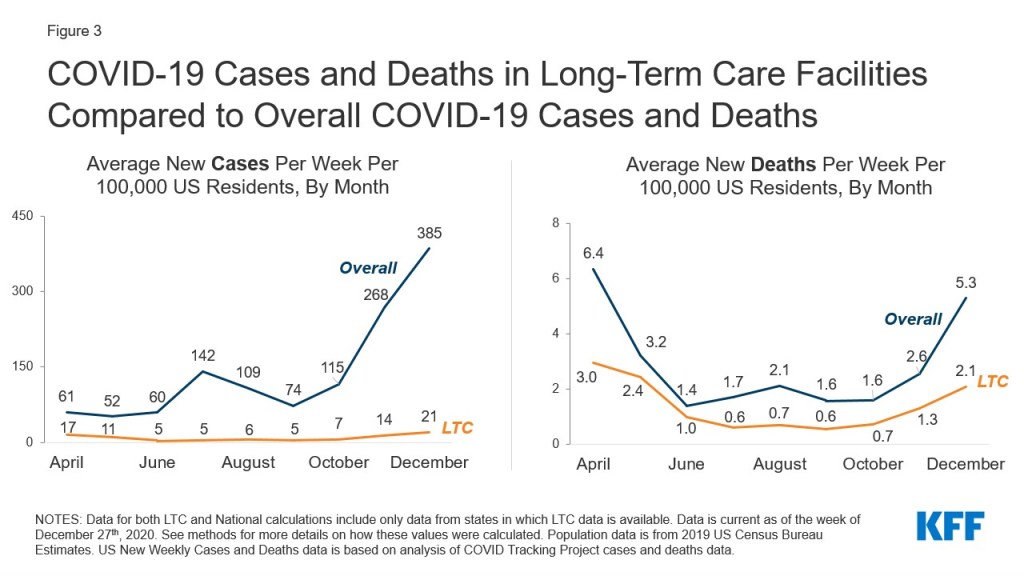
Mirroring overall COVID-19 cases and deaths, new LTCF cases were highest nationally in December 2020, while new LTCF deaths were highest nationally in April 2020. (Figure 3). Overall cases are defined as total coronavirus cases in the US population. New overall cases nationally were the lowest at the start of the pandemic, which can be partially attributed to the relatively low testing availability early in the pandemic. In comparison, new LTCF cases dropped from between the spring and summer and were the lowest in summer months before rising again in later in the year. The drop in new cases over the summer may be attributed to the measures that LTCFs put in place to mitigate spread.
National data shows that both total overall and LTCF cases and deaths have been on the rise since September. Based on early state-level trend data, it appears that this trend will continue through early 2021, suggesting that the peak in deaths in LTCFs is yet to come, and could occur in early 2021.
Looking Ahead
Overall, trends in long-term care facilities to some extent mirror trends in community outbreaks, although LTCF cases and deaths may be affected by measures that have been put in place to mitigate the impact of the pandemic on residents and staff. This analysis finds wide variation across states in the timing of highest new cases and deaths due to COVID-19, with some regions of the country experiencing its worst LTCF outbreaks very recently. These outbreaks are happening at the same time that vaccines are making their way to long-term care facility residents and staff. Early data suggests that initial vaccine distribution has been slower than anticipated and that staff vaccination rates are relatively low due, in part due to vaccine hesitancy, which could lead to the continued spread of the virus in long-term care facilities. Based on recent trends, it is likely that we will see a continued rise in new cases in the early months of 2021. Given that the peaks in cases and deaths tend to overlap, it is likely that spread of the virus will mean additional deaths, possibly making the coming months the deadliest of the pandemic for long-term care residents and staff.
Methods
This analysis is based on data as of the week of December 27th from 41 states plus Washington DC, for a total of 42 states. Within these 42 states, we were able to trend long-term care cases in 38 states and long-term care deaths in 39 states. Not all states consistently reported data over the time period included in this study. We included states for which we could reliably trend at least 4 months of data, using the earliest reliable period reported in the state as the starting point for that state’s trend. Nine states were excluded from this analysis because they do not directly report data on cases and deaths in long-term care facilities, their data is sourced from sporadically released media reports, or there were data quality or availability issues in trending data over time. For more information on data sources, see KFF’s long-term care data tracker.
States vary in which facilities they include in LTCF reporting. For all states, we trended the subset facilities and population that would give us the longest reliable trend line. Notable examples of this include Louisiana, where data from non-nursing home long-term care facilities were excluded because they were not consistently reported. In Delaware, analysis excludes staff cases because that data was not reported consistently. For this reason, this analysis should not be used to identify state-level or national data on total long-term care cases and deaths. The most recent data on total cases and deaths in long-term care facilities can be located here.
Tables 1 and 2 present data on average new LTC cases and deaths per week, scaled per 100,000 US and state residents, by month. The first week of available data for each state was not included in this analysis since the first week of data does not reflect a single week of cases/deaths, but rather all cases and deaths that have occurred up to that point. New cases and deaths were calculated for each week thereafter, and then averaged for all of the weeks within the month. These average new cases and deaths were converted to represent cases and deaths per 100,000 state residents to allow for easier comparison across states. Total population data was taken from 2019 state population estimates from the US Census Bureau.
This analysis relies on state-reported data instead of federal data since federal data may exclude cases and deaths prior to May 8th, 2020. This exclusion may miss peaks in states such as New York, New Jersey, and Massachusetts. Additionally, the federal data does not include non-nursing home settings. COVID-19 has disproportionately impacted all types of long-term care settings, such as assisted living facilities and group homes. Thus, the state-reported data is more likely to capture the full burden of cases and deaths in long-term care facilities.
Tables
| Table 1: Average Weekly New Long-Term Care Cases Per 100,000 State Residents, By Month | |||||||||
| April | May | June | July | August | September | October | November | December | |
| US TOTAL | 16.6 | 11.0 | 4.8 | 5.1 | 5.7 | 5.1 | 7.0 | 14.3 | 20.6 |
| (25 states) | (32 states) | (36 states) | (36 states) | (38 states) | (38 states) | (38 states) | (38 states) | (38 states) | |
| Alabama | 5.7 | 7.9 | 6.8 | 8.4 | 9.6 | 7.1 | 3.9 | 4.6 | 7.1 |
| Arkansas | 1.3 | 1.3 | 2.6 | 4.3 | 6.5 | 4.5 | 15.0 | 22.0 | 16.9 |
| California | 8.8 | 8.4 | 3.6 | 8.7 | 7.5 | 3.2 | 2.4 | 6.0 | 23.6 |
| Colorado | 9.7 | 6.8 | 2.1 | 1.1 | 1.1 | 1.9 | 3.2 | 15.8 | 27.8 |
| Connecticut | 52.8 | 27.0 | 3.6 | 1.8 | 0.7 | 1.1 | 5.4 | 11.9 | 33.2 |
| Delaware | 7.7 | 9.4 | 12.2 | 1.0 | 1.5 | 2.8 | 3.6 | 3.2 | 5.9 |
| District of Columbia | 9.4 | 18.7 | 5.2 | 1.9 | 1.8 | 1.0 | 1.6 | 4.9 | 16.2 |
| Georgia | 12.0 | 7.8 | 4.7 | 9.4 | 11.5 | 5.3 | 4.0 | 6.4 | 11.5 |
| Idaho | 2.1 | 9.1 | 14.0 | 8.0 | 14.2 | 23.0 | 25.3 | ||
| Illinois | 22.5 | 18.8 | 9.1 | 4.0 | 4.5 | 4.9 | 6.3 | 19.3 | 30.6 |
| Indiana | 9.8 | 3.7 | 15.1 | 3.0 | 5.6 | 13.3 | 26.4 | 28.5 | |
| Kansas | 1.6 | 1.9 | 2.3 | 4.8 | 7.4 | 11.0 | 21.4 | 30.4 | |
| Kentucky | 4.2 | 5.2 | 5.3 | 6.8 | 10.6 | 17.2 | 31.0 | 40.5 | |
| Louisiana | 15.5 | 16.7 | 8.6 | 18.1 | 21.3 | 9.5 | 3.9 | 8.7 | 18.4 |
| Maryland | 18.6 | 11.0 | 5.0 | 4.4 | 2.9 | 2.5 | 12.5 | 20.2 | |
| Massachusetts | 57.7 | 31.1 | 9.3 | 2.4 | 2.3 | 1.0 | 2.6 | 5.0 | 10.6 |
| Michigan | 1.9 | 1.8 | 2.8 | 2.1 | 5.4 | 15.0 | 23.9 | ||
| Minnesota | 5.2 | 7.9 | 2.8 | 0.9 | 3.0 | 2.6 | 5.8 | 17.8 | 19.1 |
| Mississippi | 8.0 | 8.8 | 6.0 | 7.1 | 10.6 | 9.1 | 4.1 | 8.0 | 11.3 |
| Montana | 8.0 | 22.1 | 43.8 | 27.8 | |||||
| Nevada | 8.0 | 3.7 | 1.8 | 4.3 | 6.1 | 2.3 | 2.5 | 7.8 | 9.6 |
| New Hampshire | 17.8 | 18.5 | 9.6 | 2.7 | 1.8 | 4.0 | 7.6 | 17.7 | 24.1 |
| New Jersey | 72.5 | 37.3 | 11.6 | 3.2 | 1.0 | 1.8 | 2.6 | 6.9 | 14.3 |
| North Carolina | 4.7 | 4.7 | 3.4 | 5.1 | 9.3 | 8.7 | 9.4 | 9.4 | 16.8 |
| Ohio | 19.0 | 10.2 | 4.7 | 6.2 | 7.9 | 6.4 | 11.4 | 29.4 | 42.3 |
| Oklahoma | 5.2 | 3.4 | 1.8 | 3.3 | 6.0 | 6.2 | 7.7 | 6.7 | 12.9 |
| Oregon | 2.3 | 2.5 | 3.9 | 3.3 | 3.6 | 8.6 | 20.5 | ||
| Pennsylvania | 19.5 | 15.5 | 7.1 | 4.1 | 4.0 | 4.4 | 5.9 | 16.0 | 35.7 |
| Rhode Island | 36.9 | 30.5 | 4.2 | 1.2 | 2.7 | 5.2 | 3.4 | 15.9 | 32.8 |
| South Carolina | 5.0 | 6.1 | 3.1 | 9.7 | 9.1 | 7.2 | 5.8 | 5.9 | 8.3 |
| South Dakota | 15.6 | 19.9 | 35.6 | 34.1 | |||||
| Tennessee | 2.7 | 1.7 | 1.3 | 3.7 | 12.7 | 9.5 | 11.4 | 21.5 | 22.5 |
| Texas | 1.2 | 2.0 | 16.1 | 11.0 | 6.5 | 8.4 | 15.0 | 19.0 | |
| Utah | 2.4 | 3.2 | 5.9 | 3.4 | 5.0 | 8.3 | 14.6 | 16.3 | |
| Vermont | 0.4 | 4.5 | 2.2 | 0.5 | 0.1 | 0.0 | 6.3 | 15.4 | |
| Virginia | 4.9 | 9.4 | 5.3 | 3.3 | 3.4 | 4.2 | 4.5 | 7.2 | 13.0 |
| Washington | 2.5 | 2.5 | 3.6 | 2.4 | 2.9 | 4.4 | 7.6 | ||
| Wisconsin | 2.6 | 1.8 | 1.3 | 0.7 | 1.1 | 0.8 | 3.8 | 7.5 | 7.0 |
| NOTES: Calculations exclude the first week of reported data since the first week of data does not reflect a single week of cases, but rather all cases that have occurred up to that point. State population data is from 2019 US Census Bureau Estimates. | |||||||||
| Table 2: Average Weekly New Long-Term Care Deaths Per 100,000 State Residents, By Month | |||||||||
| April | May | June | July | August | September | October | November | December | |
| US TOTAL | 3.0 | 2.4 | 1.0 | 0.6 | 0.7 | 0.6 | 0.7 | 1.3 | 2.1 |
| (21 states) | (32 states) | (37 states) | (37 states) | (37 states) | (39 states) | (39 states) | (39 states) | (39 states) | |
| California | 0.9 | 0.5 | 0.7 | 0.6 | 0.3 | 0.2 | 0.3 | 1.2 | |
| Colorado | 1.1 | 1.1 | 0.5 | 0.2 | 0.2 | 0.2 | 0.2 | 1.0 | 2.0 |
| Connecticut | 12.3 | 10.1 | 2.4 | 0.8 | 0.1 | 0.0 | 0.4 | 0.7 | 2.4 |
| Delaware | 2.4 | 3.2 | 2.2 | 0.9 | 0.2 | 0.3 | 0.4 | 0.8 | 1.4 |
| District of Columbia | 4.0 | 3.9 | 0.6 | 0.2 | 0.0 | 0.0 | 0.0 | 0.0 | 0.9 |
| Florida | 0.8 | 0.8 | 0.7 | 1.0 | 2.2 | 1.2 | 1.0 | 0.6 | 0.8 |
| Georgia | 1.1 | 1.2 | 0.6 | 0.8 | 1.5 | 0.6 | 0.3 | 0.6 | 0.7 |
| Idaho | 0.1 | 0.7 | 1.3 | 0.7 | 0.6 | 1.2 | 1.9 | ||
| Illinois | 3.1 | 3.3 | 1.8 | 0.6 | 0.4 | 0.6 | 0.6 | 2.0 | 3.6 |
| Indiana | 2.3 | 0.9 | 1.7 | 0.8 | 0.4 | 0.9 | 2.0 | 3.3 | |
| Iowa | 0.4 | 1.0 | 0.7 | 0.9 | 0.8 | 1.0 | 1.5 | 0.7 | |
| Kansas | 0.2 | 0.4 | 0.2 | 0.3 | 0.8 | 1.2 | 1.8 | 3.5 | |
| Kentucky | 0.6 | 0.6 | 0.5 | 0.3 | 0.7 | 1.0 | 1.8 | 2.8 | |
| Louisiana | 2.4 | 1.2 | 1.1 | 2.5 | 0.7 | 0.3 | 0.7 | 1.5 | |
| Maryland | 3.2 | 2.1 | 0.5 | 0.3 | 0.1 | 0.1 | 0.5 | 1.8 | |
| Massachusetts | 11.3 | 7.5 | 3.2 | 1.2 | 1.1 | 0.9 | 1.1 | 1.1 | 1.9 |
| Michigan | 0.2 | 0.4 | 0.3 | 0.1 | 0.6 | 1.4 | 2.7 | ||
| Minnesota | 2.2 | 1.3 | 0.4 | 0.5 | 0.5 | 1.0 | 2.7 | 3.9 | |
| Mississippi | 0.9 | 2.2 | 1.2 | 1.6 | 2.2 | 1.6 | 0.7 | 1.1 | 1.8 |
| Montana | 0.5 | 1.5 | 3.2 | 2.8 | |||||
| Nevada | 0.3 | 0.5 | 0.2 | 0.2 | 0.5 | 0.5 | 0.4 | 0.4 | 0.9 |
| New Hampshire | 1.2 | 2.7 | 1.7 | 0.3 | 0.2 | 0.1 | 0.5 | 0.7 | 2.6 |
| New Jersey | 13.5 | 7.3 | 1.8 | 0.8 | 0.8 | 0.2 | 0.2 | 0.2 | 0.6 |
| New York | 0.8 | 3.1 | 0.4 | 0.2 | 0.1 | 0.0 | 0.1 | 0.3 | 1.0 |
| North Carolina | 0.7 | 0.7 | 0.5 | 0.3 | 0.9 | 1.0 | 0.8 | 0.9 | 1.2 |
| North Dakota | 0.2 | 0.3 | 0.4 | 2.0 | 5.0 | 7.5 | 6.1 | ||
| Ohio | 1.7 | 1.0 | 0.7 | 0.6 | 0.7 | 0.5 | 0.9 | 2.0 | |
| Oklahoma | 0.5 | 0.5 | 0.2 | 0.2 | 0.6 | 0.4 | 0.4 | 0.6 | 0.8 |
| Oregon | 0.3 | 0.2 | 0.4 | 0.4 | 0.3 | 0.5 | 1.7 | ||
| Pennsylvania | 4.2 | 3.2 | 2.3 | 0.6 | 0.5 | 0.5 | 0.5 | 1.4 | 3.8 |
| Rhode Island | 2.9 | 8.9 | 4.0 | 0.7 | 0.3 | 0.9 | 1.3 | 1.7 | 4.4 |
| South Carolina | 0.6 | 0.7 | 0.5 | 1.4 | 1.8 | 1.3 | 0.6 | 0.6 | 0.3 |
| South Dakota | 0.6 | 2.3 | 6.0 | 8.1 | |||||
| Tennessee | 0.2 | 0.3 | 0.2 | 0.1 | 0.9 | 0.7 | 0.9 | 1.1 | 1.7 |
| Texas | 0.2 | 0.2 | 0.9 | 1.3 | 0.6 | 0.5 | 0.8 | 1.2 | |
| Utah | 0.2 | 0.2 | 0.2 | 0.5 | 0.4 | 0.1 | 0.4 | 0.4 | 0.8 |
| Virginia | 0.4 | 1.9 | 0.8 | 0.3 | 0.3 | 0.6 | 0.5 | 0.5 | 0.9 |
| Washington | 0.4 | 0.3 | 0.6 | 0.3 | 0.4 | 0.5 | 0.5 | ||
| Wisconsin | 0.5 | 0.4 | 0.1 | 0.2 | 0.1 | 0.5 | 1.2 | 1.4 | |
| NOTES: Calculations exclude the first week of reported data since the first week of data does not reflect a single week of deaths, but rather all deaths that have occurred up to that point. State population data is from 2019 US Census Bureau Estimates. | |||||||||