Medicare Part D in Its Ninth Year: The 2014 Marketplace and Key Trends, 2006-2014
Section 5: Part D Performance Ratings
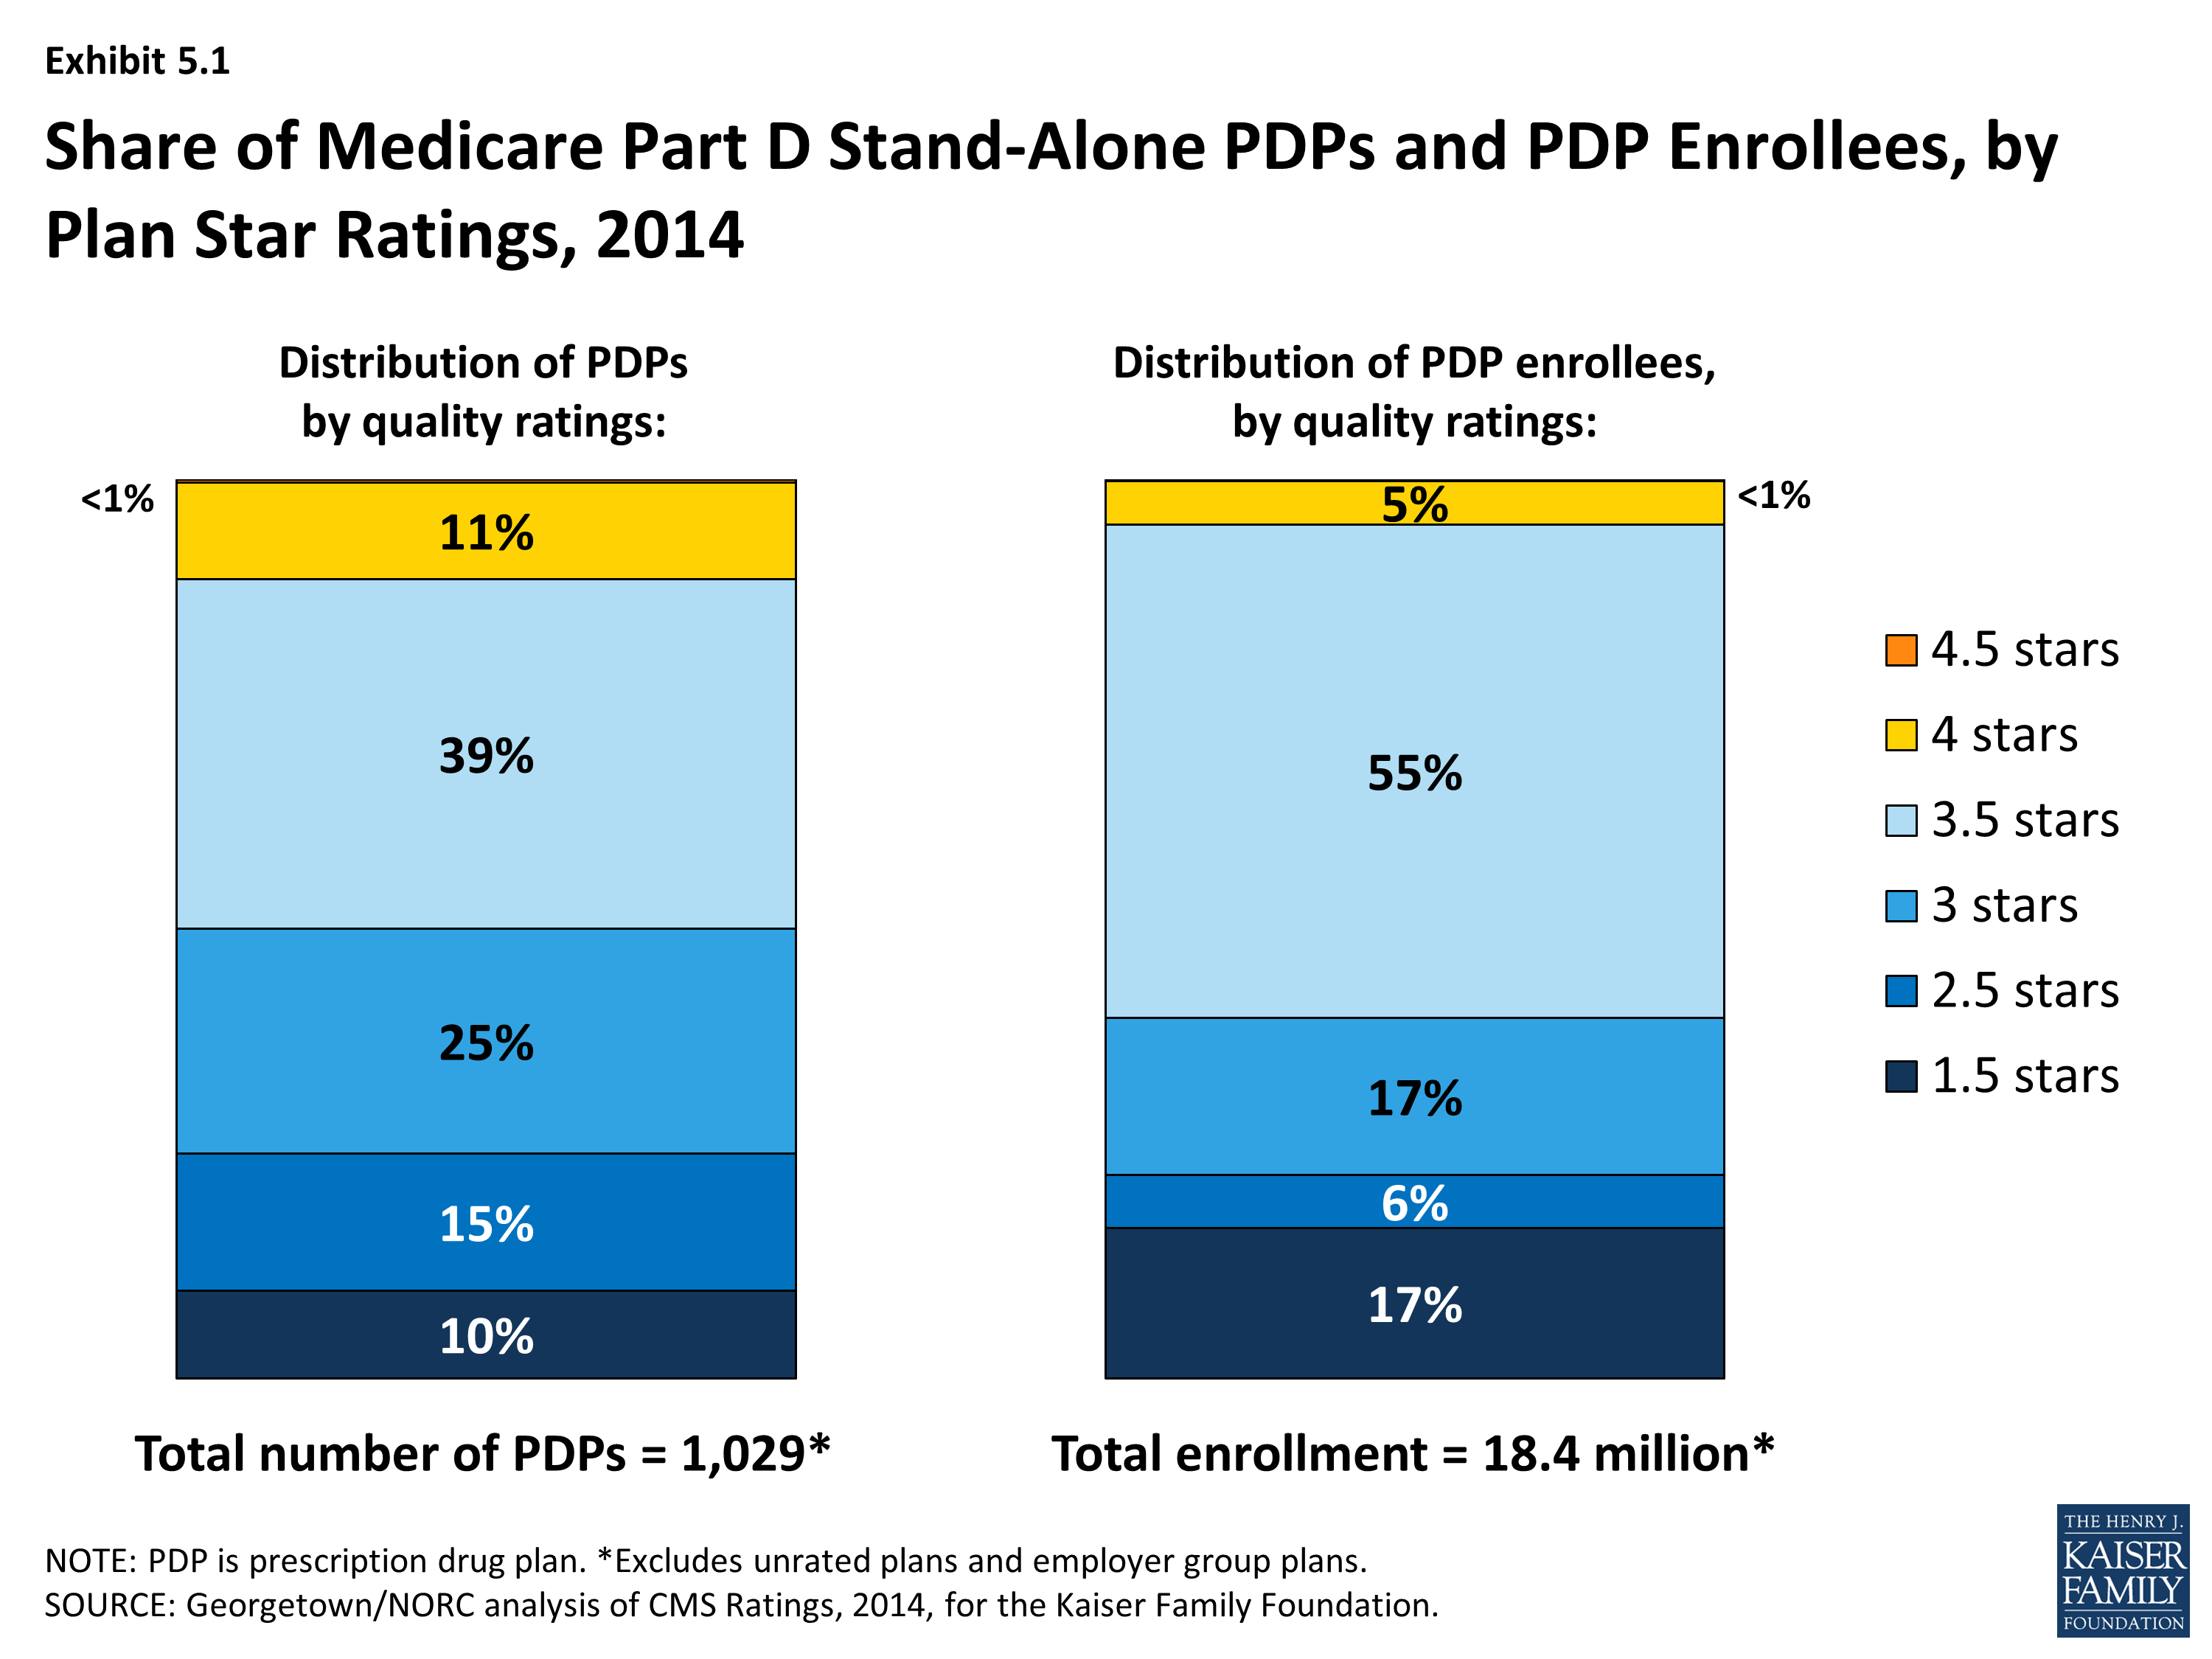
More than two thirds (72 percent) of all PDP enrollees are in plans with average ratings (3 and 3.5 of 5 stars), and another 5 percent are in plans with ratings of four stars or higher; nearly one-fourth (23 percent) of PDP enrollees are in plans with below-average ratings (fewer than 3 stars) (Exhibit 5.1). CMS has reported performance ratings for Part D plans since the fall of 2006 and has used a five-star scale since the fall of 2008.1 In 2014, the Part D ratings are based on 15 measures in 4 categories. CMS has moved toward more use of outcome and patient experience measures (such as medication adherence for statins or diabetes medications), rather than process measures (such as call center performance). For 2014, the agency dropped three process measures (timeliness of enrollment transactions, ease of getting information from drug plan, and call center hold time for pharmacists), but did not add any new outcome measures. In contrast to the ratings for Medicare Advantage plans, however, CMS does not use quality ratings for Part D plans to determine bonus payments to these plans or to make plan assignments for LIS beneficiaries.
Overall Part D plan ratings in 2014 are up from 2013, but remain somewhat lower than in 2011. The degree to which differences reflect changing performance by the PDPs or modifications of the rating measures used by CMS is unclear. About 50 percent of PDPs have ratings of 3.5 stars or higher in 2014, compared to 39 percent of PDPs in 2013 and 56 percent of PDPs in 2011. Ratings in 2014 for MA-PD plans are much higher than for PDPs and are up from 2013.2 About 87 percent of MA-PD plans have drug plan ratings of 3.5 stars or higher in 2014, compared to 50 percent of PDPs. About 26 percent of MA-PD plans received 4.5 or 5.0 stars, compared to less than 1 percent of PDPs.
Based on the pattern of enrollment by plan ratings, there is little evidence to suggest that beneficiaries use ratings to guide their enrollment decisions. In 2014, the share of PDP enrollees in plans with relatively high ratings (3.5 stars or more)—60 percent—is somewhat higher than the share of PDPs (50 percent) with those ratings (Exhibit 5.1). However, an analysis of plan switching between 2009 and 2010 shows that enrollees in plans with at least 4 stars were actually more likely to switch than those in lower rated plans (16 percent versus 10 percent). It also shows that those who did switch plans were only slightly more likely to end up in a higher-rated plan (29 percent versus 20 percent).3 In a recent set of focus groups, most seniors on Medicare were not aware of the star ratings. Overall, they thought ratings could be helpful, but thought they were unlikely to be a major factor in their plan choice.4 More research is needed to determine the role of performance ratings on individual beneficiary choices.
Under current CMS policy, plans with ratings of less than three stars for three years in a row are subject to a special “low performance” flag on the Medicare Plan Finder website and may have their contracts terminated. Wellpoint has received this designation for the second straight year for its MedicareRx Rewards Standard and Plus PDPs (about 48,000 enrollees in 24 regions). Despite increasing its rating from 2 to 2.5 stars, the MedicareRx Rewards PDPs lost nearly 20 percent of their enrollees, perhaps as a result of this designation. CIGNA received this designation for the HealthSpring PDPs it acquired in 2012 (421,000 enrollees in 34 regions). In addition, three of the seven sponsors with PDP contracts in Puerto Rico have the “low performance” flag.
Starting in 2012, beneficiaries have been eligible at any time outside the regular open enrollment period to switch from their current drug plan to a PDP with a five-star rating (or a MA-PD plan with an overall five-star rating). In 2014, however, no PDPs have five-star ratings (only three PDPs had five stars in 2013). Among MA-PD plans, 47 plans with about 772,000 enrollees earned five stars. They include all 34 Kaiser Permanente plans and several smaller plans operating in five different states. Information is not available on how many people have used this special enrollment period, but aggregate monthly enrollment numbers suggest that most Part D enrollees have not acted on this option.