Medicare Part D in 2016 and Trends over Time
Section 5: Part D Plan Performance Ratings
In 2016, a much larger share of MA-PD plan enrollees than PDP enrollees are in plans with 4 or more stars out of a possible 5 stars for the rating factors based on their Part D performance.
- Less than one in five PDPs (18 percent) are rated with 4 or more stars in 2016; one-fourth of all PDP enrollees are in these plans (Exhibit 5.1). By contrast, 69 percent of MA-PD plans, with 83 percent of MA-PD plan enrollees, have 4 or more stars for the rating factors based on their Part D performance. Medicare Advantage plans receive higher payments if they receive at least 4 stars for their performance providing all Medicare-covered services, including Part D, where applicable. Stand-alone PDPs have no direct financial incentives connected to their star ratings.
- In 2016, one in four PDPs (26 percent), with 7 percent of PDP enrollees, are rated 2.5 or fewer stars. By contrast, only 1 percent of MA-PD plans, with less than 1 percent of enrollees, have 2.5 or fewer stars for their Part D performance in 2016. Plans with ratings this low for three consecutive years are flagged by CMS as “low-performing plans” and are at risk for having their contracts canceled, though CMS has not yet exercised the option of canceling contracts.
- About 20 percent of MA-PD plan enrollees are in 5-star drug plans in 2016, as measured by their Part D performance ratings alone. By contrast, only 2 PDPs with 21,000 enrollees, both offered by WPS Health Insurance in Wisconsin, are rated with 5 stars in 2016.
In terms of both national averages and the performance of the leading plan sponsors, ratings have fluctuated annually.
- In the years between 2010 and 2016, plans offered by CVS Health have received as few as 1.5 stars and as many as 4 stars, while the ratings for Humana’s plans have ranged from 2.5 to 4 stars (Exhibit 5.2). Changes are made each year to star rating component measures and to the cut points on each measure; these factors may influence the year-to-year variability in ratings. This variability limits the value of ratings to CMS in assessing plan performance and to consumers in selecting plans.
- The average PDP plan rating, weighted by enrollment, declined from 3.7 stars in 2015 to 3.3 stars in 2016, but is closer to the averages in 2013 (3.1 stars) and 2014 (3.0 stars) (Exhibit 5.3). The average PDP plan rating has fluctuated up and down since 2011, in contrast to the trend in the average MA-PD plan rating for the rating factors based on their Part D performance, even though both types of plans are scored on the same Part D performance factors.
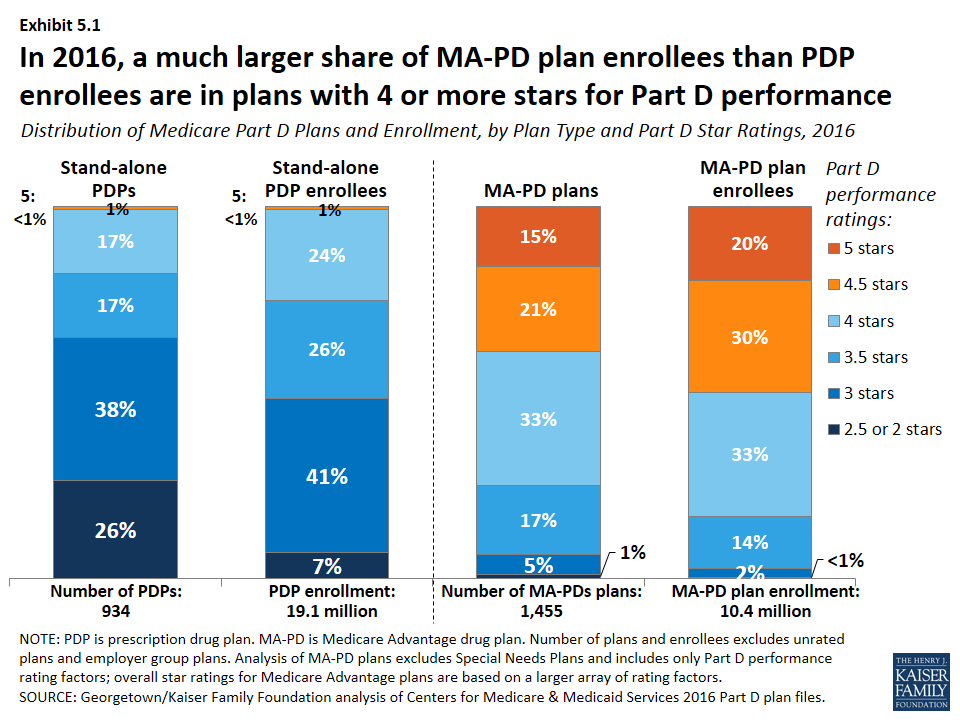
Distribution of Medicare Part D Plans and Enrollment, by Plan Type and Part D Star Ratings, 2016
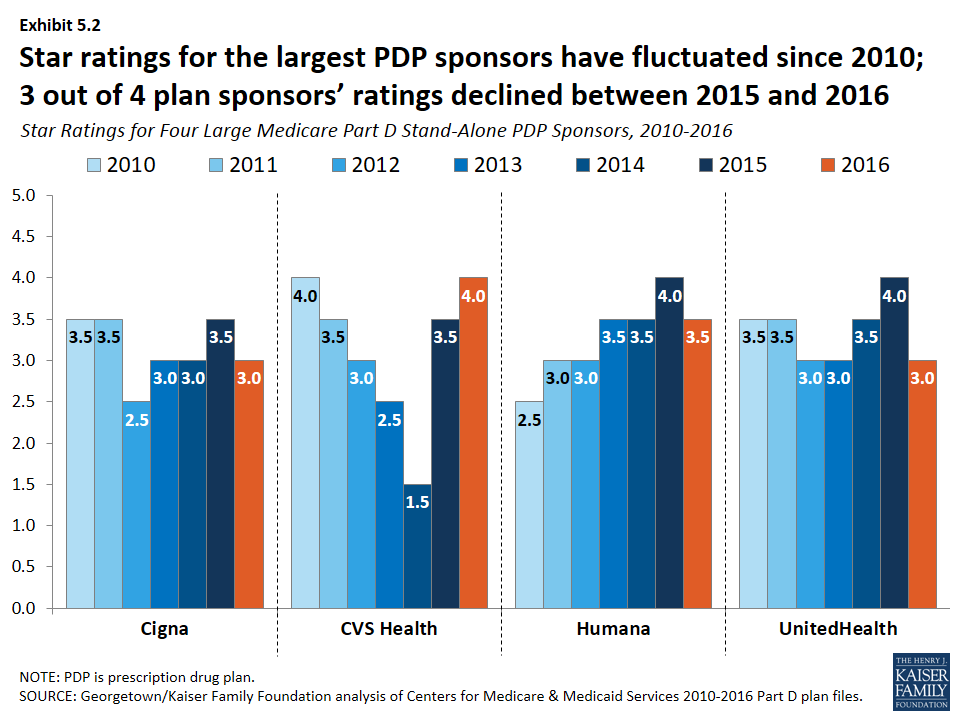
Star Ratings for Four Large Medicare Part D Stand-Alone PDP Sponsors, 2010-2016
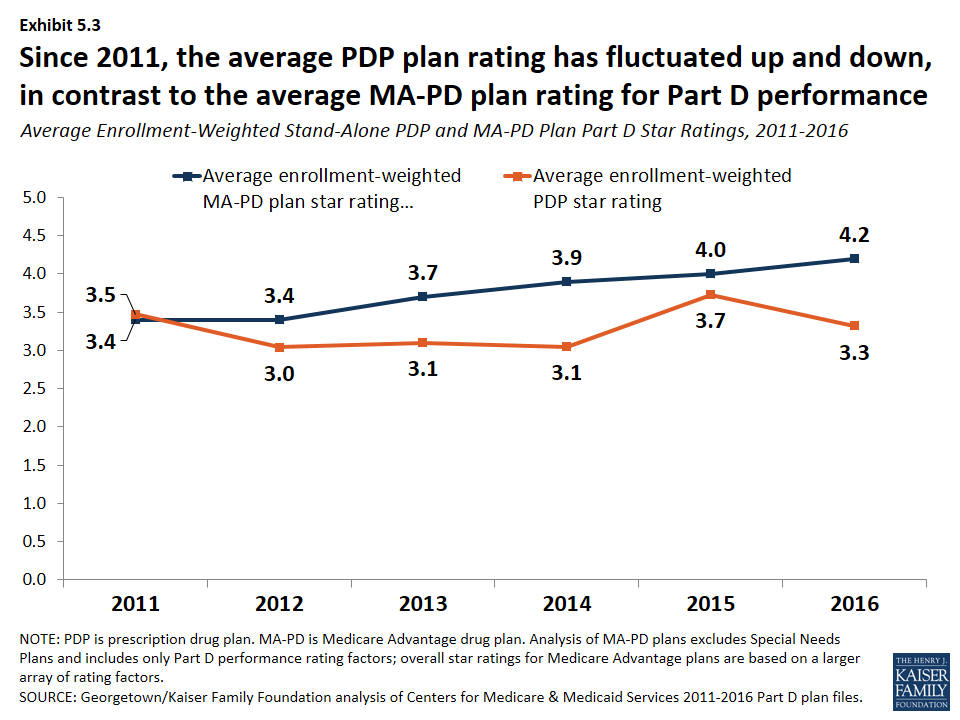
Average Enrollment-Weighted Stand-Alone PDP and MA-PD Plan Part D Star Ratings, 2011-2016
x
Exhibit 5.1
x
Exhibit 5.2
x