Medicaid Home and Community-Based Services Programs: 2012 Data Update
Executive Summary
As states continue to implement various aspects of the Affordable Care Act (ACA), developing and expanding home and community-based alternatives to institutional care remains a priority for many state Medicaid programs. 2013 marked the first time that home and community-based services (HCBS) accounted for the majority of national Medicaid long-term services and supports (LTSS) dollars (51%), increasing from 18 percent in 1995.1 State Medicaid programs are operating in an environment of sustained economic improvement and as of 2015, continue to face the competing priorities of implementing the ACA’s streamlined eligibility and enrollment processes, determining whether to adopt the ACA’s Medicaid expansion, and pursuing a variety of delivery and payment system reforms. States also continue to have access to some of ACA’s new and expanded LTSS options, some of which offer enhanced federal matching funds, to expand beneficiary access to Medicaid HCBS.
This report summarizes the key national trends to emerge from the latest (2012) participant and expenditure data for the three main Medicaid HCBS programs: (1) the mandatory home health services state plan benefit, (2) the optional personal care services state plan benefit, and (3) optional § 1915(c) HCBS waivers. It also briefly discusses the provision of Medicaid HCBS through § 1115 demonstration waivers and highlights findings from a 2014 survey of Medicaid HCBS participant eligibility, enrollment, and provider reimbursement policies. States also may provide HCBS through various options offered by the ACA, which are outside the scope of this report.
Key Findings: Trends in Medicaid HCBS Participants and Expenditures, 2002-2012
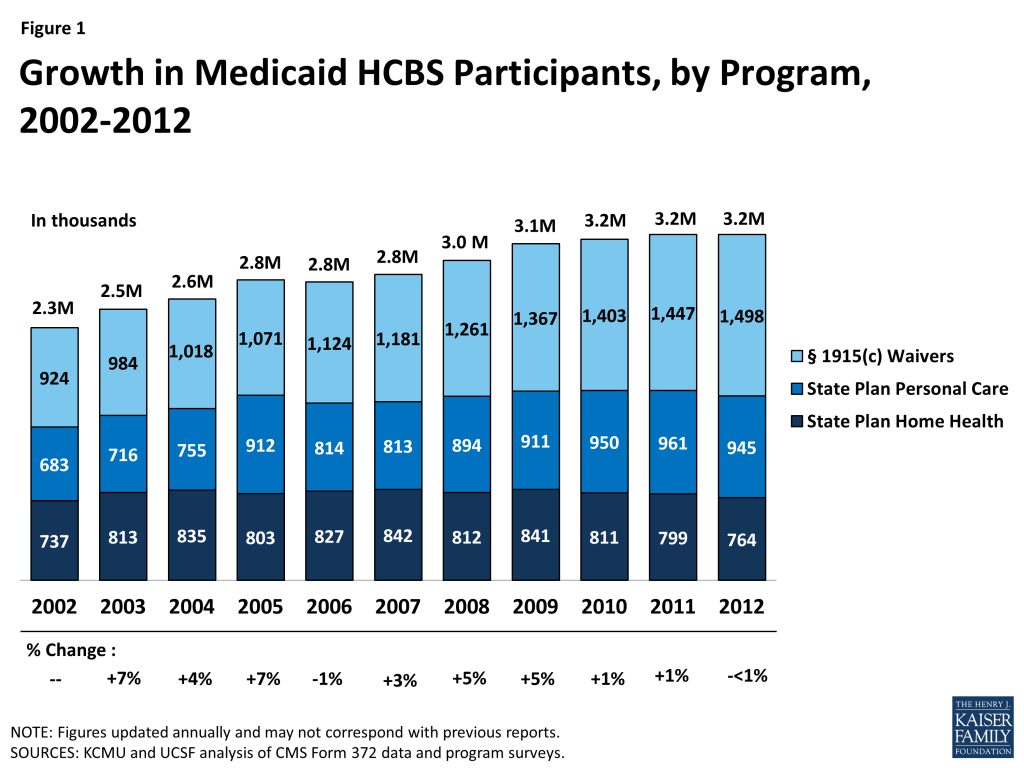
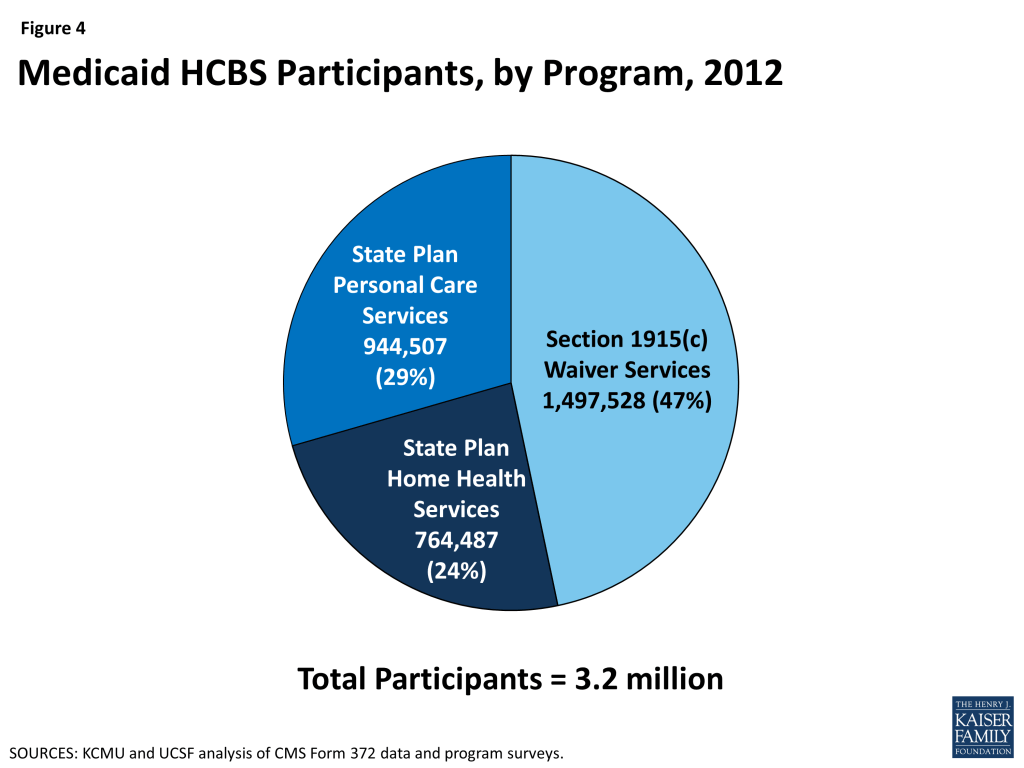
- In 2012, more than 3.2 million people accessed LTSS through one of the three main Medicaid HCBS programs (Figure 1). Within this population, the number of people receiving § 1915(c) waiver services increased slightly from 2011 to 2012 (by 3%), while the number of people receiving personal care state plan services and home health state plan services decreased (by 2% and 4%, respectively). A total of 764,487 people received home health state plan services (in 50 states and DC), 944,507 received personal care state plan services (in 32 states), and almost 1.5 million were served through § 1915(c) waivers (in 47 states and DC). The number of individual § 1915(c) waivers declined slightly (<1%) to 290 nationwide in 2012. States also may offer HCBS through the new ACA options instead of or in addition to these three programs.
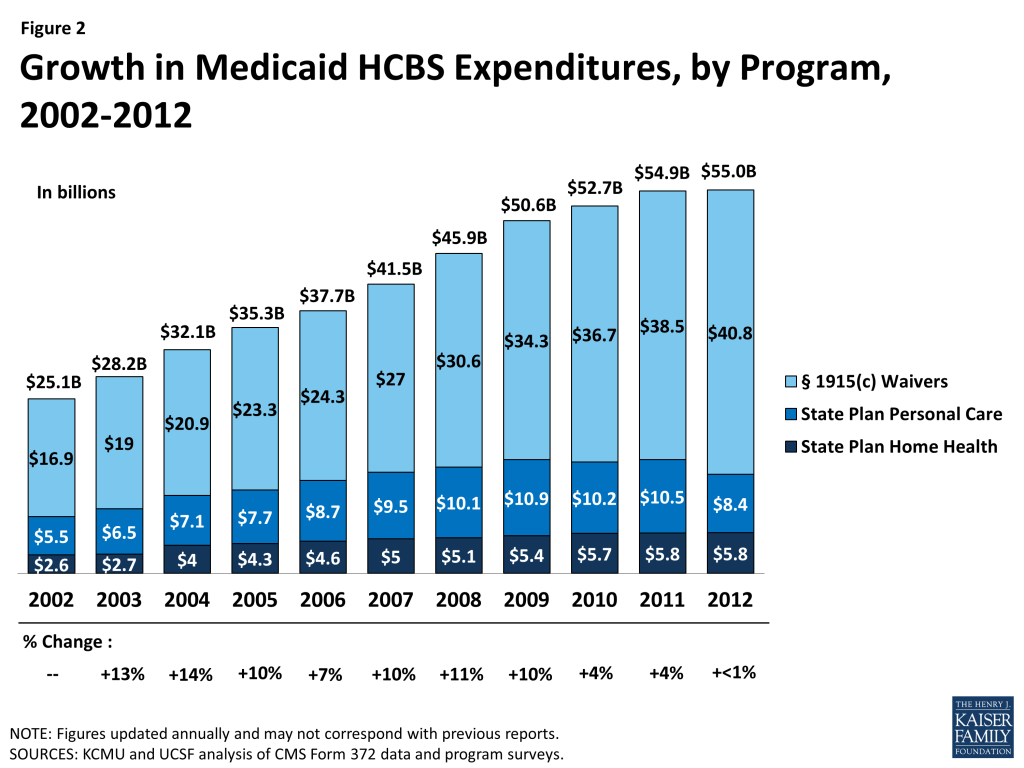
- In 2012, Medicaid HCBS expenditures for home health state plan services, personal care state plan services, and § 1915(c) waivers totaled $55 billion, increasing slightly from 2011, and lower than the 10-year average of eight percent (Figure 2). In 2012, spending growth in HCBS programs was led by § 1915(c) waivers (6%), followed by home health state plan services (1%). Expenditures on personal care state plan services declined by 20 percent from 2011, with most of the decline driven by California’s shifting of funding to its new Community First Choice state plan option.
- Per participant annual spending on Medicaid HCBS averaged $17,151 in 2012, but there was considerable variation among states and programs. Across the states, Medicaid HCBS expenditures per participant served ranged from $8,787 in Mississippi to $42,556 in Tennessee. Per participant spending also varied across the three main HCBS programs, ranging from a national average of $7,617 for home health state plan services participants to $27,232 for § 1915(c) waiver participants. These program-to-program differences were due to the types and extent of services offered in the different home and community-based programs. Per participant spending also varied among § 1915(c) waivers targeted to different beneficiary populations. For example, per participant spending in § 1915(c) waivers targeted to beneficiaries with intellectual/developmental disabilities (I/DD) was considerably higher than for other beneficiary groups, reflecting the I/DD population’s relatively more intensive need for LTSS.
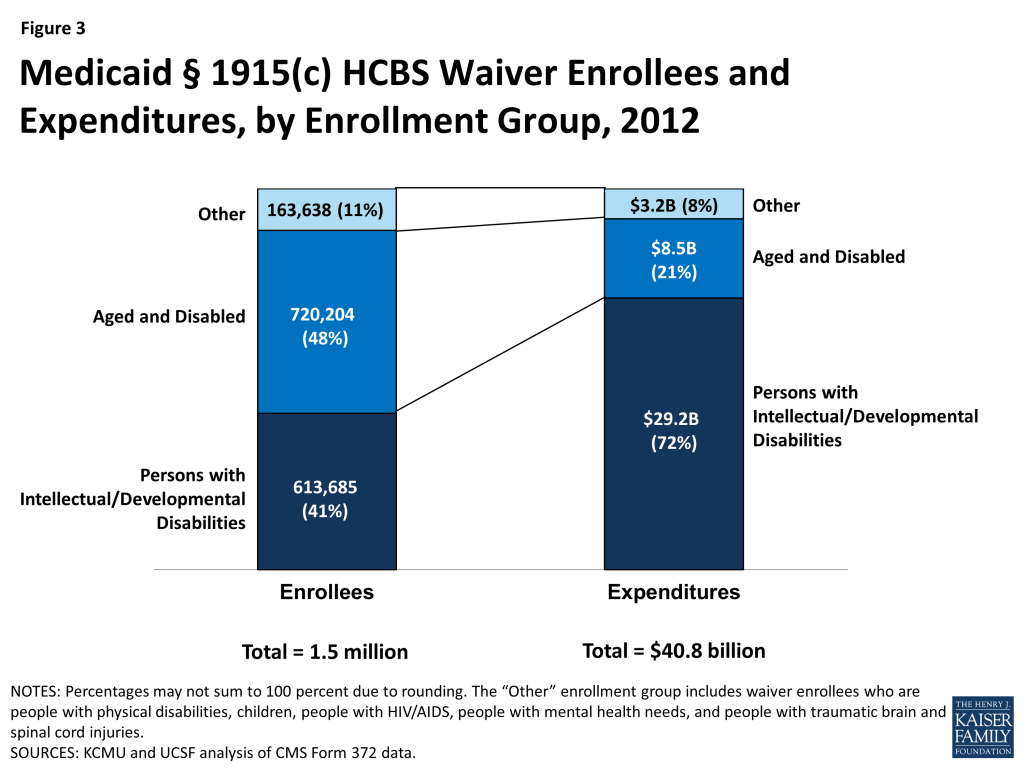
- The aged/disabled population made up the largest share of waiver enrollment (48%) but accounted for 21% of spending on waiver services in 2012. People with I/DD accounted for 41% of HCBS waiver enrollment in 2012, but 72% of spending on waiver services was devoted to this population, again reflecting their more intensive need for LTSS relative to other groups (Figure 3).
- A minority of states use § 1115 demonstration waivers to deliver HCBS. As of 2012, three states (Arizona, Rhode Island, and Vermont) do not operate any § 1915(c) waivers and instead use § 1115 waivers to administer statewide Medicaid managed care programs that include all covered HCBS for all populations and services. Another five states (Delaware, Hawaii, New York, Tennessee, and Texas) use § 1115 waivers for Medicaid managed care programs that include HCBS for at least some geographic areas and/or populations; these states also offer HCBS via § 1915(c) waivers for other geographic areas and/or populations.2
2014 Policies in Medicaid HCBS Programs
- In 2014, all states reported using cost controls in § 1915(c) waivers, such as restrictive financial and functional eligibility standards, enrollment limits, or waiting lists. About 25 percent of § 1915(c) waiver programs used financial eligibility standards that were more restrictive than those used to determine eligibility for Medicaid coverage of institutional care. However, 10 § 1915(c) waivers used more restrictive functional eligibility criteria than those used for institutional care. Almost two-third of states offering personal care state plan services (62%, or 21 states) had some form of cost controls in place, with the majority utilizing service unit limitations. Over half of states (59%, or 30 states) had some form of expenditure or service restriction in place in their home health state plan services programs.
- In 2014, more than 582,000 people were on § 1915(c) waiver waiting lists, and the average waiting time exceeded two years. The growth in the number of people on waiting lists continued to increase, although by a smaller percent than the average annual growth rate (8.5% in 2013 compared to 11% average growth over the preceding decade). The average national waiting time for § 1915(c) waiver services was 29 months, with wide variations among waivers for different target populations and across states. The average length of time a person spent on a waiting list ranged from three months for HIV/AIDS waivers to 47 months for I/DD waivers.
- The use of beneficiary self-direction as an alternative service delivery model was present in each of the three major Medicaid HCBS programs. The self-direction model includes initiatives such as beneficiary choice in the allocation of Medicaid service budgets and/or the selection and dismissal of service providers. Forty-two states (or 90%) with § 1915(c) waivers permitted or required self-direction in at least one of their waivers in 2014. Of the states offering personal care state plan services, 24 (or 71%) permitted self-direction. In contrast, only nine states (or 18%) allowed self-direction of home health state plan services in 2014.
- For both home health and personal care agencies, provider reimbursement rates increased slightly from 2013 to 2014. The national average reimbursement rate per visit for home health agencies was $92.69 and $91.45 in 2014 and 2013, respectively. The hourly reimbursement rate for agencies providing personal care state plan services increased slightly ($18.73 in 2014, and $18.20 in 2013).
Over the past three decades, the increase in access to community-based alternatives to institutional care has resulted in some rebalancing of national Medicaid LTSS dollars, but the size and scope of Medicaid HCBS programs vary across states. Section 1915(c) waivers account for the majority (74%) of spending on LTSS provided in community settings. In the coming years, states will be challenged to continue to expand access to high quality, person-centered HCBS in a cost-effective manner, and it will remain important to monitor states’ adoption of state plan options and other initiatives to expand Medicaid HCBS, differences in services and spending, and the impact of cost control policies on access and quality.
Introduction
Developing home and community-based services (HCBS) alternatives to institutional care has been a priority for many state Medicaid programs over the past three decades. The national share of Medicaid LTSS spending on HCBS has nearly tripled, from 18 percent in 1995 to 51 percent in 2013.3 States’ efforts to expand HCBS options for LTSS have been driven by beneficiary needs and preferences, the United States Supreme Court’s 1999 Olmstead decision finding that the unjustified institutionalization of people with disabilities violates the Americans with Disabilities Act,4 and efforts to control growth in total LTSS expenditures. Medicaid LTSS expenditures represent 34 percent of total Medicaid spending in 2013, with HCBS typically costing less than comparable institutional care.5 Budgetary constraints in an environment of sustained economic improvement after the worst recession since the Great Depression and the administrative complexities of implementing and coordinating the various LTSS options may pose challenges as states and the federal government continue to work toward increasing access to Medicaid HCBS, reducing institutional bias, and rebalancing Medicaid LTSS expenditures.
Over the last fourteen years, the Kaiser Family Foundation’s Commission on Medicaid and the Uninsured (KCMU) has worked with researchers at the University of California, San Francisco (UCSF) to track the development of the three main Medicaid HCBS programs: (1) the mandatory home health services state plan benefit, (2) the optional personal care services state plan benefit, and (3) optional § 1915(c) HCBS waivers. Medicaid HCBS also may be provided through new and expanded options available under the Affordable Care Act (ACA), such as the § 1915(i) HCBS state plan option, the Money Follows the Person demonstration,6 the § 1915(k) Community First Choice state plan option, and the Balancing Incentive Program;7 participants and expenditures attributable to the ACA HCBS options are outside the scope of this report.
In addition, a minority of states provide some or all of their HCBS through § 1115 demonstration waivers, which are briefly discussed in this report. For example, Arizona, Rhode Island, and Vermont do not offer any§ 1915(c) waivers and instead operate their entire Medicaid LTSS programs through § 1115 demonstration waivers.
Beginning in 2002, we also surveyed the policies states use to control spending growth in § 1915(c) waiver programs, such as eligibility criteria and waiting lists. In 2007, we expanded the policy survey to include home health and personal care services state plan benefits. In these state-level surveys, we collect data on eligibility criteria, providers, and scope of services as well as provider reimbursement rates. This report summarizes the main trends to emerge from the latest (2012) participant and expenditure data for the three main Medicaid HCBS programs and findings from the 2014 survey of policies impacting the mandatory home health services state plan benefit, the optional personal care services state plan benefit, and § 1915(c) waivers.
Report: Medicaid Hcbs Participants And Expenditures In 2012
Participants in Medicaid Home Health and Personal Care State Plan Services and § 1915(c) Waivers
In 2012, over 3.2 million individuals received services through the three main Medicaid HCBS programs (Table 1A). Of those participants, 764,487 individuals received home health services through the mandatory state plan benefit, 944,507 individuals received personal care services through the optional state plan benefit, and 1,497,528 individuals were served through § 1915(c) waivers (Figure 4). All states and DC offered the mandatory home health services state plan benefit in their Medicaid programs (Table 1B), while 32 states actively offered the optional personal care services state plan benefit, with Kansas as the latest state to elect this option in 2007 (Table 1C). (Delaware and Rhode Island had approval from the Centers for Medicare and Medicaid Services (CMS) to offer personal care state plan services but did not report any participants in their programs.) Forty-seven states and DC operated multiple § 1915(c) waivers in 2012 (Table 1D).
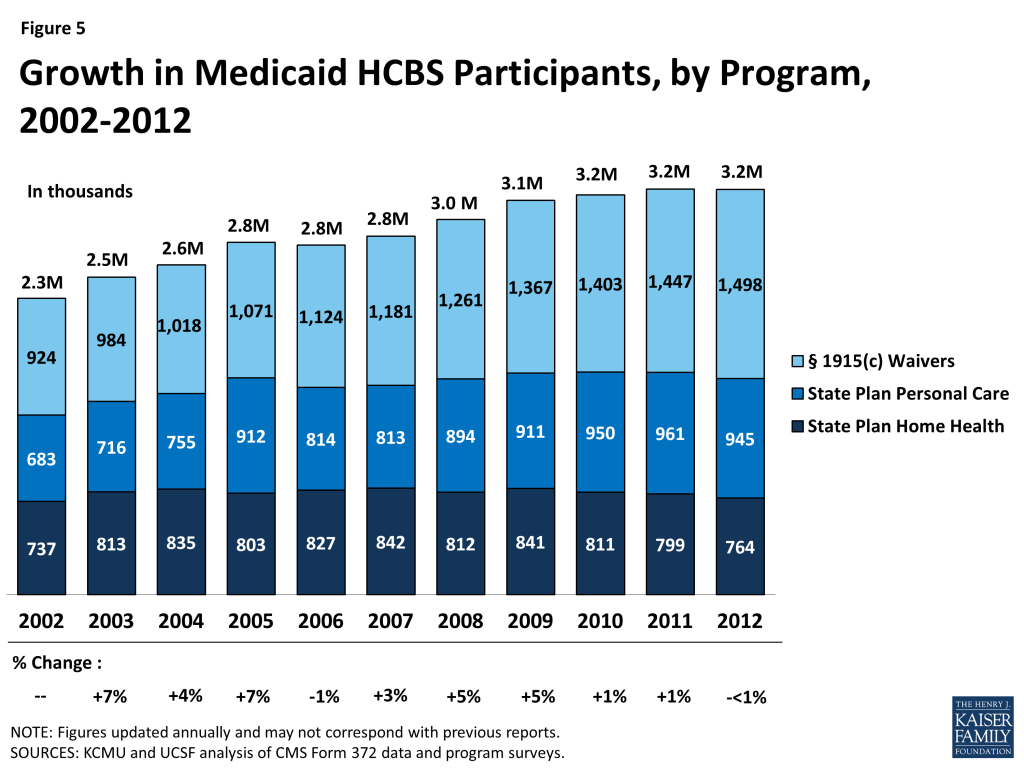
Participation in the three main HCBS programs declined by less than one percent between 2011 and 2012, the first annual decline since 2006, following two years of slight growth. This was also well below the 10-year average growth rate of three percent (Table 1A and Figure 5).
Leading the 13 states with a decline in total HCBS enrollment between 2011 and 2012 was Texas, with a 17 percent decline reported. Louisiana recorded the second largest decline with a 9 percent drop in total HCBS enrollment between 2011 and 2012 (Table 1A). Both Texas and Louisiana’s declines in total HCBS enrollment were led by a drop in their § 1915(c) waiver enrollment as the number of waivers declined in both states. Three waivers in Texas were terminated (one for people with I/DD and 2 for the aged/disabled population), while another was converted to a § 1115 Managed Care waiver in 2012. Louisiana terminated one large aged and disabled waiver. On the other hand, Idaho, Minnesota, and Maine saw the largest increases (27%, 15%, and 14%, respectively) in total HCBS participants in 2012. Idaho’s participant growth was driven by large increases in its two state plan programs while both Minnesota and Maine experienced relatively high participant growth in their home health programs.
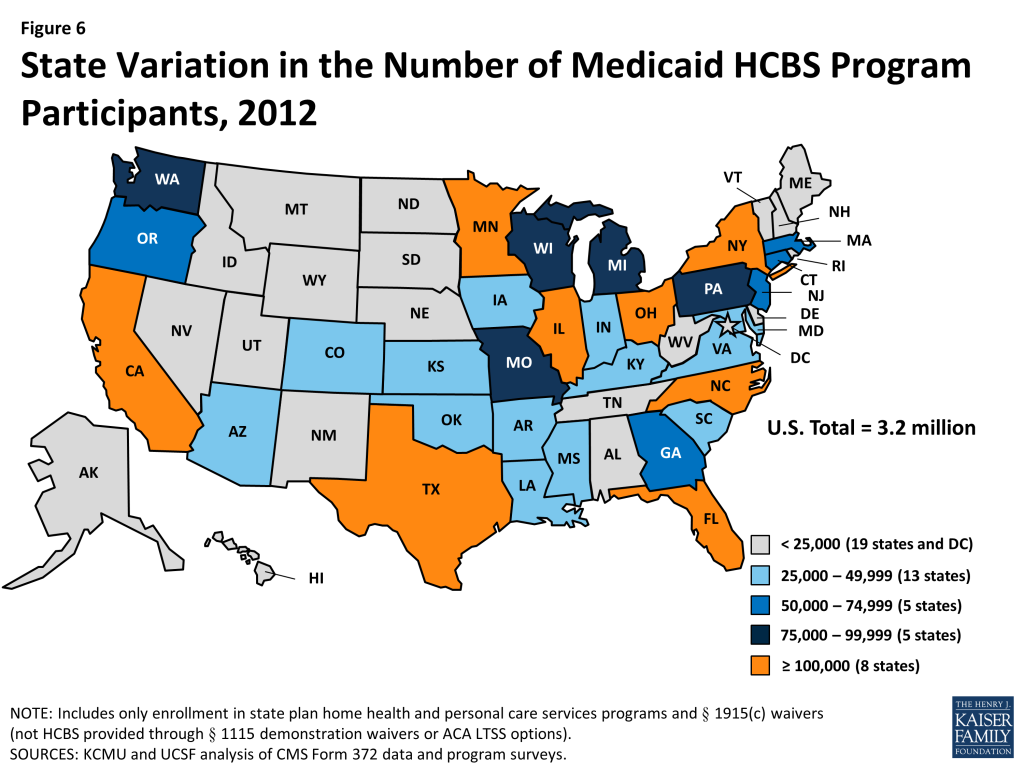
The decline in total HCBS enrollment in 2012 was led by declines in participation in both the home health state plan program (-4%) and in the personal care state plan services program (-2%) (Tables 1B and 1C). Nebraska led the decline in home health program enrollment with a 27 percent drop, due to a change in reporting when the state moved to managed care, while Maine led the decline in personal care state plan participation with a 33 percent drop in 2012, also due to a change in reporting. Nationally, § 1915(c) waiver program participation increased by three percent from 2011 to 2012, and seven states reported declines in participation led by Louisiana (-24%) and Texas (-19%) as noted above (Table 1D). Figure 6 illustrates the variation in total Medicaid HCBS program participation among the states.
Expenditures in Medicaid Home Health and Personal Care State Plan Services and § 1915(c) Waivers
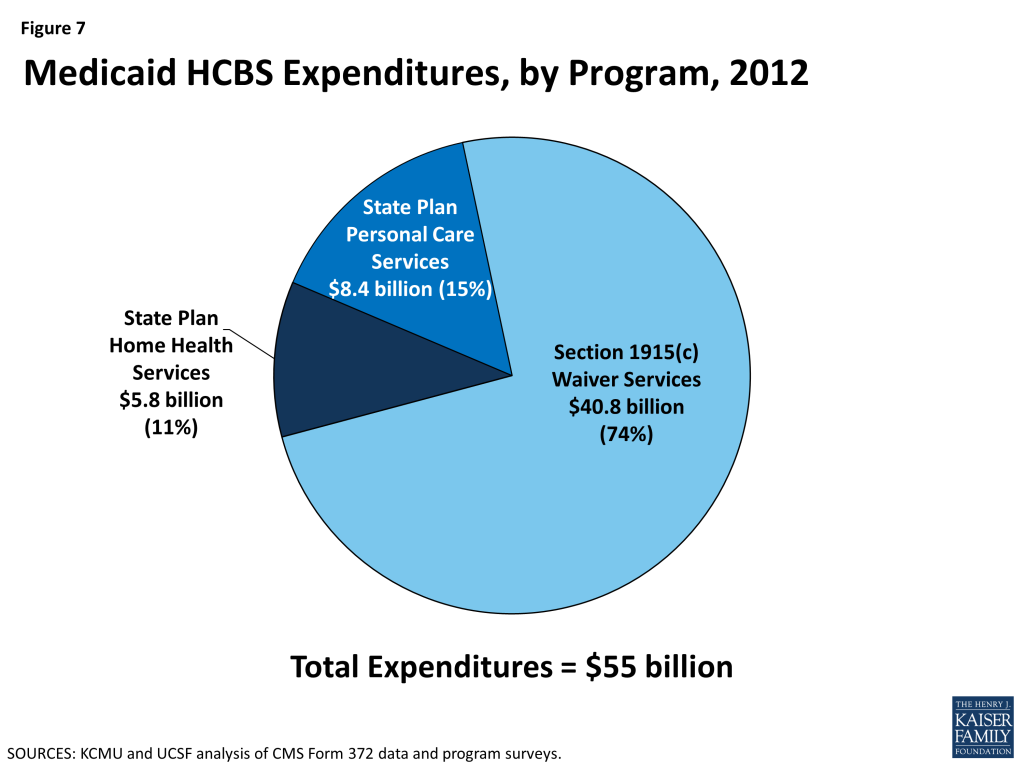
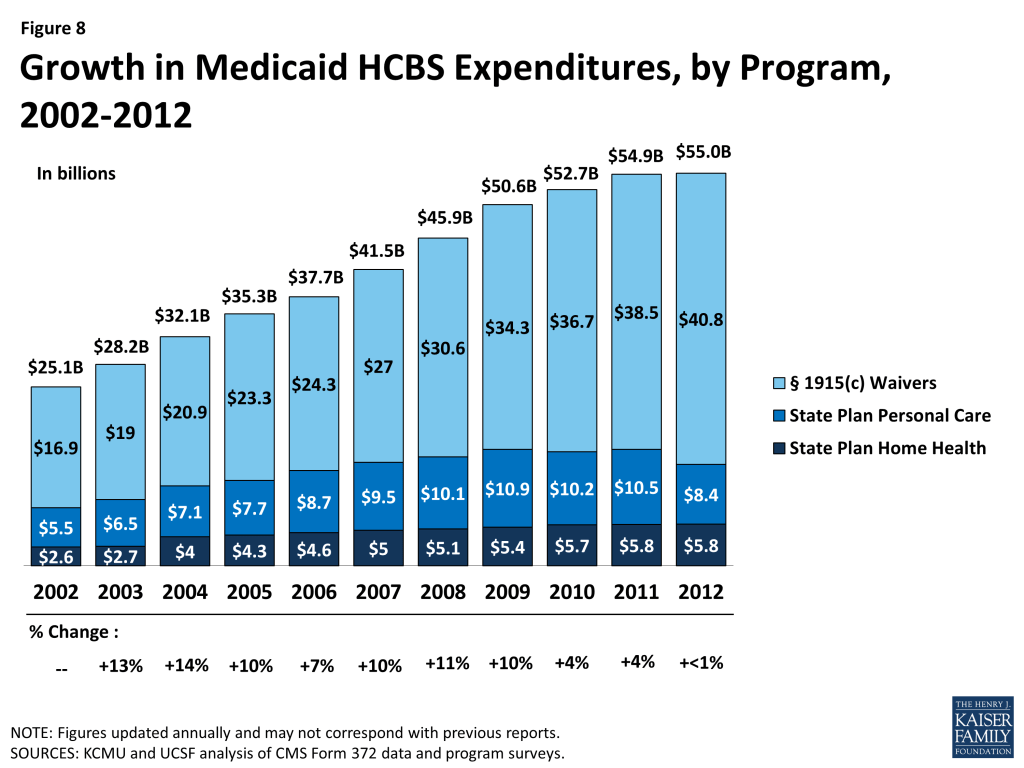
In 2012, total Medicaid spending on HCBS across the three main programs was $55 billion (Table 2A). The large majority of Medicaid spending on HCBS was for § 1915(c) waivers. In 2012, Medicaid spending on § 1915(c) waivers was $40.8 billion, compared to $8.4 billion on personal care state plan services and $5.8 billion on home health state plan services (Tables 2B, 2C, 2D and Figure 7).
Between 2002 and 2012, total annual Medicaid spending on HCBS in the three main programs increased by almost $30 billion (119%) with an average annual increase of eight percent (Figure 8). HCBS spending recorded slight growth between 2011 and 2012, the lowest rate of growth within the 14-year study period. However, this low rate of growth in HCBS spending was still more than the decline of four percent recorded for total Medicaid acute and LTSS expenditures in the same period, which corresponded with a decline in total Medicaid spending growth.8 Amid the stagnant growth in HCBS expenditures, 11 states reported a decline in total Medicaid HCBS expenditures between 2011 and 2012. Declines were led by Texas and Wyoming (both -21%) (Table 2A).
However, Medicaid HCBS expenditures as a proportion of total Medicaid LTSS expenditures continued to increase between 2011 and 2012 as they have done every year since 1995.9
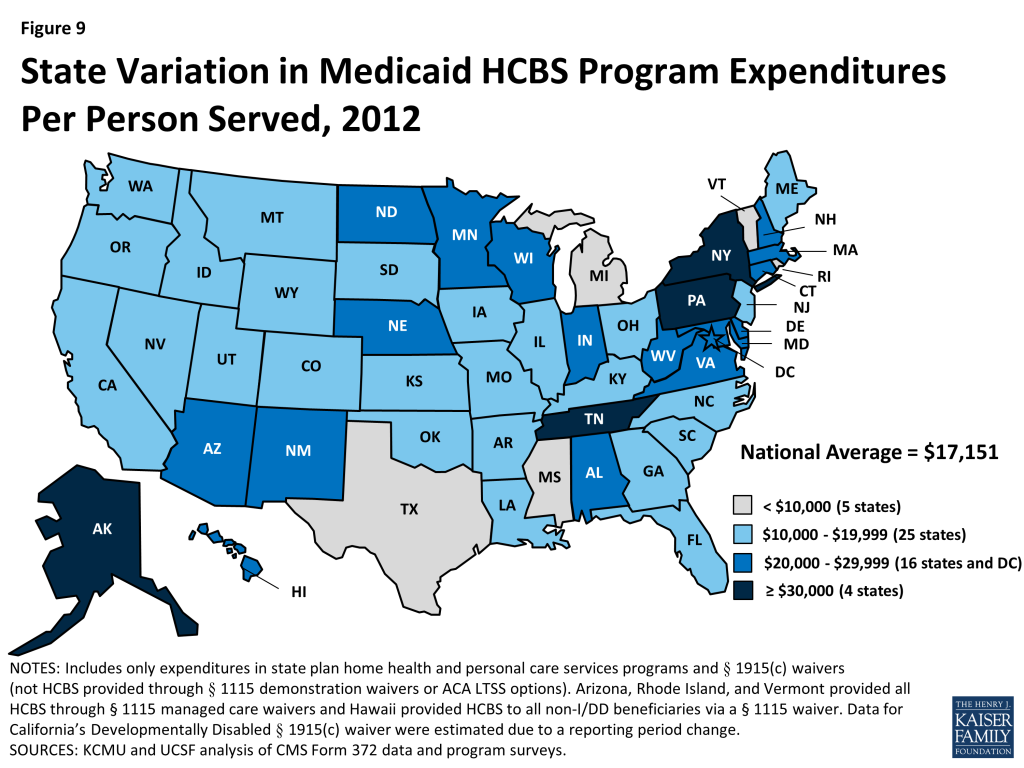
National total Medicaid HCBS expenditure data mask state-to-state variations in spending across the three major programs. First, while national per participant spending on Medicaid HCBS averaged $17,151 in 2012, state spending ranged from $8,787 in Mississippi to $42,556 in Tennessee (Figure 9, Table 3A).
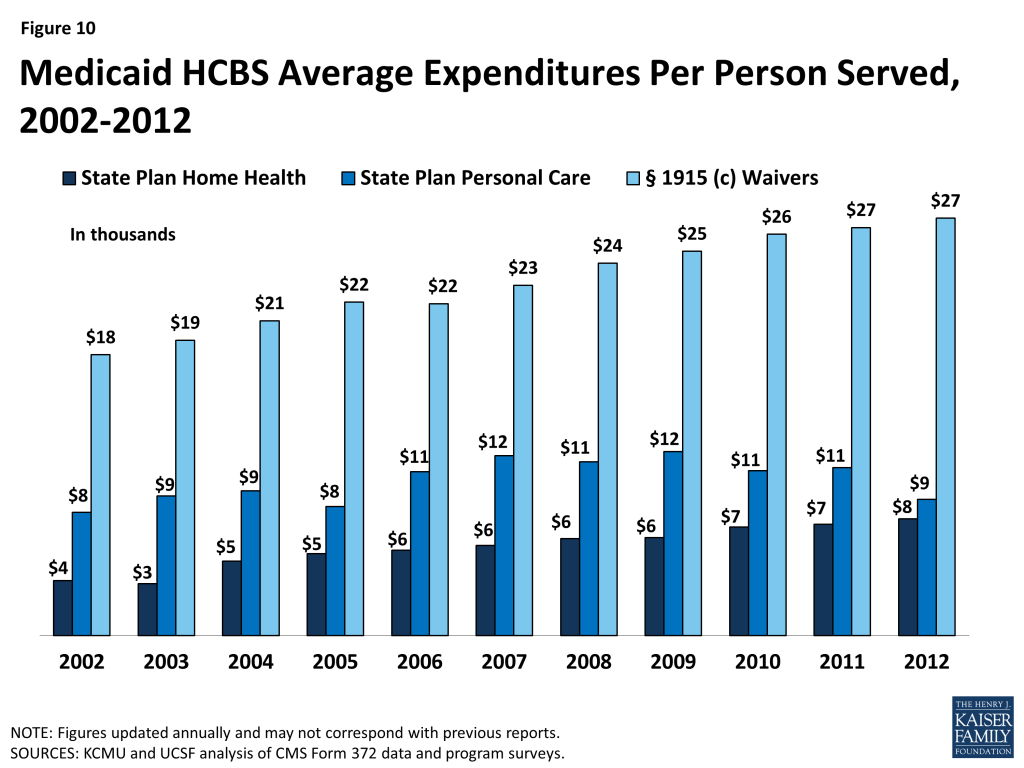
Second, differences exist in spending across the three major Medicaid HCBS programs. National per participant expenditures ranged from $7,617 for home health state plan services participants to $27,232 for § 1915(c) waiver participants in 2012 (Table 3B, 3C, 3D and Figure 10). This difference was likely due to the types and extent of services provided in each of the three main HCBS programs. The lower national per participant spending on home health state plan services likely reflects shorter periods of per participant service utilization compared to either § 1915(c) waivers or the personal care services state plan option. Third, there was also significant per participant expenditure variation among § 1915(c) waivers targeted to different populations (Tables 4 and 7).
Medicaid § 1915(c) Waivers
Between 2011 and 2012, the number of § 1915(c) waivers declined slightly to 290. In 2012, with the exception of Arizona, Rhode Island, and Vermont, which operate their entire Medicaid LTSS programs through § 1115 waivers and therefore do not offer any § 1915(c) waivers, every state and DC had § 1915(c) waivers targeted to populations that would otherwise require institutional care. These beneficiary groups include: the aged (age 65 and over), aged or disabled, individuals with physical disabilities, individuals with I/DD, children who are medically fragile or technology-dependent, individuals with HIV/AIDS, and individuals with traumatic brain and/or spinal cord injury (TBI/SCI).
Table 4 details, by waiver type, § 1915(c) waiver enrollment, total expenditures, and per participant expenditures for the two most recent reporting years. In 2012, 1,497,528 participants were served through Medicaid § 1915(c) waivers (Tables 4 and 5). The three percent (or 50,147 beneficiaries) increase from 2011 to 2012 is the same rate of increase as between 2010 to 2011. The largest share of § 1915(c) waiver participants in 2012 (720,204 beneficiaries, or 48%) received services through waivers that targeted the aged and aged or disabled. The next largest group of waiver participants (613,685) was enrolled in § 1915(c) waivers for persons with I/DD, representing 41 percent of national § 1915(c) waiver enrollment (Table 5 and Figure 11). Enrollment in waivers targeted solely to persons with physical disabilities accounted for only six percent (87,017) of § 1915(c) waiver participants nationwide. The § 1915(c) waivers with the smallest enrollment were those for children who are medically fragile or technology-dependent (41,950), individuals with TBI/SCI (17,072), individuals with HIV/AIDS (13,538), and individuals with mental health disabilities (4,061) (Tables 4 and 5). The § 1915(c) waivers with the largest annual increase in participation were those targeted to people with mental health disabilities (12%), followed by those serving aged individuals (8%). There was a slight decline (less than 1%) in participants for waivers serving aged and disabled individuals, the only decline recorded among all waiver groups (Table 4).

In 2012, overall expenditures for § 1915(c) waivers increased to $40.8 billion, a six percent increase compared to 2011, and the same rate of increase as between 2010 to 2011. The vast majority of spending on § 1915(c) waivers was for individuals with I/DD. Although individuals enrolled in I/DD waivers accounted for just 41 percent of total waiver participants, expenditures for this population accounted for 72 percent of all § 1915(c) waiver spending (Tables 4 and 6 and Figure 10). Between 2011 and 2012, the annual rate of expenditure growth was highest for mental health waivers (15%), mainly due to growth in the five existing § 1915(c) waivers for persons with mental health disabilities. There was a four percent decline in expenditures on waivers serving aged and disabled individuals as well as a less than one percent decline recorded in waivers serving individuals with HIV/AIDS (Table 4).
Growth in § 1915(c) waiver expenditures per participant remained at two percent in 2011-2012, the same as the growth rate in 2010-2011, but lower than the 10-year average of five percent (Tables 4 and 7). Persons with I/DD had the highest spending per participant served ($47,522) (Tables 4 and 7). This amount was more than four times higher than average waiver spending on both aged ($11,490) and aged or disabled ($11,834) waiver participants (Tables 4 and 7). Per participant expenditures grew by eight percent from 2011 to 2012 for waivers serving children who are medically fragile or technology-dependent, with waivers serving the aged and disabled, physically disabled and persons with HIV/AIDS all showing slight declines in per participant spending (Table 4).
Medicaid § 1915(c) Waiver Services
As part of the collection of participant and expenditure data for § 1915(c) waivers, service type data were also collected for individual waivers. States may provide many different services within waivers, which have been collapsed into six categories here: (1) case management; (2) respite/home health/personal care; (3) habilitation/day care; (4) nursing/therapy; (5) residential/foster care; and (6) other services. Participants within a waiver may use more than one service, and, as such, the sum of these participants does not equal the unduplicated total waiver participants. Most participants received “other” services including assistance with chores, meals, transportation, and home modifications. More than 799,000 waiver participants received respite, home health or personal care services within waivers in 2011, with Ohio providing these services to the most waiver enrollees (75,334) (Table 8).
Of the total $40.8 billion spent on § 1915(c) waivers in 2012, almost 38% ($15.4 billion) was spent on habilitation or adult day care services, with New York spending more than $5 billion and Pennsylvania spending almost $1.5 billion. States spent more than $11.5 billion on respite, home health or personal care services within waivers, with Ohio spending almost $1.4 billion on such services (Table 9). The most expensive waiver service on a per participant basis in 2012 was habilitation or adult day care services, with more than $28,000 spent per waiver participant nationwide. There is large inter-state variation in habilitation or adult day care services spending per participant, ranging from $1,702 in Georgia to $59,387 in Connecticut. Case management was the least expensive § 1915(c) waiver service nationwide at $1,647 per participant (Table 10).
HCBS and Managed LTSS within § 1115 Waivers
In addition to the Medicaid home health and personal care services state plan benefits and § 1915(c) waivers, states can deliver HCBS through § 1115 demonstration waivers.10 Section 1115 of the Social Security Act allows the Secretary of the Department of Health and Human Services to waive state compliance with certain federal Medicaid requirements and authorizes the use of federal Medicaid funds in ways that are not otherwise allowable. Section 1115 waivers enable “experimental, pilot or demonstration project[s] which, in the judgment of the Secretary, [are] likely to assist in promoting the objectives [of the Medicaid program].”11 Section 1115 waivers have been used to implement a variety of initiatives related to HCBS, such as self-direction of personal care services,12 payments to spouses who provide personal care services, and managed LTSS.
In 2012, three states (Arizona, Rhode Island, and Vermont) use § 1115 waivers to administer statewide Medicaid capitated managed care programs that include all covered HCBS for all populations and services; these states do not offer any § 1915(c) waivers. In 2012, Arizona spent $1 billion on HCBS for 43,231 participants, Rhode Island spent $446 million on HCBS for 4,632 participants, and Vermont spent $247 million on HCBS for 3,675 participants.13 Vermont’s model is unique in that the state serves as the managed care entity. Other states that administer Medicaid managed care programs that include HCBS contract with private health plans to provide covered services for a capitated per member per month rate. In addition to Arizona, Rhode Island, and Vermont’s statewide programs, another five states14 (Delaware, Hawaii, New York, Tennessee, and Texas) use § 1115 waivers for Medicaid capitated managed care programs that include HCBS for at least some geographic areas and/or populations in 2012; these states also offer § 1915(c) waivers for other HCBS.15 Other states implement Medicaid managed LTSS programs through combination § 1915(b)/(c) waivers (Section 1915(b) waivers allow states to offer Medicaid services in a managed care model or otherwise limit a beneficiary’s choice of providers).16
Report: Eligibility And Cost Containment Policies Used In Medicaid Hcbs Programs In 2014
Medicaid § 1915(c) Waivers
The Medicaid § 1915(c) waiver authority allows states to use a range of cost-containment strategies to meet federal cost neutrality requirements and limit spending so that expenditures do not exceed state budgetary restrictions. To understand how states controlled spending on HCBS waivers in 2014, we surveyed all state § 1915(c) waiver program administrators to assess financial and functional eligibility standards, use of enrollment and/or expenditure caps, and waiting list status (i.e., number of individuals on the list(s) and average waiting time). The survey finds that every state used some type of cost-containment tool in its § 1915(c) waivers beyond the federal cost neutrality requirement that average annual per participant waiver spending not exceed average per participant spending if services were provided in an institutional setting under the state plan absent the waiver. The following summary of the 2014 survey findings illustrates how states use cost control policies to limit access to § 1915(c) waivers.
Financial Eligibility
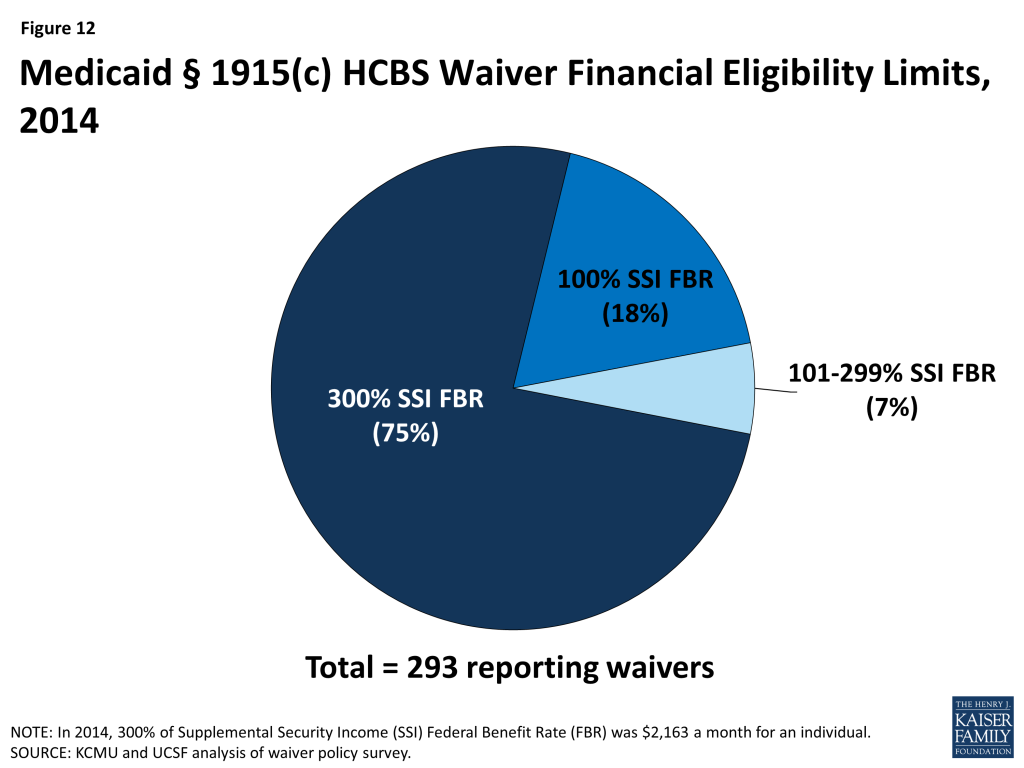
Most states set their Medicaid financial eligibility standard for nursing facility services at 300 percent of the federal Supplemental Security Income (SSI) federal benefit rate ($2,163/month for an individual in 2014). States may set financial eligibility standards for Medicaid § 1915(c) waivers at the same level as that for nursing facilities. There is, however, wide variation in financial eligibility standards across states and HCBS waiver programs as shown in Table 11. Twenty-five percent of reporting waiver programs used more restrictive financial eligibility standards (e.g., 100% of SSI) than used for nursing facilities (300% of SSI) in 2014 (Table 11 and Figure 12).
Functional Eligibility
Another way states limit eligibility for § 1915(c) waivers is by using functional eligibility criteria that are stricter than those used for coverage of nursing facility care. For example, a state could require an individual to exhibit difficulty in performing at least three activities of daily living” (ADLs), (e.g., bathing, dressing, transferring, eating, toileting) for waiver eligibility but require limitations in only two ADLs for nursing facility admission. The 2014 survey found that 10 § 1915(c) waiver programs (3%) used functional eligibility criteria that are more restrictive than the criteria used for institutional care (no table shown); these waivers were reported in Alabama, Florida, Georgia, Indiana, Kansas, New York, Texas, and Utah.
Cost Controls
Approximately 88 percent (42 states) of all states with § 1915(c) waivers utilized some form of cost controls above and beyond the federally mandated cost neutrality formula in 2014. Many states used a mixture of fixed expenditure caps, service provision and hourly caps, and geographic limits (Table 12). Of the states with waiver cost controls in place, half (21 states) utilized more than one form, such as a combination of expenditure caps and service limitations (Table 12).
Self-Direction
Many states have incorporated some form of mandatory or optional self-direction within their § 1915(c) waivers. The self-direction service delivery model can include initiatives such as beneficiary choice in the allocation of service budgets and/or the selection, training, and dismissal of service providers. In 2014, 179 waivers in 42 states (61% of waivers and 90% of states) either allowed or required some form of self-direction (Table 12).
Waiting Lists
States often have more individuals who need Medicaid home and community-based waiver services than the number of available spaces, called “slots,” in a § 1915(c) waiver (Table 13). Many states maintain waiting lists when their program slots are filled or when state legislatures do not fully fund the maximum number of slots approved by CMS. In 2014, 39 states reported waiver waiting lists while 8 states and DC reported no such lists (Table 14). In 2014, there were 582,066 individuals on waiver waiting lists across 154 § 1915(c) waivers. Section 1915(c) waivers for people with I/DD had the greatest number of individuals on waiting lists (349,511 individuals, or 60% of total waiting list enrollment) followed by waivers serving people who are aged and aged or disabled (155,697 individuals, or 27% of total waiting list enrollment) (Table 14, Figure 13). Most states reported that virtually all of the persons on waiver waiting lists currently reside in the community and not in an institution, although they may still be at risk of institutionalization. Due to the varying number of waiver slots available for each population, the average length of time an individual spent on a waiting list varied by population and ranged from three months for HIV/AIDS waivers to 47 months for I/DD waivers, with an average national waiting time of 29 months across all § 1915(c) waivers with waiting lists (Table 14).
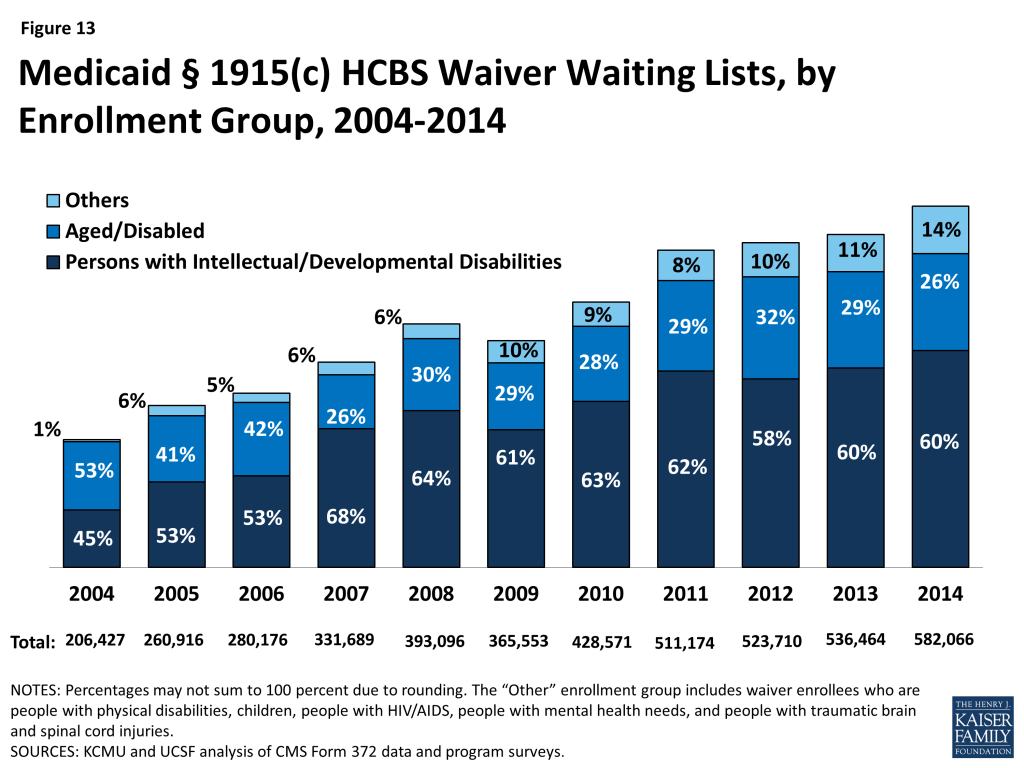
The number of individuals on § 1915(c) waiver waiting lists grew by 8.5 percent from 2013 to 2014, far outpacing the growth rate of 2 percent in the 2012-2013 period. From 2004 to 2014, waiting list enrollment grew by an average of 11 percent annually. Waiting lists for all § 1915(c) waiver target populations increased, with the exception of waivers for people who are aged as well as those for persons with HIV/AIDS (Table 14). The maintenance and length of state waiver waiting lists has implications for states’ compliance with the Olmstead decision which requires states to provide services outside of institutions if beneficiaries are able to live in the community and do not oppose doing so.
In 2014, more than two-thirds (68%) of all § 1915(c) waivers with waiting lists had a policy of screening individuals for Medicaid waiver eligibility before being placed or while on a waiting list (Table 13). In addition, almost three quarters (73%) of all waivers with waiting lists had a policy of prioritizing certain individuals for waiver services (e.g., persons transitioning to the community from an institution) get priority for waiver services when slots become available). Ninety-two percent of all waivers with waiting lists provided non-waiver services (i.e., state plan services) to Medicaid eligible individuals while they awaited a waiver slot.
Report: Medicaid Home Health And Personal Care Services State Plan Benefits
Unlike waivers, states are not permitted to maintain waiting lists or geographically limit the services provided through Medicaid home health and personal care state plan benefits. State plan services must be available to all beneficiaries as medically necessary. However, federal Medicaid rules allow states to use certain cost-containment strategies for state plan benefits. To understand how states controlled spending for home health and personal care services state plan benefits in 2014, all state Medicaid programs were asked about approved provider types, services provided within the scope of each benefit, the use of any expenditure or service caps, and the availability of self-direction within the programs. The following summary of the 2014 survey findings shows how states use cost control policies to limit access to Medicaid home health and personal care state plan services. (Although Rhode Island and Delaware did not report participants or expenditures for personal care state plan services in 2014, their policy survey responses are included.)
Providers and Services
To obtain a more comprehensive picture of the three main Medicaid HCBS programs, states were asked about the types of approved providers for state plan HCBS and the scope of benefits provided (no Tables shown). In addition to licensed home health agencies, 16 states (31%) allowed hospice agencies to provide home health state plan services, while Centers for Independent Living and independent providers were allowed to provide personal care state plan services in 13 states (38%) and 20 states (59%), respectively.
In addition to skilled nursing services, therapy services, and home health aide services for assistance with ADLs, 14 states (27%) provided assistance with instrumental ADLs (e.g., medication management, meal preparation) as part of their home health state plan benefit. In addition, although therapy services are optional within the home health services state plan benefit, almost all states provide some form of therapy, such as physical, occupational, or speech. Even though case management is not required under the home health state plan benefit, four states (8%) provided this service.
Among states with personal care state plan services, 31 states (91%) provided assistance with instrumental ADLs, while 14 states (41%) provided some sort of transportation services. Case management was offered in 6 states (18%) within the personal care services state plan option.
Cost Controls
More than half of all states (59%, or 30 states) utilized either expenditure or service limits or both in their home health services state plan programs in 2014, while 62 percent of states with the optional personal care services state plan benefit used cost control limits. Among states offering the optional personal care services state plan benefit, 19 states used service limits while only two states used cost control limits. Among the 30 states with cost controls in their home health services state plan benefit, only Connecticut had a combination of expenditure and service limits; the rest had only one of these limits in place. Service limitations were the most popular form of cost control for home health state plan services, with 26 states (87% of cost control states) using such limits (Table 12).
Self-Direction
In 2014, only nine states allowed self-direction within their home health services state plan programs. In contrast, 71 percent of states (24 states) with the personal care services state plan option allowed self-direction (Table 12).
Provider Reimbursement
The average reimbursement rate that states provided to home health agencies was $92.69 per home health visit in 2014, compared to $91.45 in 2013. In states that paid registered nurses or home health aides directly or mandated their reimbursement rates, the average rate per visit was $87.46 and $54.14, respectively, a slight increase from 2013 (Table 15). For the personal care services state plan option, the average rate paid to provider agencies was $18.73 per hour in 2014, a slight increase from $18.20 per hour in 2013. In states where personal care services providers were paid directly by the state or where reimbursement rates were determined by the state, the average reimbursement rate was $13.02 per hour in 2014 (Table 15). (Note: reimbursement rates for services provided under § 1915(c) waivers are not included in the policy survey.) Medicaid provider reimbursement rates are often set by state legislatures as part of the budget process.
Conclusion
Over the past three decades, the increase in access to community-based alternatives to institutional care has resulted in some rebalancing of national Medicaid LTSS dollars, but the size and scope of Medicaid HCBS programs vary across states. Section 1915(c) waivers account for the majority (74%) of spending on LTSS provided in community settings, and continued growth in waiver waiting list enrollment, to more than 582,000 persons nationally with waiting times of almost two and a half years, highlight the need for community-based LTSS, especially for individuals with I/DD and people who are aged or disabled.
At the same time, competing pressures in state budgets may mean that states may face uncertainties for the provision of Medicaid LTSS in the coming years, and states are continuing to utilize cost control measures within their Medicaid programs. In response to fiscal pressures and a desire to better coordinate beneficiaries’ LTSS, some states are looking to incorporate HCBS into Medicaid managed care arrangements. States also are working to come into compliance with CMS’s rule defining the qualities of the settings in which Medicaid HCBS can be provided and assessing the impact of the new Department of Labor rules that extends Fair Labor Standards Act minimum wage and overtime pay protections to direct care workers who were previously exempt, which are expected to take effect in fall 2015.17 The impact of all of these initiatives on HCBS access warrants further analysis. In the coming years, states will be challenged to continue to expand access to high quality, person-centered HCBS in a cost-effective manner, and it will remain important to monitor states’ adoption of state plan options and other initiatives to expand Medicaid HCBS, differences in services and spending, and the impact of cost control policies on access and quality.
Endnotes
- Eiken, S., Sredl, K., Burwell, B., and Saucier, P. Medicaid Expenditures for Long Term Services and Supports (LTSS) in FY 2013, at 7, Truven Health Analytics (June 2015), available at http://www.medicaid.gov/medicaid-chip-program-information/by-topics/long-term-services-and-supports/downloads/ltss-expenditures-fy2013.pdf. ↩︎
- Minnesota has a Section 1115 waiver that offers some fee-for-service HCBS, including Section 1915(i) and Community First Choice services. ↩︎
- Eiken, S., Sredl, K., Burwell, B., and Saucier, P. Medicaid Expenditures for Long Term Services and Supports (LTSS) in FY 2013, at 7, Truven Health Analytics (June 2015), available at http://www.medicaid.gov/medicaid-chip-program-information/by-topics/long-term-services-and-supports/downloads/ltss-expenditures-fy2013.pdf. ↩︎
- Olmstead v. L.C., 527 U.S. 581 (1999), available at http://www.law.cornell.edu/supct/html/98-536.ZS.html. For a discussion of Olmstead’s legacy, including legal case trends and policy developments in the last five years, see Kaiser Commission on Medicaid and the Uninsured, Olmstead’s Role in Community Integration for People with Disabilities Under Medicaid: 15 Years after the Supreme Court’s Olmstead Decision (June 2014), available at https://modern.kff.org/medicaid/issue-brief/olmsteads-role-in-community-integration-for-people-with-disabilities-under-medicaid-15-years-after-the-supreme-courts-olmstead-decision/. ↩︎
- Eiken, S., Sredl, K., Burwell, B., and Saucier, P. Medicaid Expenditures for Long Term Services and Supports (LTSS) in FY 2013, at 5, Truven Health Analytics (June 2015), available at http://www.medicaid.gov/medicaid-chip-program-information/by-topics/long-term-services-and-supports/downloads/ltss-expenditures-fy2013.pdf. ↩︎
- MFP funding expires in September 2016. For more information, see Kaiser Commission on Medicaid and the Uninsured, Money Follows the Person: A 2015 State Survey of Transitions, Services, and Costs (Oct. 2015), available at https://modern.kff.org/medicaid/report/money-follows-the-person-a-2015-state-survey-of-transitions-services-and-costs/. ↩︎
- BIP funding expired on September 30, 2015. For more information, see Kaiser Commission on Medicaid and the Uninsured, Medicaid Balancing Incentive Program: A Survey of Participating States (June 2015), available at https://modern.kff.org/medicaid/report/medicaid-balancing-incentive-program-a-survey-of-participating-states/. ↩︎
- Kaiser Commission on Medicaid and the Uninsured, Implementing the ACA: Medicaid Spending & Enrollment Growth for FY 2014 and FY 2015 at 4 (Oct. 2014), available at https://modern.kff.org/medicaid/report-section/implementing-the-aca-medicaid-spending-enrollment-growth-issue-brief. ↩︎
- Eiken, S., Sredl, K., Burwell, B., and Saucier, P. Medicaid Expenditures for Long Term Services and Supports (LTSS) in FY 2013, at 7, Truven Health Analytics (June 2015), available at http://www.medicaid.gov/medicaid-chip-program-information/by-topics/long-term-services-and-supports/downloads/ltss-expenditures-fy2013.pdf. ↩︎
- For background about § 1115 waivers, see Kaiser Commission on Medicaid and the Uninsured, Five Key Questions and Answers About Section 1115 Medicaid Demonstration Waivers (June 2011), available at https://modern.kff.org/health-reform/issue-brief/five-key-questions-and-answers-about-section/. ↩︎
- 42 U.S.C. § 1315(a). ↩︎
- Self-direction of personal care services is now available to states under the § 1915(j) option, which allows states to offer self-direction provided that states offer personal care services as an optional state plan benefit or through a § 1915(c) waiver. 42 U.S.C. § 1396n(j)(4)(A); 42 C.F.R. § 441.452(a). ↩︎
- Expenditure data from Eiken, S., Sredl, Burwell, B., and Saucier, P. Medicaid Expenditures for Long Term Services and Supports (LTSS) in FY 2013, Truven Health Analytics (June 2015), available at http://www.medicaid.gov/medicaid-chip-program-information/by-topics/long-term-services-and-supports/downloads/ltss-expenditures-fy2013.pdf; participant data from Rhode Island Executive Office of Health and Human Services, Global Waiver Quarterly Report, January – March 2013, available at http://www.eohhs.ri.gov/Portals/0/Uploads/Documents/Quarterly%20Global%20Wavier%20Report%20January%20-%20March%20%202013_1.pdf; State of Vermont Agency of Human Services, Global Commitment to Health, Quarterly Report (November 2012), available at http://dvha.vermont.gov/global-commitment-to-health/gc-ffy12-qtr-4-report.pdf. Arizona participation counts as reported by state officials to KCMU and UCSF, 2015. ↩︎
- Minnesota has a Section 1115 waiver that offers some fee-for-service HCBS, including Section 1915(i) and Community First Choice services. ↩︎
- Medicaid.gov, Waivers, available at http://www.medicaid.gov/Medicaid-CHIP-Program-Information/By-Topics/Waivers/Home-and-Community-Based-1915-c-Waivers.html. ↩︎
- For more information about Medicaid managed care, see generally Kaiser Commission on Medicaid and the Uninsured, Medicaid and Managed Care: Key Data, Trends, and Issues (Feb. 2012), available at https://modern.kff.org/medicaid/issue-brief/medicaid-and-managed-care-key-data-trends/; see also Kaiser Commission on Medicaid and the Uninsured, Key Themes in Capitated Medicaid Managed Long-Term Services and Supports Waivers (Nov. 2014), available at https://modern.kff.org/medicaid/issue-brief/key-themes-in-capitated-medicaid-managed-long-term-services-and-supports-waivers/. In addition, Kansas has a combination § 1115/1915(c) waiver managed LTSS; for more information, see Kansas KanCare Waiver (11-W- 00283/7)), State of Kansas “KanCare” Section 1115 Demonstration Application, August 6, 2012, accessed Sept. 10, 2015, available at http://www.medicaid.gov/Medicaid-CHIP-Program-Information/By-Topics/Waivers/1115/downloads/ks/KanCare/ks-kancare-1115-demo-app-08062012.pdf. ↩︎
- U.S. Dep’t of Labor, Information on the Final Rule: Application of the Fair Labor Standards Act to Domestic Service, available at http://www.dol.gov/whd/homecare/finalrule.htm. While the new rules were to be effective in January, 2015, they have not yet been enforced and were challenged in litigation. In August, 2015, the D.C. Circuit Court of Appeals upheld the regulations. Home Care Assoc. of America v. Weil, No. 15-5018 (D.C. Cir. Aug. 21, 2015), available at http://www.dol.gov/whd/homecare/0821appealdecision.pdf. DOL has revised its time-limited non-enforcement policy, with no actions to enforce the new rules until 30 days after the D.C. Circuit Court’s decision becomes final, and discretion in enforcement actions considering good faith efforts to comply with the new rule through December 2015. U.S. Dep’t of Labor, We Count on Home Care, Time-Limited Non-Enforcement Policy, available at http://www.dol.gov/whd/homecare/non-enforcement_policy.htm; see also 80 Fed. Reg. 55029 (Sept. 14, 2015), available at http://www.gpo.gov/fdsys/pkg/FR-2015-09-14/pdf/2015-23092.pdf; CMS Informational Bulletin, Self-Direction Program Options for Medicaid Payments in the Implementation of the Fair Labor Standards Act Regulation Changes (July 3, 2014), available at http://www.medicaid.gov/Federal-Policy-Guidance/Downloads/CIB-07-03-2014.pdf; U.S. Dep’t of Justice, Civil Rights Division and U.S. Dep’t of Health & Human Servs., Office for Civil Rights, Dear Colleague letter (Dec. 15, 2014), available at http://www.ada.gov/olmstead/documents/doj_hhs_letter.pdf. ↩︎