Key Implementers of U.S. Global Health Efforts
Introduction
To carry out global health efforts around the world, the U.S. government (USG) funds a wide range of implementing entities, including non-governmental organizations (NGOs), multilateral/international organizations, private sector organizations, educational institutions, and other governments.
This brief provides an overview of the implementing organizations that received U.S. global health funding from the U.S. Agency for International Development (USAID) in FY 2015.1 It is based on analysis of data on USAID spending by implementing entity.2 Such spending includes funding received by USAID directly from Congress as well as through interagency transfers (primarily from the Department of State but also from the U.S. Department of Agriculture), which together account for the majority of U.S. global health spending.3 See Appendix A for a detailed methodology.
Findings
Overview
In FY 2015, 773 organizations4 received $6.65 billion in U.S. global health funding (see Table 1) to carry out global health activities in 90 countries,5 as follows:
- Six main types of organizations received funding: NGOs,6 multilateral/international organizations, private sector organizations,7 educational institutions, foreign governments, and USG agencies and departments.
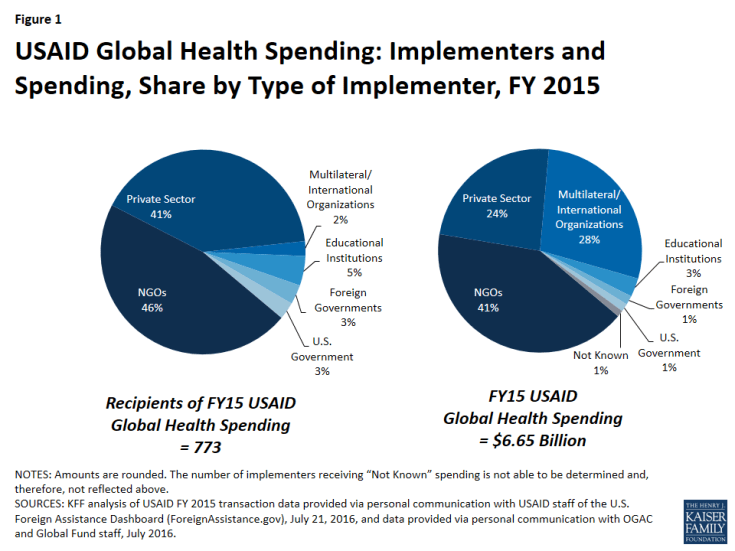
- Most implementing organizations were NGOs (46%), followed by private sector organizations (41%). Multilateral/international organizations made up only 2% of implementing organizations. See Table 1 and Figure 1.
- The largest share of U.S. global health funding went to NGOs (41%). Multilateral/international organizations received more than a quarter of funding (28%), while private sector organizations only received less than a quarter of funding (24%), followed by educational institutions (3%). Only a small share went to foreign governments (1%) or to USG agencies (1%). See Table 1 and Figure 1.
| Table 1: USAID Global Health Spending – Number of Implementers and Spending, by Type of Implementer, FY 2015 | ||
| Type of Implementer | Number of Implementers | Spending ($ millions) |
| Total | 773 | 6,650 |
| NGOs | 359 | 2,760* |
| Multilateral/International Organizations | 18 | 1,864* |
| Private Sector | 315 | 1,581* |
| Educational Institutions | 36 | 197 |
| Foreign Governments | 24 | 96 |
| U.S. Government | 21+ | 84 |
| Not Known | n/a | 68 |
| NOTES: Amounts are rounded. In the data, organizations are identified by implementer type; inaccurate categorizations appearing in the data would affect the totals above. * indicates a small amount of funding was “unattributed” to an implementing organization. + indicates the number of organizations/entities reflects entities, departments, operating divisions, etc., that were individually reflected in the data. n/a indicates the number of organizations could not be accurately determined because of redacted data. | ||
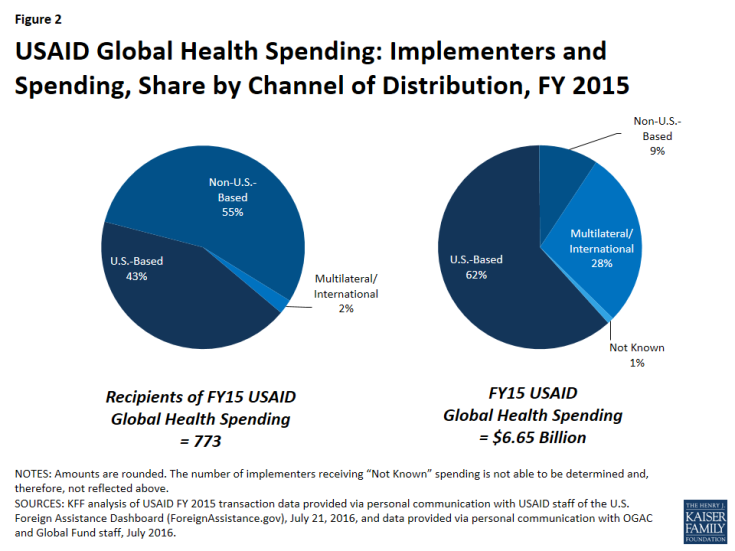
- Most implementing organizations were based outside the U.S. (55%); the rest were U.S.-based (43%) or multilateral/international organizations (2%). See Table 2 and Figure 2.
- On the other hand, most funding went to U.S.-based organizations, which accounted for $6 of every $10 (62%). The rest was provided through multilateral and international channels (28%) and to organizations that were based outside the U.S. (9%). See Table 2 and Figure 2.
| Table 2: USAID Global Health Spending – Number of Implementers and Spending, by Channel of Distribution, FY 2015 | ||
| Channel of Distribution | Number of Implementers | Spending ($ millions) |
| Total | 773 | 6,650 |
| U.S.-Based | 332 | 4,093 |
| Non-U.S.-Based | 423 | 626 |
| Multilateral/International | 18 | 1,864 |
| Not Known | — | 68 |
| NOTES: Amounts are rounded. In the data, organizations are identified by implementer type and country of origin; inaccurate categorizations appearing in the data would affect the totals above. — indicates the number of organizations could not be accurately determined because of redacted data. | ||

Figure 2: USAID Global Health Spending: Implementers and Spending, Share by Channel of Distribution, FY 2015
- The majority of funding was provided to just 10 organizations (56%, $3.757 billion); of these, 3 were U.S.-based private sector organizations, 4 were U.S.-based NGOs, and 3 were multilateral/international organizations. None were local NGOs. See Table 3.
| Table 3: Top 10 Recipients of USAID Global Health Spending, FY 2015 | ||
| Implementer | Spending ($ millions) |
Type of Implementer |
| Global Fund to Fight AIDS, Tuberculosis and Malaria | 1,267 | Multilateral/Int’l |
| John Snow, Inc.* | 583 | Private Sector |
| Partnership for Supply Chain Management~ | 552 | NGO |
| FHI Development 360 | 297 | NGO |
| Abt Associates | 226 | Private Sector |
| Jhpiego | 207 | NGO |
| Management Sciences for Health (MSH) | 175 | NGO |
| Gavi, the Vaccine Alliance | 175 | Multilateral/Int’l |
| Chemonics | 149 | Private Sector |
| World Bank | 124 | Multilateral/Int’l |
| NOTES: Reflects organizations that received funding spent by USAID for USG global health efforts. Amounts are rounded. Multilateral/Int’l means Multilateral/International Organization. * indicates company also has a non-profit arm that is counted separately as an NGO (JSI’s non-profit arm is JSI Research & Training Institute). ~ indicates NGO is a separate legal entity established by JSI Research & Training Institute and MSH to implement specific work. | ||
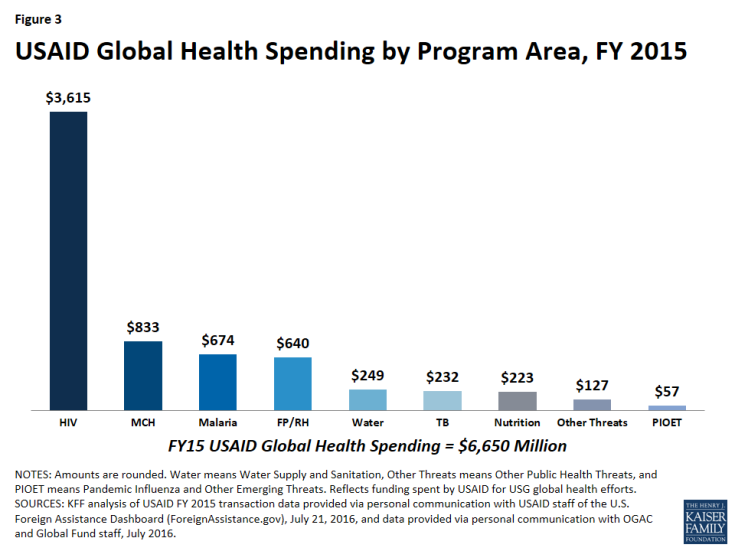
- Organizations received funding in all 9 major program areas of the U.S. global health portfolio: HIV; tuberculosis (TB); malaria; maternal and child health (MCH); nutrition; family planning/reproductive health (FP/RH); other public health threats, including neglected tropical diseases (NTDs); pandemic influenza and other emerging threats (PIOET); and water supply and sanitation. Most funding went to HIV (54%, $3.615 billion), followed by MCH (13%, $833 million) and malaria (10%, $674 million). See Figure 3.
- The major types of implementer varied by program area. For example, TB funding mostly went to NGOs (48%, $110 million), followed by multilateral/international organizations (30%, $70 million), while malaria funding mostly went to the private sector (67%, $451 million), followed by NGOs (21%, $140 million). See Table 4.
- NGOs received the most funding in five program areas (HIV, FP/RH, TB, nutrition, and other public health threats); private sector organizations received most in two program areas (malaria, and water supply and sanitation); multilateral/international organizations received most in one program area (MCH); and educational institutions received most in one program area (PIOET). See Table 4.
| Table 4: USAID Global Health Spending – Spending by Program Area, FY 2015 | ||||||||
| Program Area | Share of Spending by Type of Implementer (%) |
Spending ($ millions) |
||||||
| NGOs | Multilateral/ International |
Private Sector | Educational Institutions | Foreign Governments | U.S. Government | Not Known | ||
| HIV | 42 | 38 | 15 | 2 | <1 | 1 | 1 | 3,615 |
| MCH | 36 | 38 | 17 | 2 | 6 | <1 | <1 | 833 |
| Malaria | 21 | 5 | 67 | 3 | 1 | 3 | <1 | 674 |
| FP/RH | 48 | 3 | 39 | 5 | 3 | <1 | <1 | 640 |
| Water* | 35 | 5 | 53 | 4 | 3 | <1 | <1 | 249 |
| TB | 48 | 30 | 19 | <1 | <1 | 1 | <1 | 232 |
| Nutrition | 85 | 7 | 5 | 2 | <1 | <1 | <1 | 223 |
| Other Threats^ | 73 | 12 | 6 | 3 | 2 | 3 | <1 | 127 |
| PIOET | 14 | 24 | 16 | 31 | <1 | 11 | 5 | 57 |
| NOTES: Percentages and $ amounts are rounded, except <1 shows those percentages under 1%. Percentages may not sum to 100%. Abbreviations mean: Multilateral/International means Multilateral/International Organizations, MCH – Maternal and Child Health, FP/RH – Family Planning and Reproductive Health, TB – Tuberculosis, PIOET – Pandemic Influenza and Other Emerging Threats. * means Water Supply and Sanitation. ^ means Other Public Health Threats, which includes NTDs. + indicates that funding for the Global Fund is attributed by USAID in the data to HIV only rather than to HIV, TB, and malaria. | ||||||||
Implementers by Type
Non-Governmental Organizations (NGOs)
As mentioned above, NGOs8 received the largest share of U.S. global health funding in FY 2015 (41%, $2.76 billion). The vast majority of this funding went to U.S.-based NGOs (85%), versus NGOs based outside the U.S. (15%). On the other hand, less than half of the NGOs who received funding were U.S.-based (41%, 148); most were based outside the U.S. (59%, 211). Additionally:
- About half (49%, $1.346 billion) of this funding went to the top 5 highest-funded NGOs, which were all U.S.-based; see Table 5.
- The majority of funding provided to NGOs was for activities related to HIV (55%), followed by FP/RH (11%) and MCH (11%); see Table 7.
| Table 5: Top 5 Recipients of USAID Global Health Spending, FY 2015 – NGOs and Multilateral/International Organizations | |
| Implementer | Spending ($ millions) |
| NGOs | |
| Partnership for Supply Chain Management ~ | 552 |
| FHI Development 360 | 297 |
| Jhpiego | 207 |
| Management Sciences for Health (MSH) | 175 |
| Catholic Relief Services (CRS) | 114 |
| Multilateral/International Organizations | |
| Global Fund to Fight AIDS, Tuberculosis and Malaria | 1,267 |
| Gavi, the Vaccine Alliance | 175 |
| World Bank | 124 |
| World Health Organization (WHO) | 107 |
| United Nations Children’s Fund (UNICEF) | 70 |
| NOTES: Reflects organizations across selected implementer types that received funding spent by USAID for USG global health efforts. Amounts are rounded. ~ indicates NGO is a separate legal entity established by JSI Research & Training Institute and MSH to implement specific work. | |
Multilateral/International Organizations9
Nearly 20 multilateral/international organizations received more than a quarter of U.S. global health funding – the second largest share – in FY 2015 (28%, $1.864 billion). Additionally:
- The vast majority (94%, $1.743 billion) of this funding went to the top 5 highest-funded multilateral/international organizations; see Table 5. The Global Fund to Fight AIDS, Tuberculosis and Malaria (the Global Fund; an independent, international financing institution established in 2001 that provides grants to countries to address HIV, TB, and malaria)10 alone accounts for more than two-thirds of this funding (68%, $1.267 billion)11 and is the largest organizational recipient of U.S. global health funding.12
- Nearly three quarters of funding provided to multilateral/international organizations was for activities related to HIV (73%).13 See Table 7.
Private Sector
Private sector organizations received less than a quarter of U.S. global health funding in FY 2015 (24%, $1.581 billion). Nearly all funding went to U.S.-based private sector organizations (93%), versus those based outside the U.S. (7%). On the other hand, less than half of the private sector organizations that received funding were U.S.-based (44%, 139); more than half were based outside the U.S. (56%, 176). Additionally:
- Nearly three quarters (72%, $1.131 billion) of this funding went to the top 5 highest-funded private sector organizations, which were all U.S.-based; see Table 6.
- A third of funding provided to the private sector was for activities related to HIV (34%), followed by malaria (29%) and FP/RH (16%); see Table 7.
| Table 6: Top 5 Recipients of USAID Global Health Spending, FY 2015 – Private Sector, Educational Institutions, Foreign Governments, and U.S. Government Entities | |
| Implementer | Spending ($ millions) |
| Private Sector | |
| John Snow, Inc.* | 583 |
| Abt Associates | 226 |
| Chemonics | 149 |
| University Research Co., LLC* | 120 |
| Futures Group International+ | 53 |
| Educational Institutions | |
| Johns Hopkins University | 75 |
| University of North Carolina at Chapel Hill | 35 |
| Eastern Virginia Medical School | 27 |
| University of California | 14 |
| Florida International University | 9 |
| Foreign Governments | |
| Afghanistan | 46 |
| Liberia | 18 |
| Egypt | 7 |
| Pakistan | 6 |
| Tanzania | 5 |
| U.S. Government/Other Agencies | |
| Centers for Disease Control and Prevention (CDC) | 35 |
| Department of State | 8 |
| U.S. Census Bureau | 4 |
| General Services Administration (GSA) | 4 |
| Naval Medical Research Center (NMRC) | 1 |
| NOTES: Reflects organizations across selected implementer types that received funding spent by USAID for USG global health efforts. Amounts are rounded. * indicates company also has a non-profit arm that is counted separately as an NGO. For example, URC’s non-profit arm is The Center for Human Services. + indicates now known as Palladium. | |
Educational Institutions
Educational institutions received a small share of U.S. global health funding in FY 2015 (3%, $197 million). Nearly all of this funding went to U.S.-based institutions (97%), versus those based outside the U.S. (3%). Two-thirds of the educational institutions were U.S.-based (67%, 24); the rest were based outside the U.S. (33%, 12). Additionally:
- The vast majority (81%, $160 million) of this funding went to the top 5 highest-funded institutions, which were all U.S.-based; see Table 6.
- Nearly half of funding provided to educational institutions was for activities related to HIV (45%), followed by FP/RH (18%); see Table 7.
Foreign Governments
Foreign governments received a very small share of U.S. global health funding in FY 2015 (1%, $96 million). This funding went to the governments of 24 countries, which is about a quarter of the overall number of countries reached by U.S. global health funding in FY 2015. Additionally:
- Five foreign governments accounted for the vast majority (85%, $81 million) of this funding; see Table 6.
- Almost half of funding provided to foreign governments was for activities related to MCH (48%), followed by FP/RH (22%) and water (9%); see Table 7.
U.S. Government
USAID also provided approximately 1% ($84 million) of funding for global health to USG agencies:
- Five other USG agencies/departments accounted for more than half (61%, $52 million) of this funding; see Table 6. The Centers for Disease Control and Prevention (CDC) was the largest recipient ($35 million).
- Nearly half of funding transferred to USG entities was for activities related to HIV (47%), followed by malaria (24%); see Table 7.
| Table 7: USAID Global Health Spending – Spending by Type of Implementer, FY 2015 | ||||||||||
| Type of Implementer | Share of Spending by Program Area (%) |
Spending ($ millions) |
||||||||
| HIV | MCH | Malaria | FP/RH | Water* | TB | Nutrition | Other Threats^ | PIOET | ||
| NGOs | 55 | 11 | 5 | 11 | 3 | 4 | 7 | 3 | <1 | 2,760 |
| Multilateral/International | 73+ | 17 | 2 | <1 | <1 | 4 | <1 | <1 | <1 | 1,864 |
| Private Sector | 34 | 9 | 29 | 16 | 8 | 3 | <1 | <1 | <1 | 1,581 |
| Educational Institutions | 45 | 9 | 9 | 18 | 5 | 1 | 2 | 2 | 9 | 197 |
| Foreign Governments | 7 | 48 | 8 | 22 | 9 | 2 | <1 | 3 | <1 | 96 |
| U.S. Government | 47 | 6 | 24 | 6 | 1 | 3 | <1 | 5 | 7 | 84 |
| Not Known | 78 | 5 | 3 | 6 | <1 | 1 | <1 | 2 | 4 | 68 |
| NOTES: Percentages and $ amounts are rounded, except <1 shows those percentages under 1%. Percentages may not sum to 100%. Abbreviations mean: Multilateral/International means Multilateral/International Organizations, MCH – Maternal and Child Health, FP/RH – Family Planning and Reproductive Health, TB – Tuberculosis, PIOET – Pandemic Influenza and Other Emerging Threats. * means Water Supply and Sanitation. ^ means Other Public Health Threats, which includes NTDs. + indicates that funding for the Global Fund is attributed in the data to HIV only rather than to HIV, TB, and malaria. | ||||||||||
Conclusion
To carry out its global health programs, the U.S. government funds a wide range of implementing organizations. In an effort to shed light on this landscape, this brief provides an analysis of the implementing organizations that received U.S. global health funding from USAID during FY 2015. As it finds, NGOs represent the largest group of implementers and receive the greatest share of U.S. global health funding. In addition, most implementers are based outside of the U.S. However, the analysis also finds that most funding is concentrated among a subset of implementers and is directed to U.S.-based organizations, which may have implications for longer term sustainability and country ownership. Taken together, these findings provide new information on the types of implementing organizations funded to carry out U.S. global health efforts around the world and point toward areas for further research.


