KFF designs, conducts and analyzes original public opinion and survey research on Americans’ attitudes, knowledge, and experiences with the health care system to help amplify the public’s voice in major national debates.
Non-governmental organizations (NGOs) are key implementers of U.S. global health programs, yet in the past, little has been known about the scope of their role. To help shed light on this issue, two recent Kaiser Family Foundation reports assessed NGO engagement in U.S. global health efforts, looking first at U.S.-based NGOs1 and then at those based outside the U.S.2 that received U.S. government funding from the U.S. Agency for International Development (USAID) (the largest U.S. global health implementing agency as measured by funding). While these individual analyses provided new windows into the respective roles of NGOs in and outside of the U.S. – showing, for example, that U.S.-based NGOs were headquartered in 25 states and the District of Columbia3 – this data note pulls them together with updated data to paint a more comprehensive picture.4 This analysis found that NGOs received a significant share of U.S. government (USG) global health funding disbursed by USAID in FY 2014. While the majority of these NGOs were based outside the U.S., most funding went to those based in the U.S. Specifically, the analysis found that:
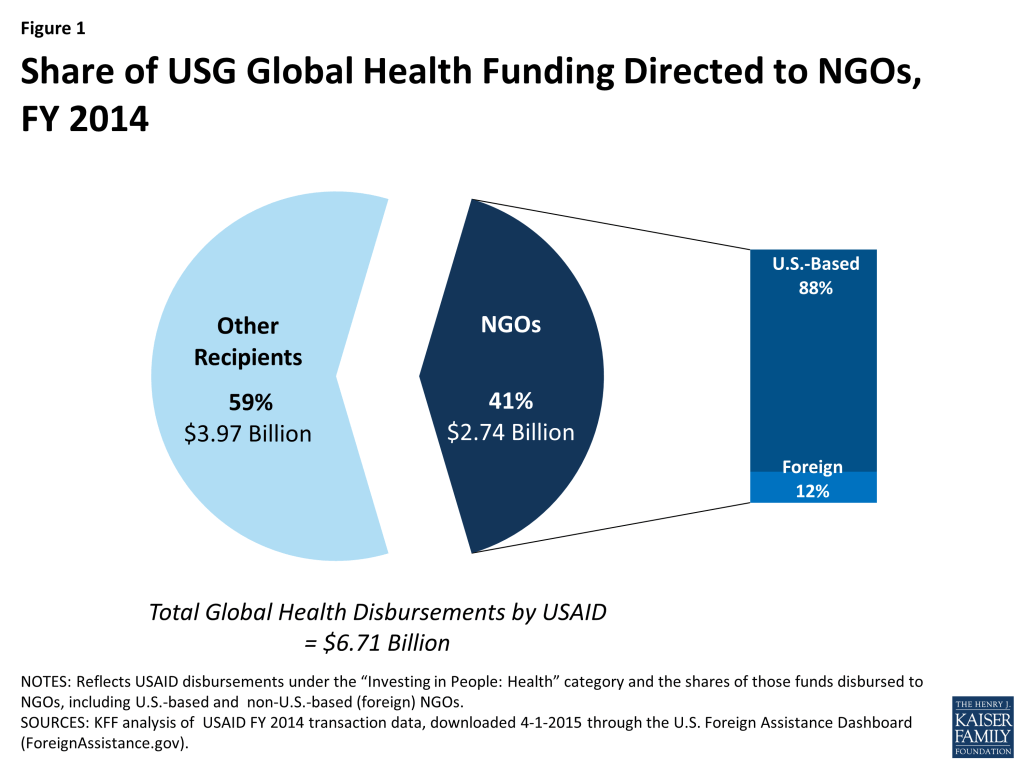
Of the more than $6.71 billion disbursed by USAID in FY 2014 for global health activities, 41% ($2.74 billion) was provided to more than 300 NGOs. See Figure 1.
Figure 1: Share of USG Global Health Funding Directed to NGOs, FY 2014
More than half (59%, 179) of these NGOs were based outside the U.S.; the rest (41%, 125) were U.S.-based. On the other hand, most funding went to U.S.-based NGOs, which accounted for almost $9 of every $10 (88%); the remaining 12% went to NGOs based outside the U.S. See Figure 1 and Table 1.
Funding overall was concentrated among a small group of NGOs – 20 NGOs received 80% ($2.2 billion) of funding going to NGOs; of these, 17 were U.S. based. See Table 2.
Most NGOs, however, received much smaller amounts of funding, including 198 NGOs that received $1 million or less.
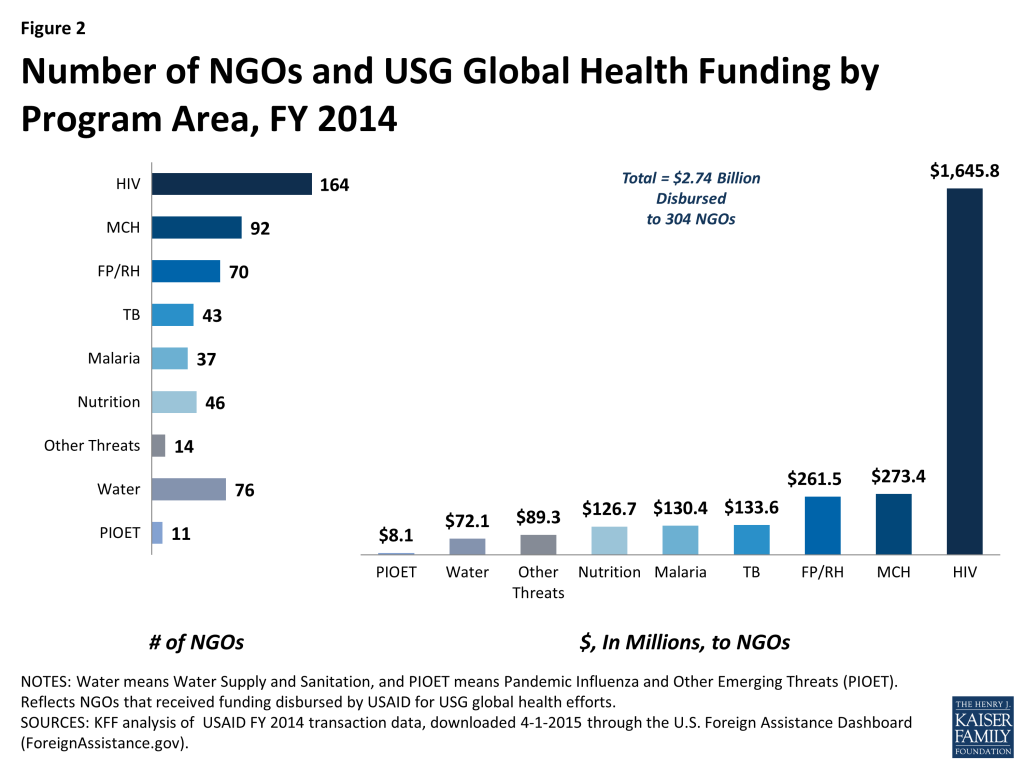
NGOs carried out U.S. global health activities in all major program areas – HIV; tuberculosis (TB); malaria; family planning and reproductive health (FP/RH); maternal and child health (MCH); nutrition; other public health threats (which includes neglected tropical diseases or NTDs); pandemic influenza and other emerging threats (PIOET); and water supply and sanitation.
Most though (210 NGOs) received funding in just a single program area; less than a third (94) received funding in two or more areas.
HIV had the greatest number of NGOs (164) and accounted for the most funding ($1.65 billion), followed by MCH; see Figure 2.
Figure 2: Number of NGOs and USG Global Health Funding by Program Area, FY 2014
HIV was the only program area with more non-U.S.-based than U.S.-based NGOs, while TB was the only program area that provided more funding to non-U.S.-based than U.S.-based NGOs. See Tables 1 and 3.
Overall, NGO efforts were carried out in close to 80 countries, though most NGOs received funding for activities in a single country.5 Both U.S.-based NGOs and those based outside the U.S. were most likely to be working in Africa, where most funding was directed. See Table 1.
In more than a third of the countries reached, 10 or more NGOs received U.S. support.6
While this analysis provides new information on the role of NGOs in U.S. global health activities, it also raises several questions and issues for U.S. global health policy, including the following:
Although the U.S. government has signaled its intention to work more directly with in-country partners, strengthen local capacity, and support country ownership, this analysis shows that most U.S. global health funding for NGOs was directed to those based in the U.S.7 Will this distribution shift going forward? Does it need to? And what effects might such a shift have on the impact of U.S. global health efforts?
Similarly, while this analysis shows that most NGO recipients were not based in the U.S., it is unclear how many of these NGOs are actually local organizations,8 versus international NGOs akin to their U.S.-based counterparts. What is the mix of local and international NGOs among recipients, and will this mix, as well as the respective roles of these NGOs, change in coming years?
In some sense, this analysis captures just the first couple of steps of the U.S. global health funding process – the funding provided by USAID to NGOs. What happens to the funding then? Does the recipient NGO carry out global health efforts directly, or does it contract further with other entities, including other NGOs?
Finally, how has the U.S. leveraged its support for NGOs to strengthen civil society in some countries and to develop technical networks of NGOs working in certain areas of global health or networks of NGOs working in global health more generally?
Table 1: Number of NGOs and USG Global Health Funding, FY 20149
Region
# of NGOs
Region
Funding (in $ millions)
Overall
U.S.
Foreign
Overall
U.S.
Foreign
Total
304
125
179
Total
2,741
2,404
337
By Region
By Region
Africa
200
78
122
Africa
1,519
1,260
259
Asia*
72
35
37
Asia*
301
245
56
Europe & Eurasia
19
16
3
Europe & Eurasia
11
10
<1
Latin America & the Caribbean
35
25
10
Latin America & the Caribbean
67
62
4
Middle East
12
9
3
Middle East
33
32
1
“Worldwide”
78
66
12
“Worldwide”
810
794
16
By Program Area
By Program Area
HIV
164
62
102
HIV
1,646
1,453
193
MCH
92
62
30
MCH
273
256
17
FP/RH
70
42
28
FP/RH
261
219
43
TB
43
24
19
TB
134
64
69
Malaria
37
26
11
Malaria
130
129
2
Nutrition
46
35
11
Nutrition
127
122
5
Other Public Health Threats^
14
14
0
Other Public Health Threats^
89
89
0
Water Supply and Sanitation
76
40
36
Water Supply and Sanitation
72
64
8
PIOET
11
9
2
PIOET
8
8
<1
NOTES: Reflects NGOs that received funding disbursed by USAID for USG global health efforts and funding disbursed by USAID to NGOs for activities in specific regions and “worldwide”, which is a “benefitting location” designated by USAID in the data. Regions align to USAID Bureaus of the same names, reflecting countries addressed by and regional programs overseen by these bureaus (except * indicates includes Afghanistan and Pakistan, which has a separate USAID office). Additional NGOs operating “worldwide” efforts may also operate in specific regions. ^ indicates includes NTDs. # of NGOs by region/program area will not sum to equal overall # of NGOS, as some NGOs work in more than one region/program area. Funding subtotals may not sum to equal overall funding due to rounding.
Table 2: Top 20 NGOs by USG Global Health Funding, FY 2014 (in millions)10
Partnership for Supply Chain Management ~
523.7
IntraHealth International
56.2
FHI Development 360
346.0
World Vision
51.9
Management Sciences for Health (MSH)
224.9
Save the Children
45.2
Jhpiego
206.8
Right to Care
37.9
Population Services International (PSI)
161.5
PACT
33.3
Research Triangle Institute (RTI International)
102.4
EngenderHealth
31.7
Program for Appropriate Technology in Health (PATH)
72.8
CARE
31.5
JSI Research & Training Institute
67.8
Elizabeth Glaser Pediatric AIDS Foundation
29.9
Pathfinder International
62.2
Marie Stopes International (MSI)
28.7
KNCV Tuberculosis Foundation
59.7
International AIDS Vaccine Initiative (IAVI)
28.3
NOTES: Non-U.S.-based (foreign) NGOs are highlighted in bold. Other NGOs are U.S.-based. ~ indicates NGO is a separate legal entity established by JSI Research & Training Institute and MSH to implement specific work. Reflects NGOs that received funding disbursed by USAID for USG global health efforts.
KFF analysis of USAID FY 2014 transaction data, downloaded 4-1-15 from the U.S. Foreign Assistance Dashboard, www.ForeignAssistance.gov. ↩︎
Specifically, 203 NGOs received country-specific funding in a single country, among 257 NGOs who received funding for global health activities in a specific country(s). These NGOs, and others, may have received non-country-specific funding as well or instead (e.g. regional funding and “worldwide” funding). KFF analysis of USAID FY 2014 transaction data, downloaded 4-1-15 from the U.S. Foreign Assistance Dashboard, www.ForeignAssistance.gov. ↩︎
Of the 79 countries, 17 countries had 1 NGO that received funding, 33 countries had 2-9 NGOs, and 29 countries had 10 or more NGOs. Additional NGOs may have operated in these countries with USG regional and “worldwide” support. KFF analysis of USAID FY 2014 transaction data, downloaded 4-1-15 from the U.S. Foreign Assistance Dashboard, www.ForeignAssistance.gov. ↩︎