How Much Is Enough? Out-of-Pocket Spending Among Medicare Beneficiaries: A Chartbook
Section 2: High Out-of-Pocket Spenders, 2010
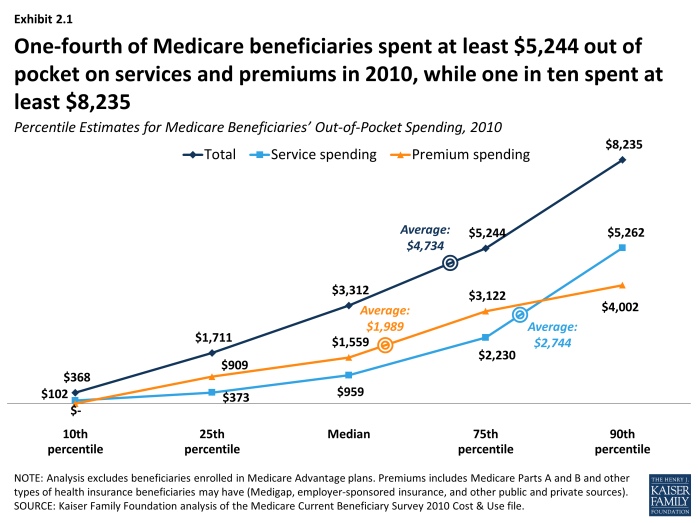
While the average person in traditional Medicare spent $4,734 out of pocket on medical and long-term care services and premiums in 2010, one-fourth of beneficiaries spent at least $5,244 out of pocket on services and premiums (the top quartile), and one in ten spent at least $8,235 (the top decile) that year (Exhibit 2.1). In 2010, total out-of-pocket spending among beneficiaries in the top quartile of spenders averaged $11,530, 2.7 times average spending by beneficiaries in the third quartile ($4,223) and more than 16 times that of beneficiaries in the bottom quartile ($712) (Exhibit 2.2). In addition to premium spending, long-term care facility costs are a major component of spending for beneficiaries in the top quartile of total out-of-pocket spending, accounting for more than one-fourth of their average total out-of-pocket spending, while these costs are a relatively small fraction of spending by beneficiaries in the bottom three quartiles of total out-of-pocket spending. Long-term care facility spending is not the only contributor to high out-of-pocket costs, however; higher spending on medical providers and supplies, prescription drugs, and dental services also contribute to relatively high spending among those in the top quartile.
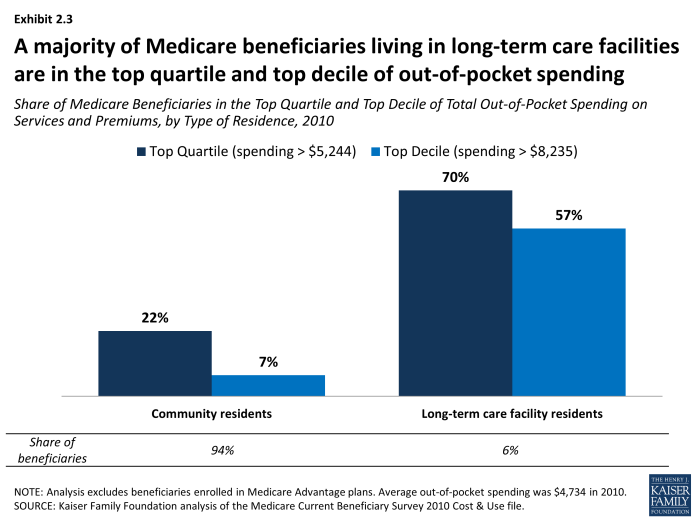
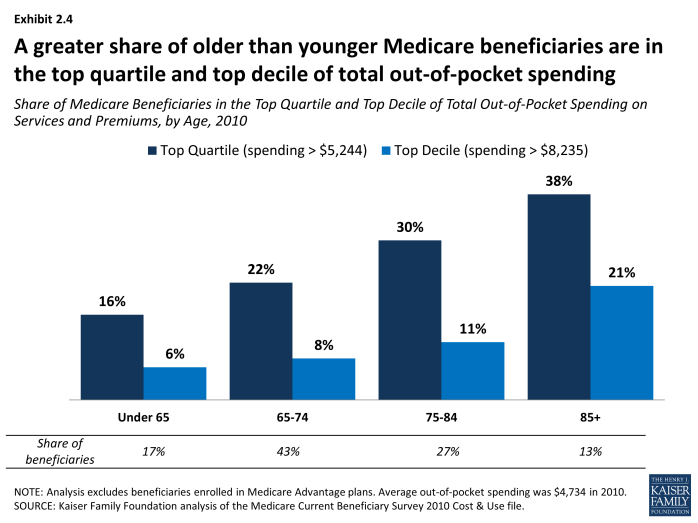
A greater share of some groups of beneficiaries than others are high out-of-pocket spenders. Perhaps not surprisingly, this includes the vast majority of Medicare beneficiaries who live in long-term care facilities, 70 percent of whom are in the top quartile of out-of-pocket spending on services and premiums (Exhibit 2.3). Overall, a greater share of older beneficiaries than younger beneficiaries are high out-of-pocket spenders, with more than one-third (38%) of beneficiaries ages 85 and older in the top quartile of total out-of-pocket spending (Exhibit 2.4). This estimate is somewhat lower but the results are directionally the same when looking at different age groups among community residents only; 33 percent of community residents ages 85 and over are in the top quartile compared to 24 percent of those ages 65 to 74 (data not shown).
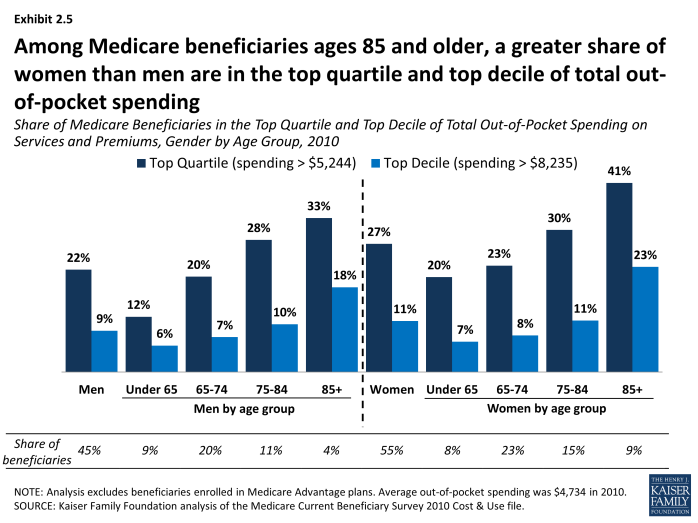
Among beneficiaries ages 85 and older, a greater share of women than men are high out-of-pocket spenders, with 41 percent of women ages 85 and older in the top quartile compared to 33 percent of older men (Exhibit 2.5). These differences are attenuated but not eliminated when looking at out-of-pocket spending among community residents only; for example, 34 percent of women ages 85 and older living in the community are in the top quartile of total out-of-pocket spending compared to 31 percent of older men (data not shown).
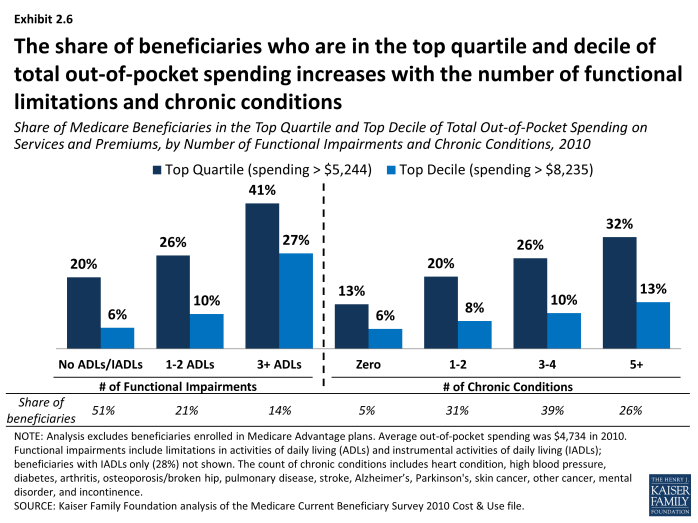
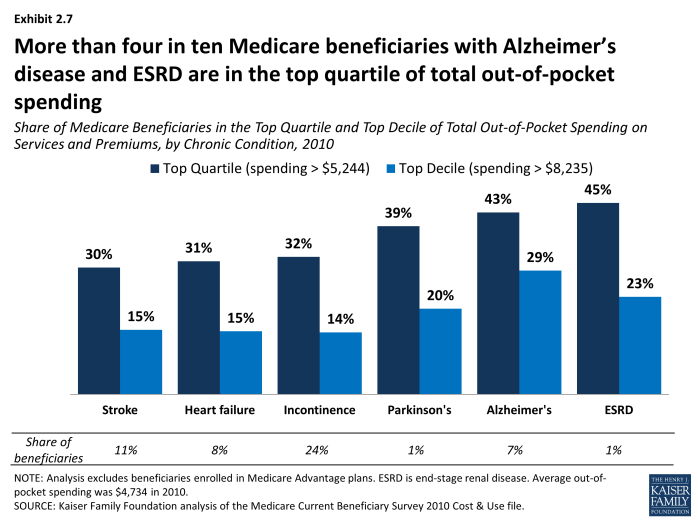
Just as average total out-of-pocket spending increases with the number of functional limitations and chronic conditions, the share of beneficiaries who are high out-of-pocket spenders increases with the number of functional limitations and chronic conditions. In 2010, 41 percent of beneficiaries with three or more limitations in activities of daily living (ADLs) were among the top quartile of spenders, compared to only 20 percent of those without any ADLs or IADLs (Exhibit 2.6). Nearly one-third (32%) of beneficiaries with five or more chronic conditions were in the top quartile of spending, compared to one-fifth of those with one or two chronic conditions. A greater share of beneficiaries with certain conditions are high out-of-pocket spenders; this includes more than four in ten beneficiaries with Alzheimer’s and end-stage renal disease (ESRD) in the top quartile of out-of-pocket spending, and roughly one-third of beneficiaries with certain other conditions. At least one in five beneficiaries with Parkinson’s disease, Alzheimer’s disease, and ESRD are in the top decile of out-of-pocket spending (Exhibit 2.7).
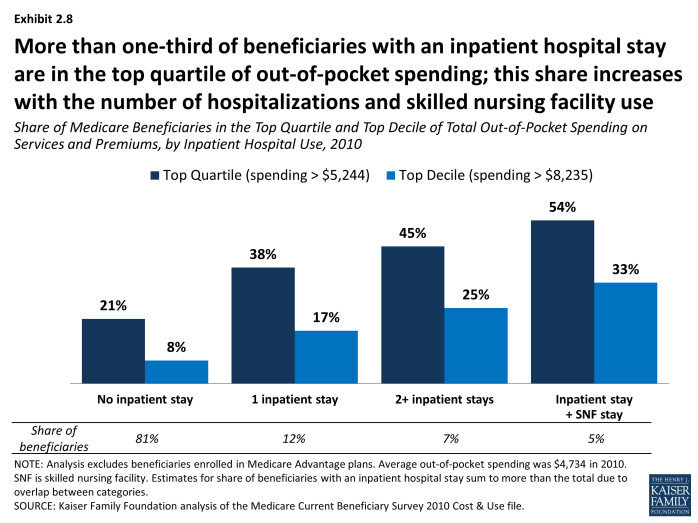
The share of Medicare beneficiaries in the top quartile and top decile of total out-of-pocket spending increases with the number of hospitalizations and skilled nursing facility (SNF) use. More than one-third (38%) of beneficiaries with one inpatient hospital stay were in the top quartile of total out-of-pocket spending in 2010, while 45 percent of beneficiaries with two or more hospitalizations and over half (54%) of beneficiaries with an inpatient stay and a SNF stay were in the top quartile of total out-of-pocket spending (this latter group may include beneficiaries in the first two groups) (Exhibit 2.8).

