How Much Is Enough? Out-of-Pocket Spending Among Medicare Beneficiaries: A Chartbook
Section 3: Trends in Out-of-Pocket Spending By Medicare Beneficiaries, 2000-2010
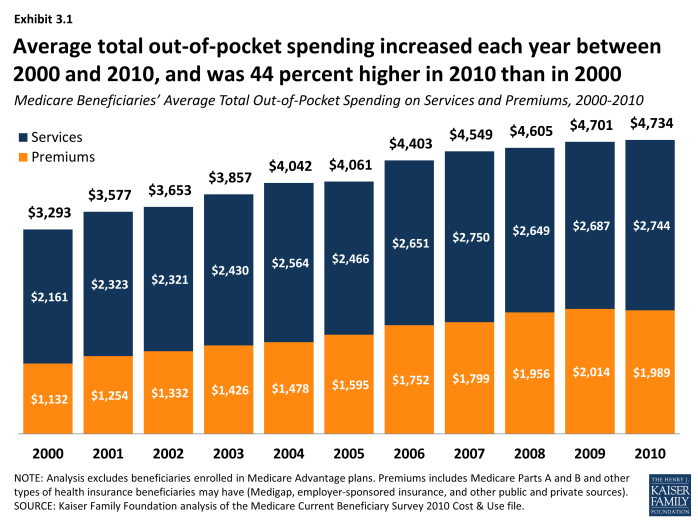
Medicare beneficiaries’ average total out-of-pocket spending, including services and premiums, increased by nearly $1,500 between 2000 and 2010. On average, beneficiaries in traditional Medicare spent $1,500 more (a 44 percent increase) on their total out-of-pocket costs (including services and premiums) in 2010 than in 2000 ($4,734 vs. $3,293, respectively) (Exhibit 3.1). Average out-of-pocket spending on medical and long-term care services increased by 27 percent between 2000 and 2010 (from $2,161 to $2,744), while average out-of-pocket spending on Medicare and other premiums increased by 76 percent (from $1,132 to $1,989).
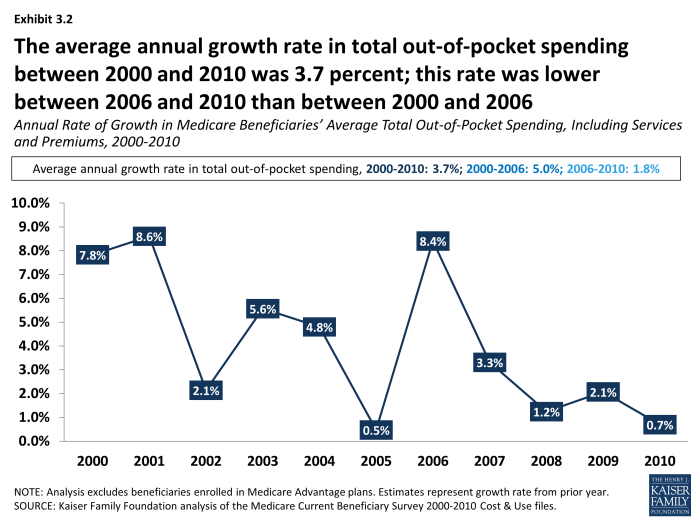
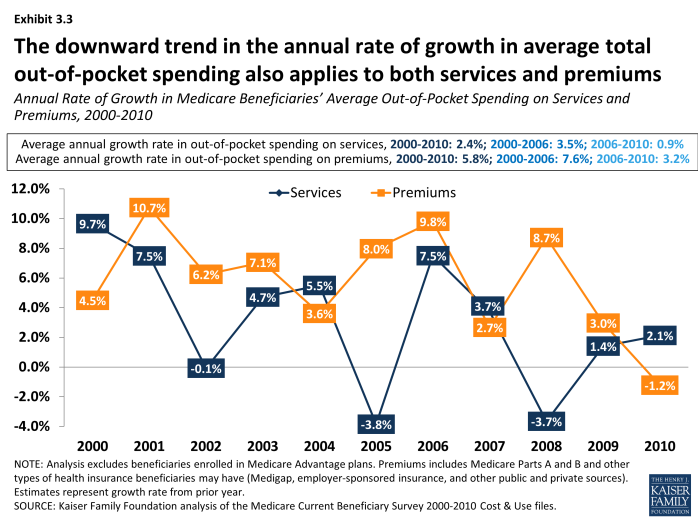
Between 2000 and 2010, total out-of-pocket costs increased at an average annual growth rate of 3.7 percent; the average annual growth rate between 2000 and 2010 was higher for premiums (5.8%) than for services (2.4%) (Exhibit 3.2) and (Exhibit 3.3).
While average total out-of-pocket spending increased between 2000 and 2010, the annual rate of growth in spending trended downward after 2006. The annual rate of growth in average total out-of-pocket spending fluctuated over the years between 2000 and 2010, but trended down in the latter part of the decade (Exhibit 3.2). Total out-of-pocket spending among beneficiaries in traditional Medicare increased at an average annual rate of growth of 5.0 percent between 2000 and 2006, but this growth rate fell to 1.8 percent between 2006 and 2010.
This downward trend in the annual rate of growth in average total out-of-pocket spending also applies to both services and premiums. Similar to the downward trend in the average annual growth rate for total out-of-pocket spending, we observed slower growth in the separate components of total out-of-pocket spending (Exhibit 3.3). Out-of-pocket spending on services increased at an average annual growth rate of 3.5 percent between 2000 and 2006, but this growth rate dropped to 0.9 percent between 2006 and 2010; for premiums, the average annual growth rate decreased from 7.6 percent between 2000 and 2006 to 3.2 percent between 2006 and 2010.
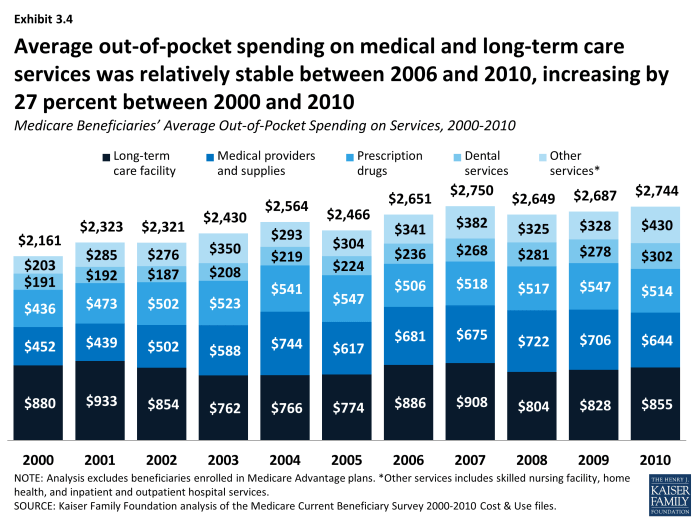
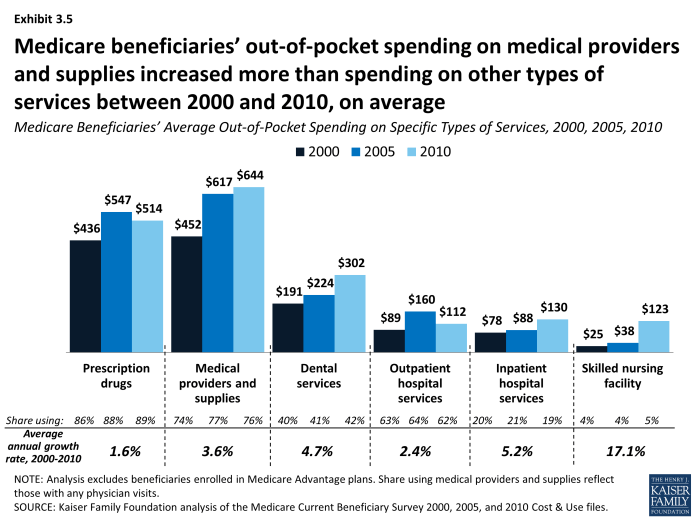
Among all beneficiaries, average out-of-pocket spending on medical providers/supplies, dental services, and skilled nursing facility services increased more than average spending on other types of services between 2000 and 2010.(Exhibit 3.4) However, the average annual rate of growth in out-of-pocket spending between 2000 and 2010 was more than three times greater for spending on skilled nursing facilities (17.1%) than the next fastest growing category of spending (inpatient hospital services; 5.2%) (Exhibit 3.5).
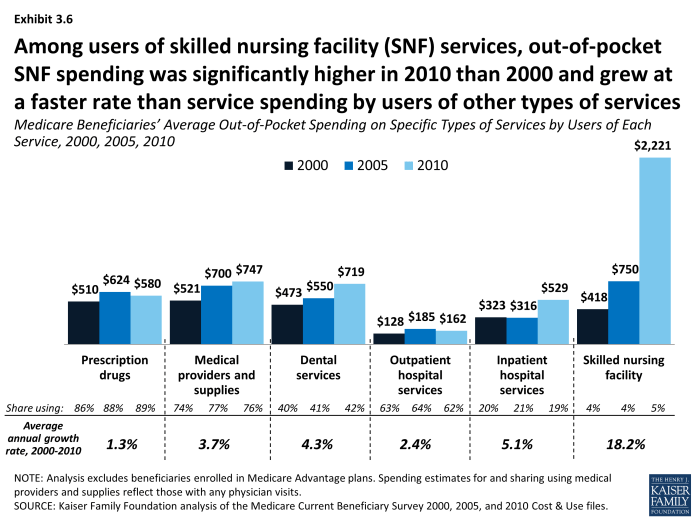
Among users of services, average out-of-pocket spending for most types of services increased between 2000 and 2010. In 2010, beneficiaries with a skilled nursing facility stay spent five times more on SNF services than those with a SNF stay in 2000 ($2,221 vs. $418, respectively, on average) (Exhibit 3.6). The average number of days associated with SNF stays increased from 28 to 35 over the same period.1 Users of prescription drugs spent somewhat more out of pocket on prescription drugs in 2010 than in 2000, on average—increasing from $510 in 2000 to $580 in 2000, while the average number of prescription drug fills increased from 28 to 42 over these years.2 It is likely that the introduction of the Part D prescription drug benefit in 2006 and the shift toward greater use of generic drugs helped to moderate the average out-of-pocket spending increase among prescription drug users, as well as contributing to the growth in the number of prescription fills.

