Donor Government Funding for HIV in Low- and Middle-Income Countries in 2023
Overview
This report, Donor Government Funding for HIV in Low- and Middle-Income Countries in 2023, tracks funding levels of the donor governments that collectively provide the bulk of international assistance for AIDS through bilateral programs and contributions to multilateral organizations. The new report, produced as a partnership between KFF and UNAIDS, provides the latest data available on donor funding disbursements based on data provided by governments. It includes their bilateral assistance to low- and middle-income countries and contributions to the Global Fund to Fight AIDS, Tuberculosis and Malaria as well as UNITAID.
Key Findings
Key Findings
This report provides an analysis of donor government funding to address the HIV response in low- and middle-income countries in 2023, the latest year available, as well as trends over time. It includes both bilateral funding from donors and their multilateral contributions to the Global Fund to Fight AIDS, Tuberculosis and Malaria (Global Fund), UNITAID, and Joint United Nations Programme on HIV/AIDS (UNAIDS). Overall, the analysis shows that funding for HIV decreased between 2022 and 2023. While most of this was due to timing, the longer trend shows a shift away from bilateral funding by most donors, one that has not been fully offset by multilateral support. As a result, HIV funding, while fluctuating over time, has not returned to its highest level, reached a decade ago. At the same time, while there has been significant progress in addressing the HIV epidemic, the number of people newly infected by HIV is rising in some regions, some populations are particularly at risk and lack access to prevention services, and almost a quarter of people living with HIV are still not on treatment.1 Key findings include the following:
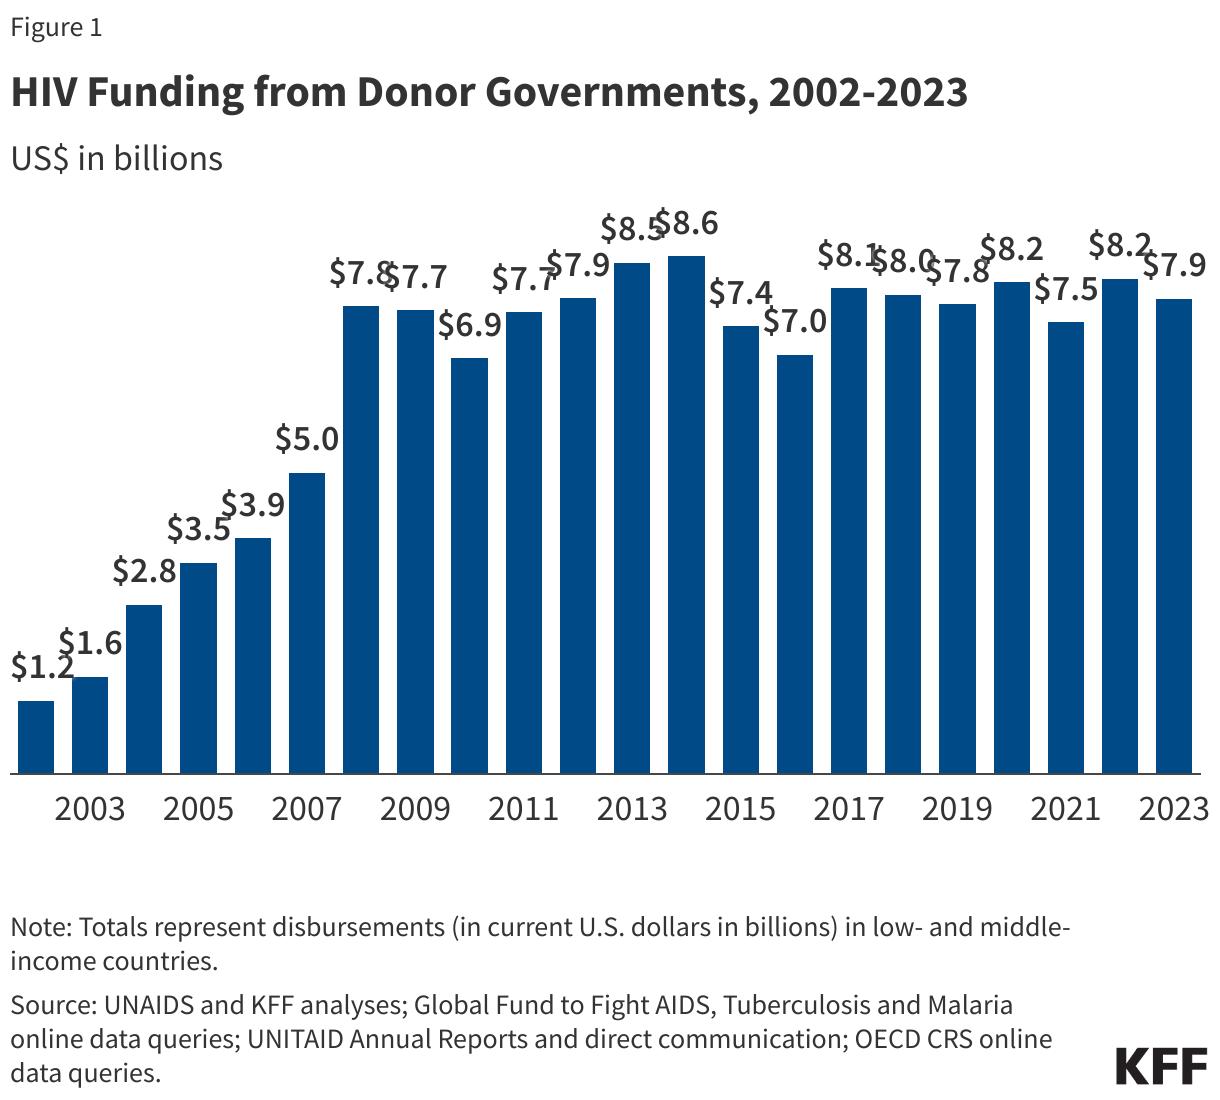
- Donor government funding for HIV decreased in 2023 compared to the prior year. Disbursements were US$7.86 billion in 2023, a decrease of US$358 million compared to 2022 (US$8.22 billion), in current U.S. dollars (not adjusted for inflation).2 Funding decreased even after accounting for exchange rate fluctuations. Looking more broadly, HIV funding in 2023 was essentially the same as in 2008 (US$7.78 billion), and well below the peak level reached in 2014 (US$8.60 billion). As a result, funding has not kept pace with inflation.3
- While both bilateral and multilateral funding in 2023 declined, most of the decline was in multilateral support. Bilateral funding declined slightly, by US$46 million, to US$5.58 billion in 2023 compared to US$5.62 billion in 2022. Multilateral funding declined by US$312 million, to US$2.28 billion in 2023 compared to US$2.59 billion in 2022.4
- The decline in multilateral funding, however, was largely due to the timing of donor government contributions to the Global Fund in 2023, reflecting pledging periods, not reductions in actual support. With 2023 marking the first year of the most recent pledge period (2023-2025), there were large fluctuations in contributions to the Global Fund from most donor governments when compared to 2022 totals. Some donors choose to “front-load” contributions (e.g., the U.K. fulfilled almost its entire pledge for 2023-2025 in 2023), while others choose to fulfill pledges towards the end of the pledge period (e.g., Denmark did not provide any contribution in 2023 and will likely be fulfilling its pledge in future years).5
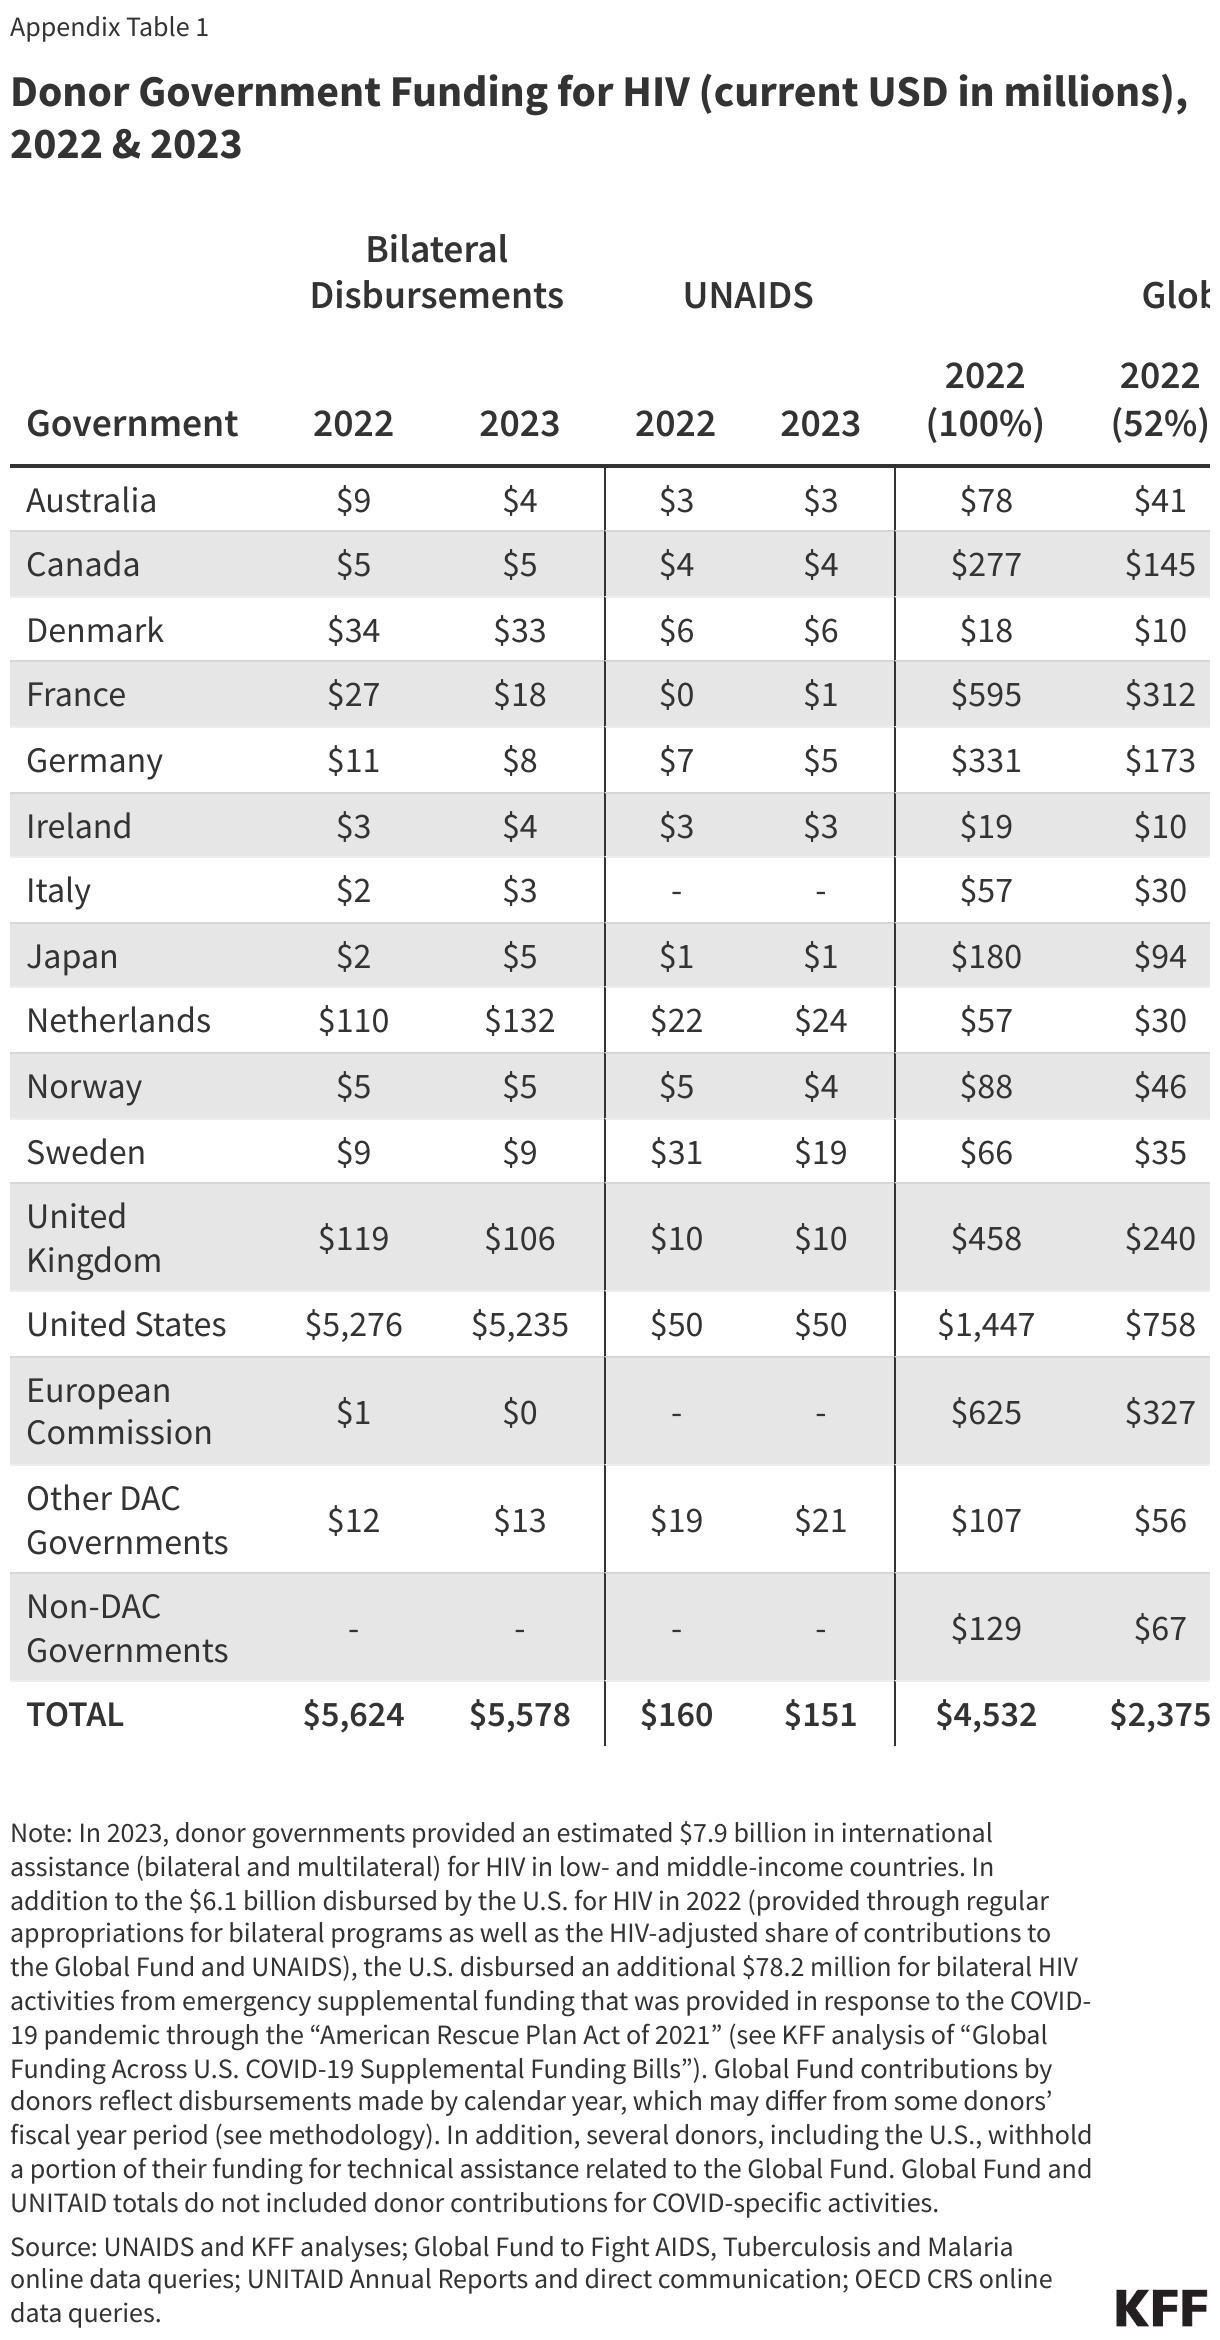
- The US continued to be the largest donor to HIV. In 2023, the U.S. disbursed US$5.71 billion, accounting for 73% of total donor government HIV funding (bilateral and multilateral combined).6 The U.K. was the second largest donor (US$714 million, 9%), followed by France (US$320 million, 4%), Germany (US$228 million, 3%), and the Netherlands (US$187 million, 2%). When standardized by the size of economy, the U.K. ranked first, followed by the U.S., the Netherlands, Sweden, and France.
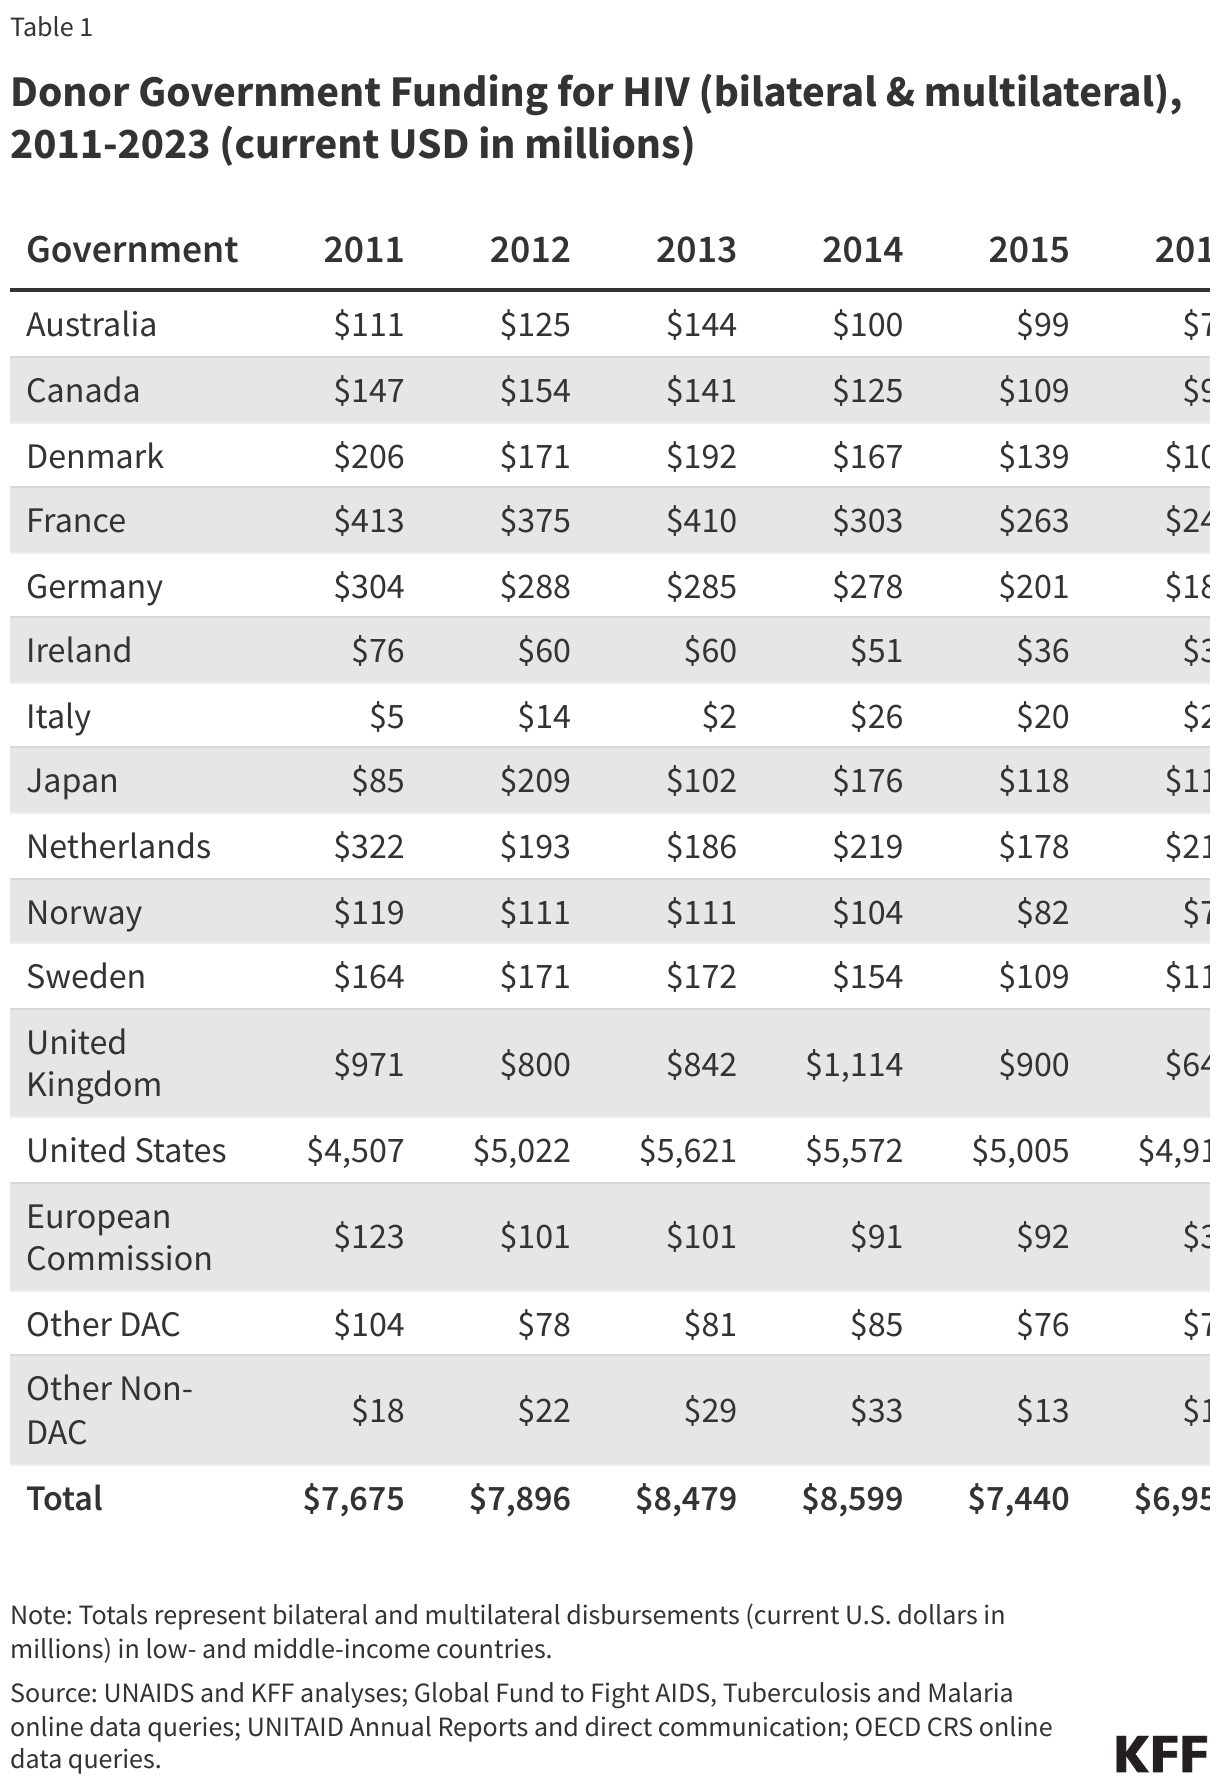
- More broadly, trends show that donor governments, other than the U.S., have significantly reduced their bilateral HIV support while increasing funding to the Global Fund, although this shift has not fully offset bilateral declines. Since 2011, the first year where detailed bilateral and multilateral data are available for all donors, bilateral funding from donor governments other than the U.S. has declined by US$1.37 billion (-80%). While multilateral funding from these donor governments has increased in recent years and was higher in 2023 (US$1.81 billion) than 2011 (US$1.46 billion), these increases have not been large enough to offset bilateral declines. Increases from the U.S. in some years have, for the most part, countered these declines.
- Looking ahead, increases in donor government funding for HIV in low- and middle-income countries seem uncertain at best. There are significant headwinds on the horizon that complicate the funding picture from donor governments. These include multiple geopolitical challenges and broader economic pressures, as well as a crowded global health replenishment schedule, with several global health institutions, including the Global Fund, seeking to raise funds from the same donors over the same time period. Finally, national elections have either recently concluded or are taking place in the coming months in several donor capitals, including the U.S., the outcomes of which could shape future funding for HIV.
Report
Introduction
This report provides the latest data on donor government resources available to address HIV in low- and middle-income countries, reporting on disbursements made in 2023. It is part of a collaborative tracking effort between UNAIDS and KFF that began almost 20 years ago, just as new global initiatives were being launched to address the epidemic. The analysis includes data from all 32 members of the Organisation for Economic Co-operation and Development (OECD)’s Development Assistance Committee (DAC), as well as non-DAC members who report data to the DAC. Data are collected directly from donor governments, UNAIDS, the Global Fund, and UNITAID, and supplemented with data from the DAC. Of the 32 DAC members, 14 provide 98% of total disbursements for HIV; data for these donors are presented individually. For the remaining 18 DAC members, data are provided in aggregate. All totals are presented in current U.S. dollars (amounts are not adjusted for inflation). While totals include both bilateral and multilateral assistance for the entire period (2002-2023), detailed disaggregated bilateral and multilateral amounts for all donors are only available starting in 2011 (see Methodology for more detail).
Findings
Total Funding
In 2023, donor government funding for HIV through bilateral and multilateral channels totaled US$7.86 billion in current USD (not adjusted for inflation) and accounted for approximately 37% of the US$22.1 billion estimated by UNAIDS to be available to address HIV (the total estimated resources is US$19.8 billion when measured in 2019 constant USD).7 ,8 ,9 ,10 As per UNAIDS estimates, domestic resources accounted for 59%, and the remainder (4%) was from foundations, other multilateral organizations, and UN agencies. This amount is well below the US$29.3 billion that UNAIDS estimates will be needed by 2025 in order to reach global goals, and UNAIDS reports a widening funding gap overall and significant unmet need in funding for HIV prevention.11
Donor government funding for HIV in 2023 declined by US$358 million compared to 2022 (US$7.86 in 2023 compared to $8.22 billion in 2022) (See Figure 1 and Table 1).12 While there were actual declines in bilateral funding by several donor governments, the overall decrease was largely due to the timing of donor contributions to the Global Fund.
Looking more broadly, HIV funding in 2023 was essentially the same as in 2008 (US$7.78 billion), and well below the peak level reached in 2014 (US$8.60 billion). While funding has fluctuated since 2008, overall amounts have not kept up with inflation.
The U.S. continued to be the largest donor to HIV efforts, providing US$5.71 billion and accounting for 73% of total donor government funding in 2023. The second largest donor was the U.K. (US$714 million, 9%), followed by France (US$320 million, 4%), Germany (US$228 million, 3%), and the Netherlands (US$187 million, 2%). In 2023, 91% of total donor government funding for HIV was provided by these five donors.
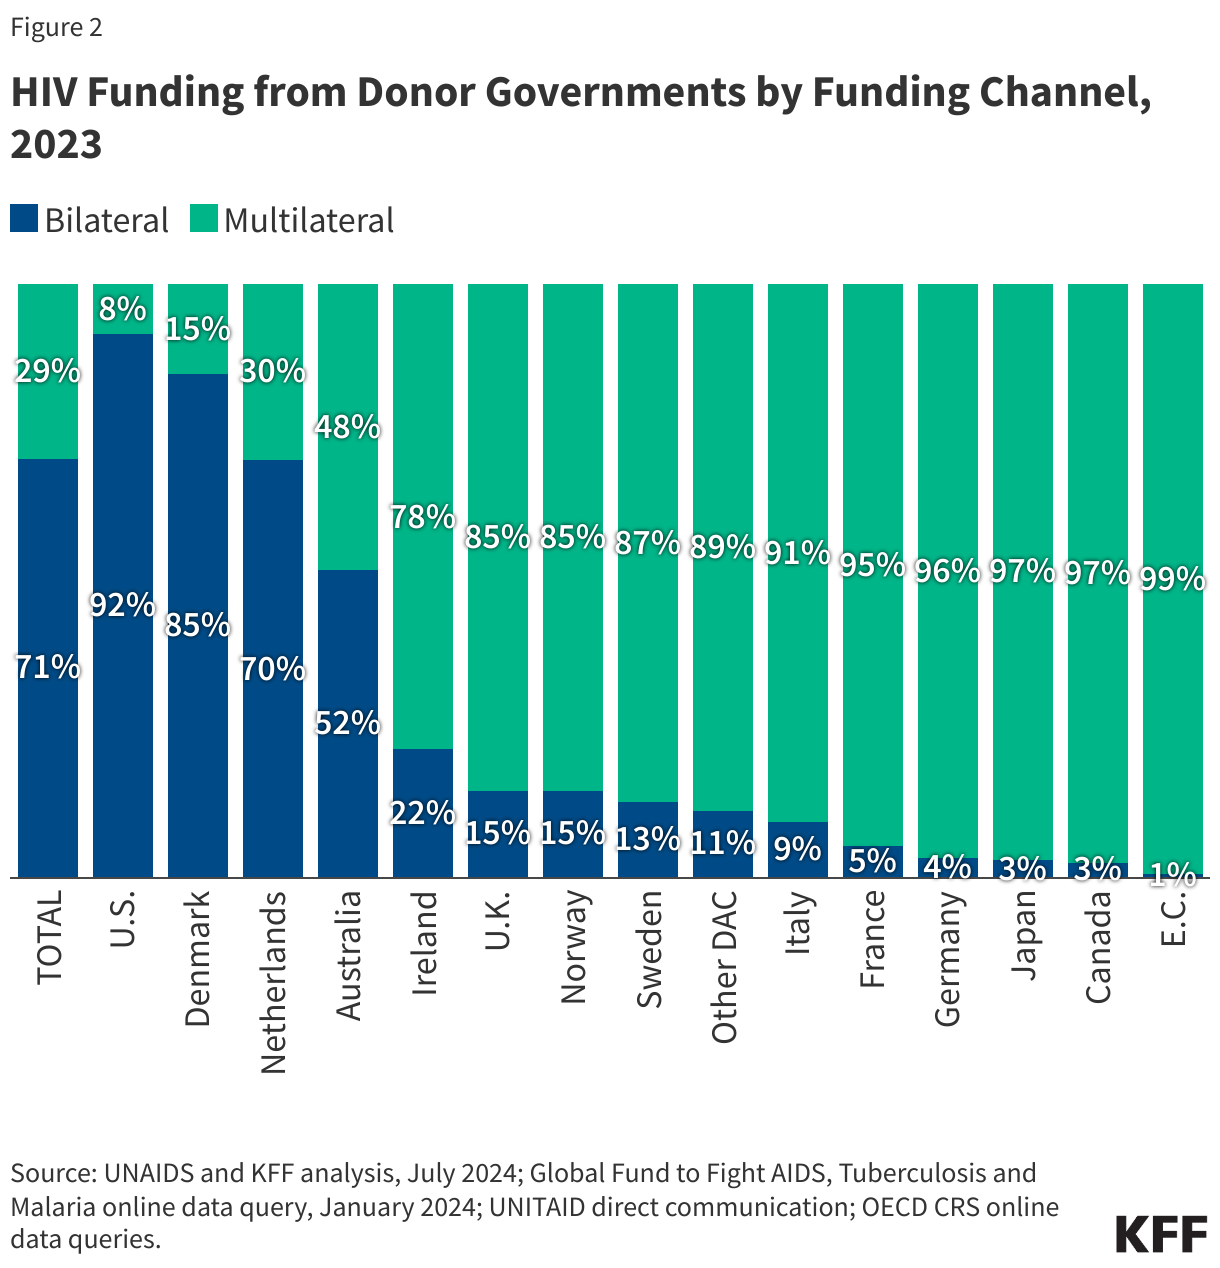
While most funding from donors was provided bilaterally (71%), largely driven by the U.S. (which provided 92% of its funding through bilateral channels), the majority of donors (ten - Canada, European Commission, France, Germany, Ireland, Italy, Japan, Norway, Sweden, and the U.K.) provide a larger share of their resources through multilateral channels (See Figure 2). Since 2011, most donor governments, other than the U.S., have shifted away from bilateral support. In 2011, 54% of their HIV funding was provided through bilateral channels compared to only 16% in 2023 (see below for more on bilateral disbursements and multilateral contributions).
Bilateral Disbursements
Bilateral disbursements for HIV from donor governments – that is, funding disbursed by a donor on behalf of a recipient country or region – totaled US$5.58 billion in 2023, a decrease of US$46 million compared to 2022 (US$5.62 billion). This decline was due to decreased bilateral funding from half of the donor governments; all other donor governments either increased bilateral support or remained flat (See Figure 3). These trends were the same after accounting for exchange rate fluctuations.
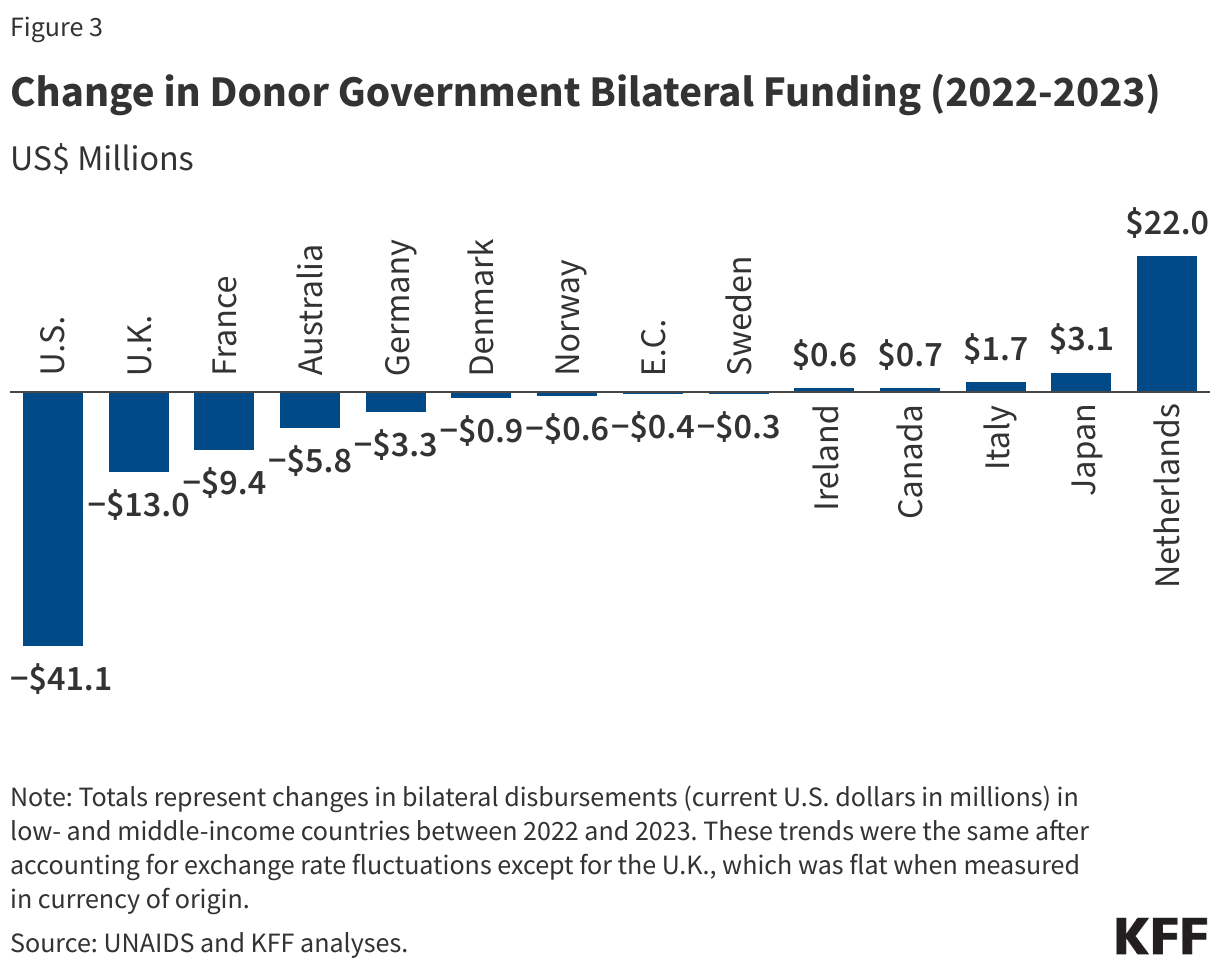
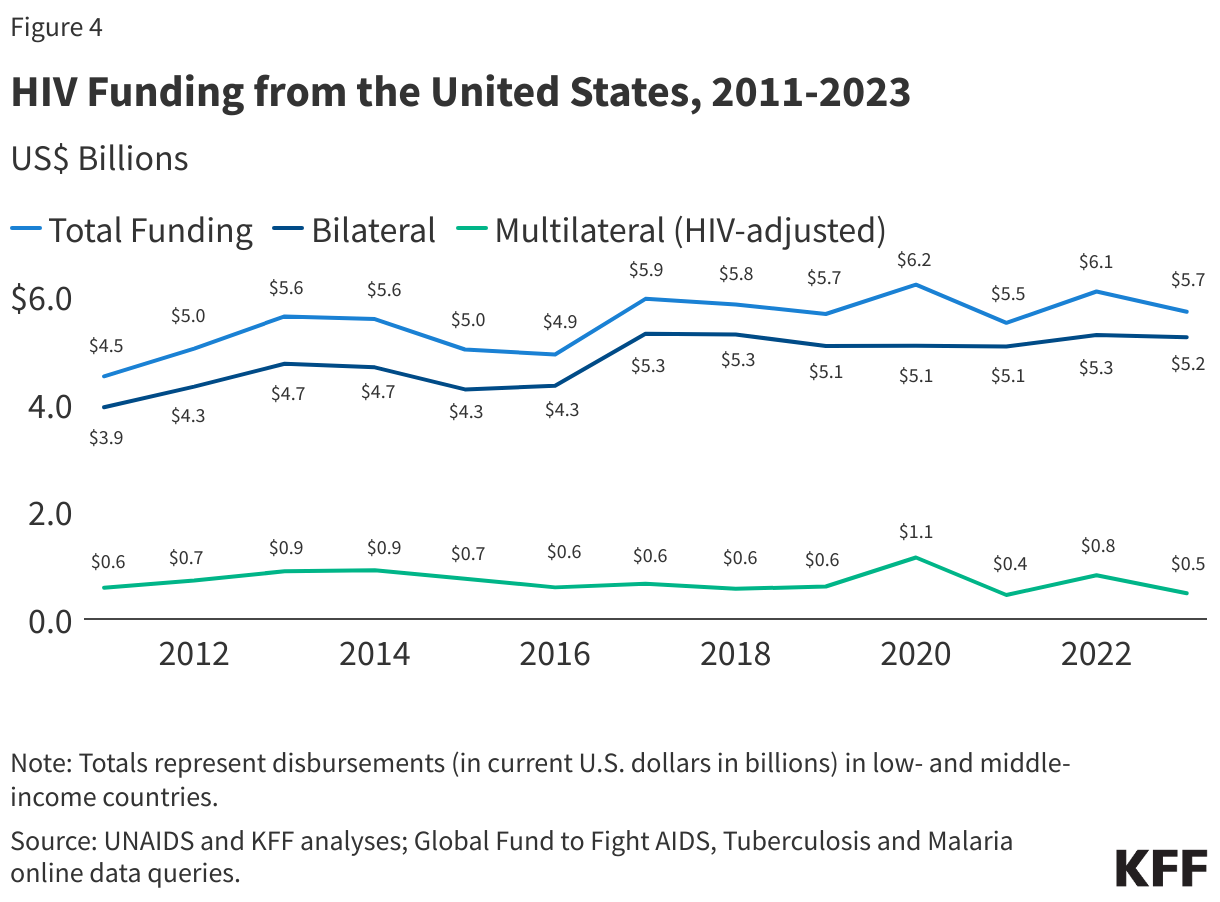
Bilateral disbursements by the U.S. declined slightly, by US$41 million (-1%) in 2023 (US$5.23 billion) compared to 2022 (US$5.28 billion) (See Figure 4) and represented the largest bilateral decrease (in USD) among donor governments. However, the change was due to the timing of disbursements of prior year funding and was not an actual decrease in funding commitments from the U.S. In fact, bilateral HIV funding as specified by the U.S. Congress in annual appropriations has been flat for several years.13 When the U.S. decrease is removed, bilateral funding from all other donor governments declined by US$5 million in 2023 (US$343 million) compared to 2022 (US$348 million).
Since 2011, bilateral funding from donor governments, other than the U.S., has decreased by approximately US$1.37 billion (80%) (See Figure 5). As a result, the U.S. has accounted for an increasing share of bilateral resources, rising from 70% in 2011 to 94% in 2023, with fluctuations in U.S. disbursements having an outsized impact on overall bilateral trends.

Multilateral Contributions
Multilateral contributions from donor governments to the Global Fund, UNITAID, and UNAIDS for HIV – funding disbursed by donor governments to these organizations which in turn use some (Global Fund and UNITAID) or all (UNAIDS) of that funding for HIV – totaled US$2.28 billion in 2023 (after adjusting for an HIV share to account for the fact that the Global Fund and UNITAID address other diseases).14 Funding was US$2.07 billion for the Global Fund, US$56 million for UNITAID, and US$151 million for UNAIDS.
The decline in donor government multilateral funding in 2023 was largely due to the timing of contributions to the Global Fund, reflecting pledge periods, and not actual decreases in support. With 2023 marking the first year of the most recent pledge period (2023-2025), there were large fluctuations in contributions to the Global Fund from most donor governments when compared to 2022 totals. Some donors choose to “front-load” contributions (e.g., the U.K. fulfilled almost its entire pledge for 2023-2025 in 2023), while others choose to fulfill pledges towards the end of the pledge period (e.g., Denmark did not provide any contribution in 2023 and will likely be fulfilling its pledge in future years). In addition, the timing of U.S. contributions to the Global Fund is based on the amount of funding received from other donors, as the U.S. is required by law not to exceed 33% of total contributions to the Global Fund from all donors, which also results in significant year-to-year fluctuations (See Figure 6). More generally, donor governments have increased contributions to the Global Fund.

Fair Share
There are different ways to measure donor government contributions to HIV, relative to one another. While the U.S. government provides the largest amount of funding for HIV, for example, it also has one of the largest economies in the world. To assess relative contributions, or “fair share”, two measures were used: ranking by overall funding amount and ranking by funding for HIV per US$1 million GDP, to adjust for the size of donor economies (See Table 2):
- Rank by share of total donor government funding for HIV: By this measure, the U.S. ranked first in 2023, followed the U.K., France, Germany, and the Netherlands. The U.S. has ranked #1 in absolute funding amounts since tracking efforts began.
- Rank by funding for HIV per US$1 million GDP: By this measure, the U.K. ranks first, followed by the U.S., the Netherlands, Sweden, and France (See Figure 7).15


Looking Forward
Donor government funding for HIV in low and middle-income countries will continue to be an important part of the sustainability of the HIV response for years to come, particularly given the funding gap for HIV prevention efforts. Yet future donor government funding levels seem uncertain at best, and while there has been significant progress in addressing the HIV epidemic –1.3 million people were newly infected with HIV in 2023, down from 2.1 million in 2010 – new infections are on the rise in some regions, including two (Eastern Europe and Central Asia and the Middle East and North Africa) that UNAIDS reports have the largest funding gaps and are making the least progress against their HIV epidemics.16 There are significant headwinds on the horizon that complicate the funding picture from donor governments. These include multiple geopolitical challenges, such as costs associated with ongoing conflicts and displacement of refugees, as well as broader economic forces, including continued inflationary pressures. In addition, there is a crowded global health replenishment schedule in the year ahead, with several global health institutions, including the Global Fund, seeking to raise funds from the same donors. Finally, national elections have recently concluded (European Union, France, and the U.K.) or will occur in the coming months (U.S.), the outcomes of which could shape future funding for HIV in 2024 and beyond.
This work was supported in part by the Joint United Nations Programme on HIV and AIDS (UNAIDS) and the Bill & Melinda Gates Foundation. KFF maintains full editorial control over all of its policy analysis, polling, and journalism activities.
Adam Wexler, Jen Kates, and Stephanie Oum are with KFF. Eric Lief is an independent consultant. Joint United Nations Programme on HIV and AIDS (UNAIDS).
Methodology
This project represents a collaboration between the Joint United Nations Programme on HIV/AIDS (UNAIDS) and KFF. Data provided in this report were collected and analyzed by UNAIDS and KFF.
Totals presented in this analysis include both bilateral funding for HIV in low- and middle-income countries, core contributions to UNAIDS, and the estimated share of donor government contributions to the Global Fund and UNITAID that are used for HIV. Amounts are based on analysis of data from the 32 donor government members of the Organisation for Economic Co-operation and Development (OECD) Development Assistance Committee (DAC) in 2023 who had reported Official Development Assistance (ODA). Bilateral and multilateral data were collected from multiple sources from April 2024 - June 2024. Disaggregated bilateral and multilateral data are only available starting from 2011.
Data on gross domestic product (GDP) were obtained from the International Monetary Fund’s World Economic Outlook Database and represent current price data for 2023 (see: https://www.imf.org/en/Publications/WEO/weo-database/2024/April).
Bilateral Funding:Bilateral funding is defined as any earmarked (HIV-designated) amount, including earmarked non-core (“multi-bi”) contributions to multilateral organizations, such as UNAIDS. Data included in this report represent funding assistance for HIV prevention, care, treatment and support activities, but do not include funding for international HIV research conducted in donor countries (which is not considered in estimates of resource needs for service delivery of HIV-related activities).
The research team collected the latest bilateral funding data directly from twelve governments: Australia, Canada, Denmark, France, Germany, Ireland, Japan, the Netherlands, Norway, Sweden, the United Kingdom, and the United States during the first half of 2024, representing the fiscal year 2023 period. Direct data collection from these donors was desirable because they represent the preponderance of donor government assistance for HIV and the latest official statistics – from the Organisation for Economic Co-operation and Development (OECD) Creditor Reporting System (CRS) (see: http://www.oecd.org/dac/stats/data) – are from 2022 and do not include all forms of international assistance (e.g., certain funding streams provided by donors, such as HIV components of mixed-purpose grants to non-governmental organizations). Data for all other member governments of the OECD DAC – Austria, Belgium, the Czech Republic, the European Commission, Estonia, Finland, Greece, Hungary, Iceland, Italy, Korea, Lithuania, Luxembourg, New Zealand, Poland, Portugal, the Slovak Republic, Slovenia, Spain, and Switzerland – which collectively accounted for less than 5 percent of bilateral disbursements in each of the past several years, were obtained from the OECD CRS database are from calendar year 2022.
Where donor governments were members of the European Union (EU), the research team ensured that no double-counting of funds occurred between EU Member State reported amounts and European Commission (EC) reported amounts for international HIV assistance. Figures obtained directly using this approach should be considered as the upper bound estimation of financial flows in support of HIV-related activities.
Reflecting deliberate strategies of integrating HIV activities into other activity sectors, some donors use policy markers to attribute portions of mixed-purpose projects to HIV. This is done, for example, by the Netherlands and the U.K. The bilateral figures submitted by the UK Foreign, Commonwealth & Development Office (FCDO) for the financial year 2023/24 are based on an existing FCDO ‘HIV policy marker’. Ireland and Denmark also attribute percentages of multipurpose projects to HIV. Canada breaks its mixed-purpose projects into components by percentage. Germany, Norway, and Sweden provided data much more conservatively, consistent with DAC constructs and purpose codes. Apart from targeted HIV/AIDS programs, bilateral health programs mainly focusing on health systems strengthening are also designed to contribute to the HIV response in partner countries.
Bilateral assistance data represent disbursements. A disbursement is the actual release of funds to, or the purchase of goods or services for, a recipient. Disbursements in any given year may include disbursements of funds committed in prior years and in some cases, not all funds committed during a government fiscal year are disbursed in that year. In addition, a disbursement by a government does not necessarily mean that the funds were provided to a country or other intended end-user.
Amounts presented are for the fiscal year period, which varies by country. The U.S. fiscal year runs from October 1-September 30. The fiscal years for Canada, Japan, and the U.K. are April 1-March 31. The Australian fiscal year runs from July 1-June 30. The European Commission, Denmark, France, Germany, Italy, Ireland, the Netherlands, Norway, and Sweden use the calendar year. The OECD uses the calendar year, so data collected from the CRS for other donor governments reflect January 1-December 31. Most UN agencies use the calendar year, and their budgets are biennial.
All data are expressed in current US dollars (USD), unless otherwise noted. Where data were provided by governments in their currencies, they were adjusted by average daily exchange rates to obtain a USD equivalent, based on foreign exchange rate historical data available from the U.S. Federal Reserve (see: http://www.federalreserve.gov/) or the OECD.
Funding totals presented in this analysis should be considered preliminary estimates based on data provided and validated by representatives of the donor governments who were contacted directly.
Multilateral Funding:Multilateral funding includes core contributions to UNAIDS, as well as contributions to the Global Fund (see: http://www.theglobalfund.org/en/) and UNITAID (see: http://www.unitaid.org/#end). All Global Fund contributions were adjusted to represent 52% of the donor’s core contribution, reflecting the Fund’s reported grant approvals for HIV-related projects to date and includes funding for HIV/TB activities. UNITAID contributions were adjusted to represent 46% of the donor’s core contribution, reflecting UNITAID’s reported attribution for HIV-related projects.
Data obtained from UNAIDS, the Global Fund, and UNITAID were already adjusted to represent a USD equivalent based on date of receipts.
UNAIDS core contributions reflect 2023 amounts. Global Fund and UNITAID contributions from all governments correspond to amounts received during the 2023 calendar year, regardless of which contributor’s fiscal year such disbursements pertain to. UNAIDS and UNITAID provided contributions data directly to the research team. Global Fund contributions data were compiled by the research team and validated by the Global Fund. The French reported additional set-aside funding for the Global Fund after data collection was complete; this is now pending further review.
In addition to contributions supporting the Global Fund’s and UNITAID’s core activities, some donor governments provided significant funding to these multilateral organizations for COVID-related efforts between 2000-2023. These COVID-specific contributions were not included in totals in this analysis. The U.S., for example, provided almost US$1.9 billion in such funding to the Global Fund during 2022.
Other than contributions provided by governments to the Global Fund and UNITAID, un-earmarked general contributions to United Nations entities, most of which are membership contributions set by treaty or other formal agreement (e.g., the World Bank’s International Development Association or United Nations country membership assessments), are not identified as part of a donor government’s HIV assistance even if the multilateral organization in turn directs some of these funds to HIV. Rather, these would be considered as HIV funding provided by the multilateral organization, as in the case of the World Bank’s efforts, and are not considered for purposes of this report.
Appendix
Endnotes
- UNAIDS, “2024 UNAIDS Global AIDS Update Report: The Urgency of Now – AIDS at the Crossroads”, July 2024. ↩︎
- Between 2020-2023, some donor governments provided COVID-specific emergency contributions to the Global Fund and UNITAID in addition to their contributions for core activities. For the purposes of this report, these COVID-specific amounts have been excluded as they cannot be attributed to a specific area, such as HIV. ↩︎
- UNAIDS estimates that US$19.8 billion was available for HIV from all sources (domestic resources, donor governments, multilaterals, and philanthropic organizations) in 2023, expressed in 2019 USD. For purposes of this analysis, this estimate was converted to 2023 USD, or US$22.1 billion. In addition, while the amounts presented in this analysis include donor contributions to multilateral organizations, the UNAIDS estimate of total available resources for HIV includes the actual disbursements made by multilateral organizations in 2023 rather than the donor government contributions to these entities. ↩︎
- Donor government contributions to the Global Fund and UNITAID have been adjusted for an HIV-share to account for the fact that these multilateral organizations address other diseases and areas (see Methodology). ↩︎
- Personal communication with Danish Ministry of Foreign Affairs, July 2024. ↩︎
- U.S. totals represent funding amounts provided through regular appropriations only. In 2021, the U.S. Congress appropriated additional emergency supplemental funding for bilateral HIV activities and for the Global Fund to address the impacts of the COVID-19 pandemic. These emergency supplemental funding amounts are not included in overall U.S. totals. ↩︎
- Donor government disbursements are a subset of overall international assistance for HIV in low-and-middle-income countries, which also includes funding provided by other multilateral institutions, UN agencies, and foundations. ↩︎
- UNAIDS, “2024 UNAIDS Global AIDS Update Report: The Urgency of Now – AIDS at the Crossroads”, July 2024. ↩︎
- UNAIDS estimates that US$19.8 billion was available for HIV from all sources (domestic resources, donor governments, multilaterals, and philanthropic organizations) in 2023, expressed in 2019 USD. For purposes of this analysis, this estimate was converted to 2023 USD, or US$22.1 billion. In addition, while the amounts presented in this analysis include donor contributions to multilateral organizations, the UNAIDS estimate of total available resources for HIV includes the actual disbursements made by multilateral organizations in 2023 rather than the donor government contributions to these entities. ↩︎
- The donor share of total available resources includes bilateral disbursements as well as an adjusted share of Global Fund and UNITAID disbursements (the donor government share of contributions to each of the multilaterals in 2022 is applied to the disbursements from these multilaterals for the same year). ↩︎
- The UNAIDS resource needs estimate is expressed in 2019 USD. UNAIDS, “2024 Global AIDS Update: The Urgency of Now - AIDS at the Crossroads”, July 2024. ↩︎
- KFF & UNAIDS, “Donor Government Funding for HIV in Low- and Middle-Income Countries in 2022”, July 2023. ↩︎
- KFF, “The U.S. President’s Emergency Plan for AIDS Relief (PEPFAR)”, July 2023. ↩︎
- In 2023, 52% of the Global Fund’s disbursements and 46% of UNITAID’s disbursements were directed to HIV activities. These percentages were applied to the full donor government contributions to these multilateral organizations to calculate the “HIV-share” (see Methodology for additional details). ↩︎
- GDP estimates are from the International Monetary Fund’s (IMF) World Economic Outlook (WEO) Database (accessed June 2024). ↩︎
- UNAIDS, “2024 UNAIDS Global AIDS Update Report: The Urgency of Now – AIDS at the Crossroads”, July 2024. ↩︎
