Health and Health Coverage in the South: A Data Update
Issue Brief
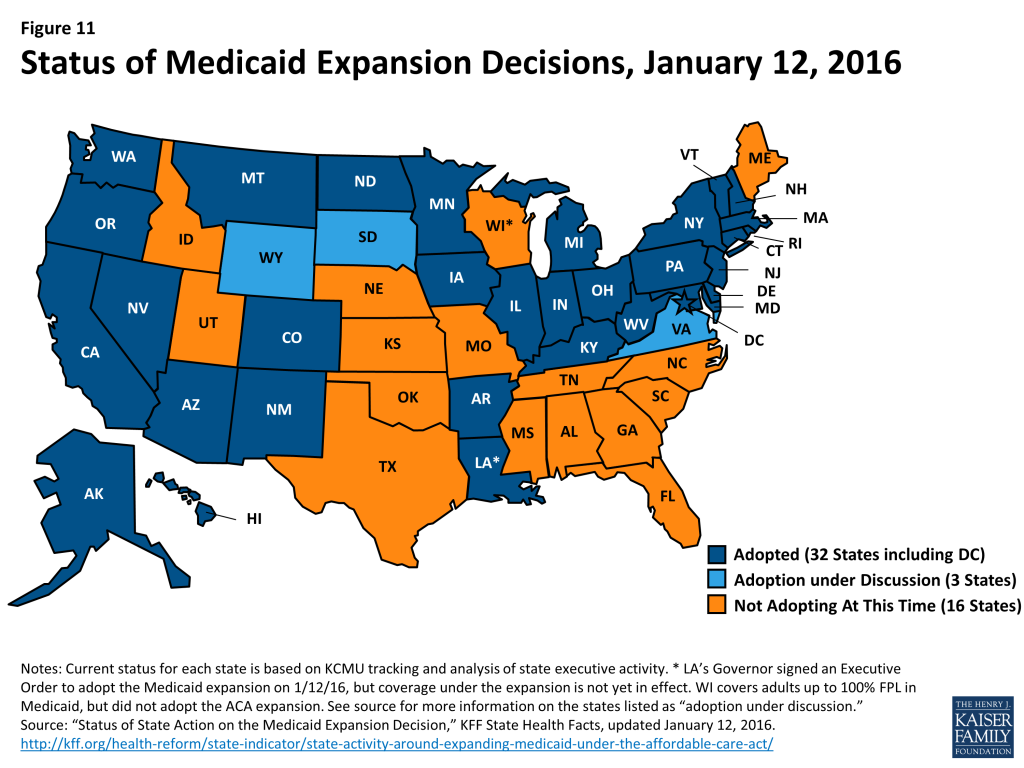
With its recent adoption of the Affordable Care Act (ACA) Medicaid expansion to adults, Louisiana became the 32nd state to move forward with the expansion, and the 7th of the 17 states that make up the American South to expand. However, within the South, which has high rates of chronic disease and poor health outcomes, the majority of states still have not adopted the Medicaid expansion. The ACA and its Medicaid expansion offer important opportunities to expand access to health coverage, particularly in the South, where Medicaid and CHIP eligibility levels across groups have lagged behind other regions for many years.1 While many factors contribute to chronic disease and poor health outcomes, expanding health coverage can provide an important step in improving health by supporting individuals’ ability to access preventive and primary care and ongoing treatment of health conditions. This brief provides key data on the South and the current status of health and health coverage in the South to provide greater insight into the health needs in the region and the potential coverage gains that may be achieved through the ACA. State specific data for the indicators presented in the brief are available in Tables 1 through 6.
Portrait of the South
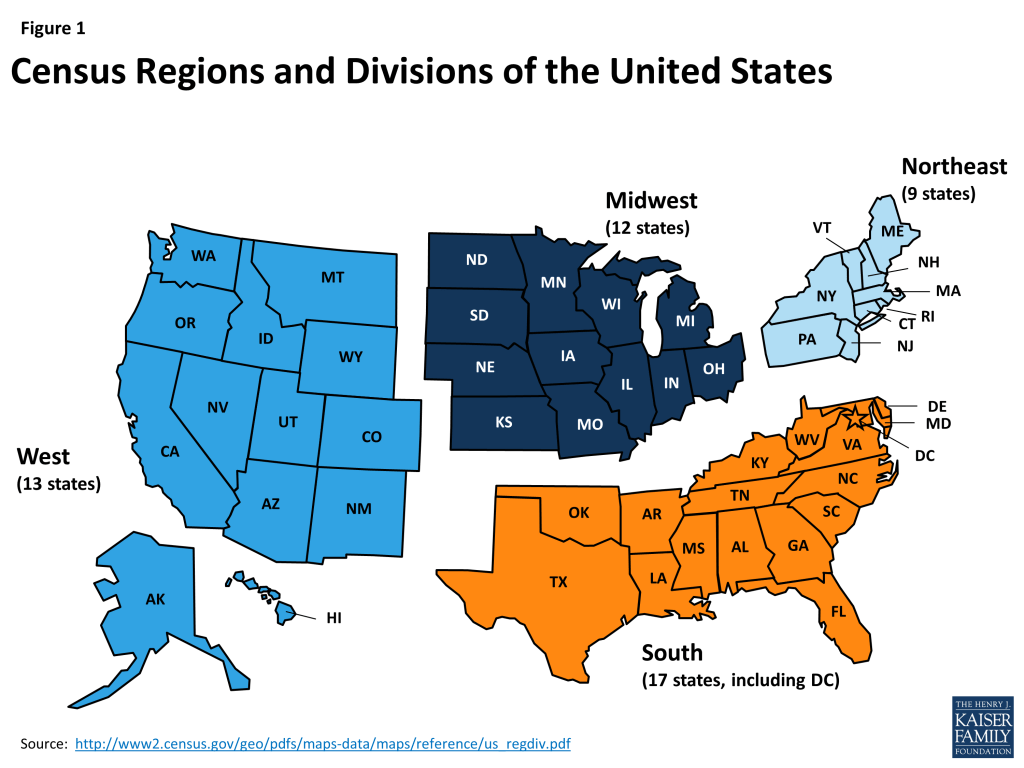
The American South accounts for over one-third of the nation’s population. The South, as defined by the U.S. Census Bureau, includes 17 states, stretching from Oklahoma, Texas, and Arkansas on the West to the Atlantic Ocean on the East, and northward to Delaware, Maryland, Kentucky, and West Virginia (Figure 1). As of 2014, over 118 million individuals lived in the South accounting for more than one-third (37%) of the total U.S. population and the region is growing rapidly.
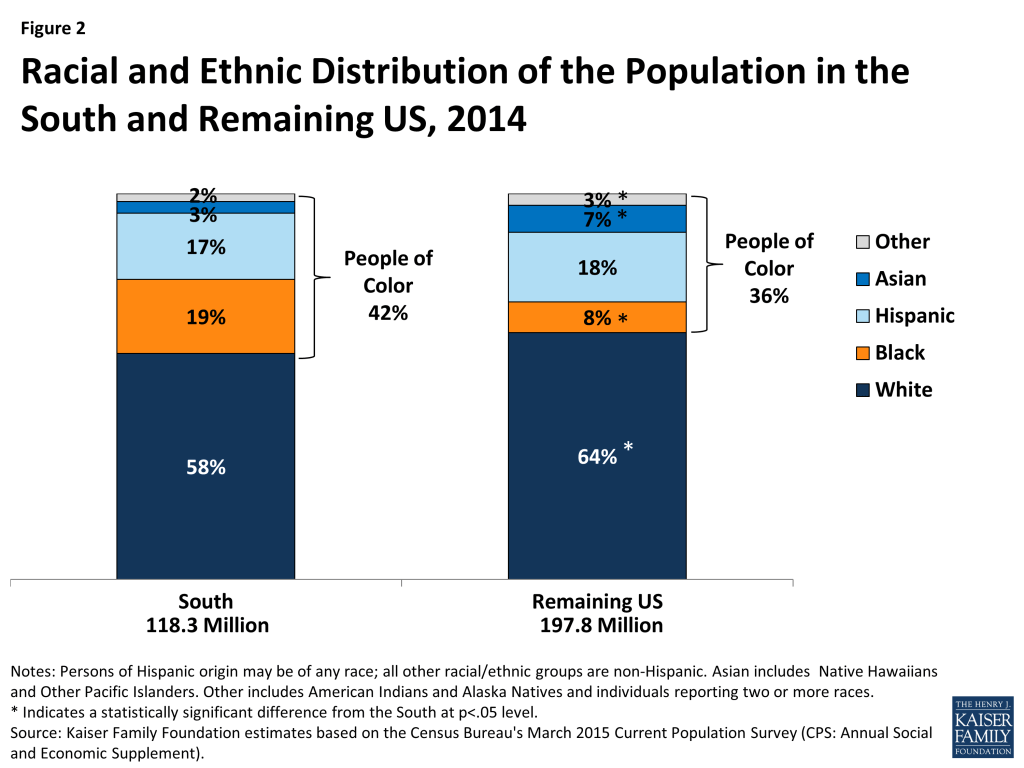
The South is racially and ethnically diverse and home to a large share of the nation’s people of color. People of color make up 42% of the population living in the South compared to 36% in the remaining United States (Figure 2). In particular, Blacks account for a greater share of the Southern population compared to the remaining areas of the United States (19% vs. 8%). Moreover, more than four in ten (41%) of all people of color reside in the South, including nearly six in ten of Blacks (58%).2
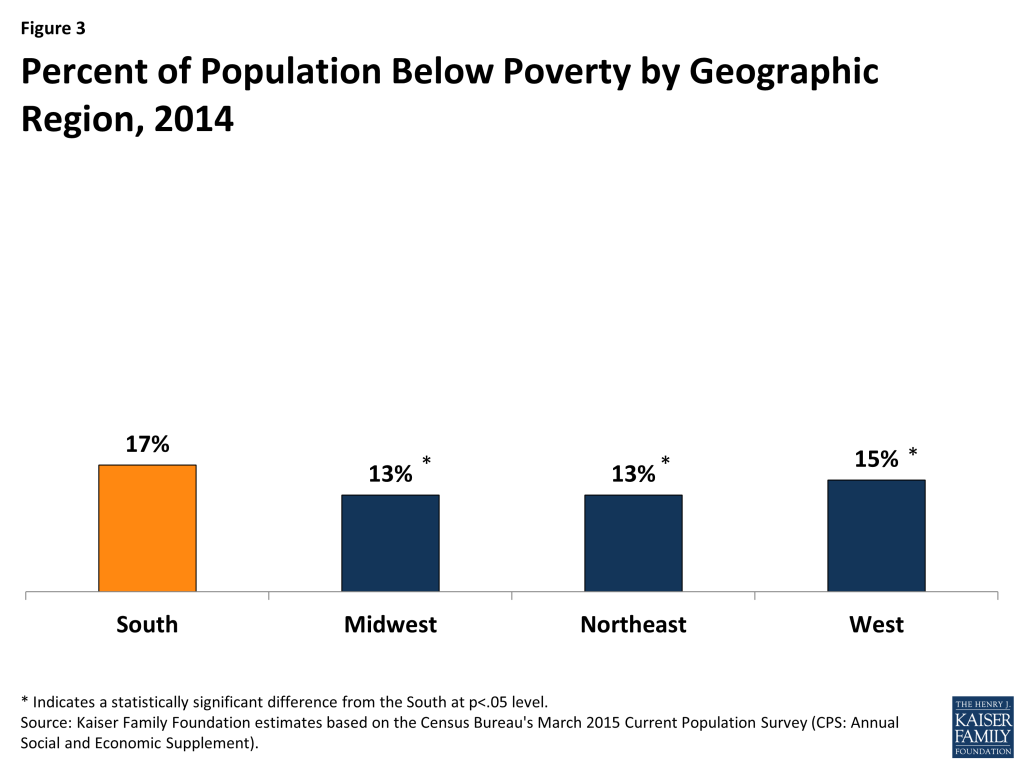
Southerners are more likely than those in each of the other regions to be poor (Figure 3), and the region includes several states that have among the highest poverty rates in the nation. Four states in the South (Kentucky, Louisiana, Mississippi, West Virginia), have at least one in five residents living in poverty.
Health Needs in the South
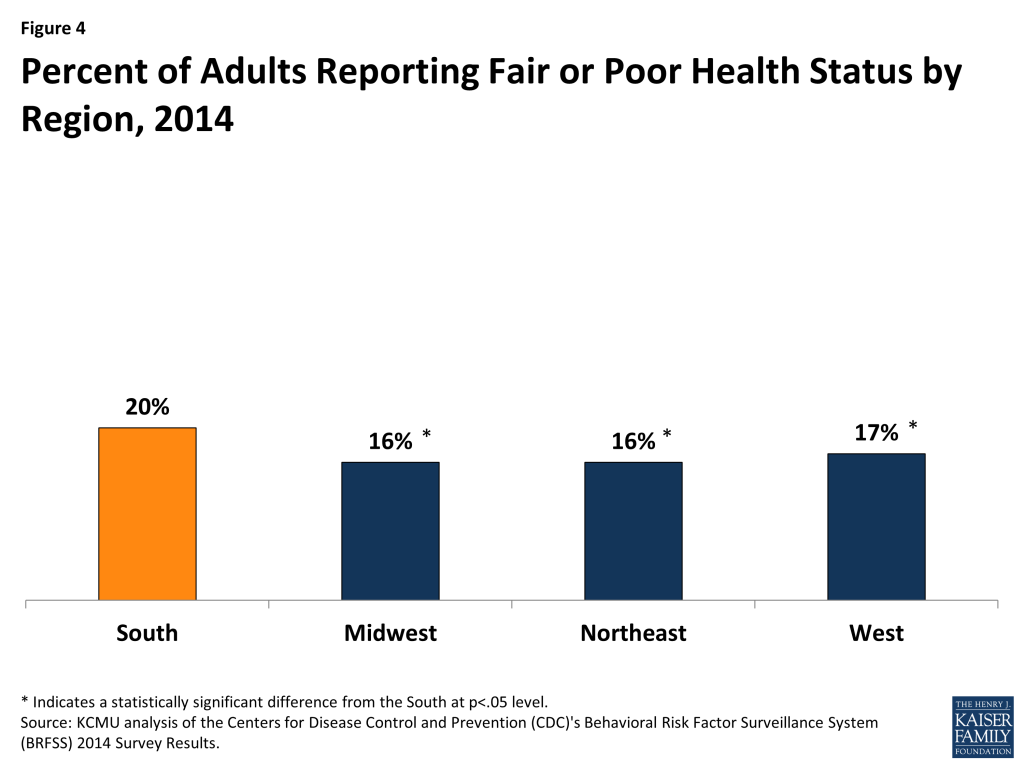
Southerners as a group are generally more likely than those in the rest of the nation to have certain chronic illnesses and to experience worse health outcomes. Overall, one in five (20%) adults living in the South reports fair or poor health status, compared to 16% of adults in the Midwest and Northeast and 17% of adults in the West (Figure 4).
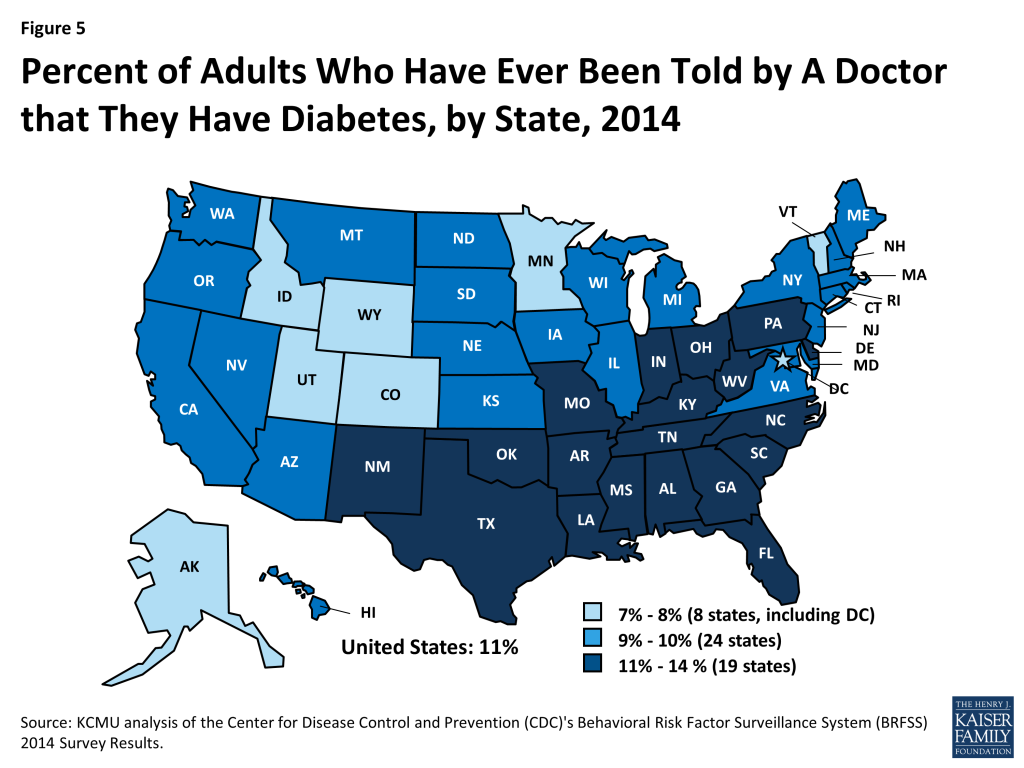
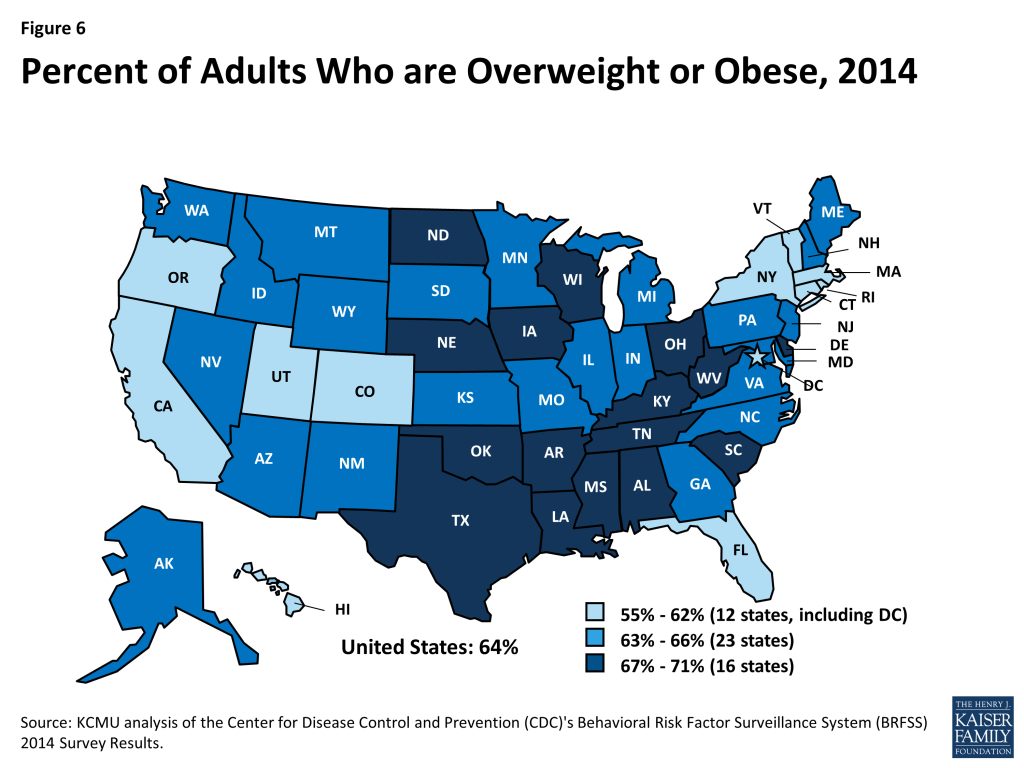
Higher rates of diabetes and obesity for adults are concentrated among Southern states (Figures 5 and 6). The states with the nation’s highest adult diabetes rates are all in the South as are the states with the nation’s highest obesity rates.
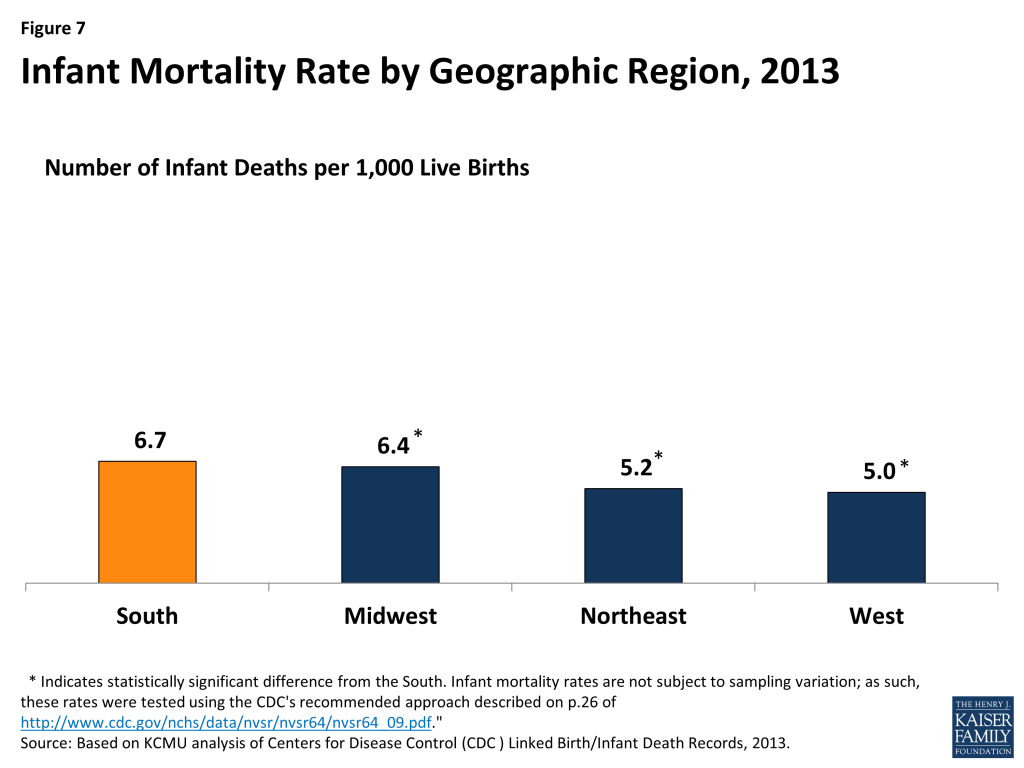
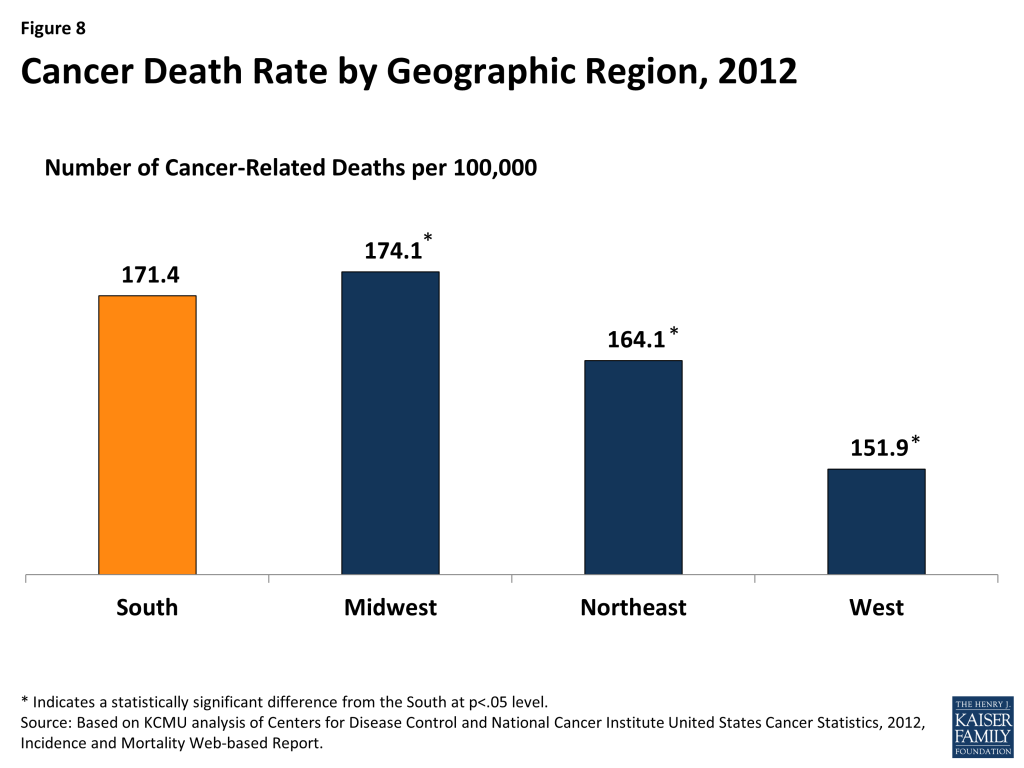
The South also includes the states with the highest infant mortality and cancer death rates. Overall, the infant mortality rate in the South is higher compared to that in the other regions (Figure 7). The South also has a higher rate of cancer-related deaths compared to the Northeast and West (Figure 8).
Health Coverage in the South
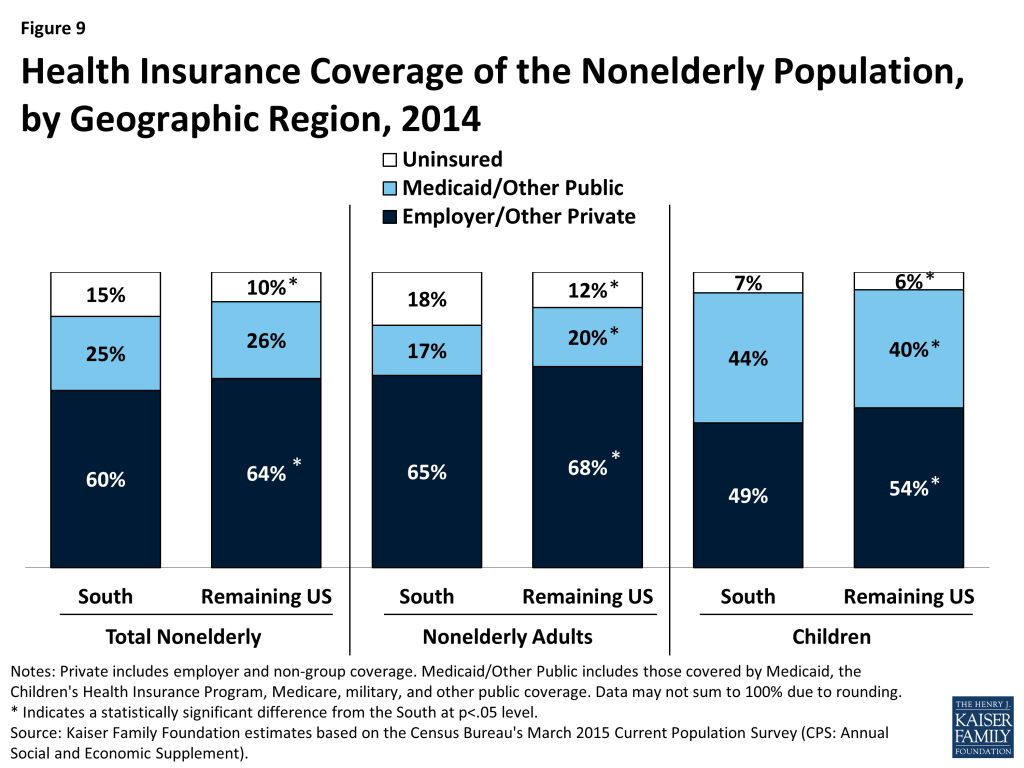
Southerners are more likely to be uninsured compared to individuals living in the rest of the country. Among the total nonelderly population, 15% of individuals in the South are uninsured compared to 10% of individuals in the rest of the country. Uninsured rates are lower for children compared to nonelderly adults, but children and nonelderly adults in the South are still more likely to be uninsured than those in the rest of the country (Figure 9).
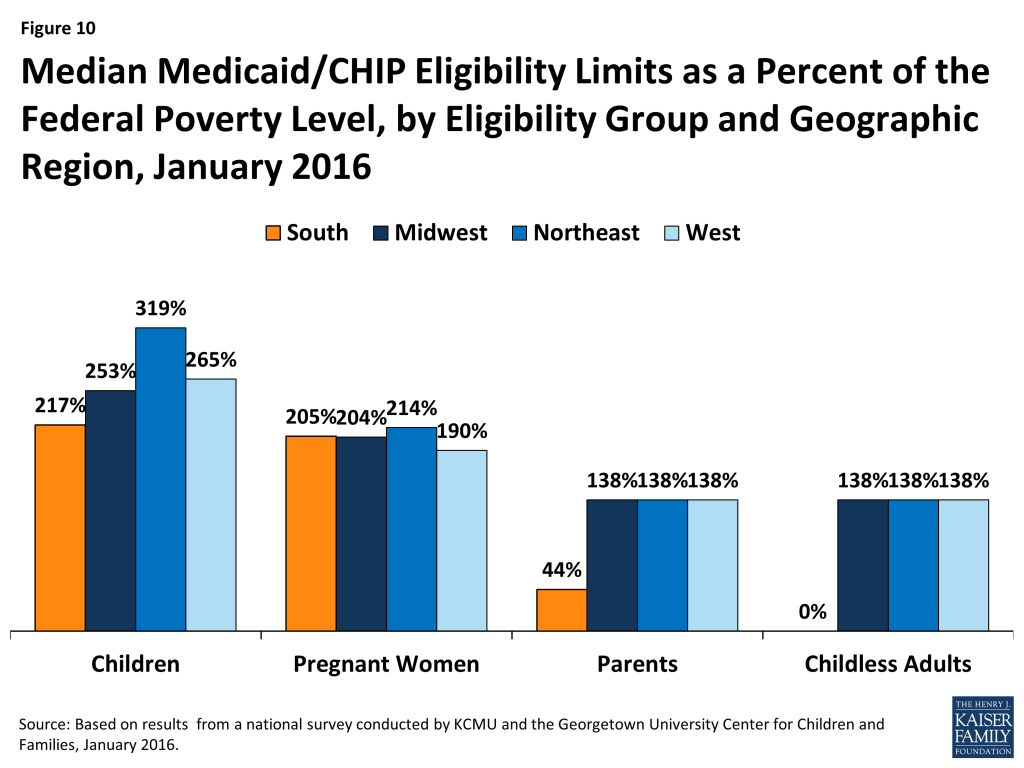
Medicaid and CHIP eligibility levels are more limited in the South compared to other regions. The largest disparities in eligibility levels between the South and other regions are for parents and other adults (Figure 10). This finding reflects the fact that most states in the region have not adopted the ACA Medicaid expansion to adults. As of January 2016, 10 of the 17 states in the South are not moving forward with the Medicaid expansion (Figure 11). In these states, eligibility levels for parents remain low and other adults without dependent children remain ineligible, regardless of their income.
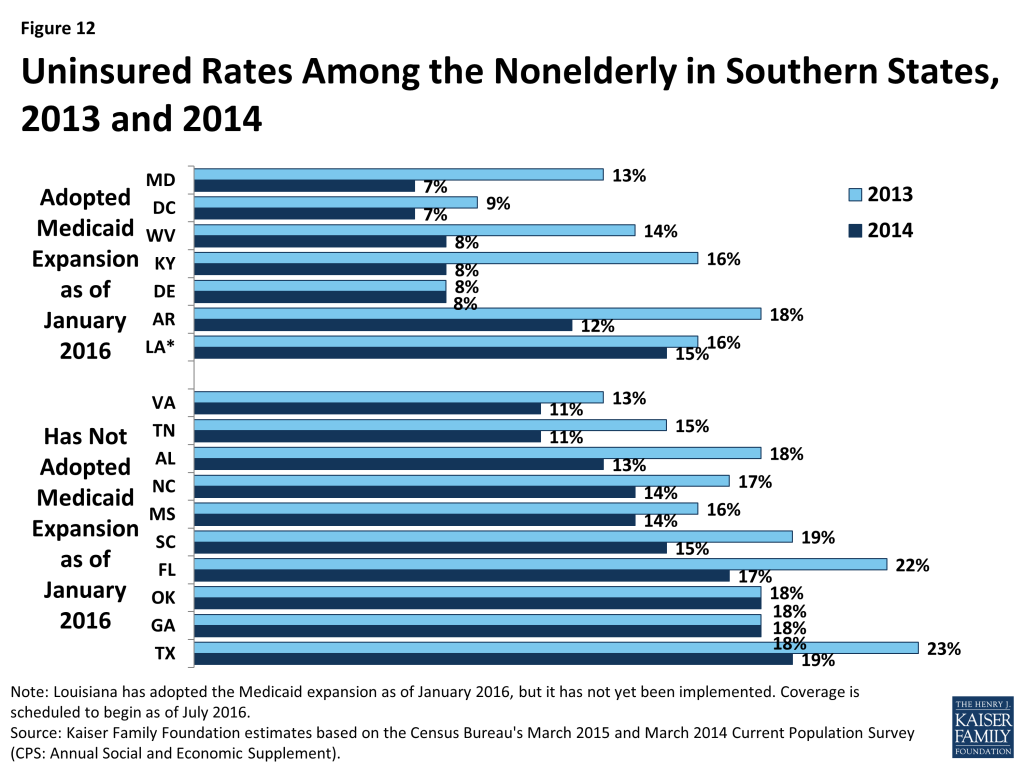
Among Southern states, those that have adopted the Medicaid expansion generally have lower uninsured rates as of 2014 compared to those that have not adopted the expansion. Moreover, those that adopted the expansion generally experienced a larger decline in the uninsured rate between 2013 and 2014, when the ACA was implemented, compared to those that have not adopted the Medicaid expansion (Figure 12). Louisiana has a relatively high uninsured rate compared to other Southern states that have adopted the Medicaid expansion because it has not yet been implemented in the state; the expansion is scheduled to become effective as of July 2016. Delaware and the District of Columbia show little change in the uninsured rate between 2013 and 2014 because they already had Medicaid coverage for adults as of 2013.
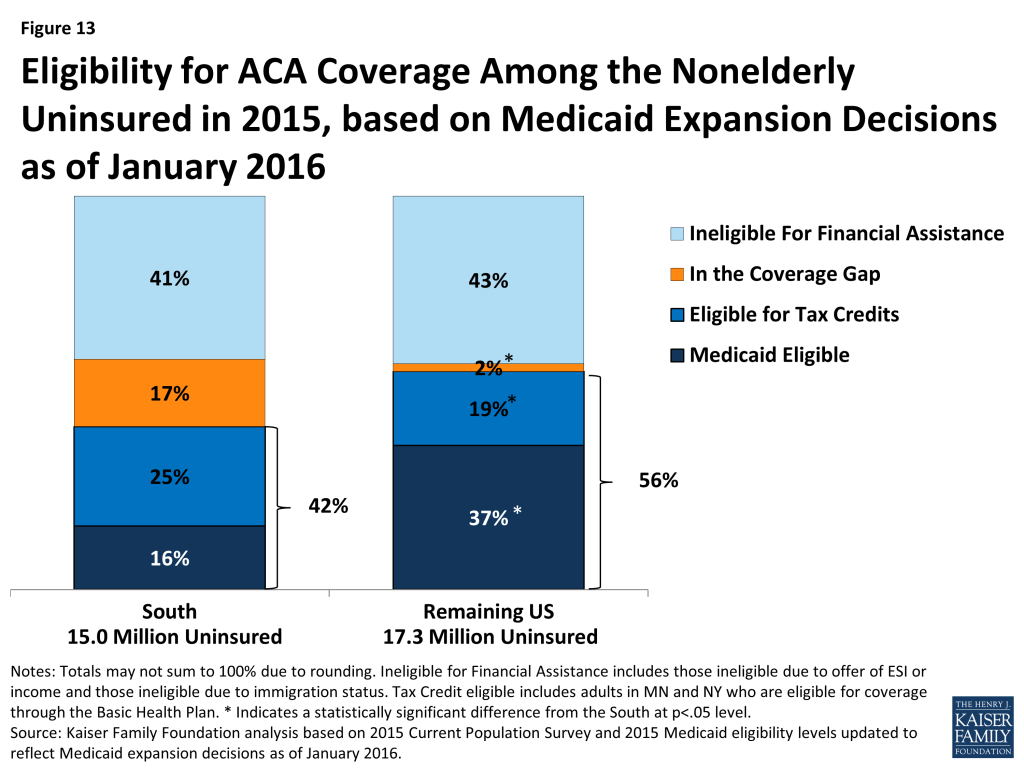
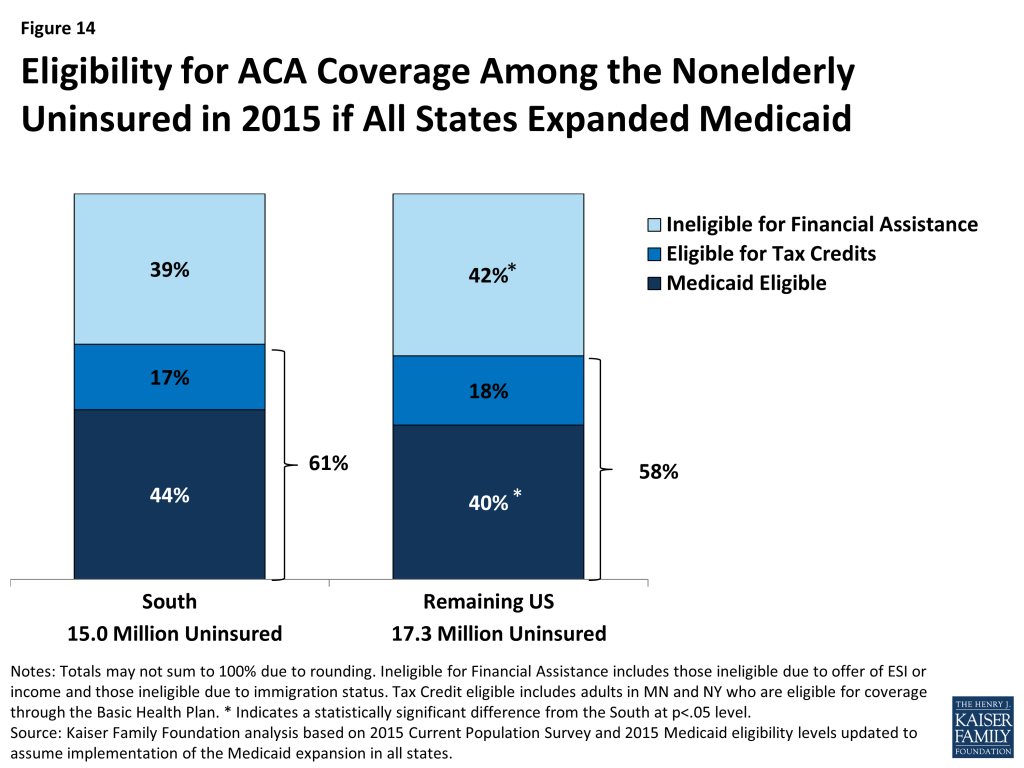
The ACA Medicaid and Marketplace coverage expansions have the potential to extend health coverage to many currently uninsured Southerners. Based on current Medicaid expansion decisions, 42% of uninsured Southerners are eligible for coverage (Figure 13). This includes 16% who are eligible for Medicaid and 25% who are eligible for tax credit subsidies for Marketplace coverage. However, 17% fall into a coverage gap in the Southern states that have not adopted the Medicaid expansion. These are poor adults who earn too much to qualify for Medicaid but not enough to qualify for premium tax credits, which begin at 100% FPL. Because most states not implementing the Medicaid expansion are concentrated in the South, uninsured Southerners are more likely to fall into the coverage gap and less likely to be eligible for Medicaid compared to the uninsured in the rest of the country. If all states were to expand Medicaid, the coverage gap would be eliminated and 61% of uninsured Southerners would be eligible for coverage, with the share eligible for Medicaid increasing from 16% to 44% (Figure 14).
Implications
The South is a vital component of the nation, accounting for over a third of the total population. The region is racially and ethnically diverse and home to a large share of the nation’s people of color. There are significant health needs within the region. Southerners as a group are generally more likely than those in other regions to have a number of chronic illnesses and experience worse health outcomes. While a broad array of factors contributes to the high rates of chronic disease and poor health outcomes in the South, ensuring individuals have health coverage that enables them to access preventive and primary care and ongoing treatment to meet their health needs can be an important step in addressing these disparities. Southerners are more likely to be uninsured compared to the rest of the country. The ACA has the potential to extend health coverage to many uninsured Southerners through the Medicaid and Marketplace coverage expansions. However, in states that do not implement the Medicaid expansion, many poor adults fall into a coverage gap. Despite this coverage gap, millions of uninsured Southerners are eligible for coverage today. Outreach and enrollment efforts will be key for getting these individuals into coverage. If all states were to expand Medicaid, the coverage gap would be eliminated and potential coverage gains in the region would be significantly larger.
Samantha Artiga is with the Kaiser Family Foundation. Anthony Damico is an independent consultant to the Kaiser Family Foundation.
Tables
| Table 1: Racial and Ethnic Distribution and Poverty Rate of Total U.S. Population, 2014 | |||||||
| State | Total Residents | Racial/Ethnic Distribution | Percent With Income Below Poverty | ||||
| White | Black | Hispanic | Asian | Other | |||
| United States | 316,168,000 | 62% | 12% | 18% | 6% | 3% | 15% |
| South | 118,339,000 | 58% | 19% | 17% | 3% | 2% | 17% |
| Alabama | 4,768,000 | 66% | 27% | 4% | 2% | 1% | 18% |
| Arkansas | 2,896,000 | 72% | 16% | 7% | N/A | 3% | 19% |
| Delaware | 929,000 | 63% | 20% | 10% | 4% | 2% | 11% |
| District of Columbia | 657,000 | 37% | 47% | 11% | 4% | 2% | 19% |
| Florida | 19,731,000 | 55% | 16% | 25% | 3% | 1% | 17% |
| Georgia | 9,965,000 | 53% | 31% | 10% | 4% | 2% | 17% |
| Kentucky | 4,316,000 | 84% | 8% | 4% | 3% | 1% | 20% |
| Louisiana | 4,557,000 | 58% | 31% | 6% | 2% | 2% | 23% |
| Maryland | 5,939,000 | 54% | 29% | 8% | 6% | 3% | 10% |
| Mississippi | 2,965,000 | 57% | 37% | 3% | N/A | 1% | 22% |
| North Carolina | 9,836,000 | 62% | 21% | 10% | 3% | N/A | 17% |
| Oklahoma | 3,742,000 | 68% | 7% | 11% | 2% | 12% | 18% |
| South Carolina | 4,764,000 | 64% | 27% | 6% | 1% | 2% | 17% |
| Tennessee | 6,502,000 | 74% | 17% | 6% | 1% | N/A | 17% |
| Texas | 26,687,000 | 44% | 12% | 38% | 4% | 2% | 16% |
| Virginia | 8,259,000 | 63% | 19% | 8% | 7% | 2% | 10% |
| West Virginia | 1,826,000 | 92% | 3% | 1% | N/A | 2% | 21% |
| U.S Excluding South | 197,829,000 | 64%* | 8%* | 18% | 7%* | 3%* | 14%* |
| Midwest | 67,239,000 | 76%* | 10%* | 8%* | 3% | 2% | 13%* |
| Illinois | 12,798,000 | 64% | 13% | 16% | 6% | 1% | 14% |
| Indiana | 6,478,000 | 78% | 9% | 9% | 3% | 1% | 15% |
| Iowa | 3,081,000 | 88% | 3% | 5% | 3% | N/A | 10% |
| Kansas | 2,853,000 | 75% | 6% | 12% | 4% | 3% | 12% |
| Michigan | 9,906,000 | 75% | 14% | 6% | 3% | 2% | 15% |
| Minnesota | 5,419,000 | 79% | 6% | 6% | 5% | 5% | 8% |
| Missouri | 5,961,000 | 81% | 12% | 4% | 1% | 2% | 11% |
| Nebraska | 1,881,000 | 79% | 4% | 11% | 3% | N/A | 12% |
| North Dakota | 733,000 | 88% | 2% | 3% | 2% | 5% | 10% |
| Ohio | 11,536,000 | 80% | 12% | 3% | 2% | 3% | 16% |
| South Dakota | 847,000 | 85% | 2% | 2% | N/A | 10% | 13% |
| Wisconsin | 5,747,000 | 82% | 6% | 8% | 2% | 3% | 11% |
| Northeast | 55,766,000 | 67%* | 11%* | 13%* | 7%* | 2%* | 13%* |
| Connecticut | 3,578,000 | 71% | 9% | 13% | 6% | 1% | 9% |
| Maine | 1,300,000 | 92% | 1% | 1% | 2% | 4% | 15% |
| Massachusetts | 6,658,000 | 72% | 7% | 11% | 8% | 2% | 14% |
| New Hampshire | 1,320,000 | 92% | 1% | 3% | 3% | 1% | 7% |
| New Jersey | 8,939,000 | 58% | 13% | 19% | 9% | 1% | 11% |
| New York | 19,679,000 | 57% | 13% | 18% | 10% | 2% | 14% |
| Pennsylvania | 12,627,000 | 77% | 10% | 7% | 3% | 2% | 13% |
| Rhode Island | 1,048,000 | 77% | 6% | 12% | 4% | 2% | 12% |
| Vermont | 617,000 | 94% | 1% | 1% | 2% | 2% | 10% |
| West | 74,824,000 | 51%* | 4%* | 30%* | 11%* | 4%* | 15%* |
| Alaska | 696,000 | 57% | 2% | 9% | 10% | 22% | 12% |
| Arizona | 6,657,000 | 49% | 4% | 39% | 4% | 5% | 21% |
| California | 38,701,000 | 39% | 5% | 38% | 15% | 3% | 16% |
| Colorado | 5,377,000 | 70% | 4% | 21% | 2% | 3% | 12% |
| Hawaii | 1,365,000 | 19% | 2% | 9% | 53% | 17% | 11% |
| Idaho | 1,610,000 | 82% | 1% | 13% | 1% | 3% | 13% |
| Montana | 1,009,000 | 90% | 1% | 3% | N/A | 5% | 12% |
| Nevada | 2,823,000 | 50% | 9% | 28% | 9% | 5% | 17% |
| New Mexico | 2,035,000 | 40% | 2% | 43% | N/A | 13% | 20% |
| Oregon | 3,962,000 | 76% | 2% | 12% | 6% | 4% | 15% |
| Utah | 2,929,000 | 81% | 1% | 12% | 4% | 2% | 10% |
| Washington | 7,085,000 | 70% | 4% | 13% | 8% | 5% | 12% |
| Wyoming | 572,000 | 86% | 1% | 9% | N/A | 3% | 10% |
| NOTES: Persons of Hispanic origin may be of any race; all other racial/ethnic groups are non-Hispanic. Asian includes Native Hawaiians and Other Pacific Islanders. Other includes American Indians and Alaska Natives and individuals reporting two or more races. Numbers may not sum to 100% due to rounding. *Indicates the region has a statistically significant difference from the South at p<.05 level. Statistical comparisons not included for total United States or for individual states. N/A: Estimates with relative standard errors greater than 30% are not provided.SOURCE: Kaiser Family Foundation estimates based on the Census Bureau’s March 2015 Current Population Survey (CPS: Annual Social and Economic Supplement). | |||||||
| Table 2: Health Status and Selected Health Indicators | |||||
| Selected Health Indicators among Adults | Infant Deaths per 1,000 Live Births | Cancer Death Rate per 100,000 | |||
| Fair/Poor Health Status | Percent Told by A Doctor Have Diabetes | Percent Overweight or Obese | |||
United States | 18% | 11% | 64% | 6.0 | 166.4 |
South | 20% | 11% | 66% | 6.7 | 171.4 |
| Alabama | 23% | 13% | 67% | 8.6 | 184.8 |
| Arkansas | 23% | 13% | 71% | 7.9 | 188.6 |
| Delaware | 16% | 11% | 67% | 6.4 | 176.1 |
| District of Columbia | 13% | 8% | 55% | 6.7 | 178.4 |
| Florida | 19% | 11% | 62% | 6.1 | 157.8 |
| Georgia | 19% | 12% | 66% | 7.0 | 169.6 |
| Kentucky | 24% | 12% | 67% | 6.4 | 201.2 |
| Louisiana | 22% | 11% | 69% | 8.7 | 190.5 |
| Maryland | 14% | 10% | 65% | 6.6 | 166.0 |
| Mississippi | 22% | 13% | 71% | 9.6 | 200.0 |
| North Carolina | 19% | 11% | 66% | 7.0 | 170.5 |
| Oklahoma | 20% | 12% | 68% | 6.7 | 189.6 |
| South Carolina | 20% | 12% | 67% | 6.9 | 179.0 |
| Tennessee | 24% | 13% | 67% | 6.8 | 187.9 |
| Texas | 19% | 11% | 68% | 5.8 | 160.6 |
| Virginia | 17% | 10% | 65% | 6.2 | 165.3 |
| West Virginia | 26% | 14% | 70% | 7.6 | 191.1 |
| U.S Excluding South | 17%* | 10%* | 63%* | 5.5* | 163.4* |
| Midwest | 16%* | 10%* | 66% | 6.4* | 174.1* |
| Illinois | 17% | 10% | 64% | 6.0 | 175.5 |
| Indiana | 19% | 11% | 66% | 7.2 | 184.2 |
| Iowa | 14% | 9% | 67% | 4.3 | 167.9 |
| Kansas | 15% | 10% | 66% | 6.5 | 167.7 |
| Michigan | 17% | 10% | 66% | 7.1 | 174.3 |
| Minnesota | 12% | 8% | 64% | 5.1 | 155.6 |
| Missouri | 17% | 11% | 66% | 6.5 | 182.0 |
| Nebraska | 13% | 9% | 67% | 5.2 | 164.6 |
| North Dakota | 14% | 9% | 69% | 6.0 | 150.7 |
| Ohio | 18% | 12% | 67% | 7.3 | 182.1 |
| South Dakota | 14% | 9% | 65% | 6.5 | 162.0 |
| Wisconsin | 16% | 9% | 67% | 6.3 | 166.1 |
| Northeast | 16%* | 10%* | 62%* | 5.2* | 164.1* |
| Connecticut | 14% | 9% | 60% | 4.8 | 152.0 |
| Maine | 15% | 9% | 64% | 7.1 | 179.0 |
| Massachusetts | 14% | 10% | 59% | 4.2 | 163.3 |
| New Hampshire | 14% | 9% | 64% | 5.6 | 167.7 |
| New Jersey | 17% | 10% | 63% | 4.5 | 160.3 |
| New York | 17% | 10% | 61% | 4.9 | 159.5 |
| Pennsylvania | 17% | 11% | 64% | 6.7 | 174.8 |
| Rhode Island | 15% | 9% | 62% | 6.5 | 163.6 |
| Vermont | 12% | 8% | 60% | 4.4 | 164.8 |
| West | 17%* | 10%* | 61%* | 5.0* | 151.9* |
| Alaska | 13% | 7% | 65% | 5.8 | 169.0 |
| Arizona | 19% | 10% | 64% | 5.3 | 148.3 |
| California | 18% | 10% | 60% | 4.8 | 151.0 |
| Colorado | 13% | 7% | 57% | 5.1 | 143.7 |
| Hawaii | 15% | 10% | 58% | 6.4 | 134.6 |
| Idaho | 13% | 8% | 66% | 5.6 | 152.0 |
| Montana | 15% | 9% | 63% | 5.6 | 154.2 |
| Nevada | 18% | 10% | 64% | 5.3 | 163.8 |
| New Mexico | 21% | 12% | 65% | 5.3 | 148.0 |
| Oregon | 16% | 9% | 62% | 4.9 | 168.3 |
| Utah | 12% | 7% | 60% | 5.2 | 128.7 |
| Washington | 16% | 9% | 63% | 4.5 | 161.8 |
| Wyoming | 14% | 8% | 65% | 4.8 | 154.6 |
| NOTES: *Indicates the region has a statistically significant difference from the South at p<.05 level. Infant mortality rates are not subject to sampling variation; as such, these rates were tested using the CDC’s recommended approach described on p.26 of http://www.cdc.gov/nchs/data/nvsr/nvsr64/nvsr64_09.pdf. Statistical comparisons not included for total United States or for individual states.SOURCES: KCMU analysis of the Centers for Disease Control and Prevention (CDC)’s Behavioral Risk Factor Surveillance System (BRFSS) 2014 Survey Results. Infant mortality rates based on KCMU analysis of CDC Linked Birth/Infant Death Records, 2013. Cancer-related deaths based on KCMU analysis of CDC and National Cancer Institute United States Cancer Statistics, 2012, Incidence and Mortality Web-based Report. | |||||
| Table 3: Health Insurance Coverage of the Nonelderly, 2014 | |||||||||
| Total Nonelderly (0-64) | Nonelderly Adults (19-64) | Children | |||||||
| Private | Medicaid/Other Public | Uninsured | Private | Medicaid/Other Public | Uninsured | Private | Medicaid/Other Public | Uninsured | |
| United States | 62% | 26% | 12% | 67% | 19% | 14% | 52% | 41% | 6% |
| South | 60% | 25% | 15% | 65% | 17% | 18% | 49% | 44% | 7% |
| Alabama | 60% | 27% | 13% | 65% | 19% | 16% | 48% | 46% | 5% |
| Arkansas | 57% | 31% | 12% | 63% | 22% | 15% | 44% | 52% | 4% |
| Delaware | 66% | 26% | 8% | 68% | 23% | 9% | 60% | 34% | 6% |
| District of Columbia | 65% | 28% | 7% | 70% | 22% | 8% | 47% | 50% | 4% |
| Florida | 56% | 27% | 17% | 60% | 19% | 20% | 44% | 48% | 8% |
| Georgia | 59% | 24% | 18% | 63% | 15% | 22% | 48% | 43% | 8% |
| Kentucky | 60% | 32% | 8% | 64% | 26% | 9% | 50% | 45% | 5% |
| Louisiana | 56% | 29% | 15% | 63% | 18% | 19% | 41% | 56% | 3% |
| Maryland | 74% | 20% | 7% | 76% | 16% | 8% | 68% | 30% | 2% |
| Mississippi | 51% | 35% | 14% | 58% | 25% | 18% | 35% | 61% | 5% |
| North Carolina | 61% | 26% | 14% | 66% | 18% | 16% | 49% | 43% | 8% |
| Oklahoma | 58% | 24% | 18% | 63% | 17% | 20% | 46% | 40% | 14% |
| South Carolina | 58% | 27% | 15% | 61% | 21% | 18% | 49% | 44% | 7% |
| Tennessee | 64% | 25% | 11% | 69% | 18% | 13% | 53% | 42% | 6% |
| Texas | 59% | 23% | 19% | 64% | 13% | 23% | 47% | 44% | 9% |
| Virginia | 69% | 19% | 11% | 72% | 15% | 13% | 63% | 30% | 6% |
| West Virginia | 55% | 37% | 8% | 59% | 32% | 9% | 43% | 54% | N/A |
| U.S Excluding South | 64%* | 26% | 10%* | 68%* | 20%* | 12%* | 54%* | 40%* | 6%* |
| Midwest | 67%* | 23%* | 10%* | 71%* | 18% | 11%* | 58%* | 37%* | 5%* |
| Illinois | 65% | 24% | 10% | 69% | 18% | 13% | 57% | 39% | 4% |
| Indiana | 65% | 23% | 12% | 69% | 17% | 15% | 56% | 37% | 7% |
| Iowa | 71% | 22% | 7% | 77% | 15% | 8% | 58% | 37% | N/A |
| Kansas | 66% | 22% | 12% | 71% | 15% | 15% | 56% | 38% | 7% |
| Michigan | 66% | 26% | 8% | 69% | 21% | 10% | 58% | 39% | 3% |
| Minnesota | 74% | 19% | 8% | 76% | 16% | 8% | 68% | 26% | 7% |
| Missouri | 69% | 21% | 10% | 72% | 15% | 13% | 62% | 33% | 5% |
| Nebraska | 68% | 21% | 11% | 73% | 13% | 14% | 57% | 39% | 4% |
| North Dakota | 76% | 14% | 10% | 78% | 10% | 11% | 70% | 24% | N/A |
| Ohio | 63% | 29% | 9% | 68% | 22% | 10% | 50% | 46% | 4% |
| South Dakota | 71% | 18% | 11% | 75% | 12% | 13% | 62% | 31% | 7% |
| Wisconsin | 71% | 21% | 8% | 74% | 16% | 10% | 61% | 34% | 4% |
| Northeast | 66%* | 25% | 9%* | 70%* | 20%* | 11%* | 56%* | 39%* | 5%* |
| Connecticut | 72% | 20% | 8% | 75% | 15% | 10% | 67% | 31% | 3% |
| Maine | 62% | 26% | 11% | 66% | 21% | 13% | 53% | 42% | N/A |
| Massachusetts | 67% | 28% | 5% | 70% | 25% | 5% | 58% | 37% | 4% |
| New Hampshire | 75% | 17% | 8% | 78% | 12% | 10% | 64% | 32% | 4% |
| New Jersey | 66% | 22% | 12% | 68% | 17% | 14% | 60% | 34% | 6% |
| New York | 62% | 29% | 9% | 66% | 23% | 10% | 51% | 44% | 5% |
| Pennsylvania | 69% | 22% | 9% | 74% | 15% | 11% | 55% | 40% | 5% |
| Rhode Island | 71% | 22% | 6% | 76% | 17% | 7% | 59% | 38% | 3% |
| Vermont | 68% | 26% | 7% | 72% | 21% | 8% | 55% | 42% | N/A |
| West | 60% | 28%* | 12%* | 64% | 22%* | 14%* | 51%* | 43% | 7% |
| Alaska | 58% | 26% | 16% | 62% | 20% | 18% | 48% | 41% | 12% |
| Arizona | 55% | 31% | 14% | 59% | 25% | 16% | 45% | 45% | 10% |
| California | 59% | 30% | 11% | 63% | 23% | 14% | 49% | 45% | 5% |
| Colorado | 60% | 27% | 13% | 64% | 22% | 15% | 51% | 40% | 9% |
| Hawaii | 65% | 29% | 6% | 70% | 22% | 7% | 53% | 44% | 3% |
| Idaho | 66% | 22% | 12% | 72% | 14% | 14% | 56% | 37% | 7% |
| Montana | 64% | 21% | 15% | 68% | 15% | 17% | 56% | 36% | 8% |
| Nevada | 59% | 27% | 14% | 63% | 21% | 16% | 48% | 41% | 11% |
| New Mexico | 49% | 38% | 14% | 54% | 30% | 16% | 37% | 55% | 8% |
| Oregon | 63% | 27% | 9% | 66% | 23% | 12% | 57% | 39% | 4% |
| Utah | 73% | 14% | 13% | 75% | 10% | 15% | 71% | 19% | 10% |
| Washington | 62% | 28% | 10% | 67% | 21% | 12% | 51% | 44% | 5% |
| Wyoming | 75% | 14% | 11% | 76% | 10% | 13% | 70% | 24% | 6% |
| NOTES: Private includes employer and non-group coverage. Medicaid/Other Public includes those covered by Medicaid, the Children’s Health Insurance Program, Medicare, military and other public coverage. Data may not sum to 100% due to rounding. *Indicates the region has a statistically significant difference from the South at p<.05 level. Statistical comparisons not included for total United States or for individual states. N/A: Estimates with relative standard errors greater than 30% are not provided.SOURCE: Kaiser Family Foundation estimates based on the Census Bureau’s March 2015 Current Population Survey (CPS: Annual Social and Economic Supplement). | |||||||||
| Table 4: Medicaid/CHIP Eligibility Limits as a Percent of the Federal Poverty Level, January 2016 | ||||
State | Upper Limit for Children | Upper Limit for Pregnant Women | Parents | Childless Adults |
United States Median | 255% | 205% | 138% | 138% |
South Median | 217% | 205% | 44% | 0% |
| Alabama | 317% | 146% | 18% | 0% |
| Arkansas | 216% | 214% | 138% | 138% |
| Delaware | 217% | 217% | 138% | 138% |
| District of Columbia | 324% | 324% | 221% | 215% |
| Florida | 215% | 196% | 34% | 0% |
| Georgia | 252% | 225% | 37% | 0% |
| Kentucky | 218% | 200% | 138% | 138% |
| Louisiana* | 255% | 214% | 24% | 0% |
| Maryland | 322% | 264% | 138% | 138% |
| Mississippi | 214% | 199% | 27% | 0% |
| North Carolina | 216% | 201% | 44% | 0% |
| Oklahoma | 210% | 190% | 44% | 0% |
| South Carolina | 213% | 199% | 67% | 0% |
| Tennessee | 255% | 255% | 101% | 0% |
| Texas | 206% | 207% | 18% | 0% |
| Virginia | 205% | 205% | 39% | 0% |
| West Virginia | 305% | 163% | 138% | 138% |
U.S. Excluding South Median | 266% | 205% | 138% | 138% |
Midwest Median | 253% | 204% | 138% | 138% |
| Illinois | 318% | 213% | 138% | 138% |
| Indiana | 263% | 218% | 139% | 139% |
| Iowa | 380% | 380% | 138% | 138% |
| Kansas | 244% | 171% | 38% | 0% |
| Michigan | 217% | 200% | 138% | 138% |
| Minnesota | 288% | 283% | 138% | 138% |
| Missouri | 305% | 201% | 22% | 0% |
| Nebraska | 218% | 202% | 63% | 0% |
| North Dakota | 175% | 152% | 138% | 138% |
| Ohio | 211% | 205% | 138% | 138% |
| South Dakota | 209% | 138% | 52% | 0% |
| Wisconsin | 306% | 306% | 100% | 100% |
Northeast Median | 319% | 214% | 138% | 138% |
| Connecticut | 323% | 263% | 155% | 138% |
| Maine | 213% | 214% | 105% | 0% |
| Massachusetts | 305% | 205% | 138% | 138% |
| New Hampshire | 323% | 201% | 138% | 138% |
| New Jersey | 355% | 205% | 138% | 138% |
| New York | 405% | 223% | 138% | 138% |
| Pennsylvania | 319% | 220% | 138% | 138% |
| Rhode Island | 266% | 258% | 138% | 138% |
| Vermont | 317% | 213% | 138% | 138% |
West Median | 265% | 190% | 138% | 138% |
| Alaska | 208% | 205% | 143% | 138% |
| Arizona | 152% | 161% | 138% | 138% |
| California | 266% | 322% | 138% | 138% |
| Colorado | 265% | 265% | 138% | 138% |
| Hawaii | 313% | 196% | 138% | 138% |
| Idaho | 190% | 138% | 26% | 0% |
| Montana | 266% | 162% | 138% | 138% |
| Nevada | 205% | 165% | 138% | 138% |
| New Mexico | 305% | 255% | 138% | 138% |
| Oregon | 305% | 190% | 138% | 138% |
| Utah | 205% | 144% | 45% | 0% |
| Washington | 317% | 198% | 138% | 138% |
| Wyoming | 205% | 159% | 57% | 0% |
| NOTE: *Louisiana has adopted the Medicaid expansion for adults, but coverage is not yet in effect. When coverage becomes effective July 2016, eligibility levels for parents and other adults will be 138% FPL.SOURCE: Based on results from a national survey conducted by KCMU and the Georgetown University Center for Children and Families, January 2016. | ||||
| Table 5: Eligibility for ACA Coverage Among the Nonelderly Uninsured in 2015 based on Medicaid Expansion Decisions as of January 2016 | |||||||||
State | Total Uninsured | Medicaid Eligible | Eligible for Tax Credits | Ineligible for Financial Assistance Due to Offer of ESI, Income, or Citizenship | In the Coverage Gap | ||||
United States | 32,339,000 | 8,850,000 | 27% | 7,022,000 | 22% | 13,572,000 | 42% | 2,895,000 | 9% |
South | 15,050,000 | 2,450,000 | 16% | 3,823,000 | 25% | 6,186,000 | 41% | 2,591,000 | 17% |
| Alabama | 513,000 | 75,000 | 15% | 160,000 | 31% | 139,000 | 27% | 139,000 | 27% |
| Arkansas | 285,000 | 127,000 | 44% | 60,000 | 21% | 98,000 | 34% | – | – |
| Delaware | 63,000 | 22,000 | 35% | 15,000 | 24% | 25,000 | 40% | – | – |
| District of Columbia | 42,000 | 20,000 | 48% | N/A | N/A | 19,000 | 45% | – | – |
| Florida | 2,788,000 | 306,000 | 11% | 825,000 | 30% | 1,091,000 | 39% | 567,000 | 20% |
| Georgia | 1,524,000 | 201,000 | 13% | 406,000 | 27% | 612,000 | 40% | 305,000 | 20% |
| Kentucky | 285,000 | 121,000 | 43% | N/A | N/A | 119,000 | 42% | 49,000 | 17% |
| Louisiana+ | 582,000 | 311,000 | 53% | 117,000 | 20% | 154,000 | 26% | – | – |
| Maryland | 336,000 | 133,000 | 40% | 43,000 | 13% | 160,000 | 48% | – | – |
| Mississippi | 359,000 | 42,000 | 12% | 104,000 | 29% | 106,000 | 29% | 108,000 | 30% |
| North Carolina | 1,138,000 | 152,000 | 13% | 289,000 | 25% | 452,000 | 40% | 244,000 | 21% |
| Oklahoma | 581,000 | 109,000 | 19% | 144,000 | 25% | 236,000 | 41% | 91,000 | 16% |
| South Carolina | 604,000 | 100,000 | 17% | 186,000 | 31% | 195,000 | 32% | 123,000 | 20% |
| Tennessee | 605,000 | 104,000 | 17% | 127,000 | 21% | 257,000 | 42% | 118,000 | 19% |
| Texas | 4,425,000 | 493,000 | 11% | 1,035,000 | 23% | 2,132,000 | 48% | 766,000 | 17% |
| Virginia | 804,000 | 77,000 | 10% | 235,000 | 29% | 361,000 | 45% | 131,000 | 16% |
| West Virginia | 116,000 | 56,000 | 48% | 31,000 | 27% | 29,000 | 25% | – | – |
| U.S. Excluding South | 17,289,000 | 6,400,000 | 37%* | 3,199,000 | 19%* | 7,386,000 | 43% | 304,000 | 2%* |
| Midwest | 5,427,000 | 1,916,000 | 35%* | 1,103,000 | 20%* | 2,209,000 | 41% | 198,000 | 4%* |
| Illinois | 1,122,000 | 397,000 | 35% | 166,000 | 15% | 559,000 | 50% | – | – |
| Indiana | 686,000 | 310,000 | 45% | 128,000 | 19% | 248,000 | 36% | – | – |
| Iowa | 188,000 | 88,000 | 47% | 30,000 | 16% | 71,000 | 38% | – | – |
| Kansas | 302,000 | 38,000 | 13% | 83,000 | 28% | 131,000 | 43% | – | – |
| Michigan | 685,000 | 320,000 | 47% | 147,000 | 21% | 218,000 | 32% | – | – |
| Minnesota^ | 364,000 | 126,000 | 35% | 45,000 | 12% | 193,000 | 53% | – | – |
| Missouri | 516,000 | 52,000 | 10% | 156,000 | 30% | 198,000 | 38% | 109,000 | 21% |
| Nebraska | 178,000 | 16,000 | 9% | 46,000 | 26% | 90,000 | 50% | 27,000 | 15% |
| North Dakota | 64,000 | 24,000 | 37% | 16,000 | 25% | 24,000 | 38% | – | – |
| Ohio | 834,000 | 404,000 | 48% | 165,000 | 20% | 264,000 | 32% | – | – |
| South Dakota | 77,000 | 12,000 | 16% | 22,000 | 29% | 30,000 | 39% | 13,000 | 17% |
| Wisconsin | 410,000 | 129,000 | 32% | 100,000 | 24% | 181,000 | 44% | & | & |
| Northeast | 4,249,000 | 1,612,000 | 38%* | 818,000 | 19%* | 1,795,000 | 42% | 24,000 | 1%* |
| Connecticut | 247,000 | 69,000 | 28% | 62,000 | 25% | 116,000 | 47% | – | – |
| Maine | 121,000 | 18,000 | 15% | 40,000 | 33% | 39,000 | 32% | 24,000 | 20% |
| Massachusetts | 288,000 | 93,000 | 32% | N/A | N/A | 147,000 | 51% | – | – |
| New Hampshire | 94,000 | 37,000 | 39% | 17,000 | 18% | 41,000 | 43% | – | – |
| New Jersey | 940,000 | 335,000 | 36% | 131,000 | 14% | 473,000 | 50% | – | – |
| New York^ | 1,476,000 | 548,000 | 37% | 317,000 | 21% | 611,000 | 41% | – | – |
| Pennsylvania | 994,000 | 477,000 | 48% | 180,000 | 18% | 338,000 | 34% | – | – |
| Rhode Island | 55,000 | 27,000 | 49% | 13,000 | 23% | 15,000 | 27% | – | – |
| Vermont | 34,000 | 8,000 | 24% | 11,000 | 33% | 15,000 | 43% | – | – |
| West | 7,613,000 | 2,872,000 | 38%* | 1,277,000 | 17%* | 3,382,000 | 44%* | 81,000 | 1%* |
| Alaska | 100,000 | 51,000 | 51% | 20,000 | 20% | 29,000 | 29% | – | – |
| Arizona | 808,000 | 368,000 | 46% | 100,000 | 12% | 341,000 | 42% | – | – |
| California | 3,845,000 | 1,428,000 | 37% | 623,000 | 16% | 1,795,000 | 47% | – | – |
| Colorado | 593,000 | 223,000 | 38% | 104,000 | 18% | 266,000 | 45% | – | – |
| Hawaii | 70,000 | 35,000 | 50% | N/A | N/A | 28,000 | 39% | – | – |
| Idaho | 166,000 | 21,000 | 13% | 43,000 | 26% | 72,000 | 44% | 30,000 | 18% |
| Montana | 126,000 | 59,000 | 47% | 27,000 | 22% | 40,000 | 32% | – | – |
| Nevada | 350,000 | 147,000 | 42% | 61,000 | 17% | 143,000 | 41% | – | – |
| New Mexico | 233,000 | 109,000 | 47% | 31,000 | 13% | 94,000 | 40% | – | – |
| Oregon | 307,000 | 122,000 | 40% | N/A | N/A | 150,000 | 49% | – | – |
| Utah | 337,000 | 66,000 | 20% | 92,000 | 27% | 138,000 | 41% | 41,000 | 12% |
| Washington | 621,000 | 238,000 | 38% | 116,000 | 19% | 267,000 | 43% | – | – |
| Wyoming | 56,000 | 6,000 | 11% | 19,000 | 34% | 20,000 | 36% | 11,000 | 19% |
| NOTES: Numbers may not sum to 100% due to rounding. N/A indiciates estimates do not meet minimum standards for statistical reliability. *Indicates the region has a statistically significant difference from the South at p<.05 level. Statistical comparisons not included for total United States or for individual states. +LA’s Governor has adopted the Medicaid expansion but coverage is not yet in effect. For this analysis, LA is considered an expansion state. ^Tax credit-eligible population in Minnesota and New York include uninsured adults who are eligible for coverage through the Basic Health Plan. & Wisconsin covers adults up to 100% FPL in Medicaid under a waiver but did not adopt the ACA expansion.SOURCE: Kaiser Family Foundation analysis based on 2015 Current Population Survey data and 2015 Medicaid eligibility levels updated to reflect state Medicaid expansion decisions as of January 2016. | |||||||||
| Table 6: Eligibility for Coverage Among the Nonelderly Uninsured in 2015 if All States Expanded Medicaid | |||||||
| State | Total Uninsured | Medicaid Eligible | Eligible for Tax Credits | Ineligible for Financial Assistance Due to Offer of ESI, Income, or Citizenship | |||
| United States | 32,339,000 | 13,542,000 | 42% | 5,628,000 | 17% | 13,169,000 | 41% |
| South | 15,050,000 | 6,615,000 | 44% | 2,602,000 | 17% | 5,832,000 | 39% |
| Alabama | 513,000 | 296,000 | 58% | 95,000 | 18% | 123,000 | 24% |
| Arkansas | 285,000 | 127,000 | 44% | 60,000 | 21% | 98,000 | 34% |
| Delaware | 63,000 | 22,000 | 35% | 15,000 | 24% | 25,000 | 40% |
| District of Columbia | 42,000 | 20,000 | 48% | N/A | N/A | 19,000 | 45% |
| Florida | 2,788,000 | 1,179,000 | 42% | 580,000 | 21% | 1,030,000 | 37% |
| Georgia | 1,524,000 | 675,000 | 44% | 284,000 | 19% | 564,000 | 37% |
| Kentucky | 285,000 | 121,000 | 43% | N/A | N/A | 119,000 | 42% |
| Louisiana | 582,000 | 311,000 | 53% | 117,000 | 20% | 154,000 | 26% |
| Maryland | 336,000 | 133,000 | 40% | 43,000 | 13% | 160,000 | 48% |
| Mississippi | 359,000 | 199,000 | 55% | 64,000 | 18% | 96,000 | 27% |
| North Carolina | 1,138,000 | 583,000 | 51% | 140,000 | 12% | 414,000 | 36% |
| Oklahoma | 581,000 | 260,000 | 45% | 98,000 | 17% | 223,000 | 38% |
| South Carolina | 604,000 | 289,000 | 48% | 133,000 | 22% | 182,000 | 30% |
| Tennessee | 605,000 | 290,000 | 48% | 76,000 | 13% | 239,000 | 40% |
| Texas | 4,425,000 | 1,727,000 | 39% | 677,000 | 15% | 2,022,000 | 46% |
| Virginia | 804,000 | 328,000 | 41% | 143,000 | 18% | 334,000 | 41% |
| West Virginia | 116,000 | 56,000 | 48% | 31,000 | 27% | 29,000 | 25% |
| U.S. Excluding South | 17,289,000 | 6,926,000 | 40%* | 3,026,000 | 18% | 7,337,000 | 42%* |
| Midwest | 5,427,000 | 2,261,000 | 42% | 987,000 | 18% | 2,179,000 | 40% |
| Illinois | 1,122,000 | 397,000 | 35% | 166,000 | 15% | 559,000 | 50% |
| Indiana | 686,000 | 310,000 | 45% | 128,000 | 19% | 248,000 | 36% |
| Iowa | 188,000 | 88,000 | 47% | 30,000 | 16% | 71,000 | 38% |
| Kansas | 302,000 | 134,000 | 44% | 43,000 | 14% | 125,000 | 41% |
| Michigan | 685,000 | 320,000 | 47% | 147,000 | 21% | 218,000 | 32% |
| Minnesota^ | 364,000 | 126,000 | 35% | 45,000 | 12% | 193,000 | 53% |
| Missouri | 516,000 | 220,000 | 43% | 110,000 | 21% | 186,000 | 36% |
| Nebraska | 178,000 | 51,000 | 29% | 40,000 | 22% | 87,000 | 49% |
| North Dakota | 64,000 | 24,000 | 37% | 16,000 | 25% | 24,000 | 38% |
| Ohio | 834,000 | 404,000 | 48% | 165,000 | 20% | 264,000 | 32% |
| South Dakota | 77,000 | 31,000 | 40% | 17,000 | 23% | 29,000 | 37% |
| Wisconsin | 410,000 | 156,000 | 38% | 80,000 | 20% | 174,000 | 42% |
| Northeast | 4,249,000 | 1,649,000 | 39%* | 809,000 | 19% | 1,791,000 | 42% |
| Connecticut | 247,000 | 69,000 | 28% | 62,000 | 25% | 116,000 | 47% |
| Maine | 121,000 | 56,000 | 46% | 31,000 | 25% | 35,000 | 29% |
| Massachusetts | 288,000 | 93,000 | 32% | N/A | N/A | 147,000 | 51% |
| New Hampshire | 94,000 | 37,000 | 39% | 17,000 | 18% | 41,000 | 43% |
| New Jersey | 940,000 | 335,000 | 36% | 131,000 | 14% | 473,000 | 50% |
| New York^ | 1,476,000 | 548,000 | 37% | 317,000 | 21% | 611,000 | 41% |
| Pennsylvania | 994,000 | 477,000 | 48% | 180,000 | 18% | 338,000 | 34% |
| Rhode Island | 55,000 | 27,000 | 49% | 13,000 | 23% | 15,000 | 27% |
| Vermont | 34,000 | 8,000 | 24% | 11,000 | 33% | 15,000 | 43% |
| West | 7,613,000 | 3,016,000 | 40%* | 1,230,000 | 16% | 3,367,000 | 44%* |
| Alaska | 100,000 | 51,000 | 51% | 20,000 | 20% | 29,000 | 29% |
| Arizona | 808,000 | 368,000 | 46% | 100,000 | 12% | 341,000 | 42% |
| California | 3,845,000 | 1,428,000 | 37% | 623,000 | 16% | 1,795,000 | 47% |
| Colorado | 593,000 | 223,000 | 38% | 104,000 | 18% | 266,000 | 45% |
| Hawaii | 70,000 | 35,000 | 50% | N/A | N/A | 28,000 | 39% |
| Idaho | 166,000 | 67,000 | 40% | 31,000 | 19% | 68,000 | 41% |
| Montana | 126,000 | 59,000 | 47% | 27,000 | 22% | 40,000 | 32% |
| Nevada | 350,000 | 147,000 | 42% | 61,000 | 17% | 143,000 | 41% |
| New Mexico | 233,000 | 109,000 | 47% | 31,000 | 13% | 94,000 | 40% |
| Oregon | 307,000 | 122,000 | 40% | N/A | N/A | 150,000 | 49% |
| Utah | 337,000 | 147,000 | 44% | 62,000 | 18% | 129,000 | 38% |
| Washington | 621,000 | 238,000 | 38% | 116,000 | 19% | 267,000 | 43% |
| Wyoming | 56,000 | 23,000 | 41% | 14,000 | 26% | 19,000 | 33% |
| NOTES: Numbers may not sum to 100% due to rounding. N/A indiciates estimates do not meet minimum standards for statistical reliability. *Indicates the region has a statistically significant difference from the South at p<.05 level. Statistical comparisons not included for total United States or for individual states. ^Tax credit-eligible population in Minnesota and New York include uninsured adults who are eligible for coverage through the Basic Health Plan.SOURCE: Kaiser Family Foundation analysis based on 2015 Current Population Survey data and 2015 Medicaid eligibility levels, updated to assume adoption of the Medicaid expansion to adults in all states. | |||||||
Endnotes
- Samantha Artiga and Elizabeth Cornachione, Trends in Medicaid and CHIP Eligibility Over Time (Washington DC: Kaiser Family Foundation, January 2016), https://modern.kff.org/medicaid/report/trends-in-medicaid-and-chip-eligibility-over-time/. ↩︎
- KCMU analysis of 2015 ASEC Supplement to the CPS. ↩︎