What Do People with Medicare Think About the Role of Marketing, Shopping for Medicare Options, and Their Coverage?
Executive Summary
Medicare is the federal health insurance program that covers over 65 million adults 65 and older and younger adults with long-term disabilities. Medicare is a very popular program, with 81% of the public holding favorable views of the program, and is viewed positively by large majorities of Democrats, Republicans, and Independents.
Over the past 15 years, the role of private plans in Medicare has increased dramatically. Today, more than half of all Medicare beneficiaries are enrolled in a Medicare Advantage plan, with an average of 43 plans to choose from in addition to traditional Medicare. Beneficiaries in traditional Medicare can choose among 24 stand-alone Part D plans, on average, and may choose supplemental coverage, such as Medigap, if they don’t have supplemental coverage under Medicaid or an employer or union-sponsored retiree health plan. This increasingly crowded marketplace has been accompanied by extensive marketing and advertising as well as agents and brokers competing to attract enrollees.
To capture Medicare beneficiaries’ views and experiences in choosing between traditional Medicare and private plans, and among private plans, and the factors that influence these decisions, KFF worked with PerryUndem to conduct focus groups with Medicare beneficiaries in the Fall of 2022, during the annual Medicare open enrollment period. This report summarizes first-hand accounts of participants’ reactions to phone calls, TV advertisements and other marketing activities they encounter during the open enrollment period, what influences their decision-making, including the role of licensed agents (also known as brokers), how much Medicare beneficiaries understand about their Medicare choices, what they think of the Medicare marketplace, and how well their Medicare coverage is working for them.
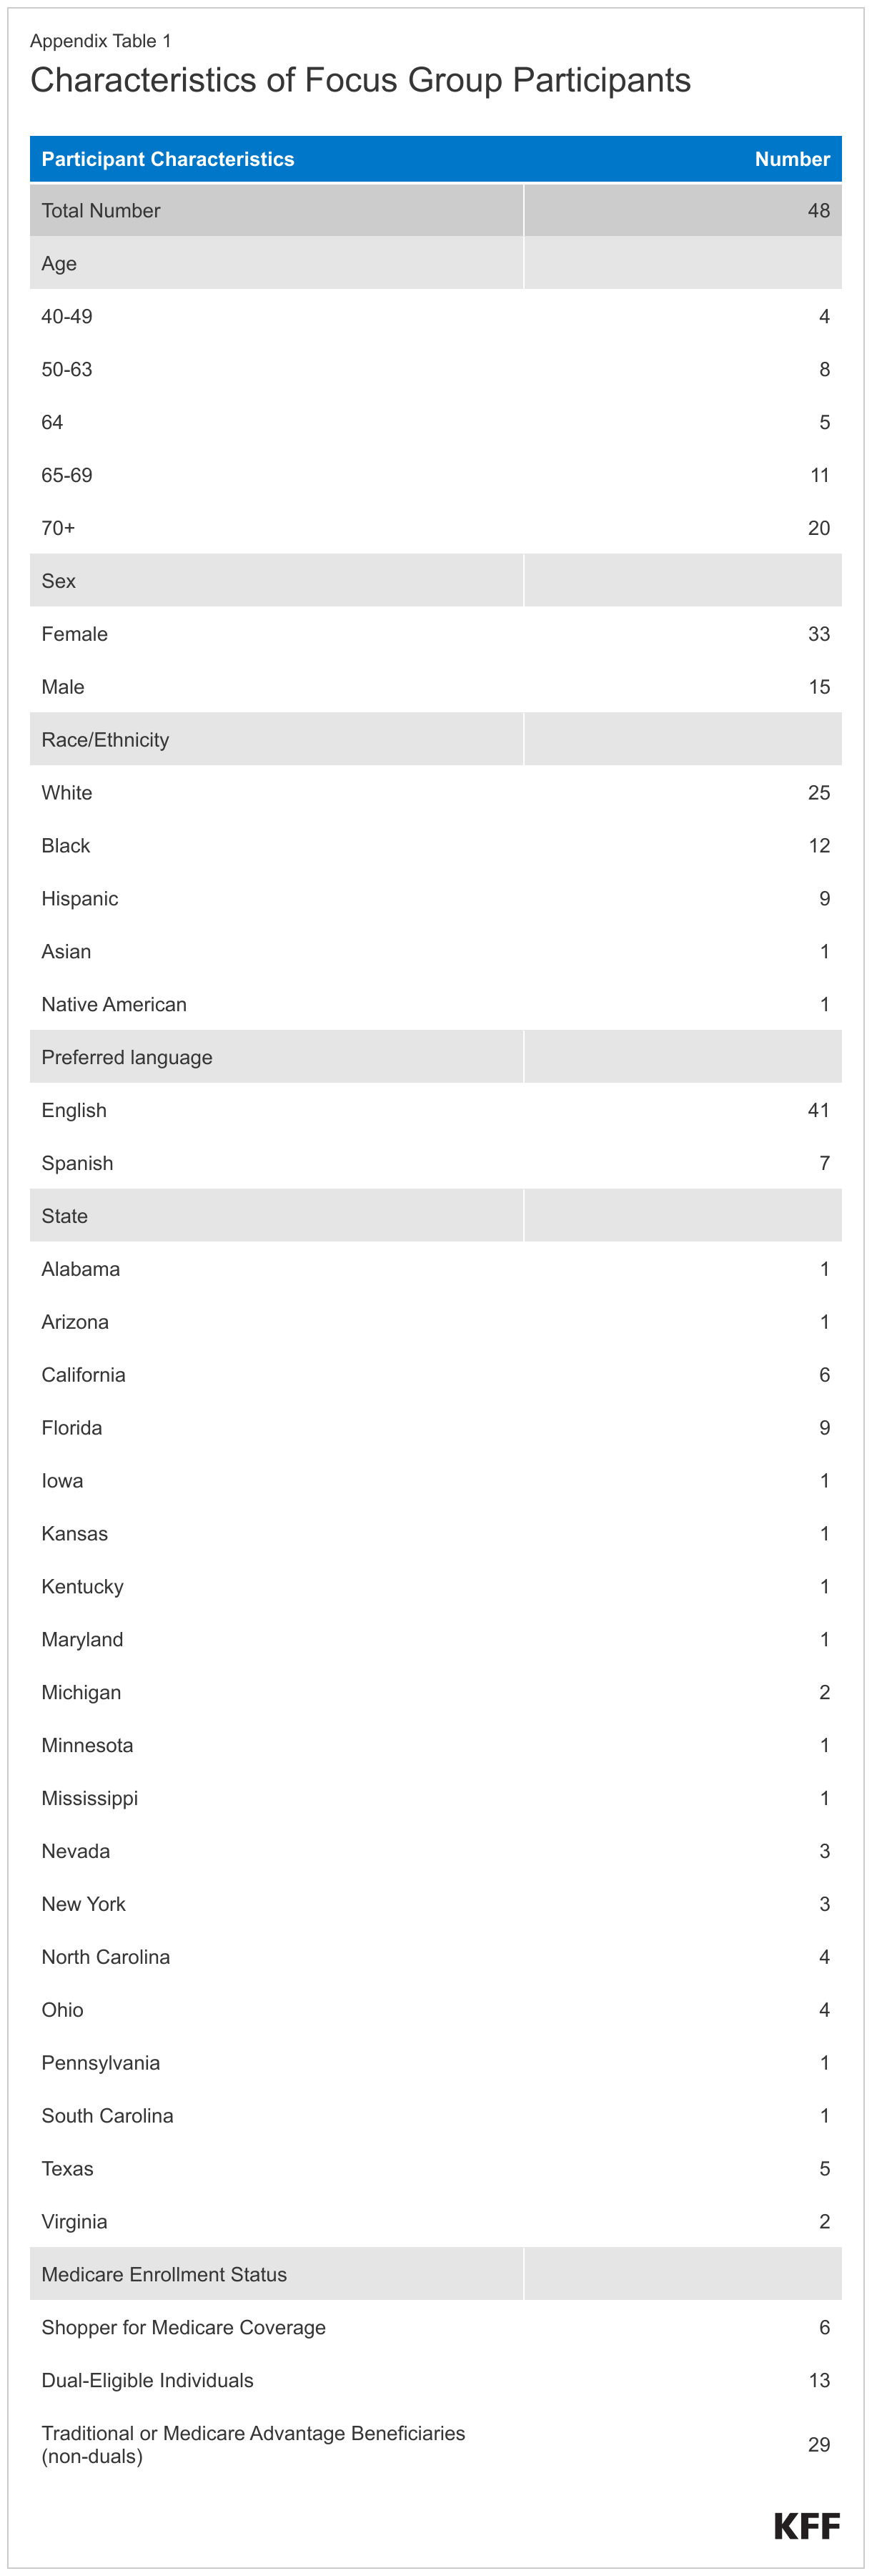
The focus group participants included Medicare beneficiaries ages 65 and older and younger adults with disabilities who make health coverage decisions for themselves and/or their spouse or family member. Some focus groups also consisted of people with both Medicare and Medicaid (also referred to as dual-eligible individuals or dual eligibles) as well as adults 64 years old who were approaching Medicare enrollment. Because the study focused on decisions pertaining to Medicare coverage, including Medicare Advantage and traditional Medicare supplemented by Medigap, we excluded people on Medicare with retiree coverage from a former employer or union.
Key Takeaways
- Many participants reported experiencing aggressive marketing tactics pushing Medicare plans, including unsolicited phone calls. Many participants reported getting frequent phone calls from brokers or plan representatives advertising Medicare plans, though it was not always clear to participants who was calling.
- Nearly all participants have seen TV advertisements that are marketing Medicare, most frequently Medicare Advantage plans. Participants reported they were often confused about who was sponsoring the ads. Some participants emphasized that who was sponsoring the ads was often unclear, noting many of the ads had the appearance of being sponsored by the government though they believed the ads were in fact sponsored by private companies.
- Participants did not trust the content of the ads, particularly the ones that marketed a slew of “free” benefits. In general, many thought TV advertisements were misleading. Celebrities are often spokespeople for these advertisements, though participants did not seem to be swayed by them. Overall, participants said that Medicare private plan marketing and advertising did not play a role in their plan choices.
- Most participants found the process of selecting their coverage to be confusing, difficult and overwhelming. As a result, many participants relied on a broker to assist them when choosing their coverage and valued their expertise. Participants who use brokers to help select and enroll in a Medicare plan say brokers are a trusted resource. Most of the participants who used brokers did not seem bothered by potential financial incentives to enroll them in a certain plan.
- Few participants used government resources when making coverage decisions, such as the Medicare Handbook or 1-800 Medicare, but those participants who did use these government resources generally found them helpful. Most participants had not heard of or used State Health Insurance Assistance Programs (SHIPs), which provide local and objective insurance counseling to people on Medicare.
- Focus group participants highlighted a number of factors that were important in choosing their coverage when they first enrolled in Medicare, including premiums and out-of-pocket costs, access to specific doctors, availability of extra benefits, and coverage of prescription drugs. Some participants who are enrolled in Medicare Advantage plans also said they enrolled in a particular plan because its name was familiar or because the company had a good reputation. Participants generally did not take into account Medicare’s star quality ratings of plans to inform their plan choices, though some did their own research on a plan’s quality using non-government resources.
- Most focus group participants – whether in traditional Medicare or Medicare Advantage – said they were relieved to get on Medicare and are satisfied with their coverage. However, some participants cited specific issues with their coverage that varied based on their source of Medicare coverage.
- Participants with traditional Medicare and a supplemental Medigap policy are generally pleased with their coverage, including low or no cost-sharing for Medicare services, protection against catastrophic expenses, broad access to providers since virtually all physicians take Medicare and Medigap, and feeling that have control over their health care, but some expressed concern about the cost of Medigap premiums.
- Participants in Medicare Advantage are also generally satisfied with their coverage because of the zero or low premiums, and extra benefits offered by their plan, such as dental, vision, and hearing services, but some encountered high medical bills when using certain services, faced delays in care, such as having to wait weeks to see specific physicians due to prior authorization and referrals, and had issues in accessing preferred doctors due to network restrictions.
- Dual-eligible participants – whether they had Medicare coverage through traditional Medicare or a Medicare Advantage plan – also reported being generally satisfied with their coverage, particularly due to the low out-of-pocket costs for their health care, such as no copays for doctor’s visits. However, some-dual eligible participants with Medicare Advantage had issues finding providers, such as primary care doctors, who would take both their Medicare and Medicaid coverage.
- Participants enrolled in Medicare Advantage, including some dual-eligible individuals, also noted difficulty using some of their supplemental benefits, particularly dental benefits, due to network restrictions and certain providers not taking their coverage.
- Participants in Medicare Advantage and Medicare Part D stand-alone drug plans reported being frustrated at the high out-of-pocket costs of some of their prescriptions.
- The majority of participants do not review their coverage options every year, and even fewer switched plans because they felt they would not be better off with a different option. Participants generally feel they made the right choice – whether in traditional Medicare or Medicare Advantage – when selecting their coverage and feel it is working well enough for them. Therefore, participants do not see the need to look again at their coverage options; however, many wish they had had more information before enrolling.
- Some participants with both Medicare and Medicaid were concerned about losing their Medicaid coverage, and were anxious about losing Medicaid during the redetermination process as states resume disenrollments after a three year pause during the pandemic.
This work was supported in part by the AARP Public Policy Institute. KFF maintains full editorial control over all of its policy analysis, polling, and journalism activities.
Report
Introduction
The Medicare plan landscape has transformed markedly in recent years, with more than half of all Medicare beneficiaries enrolled in Medicare Advantage plans. When Medicare beneficiaries first enroll in Medicare and during the annual open enrollment period, they can choose traditional Medicare or enroll in a Medicare Advantage plan. If Medicare beneficiaries select traditional Medicare, they may also need to purchase a stand-alone Part D prescription drug plan (PDP), and potentially a supplemental Medigap plan, which fully or partially covers Part A and Part B cost-sharing requirements. In lieu of traditional Medicare, beneficiaries can get coverage through private Medicare Advantage plans, which are mainly HMOs and PPOs, that provide all Medicare Part A and B benefits, often for no additional premium for plans open for general enrollment (other than the Part B premium), typically include Part D drug coverage, and may cover other benefits such as dental, vision, and hearing. Some people with Medicare may otherwise receive supplemental coverage through an employer retiree health plan or Medicaid, which may supplement either traditional Medicare or a Medicare Advantage plan.
Dozens of private Medicare Advantage and Part D drug plans are available to people on Medicare. With a large number of plans and coverage options to review, beneficiaries have a myriad of choices to make when they enroll in the Medicare program, particularly as there may be tradeoffs for each of these decisions. For example, Medicare Advantage plans typically have lower premiums compared to traditional Medicare plus a Medigap policy and have extra benefits that traditional Medicare does not cover, such as dental, vision, and hearing. However, Medicare Advantage plans have limited provider networks and apply cost management tools such as prior authorization, which traditional Medicare does not.
Both people in Medicare Advantage and traditional Medicare also make choices about their prescription drug coverage, which can vary across numerous domains, including premiums, cost sharing, formularies, and pharmacy networks, among others.
Further, each year, plans may change their premiums, benefits, and other features, and beneficiaries have the opportunity to assess these changes and switch plans during the annual open enrollment period. At the same time, people with Medicare are often inundated with marketing and advertisements for private Medicare plans – typically Medicare Advantage plans – which can add to the complexity of decision-making around Medicare choices.
KFF research has shown, however, that few beneficiaries revisit their coverage decisions each year to determine which option is best for them based on their individual needs and the specific features of the plans available to them, and few change their coverage at all: during the open enrollment period for 2020, 10% of Medicare beneficiaries with Medicare Advantage switched plans. This could be because beneficiaries are satisfied with their current coverage selection, but also may also speak to the challenges of understanding and comparing the multitude of plan options.
To better understand Medicare beneficiaries’ experience with the Medicare program, how they make their Medicare coverage choices, the factors that influence these decisions, including the role of marketing and brokers, and whether they reconsider their plan choices, KFF worked with PerryUndem to conduct a series of focus groups to provide insight on these issues (see Appendix for more details on focus groups).
Perspectives from Beneficiary Focus Groups on Medicare Coverage, Marketing, and Plan Choice
- Focus group participants said they were inundated by Medicare marketing, including unsolicited phone calls and TV ads, and believed the ads were often misleading and deceptive
- Participants found selecting Medicare coverage overwhelming and relied on brokers to assist them with their choices while few used official Medicare resources
- Participants said they considered many factors when selecting Medicare coverage, including premiums, access to doctors, extra benefits, and coverage of prescriptions
- Participants reported high satisfaction with Medicare coverage but cited specific issues that varied depending on their source of Medicare coverage
- Despite high satisfaction, participants cited specific Issues that varied depending on their source of Medicare coverage
- Participants generally feel they made the right choice when selecting a plan, and most participants have not revisited their plan choices
Experiences Unique to Dual-Eligible Participants
- Dual-eligible participants had varying experiences signing up for Medicaid coverage with some participants choosing coverage and others being assigned their coverage
- Some dual-eligible participants were concerned about the possibility of losing medicaid coverage due to the annual redetermination process
Focus Group Participants Said They Were Inundated by Medicare Marketing, Including Unsolicited Phone Calls and TV Ads, And Believed the Ads were Often Misleading and Deceptive
Private Medicare plans are allowed to engage in a variety of Medicare marketing and communication activities, including over the phone, on television, and in-person, as long as they adhere to the Centers for Medicare & Medicaid Services (CMS) rules and regulations. However, there has been concern over misleading and deceptive marketing tactics by private Medicare plans as well as third-party marketing organizations who work for these plans. For example, CMS has seen a substantial increase in beneficiary complaints in recent years – they received more than twice as many beneficiary complaints related to marketing in 2021 (~40,000) compared to 2020 (~16,000). In response to these and other concerns, CMS finalized new marketing regulations in May 2022 and in April 2023 to help protect Medicare beneficiaries who are looking for Medicare coverage.
Focus group participants were asked to provide their reactions to Medicare marketing and advertising, including over the phone and on television, whether they could tell who was sponsoring these calls or ads, what they thought about the messaging, how they felt about celebrity spokespeople in many of the ads, and if any of these communications played a role in their Medicare choices. Dual-eligible participants had similar reactions to those enrolled only in Medicare.
Unsolicited phone calls
Many participants reported getting frequent unsolicited phone calls advertising Medicare plans. Participants said marketers promoting these plans used deceitful tactics, and participants usually ignored these calls.
For marketing solicitations over the phone, private Medicare plans are subject to a number of requirements and are not permitted to use telephone solicitation (that is, cold calling), as well as robocalls, text messages, or voicemail messages if unsolicited. However, a recent report from the majority staff of the Senate Finance Committee documented robocalls, telemarketing, and frequent phone calls as a common source of complaints among Medicare beneficiaries. Most focus group participants mentioned receiving unsolicited phone calls from marketers, some of whom were calling from insurance plans or were brokers or agents representing these plans, but many participants said it was not always clear who was calling.
“But lots of phone calls…but you know they are scam when they are coming in with a different number…faking to be from Cisco, T-Mobile, from AT&T, but when you pick up the phone they’re talking about Medicare…I get about eight of those calls a day.”
71-year-old, male, Traditional Medicare Beneficiary with a Medigap Policy (San Jose, CA)
“They called me from a lot of (insurance) companies at that time and you don’t know if they are good or bad, to tell you the truth. They offer so much that you don’t know if it’s true, so I kept (my same) insurance.”
73-year-old, male, Spanish speaking, Medicare Advantage Beneficiary (Miami, FL)
“I have had a lot of (marketing) calls, a lot of calls, but I don’t listen to them…The Medicare office doesn’t call you on the phone. They are fake to me. -68-year-old, female, Spanish speaking, Medicare Advantage Beneficiary”
68-year-old, female, Spanish speaking, Medicare Advantage Beneficiary (Katy, TX)
“The issue is how you got to pick and choose and research, and then you get all these phone calls every day for the last two years from Medicare, Medicare, we’re Medicare specialist, we’re Medicare specialist”
61-year-old, female, Proxy on Behalf of Medicare Advantage Beneficiary (Petersburg, VA)
“They blow up my phone, too. And that’s really annoying. The Medicare Advantage insurance people. They constantly blow up your phone trying to; I don’t know if they’re trying to sell you a plan or exactly what they do. Or I don’t know if maybe, now that you mentioned…, a broker, maybe that’s what they are, but they’re constantly calling my phone. I get calls from all over the country and every time I answer the phone it’s somebody about Medicare Advantage, Medicare Advantage Plan”
56-year-old, female, Dual-Eligible Individual in Traditional Medicare (Benson, NC)
Confusion about TV ad sponsors
Nearly all participants have seen TV advertisements that are marketing Medicare, most frequently Medicare Advantage plans. However, many participants emphasized they were often confused who was sponsoring the ads and that many ads had the appearance of being sponsored by the government though they believed the ads were in fact sponsored by private companies.
One area of particular concern to CMS has been the use of the Medicare name and logo to give the appearance that advertisements or communications are being sponsored or endorsed by the Medicare program or the federal government, when they are actually sponsored by private Medicare plans or by representatives acting on behalf of these plans. The recent Senate Finance Committee majority staff report has also documented similar beneficiary complaints that highlight confusion over what is truly official correspondence and advertisements from the government. Likewise, a KFF analysis of Medicare TV advertising found that more than one in four ads aimed at the most recent open enrollment period, in the fall of 2022, included a government-issued Medicare card or an image that closely resembled it.
In order to address this issue, CMS has finalized changes to this type of marketing, which would prohibit the use of the Medicare name, CMS logo, or official products, including the Medicare card, in a misleading manner. Similar to these complaints, focus group participants also expressed confusion over who was sponsoring some of the ads. Many participants noted that the ads were clearly designed to give the impression they were coming from the government when they believe these ads were fact sponsored by private companies.
“…There is downright fraudulent stuff going on of people pretending to be part of the government…The Medicare hotline, the Medicare helpline; none of these people are from the government”
70-year-old, male, Traditional Medicare Beneficiary with a Medigap Policy (Cleveland, OH)
“I’ve noticed that on the ads, they say you might get more money from Social Security if you apply for their coverage. And at the bottom of the screen, in small writing, they’ll tell you this is not a government offer.”
75-year-old, female, Traditional Medicare Beneficiary (Las Vegas, NV)
“(It’s not always clear who is sponsoring the ads), no, because I think sometimes the impression is that the ad is actually coming from the Social Security office or from Medicare or from the government, and I think some of them are designed that way.”
78-year-old, female, Medicare Advantage Beneficiary (Upper Marlboro, MD)
“(I have seen ads) for Medicare but I have read it but there is really small print that it says, this doesn’t have to do with Medicare. It has the Medicare name, but their identity doesn’t have to do with Medicare.”
72-year-old, female, Spanish speaking, Medicare Advantage Beneficiary(Briarcliff Manor, NY)
“Free” is not always free
One of the most common complaints among participants about TV marketing is that they often advertise that services and benefits are “free”, though this is not always true.
In many of the focus groups, participants mentioned their Medicare Advantage plans come with zero premiums and copays and access to many extra benefits, some of which give them additional money to spend, such as money for over-the-counter items. A KFF analysis of Medicare TV advertising aimed at the most recent open enrollment period, in the fall of 2022, confirmed that messaging about extra benefits was included in more than 90% of ads, while messaging about the potential for lower out-of-pocket costs was present in 85% of Medicare ads. Despite the fact that some beneficiaries report receiving these types of benefits at no cost, nearly all participants, regardless of the Medicare coverage they have, do not trust the content of these type of ads and are inclined to ignore it.
“Mine isn’t free, so even for my hearing aids, even though I appreciate that, I didn’t have to pay the whole $2,500, I still had to pay a copay of $500 to get my hearing aids. And I appreciate the fact that I didn’t have to pay the $2,000. The fact that, you know, I have the other copay with other issues, visits or prescriptions, I am greatly appreciative that I have the opportunity to be able to do so. But,…it’s not free. Silver Sneakers is free.”
68-year-old, female, Medicare Advantage Beneficiary (Grand Rapids, MI)
“It’s doing nothing for me. I just ignore it…It’s all the things for free. Free food, free this, free that.”
66-year-old, male, Medicare Advantage Beneficiary (Nashville, NC)
“They’ll tell you no costs to have Medicare Advantage, but they don’t tell you that there’s copays…here’s limitations on where you go. All sorts of stuff that comes along with it, but you don’t pay a monthly fee. And that drives a lot of people to areas that’s not to their advantage, let’s put it that way.”
70-year-old, male, Traditional Medicare Beneficiary with a Medigap Policy (Cleveland, OH)
“They try to tantalize you with some free bonus and then it feels like a scam.”
64-year-old, female, Shopping for Medicare (Lake Tahoe, CA)
“I was just going to say that they offer things like…free rides to appointments, free meals, free this, free that, and none of it’s actually true…Just give it to me straight and upfront and be honest you know and that’s one of the biggest reasons why I don’t even pay attention.”
56-year-old, female, Dual-Eligible Individual in Traditional Medicare (Benson, NC)
Participants feel inundated by TV ads
In general, participants feel inundated by TV ads. Most find them off-putting, misleading, and unhelpful, and say the ads did not influence their Medicare plan selections.
“I think some of them are misleading. It just seems to me that there should be more education for the consumer because some of these ads are so misleading. I don’t have any increased appreciation of the plan if there’s a celebrity endorsement. They can afford it.”
78-year-old, female, Medicare Advantage Beneficiary (Upper Marlboro, MD)
“I just want to say I find them (TV ads) very misleading, but because our Medicare and Medicaid systems in this country are so confusing to people that it’s easy to be misled by those ads. You know, I mean if it wasn’t so complicated to begin with, people would know that these ads are bogus.”
56-year-old, female, Dual-Eligible Individual in Traditional Medicare (Benson, NC)
“This is a serious subject. You know my health, our health and our well-being is the most important thing in the world, especially as we get older. And they make it all a big joke…and it grates on my nerves because they’re sing-songy, make a joke out of everything about this. It’s not a joke, it’s serious.”
60-year-old, female, Dual-Eligible Individual in Medicare Advantage (Largo, FL)
“We’re overrun with these commercials and, you know they just say the same thing over and over again you know, call this, call this. But it’s really, it’s kind of a comedy watching these commercials now about these, because they’re jokes. I mean to me they’re jokes… I mean the way they have it advertised it’s not really explaining anything.”
63-year-old, female, Dual-Eligible Individual in Traditional Medicare (Cleveland, OH)
Celebrity spokespeople
While celebrities are often spokespeople for Medicare Advantage plans, participants did not seem swayed by them and frequently disregarded them.
KFF analysis has found that celebrity endorsements are commonly featured in TV ads for Medicare Advantage, appearing most often in ads sponsored by brokers and other third-party organizations, such as marketing firms, who may contract with insurers to promote plans and boost enrollment. Participants reported encountering these ads but most did not find the endorsements helpful or persuasive.
“I saw one with the guy that played J.J., and I just thought, where has he been all of these years? I mean, I got nothing from it…I wasn’t in the market for it, I already had my plan, so it was just comical.”
66-year-old, female, Traditional Medicare Beneficiary with a Medigap Policy (Newport News, VA)
“I just think it’s comedy hour, because I think it’s some celebrity that’s trying to get a check”
54-year-old, male, Medicare Advantage Beneficiary (Florence, SC)
“I think that some of (the sponsors) are very obscure. Like the celebrity ones, you really don’t know who the heck is they’re pushing there, to be quite honest.”
70-year-old, male, Traditional Medicare Beneficiary with a Medigap Policy (Cleveland, OH)
“…I see them (ads) all the time but they kind of just come in one ear and out the other. Kind of yeah, like I’ve noticed J.J. Walker and the only thing that’s coming to my mind is God, man he looks good since “Good Times” that’s all I’m thinking.”
48-year-old, male, Dual-Eligible Individual in Traditional Medicare (New York City, NY)
Participants Found Selecting Medicare Coverage Overwhelming and Relied on Brokers to Assist Them with Their Choices While Few Used Official Medicare Resources
The average Medicare beneficiary has an average of 43 Medicare Advantage plans to choose from and 24-stand-alone prescription drug plans to choose from. Most participants said they were surprised to hear that was the average number of coverage options available and were overwhelmed at the idea of having to sort through so many plan options.
Many find the process overwhelming
Most participants said the process for selecting a plan was overwhelming and confusing to navigate. Some did try to sort through plan options themselves, but emphasized the process was challenging.
“There’s no getting around it, it’s a difficult decision because not only do you have those plans, but in each one of them there are so many different parameters that you need to look at… You’ve got the copay, you’ve got the premium, you’ve got the out-of-pocket max. I mean, I do it like I do everything else in my life, I build a spreadsheet. I have 15 or 20 columns of what’s important to me, and I could make it 50 column because there’s 50 different parameters you know, in each that you could look at. And so, it’s a little bit difficult and actually the Medicare or Social Security website is helpful, but if you really want to get to the details, you end up having to navigate out of it to get to the provider site…if you want to see the specific details like of dental coverage, how much is your allowance and all of that stuff, etc.”
70-year-old, male, Medicare Advantage Beneficiary (Pfafftown, NC)
“…It gets confusing after a while especially when you’re trying to do it looking at a book or looking on screen, it gets confusing when you’re trying to compare. And I just, you know, it’s just hard to understand to begin with, but it’s really hard when you’re trying to compare plans different plans and what they offer.”
73-year-old, female, Medicare Advantage Beneficiary (Palm Coast, FL)
“You got to do too much reading the fine print to find out what is covered, and what you’re going to get, and it’s really depending on what your illnesses are, say what your conditions are, if you have any condition, how you pick what’s going to be the best plan for you.”
61-year-old, female, Proxy on Behalf of Medicare Advantage Beneficiary (Petersburg, VA))
Use of Medicare insurance brokers
For this reason, many participants have used a broker at some stage to assist them when choosing their plan, and many found them helpful in sorting through the enrollment process. Many brokers were recommended by a friend or family members. For people who use brokers, they are seen as a trusted resource.
Many participants, including some dual-eligible individuals, relied on brokers to help narrow down their plan options. Medicare insurers contract with brokers to solicit and enroll beneficiaries in their plans, and in return, the brokers receive a commission from the insurer. Research has shown that people who received help making decisions about their Medicare coverage most commonly turned to brokers to help them compare and narrow down their Medicare plan options, and the focus group participants generally confirmed this trend.
Participants who used brokers said they liked that brokers simplify shopping, can ensure they choose a plan with their preferred providers, and can help navigate whether a plan covers their prescriptions. When dual-eligible participants used brokers, it was generally to help them choose a Medicare Advantage plan. In many cases, brokers were recommended to them by family and friends, who reported being happy with their plans, so participants see brokers as a trusted resource.
“If I had to do it myself, I would say very hard. But since I was blessed to have an agent to come and sit down and talk to me, and give me several plan options and go over with me what was there, and the physician that was in the plan that I chose, it made a world of difference.”
67-year-old, female, Medicare Advantage Beneficiary (Jackson, MS)
“Like I said, I went to a broker. And he told me look close, this is what you get, that’s what covered. Then he went through, I think, five programs. And I went to them, and I was thinking about it, and I decided to go with Medicare Advantage. And I trusted him, also, the broker, because he did it for some friends of mine and they were very happy with him”
76-year-old, female, Medicare Advantage Beneficiary (Palm Desert, CA)
“He wasn’t trying to force to sell me anything, he tried to give me the best plan for me, that fit my budget. Because a lot of times you get people that try to up-sell you stuff and I didn’t get that impression from him. And then he just cut out a lot of the excess fat, answered the questions I wanted.”
54-year-old, male, Medicare Advantage Beneficiary (Florence, SC)
“I work with an agent that helps me and when I get dissatisfied I just call him up and say, we need to start looking again. And then he’ll sit down with me and, you know tell me like; okay you can with this company you can keep your rheumatologist. With this company you know, you can keep your oncologist. With this company you can keep your hematologist. And you know, whatever’s most important. I mean like for me it’s certain doctors are more important than others for me to keep. Because I bond with them and I trust them. So I couldn’t do this alone, honestly, it would make me nuts trying to figure this out without a broker, without an agent.”
60-year-old, female, Dual-Eligible Individual in Medicare Advantage (Largo, FL)
Beneficiaries not bothered by commissions that brokers received
Most of the participants who used brokers did not seem bothered by potential biases or financial incentives to enroll them in a Medicare Advantage plan and relied on their advice.
Medicare brokers receive a commission for enrolling beneficiaries in plans, whether they are for Medicare Advantage, stand-alone Part D plans or supplemental Medigap plans. Yet, research has shown that brokers tend to be paid more for enrolling beneficiaries in Medicare Advantage plans rather than Medigap plans, which could create conflicts for brokers who may have an incentive to recommend one type of plan over another based on their potential compensation rather than the needs of the beneficiary. In general, beneficiaries did not seem to be aware how brokers were paid – that they might be paid by a specific insurer or receive different fees for separate products. For example, in 2020, Medicare Advantage commissions were $510 nationally, while commissions were $322 for a Medigap supplement and $78 for a Part D plan, a total commission of $400 for Medigap plus a Part D plan. However, when asked if they had concerns about any potential biases or conflicts of interest, beneficiaries did not seem bothered by the commissions that brokers received as long as they felt they were getting good recommendations on their plan options.
“It doesn’t affect me that the agent makes more money recommending Medicare Advantage. I prefer for people to make their money, but I also like it because they come and explain everything as they should, so you understand it better.”
68-year-old, female, Spanish speaking, Medicare Advantage Beneficiary (Katy, TX)
“Not in my case…He was a friend, but he took the information that I was giving him, for him to find the best plan for me. And I already knew that I wanted an Advantage Plan, so for my case…personally I don’t care what they get paid as long as I get what I need for me.”
71-year-old, female, Medicare Advantage Beneficiary (San Diego, CA)
“[Their commissions don’t] bother me because I don’t care what they’re getting paid as long as I’m getting what I’m asking for.”
64-year-old, female, Shopping for Medicare (San Antonio, TX)
Few have used official Medicare information resources
Few participants have used Medicare’s official information resources such as the 1-800 Medicare toll free number, the Medicare.gov website, and the Medicare & You Handbook that is provided each year to all Medicare beneficiaries, though for the few who did, some found these resources helpful.
Medicare has official information resources beneficiaries can turn to help with their coverage decisions, including the 1-800 Medicare toll free number, the Medicare.gov website, including the Medicare Plan Finder, and the Medicare & You Handbook. KFF research has shown that these resources are not widely used, and focus group participants generally confirmed this. Participants who used these resources, however, said the resources were mostly helpful and felt they could get answers to important questions, although some participants thought the toll-free phone number, in particular, was too slow. Further, most focus group participants had not heard of or used State Health Insurance Assistance Programs (SHIPs), which provide local, in-depth, and objective insurance counseling to people on Medicare.
“It was easy (to go to the Medicare website). In fact, I even looked to see and call someone. I went on the website and I took the phone number and I called, and I talked to someone there who could explain their benefits well…(We communicated) in Spanish, because my mom was next to me, so she had to authorize my call with them.”
46-year-old, female, Spanish speaking, Proxy on Behalf of Traditional Medicare Beneficiaries (Fort Lauderdale, FL)
“I use the healthcare, Medicare.gov website and do my comparison shopping there. I’m assuming that I am going on a correct route other than meeting with an agent. I dealt with, in my job, I dealt with health insurance for many years, so I feel pretty able to navigate that myself.”
59-year-old, female, Medicare Advantage Beneficiary (Benton Harbor, MI)
“…We get a book from Social Security, so first I looked at that and…I had to see what was available in my area, then I had to screen out what I absolutely would not accept, and those were with extremely high premiums. And then I had to look at what was left to compare the features. Once I had done that, then I spoke with a one of those broker types.”
78-year-old, female, Medicare Advantage Beneficiary (Upper Marlboro, MD)
“I tried it out once (the 1-800-Medicare line), it’s kind of like calling the IRS, you better bring a lunch and a dinner because you going to be on hold for a long time no matter what.”
54-year-old, male, Medicare Advantage Beneficiary (Florence, SC)
Participants Said They Considered Many Factors When Selecting Medicare Coverage, Including Premiums, Access to Doctors, Extra Benefits, and Coverage of Prescriptions
When Medicare beneficiaries first enroll in Medicare and select their coverage, they are encouraged to weigh a variety of factors, including premium costs, cost sharing for services, access to specific doctors, availability of extra benefits, coverage of prescription drugs, and quality ratings of plans, among others. Beneficiaries may revisit their choice of plan each year during the annual open enrollment period.
Focus group participants were asked what factors entered into their decision making when choosing a plan, how they viewed the process of selecting a plan, and why they ultimately chose Medicare Advantage or traditional Medicare.
Many confused by coverage options and how Medicare program works
Despite looking forward to going on Medicare, many said they were confused, stressed and overwhelmed by the various coverage options and how the Medicare program works.
Many participants lacked awareness or a good understanding about the different Medicare options available to them. They mentioned confusion with the different parts of Medicare – Parts A, B, C, D – and were unclear what makes them different from each other and which parts are mandatory or optional. They often did not know which parts of Medicare were included as part of a Medicare Advantage plan and if that was the same or different as a Medicare “supplement.”
“All the information that was coming through the mail…it stressed me out and I didn’t know what to do. I was like frozen…I ignored it and threw that stuff in the garbage.”
68-year-old, female, Medicare Advantage Beneficiary (Grand Rapids, MI)
“I’ve got a mail, a pamphlet and a card already from MediCal that I have to read over the instructions. Basically my understanding is all I have to do is choose the plans I want, the A, the supplemental ones the A, B, C, or D, whichever ones I want. And I’m not sure how many of those are free, or how many I’m required to have, you know and what are optional ones.”
64-year-old, male, Shopping for Medicare (Bakersfield, CA)
“The prescription drug plans are hopelessly complicated. I don’t see how anybody could actually decipher what’s going to be paid unless you know what prescriptions you’ll already be getting through the year.”
70-year-old, male, Traditional Medicare Beneficiary with a Medigap Policy (Cleveland, OH)
Zero or low premiums often cited as top reason for selecting a Medicare Advantage plan
For those who chose or were considering Medicare Advantage for their coverage, zero or low premiums was often cited as the top reason for selecting a Medicare Advantage plan, followed closely by low cost-sharing requirements for services.
People on Medicare are often concerned about the cost of health care because most live on fixed incomes with limited savings. When thinking about health care costs, the first thing that often comes to mind is a plan’s monthly premium, because it is monthly expense they will incur regardless of their health needs, and it is relatively easy to compare across plans. Many of the focus groups participants noted that they lived on tight budgets and could not afford to pay for coverage that required higher premiums, which may have led them to believe that Medicare Advantage seemed like a more affordable option than traditional Medicare plus a Medigap supplemental policy with an additional premium. Due to their budgets, they also looked closely at copay amounts, particularly for services that they thought they might use with some frequency.
“It was zero costs. It covered all of my meds, zero. My doctors were in the plan.”
59-year-old, female, Medicare Advantage Beneficiary (Benton Harbor, MI)
“Well for us, when we first made the choice, we chose a Medicare Advantage [plan] which was…it was a zero premium, other than the basic Part B and the copays were $10, $20 for a specialist. So, the copays were very attractive and our doctors were in the network. So, yeah, the copays were a big part of it.”
70-year-old, male, Medicare Advantage Beneficiary (Pfafftown, NC)
“Well, (it was important for me) to be more comfortable financially (with my plan) without having to pay extra. Because, you are already paying for something in Medicare that they get from Social Security. (It’s important) to avoid paying more.”
73-year-old, male, Spanish speaking, Medicare Advantage Beneficiary (Miami, FL)
In-network doctors are top priority
Another factor that weighs heavily in their decision-making when selecting Medicare Advantage is whether their doctors are in the plan’s network.
For people considering Medicare Advantage plans, a top priority is whether their doctors are part of the plan’s network. In many cases, people are concerned about maintaining access to their primary care physician, but depending on their health needs, some are more concerned about having access to particular specialists.
“My reason for the Advantage Plan was that as far as my gynecologist, I can go once a year and get…a pap smear, exam, mammogram, and no payment whatsoever. With my primary care physician, I can go once a year…And also, for my dental I get two visits a year…with the cleaning and well the X-ray is once a year, but I get two cleanings and that. And with my eye care I get either glasses or contacts and $200 is what they pay towards that, and also…the exam is free. So basically, things like that that worked for me and having all my doctors there, it was really, it really worked for me financially to manage that.”
67-year-old, female, Medicare Advantage Beneficiary (Jackson, MS)
“When we pick a plan, we need to first verify the doctors that we are interested in treating us. Otherwise, they won’t take it. I pick the doctor who will treat me and if they are in the plan, perfect, otherwise I won’t get the plan.”
74-year-old, male, Spanish speaking, Medicare Advantage Beneficiary (Houston, TX)
“It should be free, zero, zero cost to me. It should be convenient. I should be able to see doctors in town since we have you know, hospitals and specialists here in Bakersfield.”
64-year-old, male, Shopping for Medicare (Bakersfield, CA)
Availability of extra benefits in Medicare Advantage
An additional factor that influenced participants’ decision-making is the availability of extra benefits in Medicare Advantage such as dental and vision.
Medicare Advantage plans are able to offer extra benefits not available not offered by traditional Medicare, such as dental, vision, and hearing, as well as some that provide money to enrollees, such as over-the-counter benefits, and for this reason, many participants were attracted to Medicare Advantage plans.
“In general, compared to what other people are paying, I think ours is pretty good. You know, and you get $120 back every quarter, and over the counter drugs, and a $100 a quarter to cover copays, you’re getting back just as about as much as you pay, if not more.”
72-year-old, female, Medicare Advantage Beneficiary (Pittsburgh, PA)
“The dental and the vision and stuff like that is important. Yes.”
64-year-old, female, Shopping for Medicare (San Antonio, TX)
“Because of the eyeglasses…I’ve still got to see a dentist to try to get dentures…the over the counter is a big help…this year we got a $65 cash card that you could use on groceries. I believe that next year they’re giving you $100 grocery card for food and that’s going to be a big help.”
67-year-old, female, Dual-Eligible Individual in Medicare Advantage (Homosassa, FL)
Reasons for choosing traditional Medicare
Those who ultimately chose or were considering traditional Medicare (and often a Medigap supplement) liked the relatively low cost-sharing requirements, comprehensiveness of their coverage, control over their health care, and ability to see any provider they wanted.
Medigap policies, sold by private insurance companies, are supplements to traditional Medicare and fully or partially cover Part A and Part B cost-sharing requirements, including deductibles, copayments, and coinsurance. Medicare beneficiaries with traditional Medicare, including those with a Medigap policy, can see any provider who accepts Medicare. Medigap insurance provided supplemental coverage to 36% of people in traditional Medicare (roughly 11.5 million beneficiaries) in 2020.
“Costs, and the coverage. We can afford the costs, so it’s not a problem of trying to get the cheapest, but we know that plan G is the most comprehensive coverage in the supplemental plans. And all the plans are the same by all insurance companies, it’s just the costs.”
77-year-old, male, Traditional Medicare Beneficiary with a Medigap Policy (Kansas City, KS)
“I wanted to have what I thought was the best coverage for me…Like I say, for me when I started to sign up for Medicare, I had the days of the HMO’s ringing in my brain. People that had…cancer and other diseases and they were denying them medical care because for them it was the bottom line, it was…the dollars. And I didn’t want anybody to have that kind of control over my healthcare, which is why I chose the plan that I chose.”
66-year-old, female, Traditional Medicare Beneficiary with a Medigap Policy (Newport News, VA)
“(With traditional Medicare and Medigap) I can go anywhere I want. I can go out of state. If I don’t like this one doctor’s attitude, I don’t feel I’m getting the proper care, I can go somewhere else. For my medical supplies I can switch companies without an issue. I have the freedom to go wherever I choose to go.”
65-year-old, female, Shopping for Medicare (Chicago, IL)
Relationships with insurance providers
Some participants had relationships with insurance providers that they felt comfortable with or liked the reputation of the company.
“The reason I selected (my plan) was that I’ve seen that United Healthcare is very widely accepted, so I knew I wouldn’t have any problem with getting doctors. But also, I was dissatisfied with my prior insurance company, so this seemed like what I had been waiting for when I saw what the premium was and it was available, and that’s why I went with it.”
78-year-old, female, Medicare Advantage Beneficiary (Upper Marlboro, MD)
“I went to Kaiser because they have all the doctors and specialists and you don’t have to be looking because they are there.”
72-year-old, female, Spanish speaking, Medicare Advantage Beneficiary (Sacramento, CA)
“…I was under Blue Cross Blue Shield most of my life. And then when I was in practice, I was Blue Cross BlueShield. So you get used to a certain standard of care, also by being in the healthcare field all those years, you’re very familiar with all of the healthcare companies, you know, who’s better at paying things so that factor in a lot as well. So, it’s better to go along with a brand name that’s been in the market for a while, those are easier to review, as opposed to some company you never heard of that has maybe a high deductible and doesn’t hardly cover anything. So those factored in a lot.”
54-year-old, male, Medicare Advantage Beneficiary (Florence, SC)
Medicare star quality ratings
Participants did not generally use Medicare’s star quality ratings when making coverage decisions, though some participants used other non-government sources to get information about plan quality.
On the Medicare plan finder, each Medicare Advantage plan has a star rating to provide beneficiaries with additional information about the quality of plans offered in their area. All plans are rated on a 1 to 5-star scale, with 1 star representing poor performance, 3 stars representing average performance, and 5 stars representing excellent performance. When asked whether these star ratings influenced their decision-making when choosing a plan, the majority of participants said no.
For the few participants who did look at ratings, they reported turning to other non-government sources for reviews on a plan’s quality.
“I went on…I forget what website it was. I went to check to see how good it was. I know there’s a place, but I can’t think of what it is right offhand. And they give you the ratings of the different health plans, Medicare Advantage plans…They give you the pros and the cons and how many stars…I just type into a search thing on the internet.”
67-year-old, female, Dual-Eligible Individual in Medicare Advantage (Homosassa, FL)
“I looked at reviews…. I think it helped me, I mean I think, and this may sound really, really crazy, but when I look at reviews, I don’t look at the highest ones, I look at the lowest ones…I look at those first because I want to find out if any of the issues, they’re having that pissed them off enough to give them a low rating, is going to affect me. And the high ones I want to look at because most people only review something if they’re mad. I mean it’s just, you know psychologically the way people work. Nine times out of 10 it’s not a good review that they put online to do. So if they did that means a lot. It would mean more to me than 10 bad ones. One good one actually means more than 10 bad ones.”
60-year-old, female, Dual-Eligible Individual in Medicare Advantage (Largo, FL)
“I didn’t look at the rating myself, but I did research through an organization called medicareschool.com and what they did when they were looking at the different plans and giving me some advice, was they looked at the companies and they would look at ten years back at the company, their ratings, how often they changed premiums and all of that stuff.”
66-year-old, female, Traditional Medicare Beneficiary (Newport News, VA)
Prescription drug coverage important factor in decision-making
Regardless of whether they selected or were going to select traditional Medicare with a stand-alone Part D plan or a Medicare Advantage plan with drug coverage, ensuring that their prescription drugs were covered was also an important factor in participants’ decision-making.
People with Medicare can get prescription drug coverage by enrolling in a stand-alone plan that provides Part D prescription drug coverage for people with traditional Medicare or by enrolling in a Medicare Advantage plan. Coverage of prescription drugs is based on each plan’s formulary, and depending on a plan’s formulary, beneficiaries can also be subject to prior authorization, step therapy, and quantity limits. Medicare beneficiaries with Part D coverage also face cost-sharing amounts for covered drugs and may pay an annual deductible ($505 in 2023) and depending on the plan, a monthly premium.
“(I chose my plan) for the prescriptions. They would give me the supplement plan to help with the prescriptions, even though I thankfully don’t take a lot of medications. And that was the one they recommended…if I went to the hospital, it would at least cover part of it, and then I would at least pay for the deductible, that is what made me make the decision”
72-year-old, female, Medicare Advantage Beneficiary (Briarcliff Manor, NY)
“I would say number one is the cost of drugs, they’ve got me taking so much stuff it’s ridiculous…”
64-year-old, female, Shopping for Medicare (MN)
“I purposefully choose a plan that has no drug deductible. And so, fortunately, I take, I think it’s six or seven prescriptions, and through the mail order I pay zero, so I’m fortunate in that respect. The only issue I’m having is attempting to get that one medication prescribed, basically.”
59-year-old, female, Medicare Advantage Beneficiary (Benton Harbor, MI)
Participants Overall Reported High Satisfaction with Their Medicare Coverage
Most participants satisfied with Medicare coverage
Most participants – whether in traditional Medicare or Medicare Advantage – were relieved to be on Medicare and reported being satisfied with their Medicare coverage.
Medicare continues to be a very popular program, with 81% of the public holding very or somewhat favorable views of the program. Most participants mentioned being excited or relieved to go on Medicare, often because of the lower costs compared to their previous insurance coverage or because of the security of having Medicare coverage. When asked on a scale of 1-10 how they would rate their Medicare coverage, with 10 being very satisfied, most participants gave their coverage an 8, 9 or 10, saying it is working well for them.
“Most of my life, well since age 21, we have not had insurance. So, it’s a blessing to finally turn 65 and have insurance, especially coming off a heart attack a few years earlier, which was very expensive. So yeah…we were doing a happy dance when we got that policy.”
74-year-old, male, Medicare Advantage Beneficiary (Carville, TX)
“I have original Medicare and my supplement is G, which is the best of all the ratings. And other than the deductible that I have to pay every year for Medicare everything else is taken care of. I don’t have to worry about any billing. I never see a bill. I see a chiropractor every month and everything. That’s the only thing I do on a monthly basis and everything is taken care of.”
77-year-old, male, Traditional Medicare Beneficiary with a Medigap Policy (Kansas City, KS)
“I was relieved, however, because I was…under the impression, I bought into the Medicare reputation in that it’s reliable insurance, medical insurance, that would always be there. So, I didn’t have to worry about not having medical insurance.”
78-year-old, female, Medicare Advantage Beneficiary (Upper Marlboro, MD)
Varied reasons for satisfaction depending on source of coverage
Participants cited a variety of reasons for their satisfaction, including costs, access to providers, and supplemental benefits, depending on their source of Medicare coverage.
Participants with traditional Medicare and a Medigap policy are generally happy with their coverage because they like the relatively low cost-sharing requirements, not having to deal with bills, protection against catastrophic expenses, ability to see any provider they want, and having control over their health care.
“I’m happy with what I have and I don’t want limitation on what doctors you can go to. That’s another generally limitation, I think, of the Medicare Advantage program.”
74-year-old, male, Medicare Advantage Beneficiary (Carville, TX)
“I like that I don’t have to wait, if I feel like something is wrong or I need something to be checked out, I don’t have to wait on a doctor to get a referral to go and see…say I feel like I’ve got heart issues or something, I can find the cardiologist, call and make an appointment and go and see a cardiologist. Whereas, with my husband’s plan, he has to go to see his primary care doctor, get a referral to go see his cardiologist. I wanted control over my own health.”
66-year-old, female, Traditional Medicare Beneficiary with a Medigap Policy (Newport News, VA)
“To know that there is no hidden surprises down the road, like some were mentioning they might have to have a surgery, and all of a sudden find that their Advantage plan is not doing as much as they thought they would. And they come up with, maybe $5,000, $6,000, $7,000 bill, which maybe they’re not prepared to pay.”
77-year-old, male, Traditional Medicare Beneficiary with a Medigap Policy (Kansas City, KS)
Medicare Advantage plan participants pleased with their coverage
Participants in Medicare Advantage plans are pleased with their coverage and noted that this was due to having zero or low premiums, and coverage of extra benefits, such as dental, vision, hearing, services and over-the-counter debit cards.
“In Medicare Advantage, I pay $0. In all the 10 years, I didn’t pay anything besides ultrasound on my legs. I used to get $50 over-the-counter medication. Next year it will be $75. That’s the only thing. I pay for nothing. So I believe in it.”
76-year-old, female, Medicare Advantage Beneficiary (Palm Desert, CA)
“We’re very satisfied with our plan…The premium is $0 so it’s tough to beat. Copays are very low…so it’s just a terrific plan for us.”
74-year-old, male, Medicare Advantage Beneficiary (Carville, TX)
“For primary care, you know there’s zero copay and things like that…a decent copay for specialists, which I’m pleased with. And dental…for your cleaning…X-rays, you get once a year with zero copay and there’s a $200 allowance for eyes…if you want to get a pair of glasses every year, which I think that’s reasonable, in a sense…zero copay for the visit and things like that.”
67-year-old, female, Medicare Advantage Beneficiary (Jackson, MS)
Dual-eligible participants also generally satisfied with coverage
Dual-eligible participants – whether they had Medicare coverage through traditional Medicare or a Medicare Advantage plan – are also generally satisfied with their coverage, particularly due to the low cost of their health care.
Dual-eligible individuals feel their health care coverage is affordable and covers most services they need. Most referenced the low out-of-pocket costs for their health care, such as no copays for doctor’s visits and prescriptions, as the primary reasons they were satisfied with their coverage. Some who had their Medicare coverage through a Medicare Advantage plan also were pleased at having coverage of some extra benefits, such as an over-the-counter allowance or money to buy food and produce.
“It really works really well so that I almost have you know, no copays, almost zero deductibles. I’m paying very little out-of-pocket, so…I’m lucky.”
48-year-old, male, Dual-Eligible Individual in Traditional Medicare (New York City, NY)
“I have zero copay. I don’t need referrals to any specialists. And all my medicine is free. I also get $125 a month for over the counter or healthy food. So I’m very happy with that plan.”
72-year-old, female, Dual-Eligible Individual in Medicare Advantage (Delray Beach, FL)
“It paid good. You know paid for everything. I can choose one pair of glasses a year. I had cataract surgery and it paid for my cataract surgery. And if you can find a dentist around here that will take Medicaid, it will pay for a set of dentures and your dental work. And like I say, the county put me on the plan, and it worked really well for me and that’s why I just stayed on it and didn’t look for anything else.”
67-year-old, female, Dual-Eligible Individual in Traditional Medicare (NC)
Despite High Satisfaction, Participants Cited Specific Issues that Varied Depending on their Source of Medicare Coverage
Concerns about premiums
While participants with traditional Medicare and a Medigap policy are generally pleased with their coverage and access to physicians, they had concerns about the premium.
While Medigap limits the financial exposure of Medicare beneficiaries for services covered under Parts A and B, Medigap premiums can be costly and can rise with age, depending on the state in which they are regulated. Estimated average monthly premiums for Medigap policies can range from less than $100 per month to over $300 per month depending on the plan.
“I go right back into the AARP United Healthcare Plan F (when I got Medicare). It covers everything, but it’s not cheap. It’s very expensive. And I’m starting to look at some Advantage Plans and the reason for that is my plan doesn’t cover vision and dental. So, I may want to look at some Advantage Plans that will also cover those.”
71-year-old, male, Traditional Medicare Beneficiary with a Medigap Policy (San Jose, CA)
“We can afford the extra money (for Medigap). What I’m seeking to avoid is a catastrophic medical bill that would basically jeopardize the money we’ve saved for retirement.”
70-year-old, male, Traditional Medicare Beneficiary with a Medigap Policy (Cleveland, OH)
High medical bills for some participants in Medicare Advantage
While many participants with Medicare Advantage are satisfied with their coverage, some with serious medical conditions encountered high medical bills when using certain services.
“I had cancer two years ago and a lot of the bills that I got weren’t covered, some medication wasn’t covered and things like that. And the copays for, I had a lot of scans done, CT scans, MRIs and I had to pay a large co-pay to have those done. So, I did not realize that it was going to be like that until it happened, so I didn’t realize that I was going to have that much money to come out of pocket. But other than that, the plan is good, like I said it’s fine if you don’t get sick.”
73-year-old, female, Medicare Advantage Beneficiary (Palm Coast, FL)
“…I have problems paying my medical because I had so many over the last few years… But the hospital, and I still owe some now, but a lot of times the hospital has forgiven that bill. A couple times I’ve talked to a financial. Now I might have some bills from this surgery still coming up, but yeah, they had a program where they have forgiven. And there’s another issue where sometimes I can’t buy my prescriptions when the time comes and then I have to wait.”
68-year-old, female, Medicare Advantage Beneficiary (Grand Rapids, MI)
“… I had to have cataract surgery in both eyes and surgery on my thumb, and the copays from United were like $350 for each surgery. And Aetna was 225, so I switched.”
72-year-old, female, Medicare Advantage Beneficiary (Pittsburgh, PA)
Delay in care experienced by some participants in Medicare Advantage
Some participants with Medicare Advantage, including some dual-eligible individuals, experienced delays receiving care due to utilization management tools, such as prior authorization and/or referral requirements.
Medicare Advantage plans can require enrollees to get approval from the plan prior to receiving a service, and if approval is not granted, then the plan generally does not cover the cost of the service. Similarly, Medicare Advantage can impose referral requirements, in which a primary doctor must provide a written letter in order for a patient to see a specialist for services, and if not provided, then the plan generally does not cover the cost. In 2023, virtually all Medicare Advantage enrollees (more than 99%) are in plans that require prior authorization for some services. Health insurers use these utilization management tools to both contain spending and prevent enrollees from receiving unnecessary or low-value services, though there are some concerns these requirements may create barriers and delays to receiving necessary care. Some Medicare Advantage participants experienced delays receiving care, but nearly all ultimately got approval for their prior authorization and/or referral requests.
“So I went to my primary care originally when my knee first went, and I knew something was wrong. And then they did an X-ray and like the orthopedic doctor said later on, he said the X-ray showed how bad your knee was, why did they wait? They said because of insurance they had to, I have to have an MRI before they could refer me to orthopedic doctor. It took weeks to get the MRI, and then once they got the MRI, I think it was another two weeks before I actually got into the orthopedic doctor. He was ready to do the surgery immediately, but I had other things I needed to get done. But it could have been done months before. The damage to the bones in my knee where he had to shave it down to get the new knee to fit in, it wouldn’t have been that bad.”
68-year-old, female, Medicare Advantage Beneficiary (Grand Rapids, MI)
“[…] I’ve been, was diagnosed 15 years ago with very severe rheumatoid arthritis. Every medication that I’ve been tried on, I’ve either had an anaphylactic shock reaction and almost died, or I had started vomiting blood copiously within hours of taking it, from stomach leaks. We finally found a medication that I was brave enough to try just one more, and we found one that is working. And it didn’t kill me, and it is helping. But Humana will not cover it, period. It’s expensive. But they’re injections that you get once a month, and two injections once a month, and they won’t pay for it. So they want me to try some other medications for R.A., that I haven’t tried yet, injectables and stuff.”
Dual-Eligible Individual in Medicare Advantage (Largo, FL)
“I have spinal stenosis and I was trying to see a pain management doctor and I had to get a referral from my primary care (doctor), and also my insurance had to approve it. And it took several weeks for me to get that. They were very slow with the process. And in the meantime, I was in pain every day. So I wasn’t happy about that. So I finally got (approval) and then it turns out the pain management doctor referred me to a neurosurgeon. So I had to get another referral for the neurosurgeon. So, the whole process it just took too long.”
73-year-old, female, Medicare Advantage Beneficiary(Palm Coast, FL)
Issues with provider networks
While Medicare Advantage enrollees were generally aware of the importance of having their doctors in-network, many participants encountered situations when the doctor they wanted to see for a particular service was not in-network. Issues with provider networks was also a particular challenge for dual-eligible participants with a Medicare Advantage plan who sometimes could not find a provider who accepted both their Medicare and Medicaid coverage.
Unlike traditional Medicare, where Medicare beneficiaries can see any provider who accepts Medicare, beneficiaries enrolled in Medicare Advantage have a network of physicians and hospitals for their care. If providers are not in-network, Medicare Advantage enrollees typically must pay more to see out-of-network providers, or they may be responsible for the entire cost of seeing that provider. When beneficiaries select their Medicare Advantage plan, they are encouraged to check whether their preferred providers are in-network as provider networks vary across plans. However, evidence indicates provider directories might not always be accurate, and it may be difficult for beneficiaries to compare networks and providers across plans as they may be in different formats across insurers. Focus group participants noted situations when they could not see their preferred doctor because they were not in their plan network and were frustrated with having to see a different provider.
In addition, some dual-eligible participants with a Medicare Advantage plan, including participants with a dual-eligible Special Needs Plan (D-SNP), reported issues with doctors accepting their health insurance policy. D-SNPs are a specific type of Medicare Advantage plan designed for this population to better coordinate care, though these plans can also look different across states in terms of their levels of coordination. For example, some D-SNPs offer Medicaid and Medicare benefits through different organizations, while some have plans through the same parent company.
“Well, you have to go to the doctors that are in the plan. For example, I wanted to go see another doctor, because of (I needed) laparoscopy, and I had to go to a doctor that the insurance plan assigned. I couldn’t go to the doctor I wanted to go to.”
-68-year-old, female, Spanish speaking, Medicare Advantage Beneficiary (Katy, TX)
“My current insurance, I can’t find a psychiatrist in my area to go see to prescribe the anti-anxiety, so I’m dealing with that right now. I looked at, since we’re still in open enrollment, I looked at different plans, and there’s nobody here in my area that supports a psychiatrist who will be willing to prescribe those types of meds.”
Dual-Eligible Individual in Medicare Advantage (Largo, FL)
“You try to find a plan that takes your doctors and your medication and that was the most difficult. I must have gone through three or four different plans in the first year, because I didn’t understand how those plans worked and if they had what doctors I wanted on there.”
Dual-Eligible Individual in Medicare Advantage (Gainesville, FL)
“It’s been pretty much the same, although I have changed companies several times. Probably maybe four times altogether…Well one time was that my primary care doctor stopped accepting the Medicare policy, the company that I was using, and I didn’t want to lose my primary at that time. Another time was about paying bills and turning down things that should have been covered, copays and stuff that should have been covered under my Dual policy. And they kept trying to bill me for and threaten me about it, and it’s like no. So mostly just non-cooperation with the insurance company for the most part.”
Dual-Eligible Individual in Medicare Advantage (Largo, FL)
Frustration with using some supplemental benefits
Some Medicare Advantage enrollees also voiced frustration with using some supplemental benefits, particularly dental coverage, because cost sharing was higher than expected and due to network restrictions. Network restrictions for extra benefits were also challenging for dual-eligible participants who had a Medicare Advantage plan.
Many people are attracted to Medicare Advantage plans because they offer extra benefits that traditional Medicare does not offer, such as dental, vision, and hearing coverage. However, some participants raised concerns with the costs of these benefits, challenges using these benefits, or finding a provider who covered these services. Like accessing providers covered by Medicare Advantage plans, many Medicare Advantage plans have networks of providers who cover supplemental benefits, or the enrollee will be required to pay more to see someone out-of-network, such as for dental benefits.
“I am not happy because every year they charge more for copayment, for example, the dental…I had to leave my dentist because they don’t pay them enough, and I have to go to the one they want me to go.”
72-year-old, female, Spanish speaking, Medicare Advantage Beneficiary (Sacramento, CA)
“I am not satisfied with my dental plan. It’s not very good, the coverage is bad and when we go to the dentist, they say there is a copayment. The plan I have it’s not very good.”
73-year-old, male, Spanish speaking, Medicare Advantage Beneficiary (Miami, FL)
“When…my upper denture broke, nobody took the insurance that I had and I finally got it fixed. And my optometrist where I just get my eye exam and glasses every year, he just stopped taking Medicaid and Medicare, and I haven’t found a replacement yet.”
66-year-old, female, Dually Eligible Beneficiary in Medicare Advantage (Gainesville, FL)
“Yes, I’ve encountered problems with, you know, they’re like we’ll take regular CareSource, but we don’t take the Dual…I’ve had where, you know I was seeing, went to a dentist and then the next thing I know they’re just like, you know something’s going on with your insurance and I’m thinking it wasn’t the insurance, it was just like you know it was actually the provider, and having, you know having an issue, and it’s just like oh forget this and I’ve had to find somebody else. But it’s like it can be difficult with finding providers that take the Dual plan.”
43-year-old, female, Dual-Eligible Individual in Medicare Advantage (Youngstown, OH)
Frustration with high cost of certain medications
Some participants were also frustrated by the high cost of certain medications, particularly for those who need specific drugs to manage chronic conditions.
In recent years, many Medicare beneficiaries have experienced high out-of-pocket costs for their prescription drugs. Changes as part of the Inflation Reduction Act, including a $35 monthly copay on insulin that went into effect in 2023, as well as limits on out-of-pocket prescription drug spending in Part D beginning in 2024, and a $2,000 cap beginning in 2025, will help some Part D enrollees with their prescription drug costs.
“…I suffer from anxiety, and there is a medication that none of the insurances I have covers. I have to pay for it on my own. And that is a problem. None of the insurances I’ve had have wanted to pay for that medicine.”
70-year-old, female, Spanish speaking, Medicare Advantage Beneficiary (Las Vegas, NV)
“I’m diabetic. So, they wanted me to go on Trulicity and if you fill it, it puts you, right after one time, you’re in the donut hole. And I said, I just can’t afford it. I want medicines that don’t cost me anything.”
72-year-old, female, Medicare Advantage Beneficiary (Pittsburgh, PA)
“Yes, (my parents have Part D) but there are certain medications that weren’t covered if it was the generic one, and they didn’t have that medication. So, we had we had to pay for it.”
46-year-old, female, Spanish speaking, Proxy on Behalf of Traditional Medicare Beneficiaries (Fort Lauderdale, FL)
Participants Generally Feel They Made the Right Choice When Selecting a Plan, and Most Participants Have Not Revisited Their Plan Choices
The marketplace of Medicare private plans is based on the idea that beneficiaries will compare their plan options to find plans that best meet their individual needs. CMS encourages beneficiaries to compare and review their plan options each year, which could enable them to receive care at a lower cost, ensure their preferred providers are in network, and that the prescription drugs they take are covered. However, KFF analysis has shown that most beneficiaries do not compare their plan options in each year.
Majority feel they made the right choice
The majority of participants in the focus groups confirmed this behavior – they explained that they felt that their coverage was comprehensive and did not need to reevaluate their coverage every year though some wish they had more information before enrolling. Additionally, many participants said they are unlikely to switch plans going forward because selecting a new plan would be too much work, and they did not feel confident they would be better off with another type of coverage. For dual-eligible participants who made a choice about their Medicare coverage, they also generally did not feel the need to switch plans going forward.
“I have no concerns about my coverage, everything works well for me. Even the co-payment, it’s not a large amount, but I can handle it…I like it because I can go to any doctor I want. Everything is great…I have no complaints about my coverage, none whatsoever.”
75-year-old, female, Traditional Medicare Beneficiary (Las Vegas, NV)
“Every year, right, I can always change, but I’ve never changed because like I said, for me if it ain’t broke don’t fix it. Why would I change because it’s been so nice, I’ve stayed with the same provider all the way through.”
48-year-old, male, Dual-Eligible Individual in Traditional Medicare (New York City, NY)
“I’m happy with the plan that I have now, and I haven’t looked at anything else. So, I don’t even know if I could (change) or not.”
74-year-old, female, Dual-Eligible Individual in Medicare Advantage (Cuyahoga Falls, OH)
But some say they shop around
However, a few of the participants said they do shop around, sometimes every year, to ensure they continue to have the best plan that meets their needs.
“We meet with an insurance man every year who looks at our prescriptions and then checks to see the best company that we can be with for those prescriptions that we have. And so we sometimes change companies every year based on the premium and the deductible and the prescription costs every time we order by mail order. And he’s looked…it pays to check every year to see what’s coming along.”
77-year-old, male, Traditional Medicare Beneficiary with a Medigap Policy(Kansas City, KS)
“I’m always looking for a better plan because I’m not that happy with what I have. But I’m just checking to see about the out-of-pocket and copays that other companies are charging as compared to what I have.”
73-year-old, female, Medicare Advantage Beneficiary (Palm Coast, FL)
“I take a legal pad and list two or three companies. And I itemize how many doctor visits, specialist visits, dental for the year and figure (the cost to me) – this company will cost me $1,000, this costs me $2,000, where I want to go. I’m pretty thorough about it.”
72-year-old, female, Medicare Advantage Beneficiary (Pittsburgh, PA)
Experiences Unique to Dual-Eligible Participants
People with both Medicare and Medicaid, also referred to as dual-eligible individuals or dual eligibles are enrolled in both programs and must meet eligibility requirements for both programs. They receive their primary health insurance coverage through Medicare and some assistance from their state Medicaid program. Together, these two programs help to shield low-income beneficiaries from potentially unaffordable out-of-pocket medical and long-term care costs: Medicaid typically pays the Medicare Part B premium and may also pay for Medicare’s other cost-sharing requirements; Medicaid also helps pay for services that are not covered by Medicare, such as long-term services and supports. While nearly all dually eligible beneficiaries have low incomes and very modest savings, they are otherwise a diverse group in terms of age and physical and mental health.
To capture the unique experiences faced by dual-eligible individuals, we conducted two focus groups that consisted exclusively of these beneficiaries.
Dual-Eligible Participants Had Varying Experiences Signing Up for Medicaid Coverage With Some Participants Choosing Coverage and Others Being Assigned Their Coverage
As mentioned above, people with Medicare have the choice between traditional Medicare or a Medicare Advantage plan, which can include an individual plan open for general enrollment as well as a dual-eligible Special Needs Plan (D-SNP). Dual-eligible individuals who are eligible for full Medicaid may receive those Medicaid benefits through capitated managed care organizations (MCOs) or through fee-for-service (FFS). Options for Medicaid coverage vary depending on the state that the enrollee lives in as do the mechanisms for beneficiary enrollment. Some states provide dual-eligible individuals with the ability to choose their plans, others assign people to a plan, and still others assign enrollees to a plan but offer them the opportunity to disenroll and select a different option.
As a result, participants had varying experiences signing up for Medicaid coverage, often depending on the state they lived in and whether they had enrolled in Medicare or Medicaid first or at the same time.
Making a choice for Medicaid coverage
Some participants had to make a choice for their Medicaid coverage, and many had help from the state choosing their plan.
“I give full credit to the State of New York for the way that their coverage is set up here, because when you reenroll every year, you call a certain number and the person on the other end…I remember when I first enrolled they kind of walk you through the process, and they told you, they look for the providers that were the best and then just kind of walked you through it. So to answer your question, it’s always been very laid out very nicely.”
48-year-old, male, Dual-Eligible Individual in Traditional Medicare (New York City, NY)
“I went to the county, the office here in the county and applied. I had both knees were really bad and I knew I was getting to the point. They told me I was going to have to quit work and going to have to have knee replacements. So, I went to the county office here and applied, applied for the Medicaid here in the county.”
67-year-old, female, Dual-Eligible Individual in Traditional Medicare (NC)
Some participants did not have a choice
Some participants did not have a choice of their Medicaid coverage, or someone enrolled them in Medicaid coverage – often the state or county chose their Medicaid plan for them.
“I didn’t have a choice as to which (Medicaid) plan. You know the plan was chosen for me. It was out of my hands… I don’t know if it’s the state of Ohio, or the Summit County that I live in, whether they made the choice for me.”
74-year-old, female, Dual-Eligible Individual in Medicare Advantage (Cuyahoga Falls, OH)
“The state where I live, the county made the choice and I’ve not messed with anything, I let them do the choices. I get a lot of this stuff in the mail to change to Medicare this and Medicare that. I don’t touch anything, I let them do everything so it will stay the same. I’m afraid I would mess it up if I tried to go through and do something different.”
67-year-old, female, Dual-Eligible Individual in Traditional Medicare (NC)
“Initially when I first went on Medicaid there was just one state plan. In recent years they’ve gone to, where I could choose between, I don’t know I want to say like five different providers. And I didn’t choose, I just stayed on what I initially had, so I’m not exactly sure what provider I’m with when it comes to Medicaid. Now as far as the Medicare, the only choice I had was either traditional or the Advantage and I got traditional.”
56-year-old, female, Dual-Eligible Individual in Traditional Medicare (Benson, NC)
Some Medicare enrollees did not realize they might also be eligible for Medicaid
Some who were enrolled in Medicare did not realize they might also be eligible for Medicaid, but their state reached out to them to let them know they should apply for Medicaid coverage.
“I got Medicare A and B first and then Medicaid sent me a form telling me to apply for Medicaid.”
61-year-old, female, Dual-Eligible Individual in Traditional Medicare (Buffalo, NY)
“We enrolled her in Medicare first, and then we found out that she could supplement her Medicare with the Medicaid, and so we did that…She actually got a letter letting her know that she could apply for the additional Medicaid coverage. And here in Texas what it does is it basically covers what Medicare doesn’t, so like your doctor copays, remaining hospital and all that.”
46-year-old, male, Proxy on Behalf of Dual-Eligible Individual in Traditional Medicare (Odessa, TX)
Some Dual-Eligible Participants Were Concerned About the Possibility of Losing Medicaid Coverage Due to the Annual Redetermination Process
Concerns about redetermination process
Because of the importance of the Medicaid program for addressing their health care needs, some dual-eligible participants were concerned about the redetermination process and anxious about the possibility of losing that coverage.
Prior to the COVID-19 pandemic, states were required to renew Medicaid eligibility for dual-eligible individuals at least once per year. Since March 2020, states have provided continuous enrollment in Medicaid in exchange for enhanced federal funding. This continuous enrollment provision and enhanced federal funding were originally in place until the end of the COVID-19 public health emergency (PHE). In December 2022, the Consolidated Appropriations Act, 2023 (CAA) delinked the provision from the PHE and ended continuous enrollment on March 31, 2023. Beginning April 1, 2023, states have restarted disenrollments after conducting a full review of eligibility. As states begin to “unwind” the continuous enrollment provision, many people will likely be found to be no longer eligible for Medicaid. Others could face administrative barriers and lose coverage despite remaining eligible.
Focus group participants generally had not experienced a loss of Medicaid, but some participants mentioned being concerned with losing their Medicaid coverage in the future due to changes in their incomes, assets, or other eligibility requirements. Many were aware of the renewal requirements even though redeterminations had been on hold during the pandemic.
“You can’t have a lot of assets or a like a lot of money to get help. If you do, you don’t get a lot of help. You just got, you know you’re only allowed so much in the bank. You’re only allowed one track of property, two cars, and that’s it. If you go over, they will stop your Medicaid and cut it out.”
67-year-old, female, Dual-Eligible Individual in Traditional Medicare (NC)
“I have to renew it (my Medicaid) every year…I have to be poverty stricken in order to be qualified.”
72-year-old, female, Dual-Eligible Individual in Medicare Advantage (Delray Beach, FL)
“I also get the food stamps and now… that’s tied together with Medicaid that I renew every year.”
66-year-old, female, Dual-Eligible Individual in Medicare Advantage (Gainesville, FL)
Discussion
As more people on Medicare are enrolled in Medicare Advantage, CMS, policymakers, researchers, and the public have become more focused on how the program is serving people on Medicare. Participants across the spectrum of coverage noted that they experienced aggressive marketing tactics, including unsolicited phone calls, and felt inundated by Medicare television advertising, often for Medicare Advantage plans, that they believed to be both misleading and unhelpful.
Participants with Medicare found the process of selecting their coverage to be overwhelming and difficult, and often relied on brokers to help them review and understand their coverage options. Few participants used Medicare’s official resources to assist in their decision-making. When choosing their coverage, participants said they valued a variety of factors, including premiums and other costs, access to preferred providers, availability of extra benefits, and coverage of prescription drugs.
Participants in the focus groups – whether in traditional Medicare or Medicare Advantage – emphasized that they are generally satisfied with their Medicare coverage. Participants in Medicare Advantage plans were pleased with their coverage due to the low or no premium costs, as well as the availability of extra benefits, such as dental, vision, hearing, and debit cards. Participants with traditional Medicare and a Medigap policy were happy with their coverage due to the low or no cost-sharing requirements, no network restrictions on seeing their preferred providers, and the ability to control their own health care.
However, some participants, particularly in Medicare Advantage plans, also noted that there are elements of their coverage that caused them frustration, including delays receiving care due to prior authorization and referral requirements as well as facing limitations in seeing their preferred doctors due to limited networks. In recent months, CMS and policymakers have sought to address some of these issues through both legislation and rulemaking, including rules that would streamline the prior authorization process and place additional limitations on Medicare marketing.
Most dual-eligible participants who have both Medicare and Medicaid said they are satisfied with their coverage, whether in Medicare Advantage or traditional Medicare, though some in Medicare Advantage encountered problems finding a provider in their plan’s network. Further, some participants with Medicaid were uniquely concerned about maintaining their Medicaid eligibility and were anxious about losing Medicaid during the annual redetermination process. With Medicaid redeterminations having restarted April 1, states may have begun disenrollments, which could lead to some losing their coverage, though it is unclear how much that would impact focus group participants who generally had not experienced a loss of coverage prior to the pandemic.
In making coverage decisions, participants say they were annoyed by marketing calls and the number of ads marketing Medicare plans on TV, and generally ignored them. Few participants said they intend to review or switch their coverage. While focus group participants were generally satisfied with their Medicare coverage, most were also confused and frustrated by the complexity of the program and lacked confidence in their own ability to compare and choose a source of coverage to best meet their individual needs.
Appendix
The focus group participants included Medicare beneficiaries ages 65 and older and younger adults with disabilities who make health coverage decisions for themselves and/or their spouse or family member. Some focus groups also consisted of people with both Medicare and Medicaid (also referred to as dual-eligible individuals) as well as adults 64 years old who were not yet enrolled in Medicare. Participants included beneficiaries in traditional Medicare, some with and some without Medigap supplemental coverage, and beneficiaries enrolled in Medicare Advantage plans. Because the study focused on decisions around health plans, we excluded beneficiaries with retiree coverage from a former employer or union.
We conducted 7 focus groups with participants from across the country in November 2022, timed to coincide with the Medicare open enrollment period, which starts October 15 and ends December 7 of each year. Each focus group was conducted virtually by Zoom and included 5-8 participants, differing by age, gender, income, race/ethnicity, health status, and type of insurance coverage. Each focus group lasted one hour and forty-five minutes. Two of the seven focus groups consisted of people with Medicare and Medicaid, with one group consisting of adults 65 and older, and the other group adults younger than 65. One focus group included adults 64 years old who were not yet enrolled in Medicare, but who were starting to think about their Medicare coverage options. One focus group was conducted in Spanish. Individuals who were able to participate in the groups needed to know their Medicare coverage, and if applicable, Medicaid coverage, have two hours of time, a quiet space, a computer, and internet. These characteristics alone may not fully represent many people with Medicare, so the perspectives described in this report may not be generalizable to the entire Medicare population. See Appendix Table 1 for demographic details about the participants.
The analysis includes responses from participants across all 7 focus groups. There are also additional responses from dual-eligible participants that emphasize beneficiary experiences unique to this population.