Amid Unwinding of Pandemic-Era Policies, Medicaid Programs Continue to Focus on Delivery Systems, Benefits, and Reimbursement Rates
Results from an Annual Medicaid Budget Survey for State Fiscal Years 2023 and 2024
Overview
This annual Medicaid budget survey report highlights certain policies in place in state Medicaid programs in state fiscal year (FY) 2023 and policy changes implemented or planned for FY 2024. The findings are drawn from the 23rd annual budget survey of Medicaid officials conducted by KFF and Health Management Associates (HMA), in collaboration with the National Association of Medicaid Directors (NAMD).
Medicaid budget survey reports from prior years are available in our archives.
NEWS RELEASE
- A news release announcing the publication of the 2023 Medicaid Budget Survey is available.
EXECUTIVE SUMMARY
- The Executive Summary provides an overview of the 2023 survey results and is available under the Executive Summary tab.
FULL REPORT
- The complete 2023 Medicaid Budget Survey Report is available under the Report tab. The Report tab contains 7 separate sections. Users can view each section separately or download a full Report PDF from the right side of the page.
ENROLLMENT & SPENDING BRIEF
- This companion issue brief provides an overview of Medicaid enrollment and spending growth with a focus on FY 2023 and FY 2024.
WEB BRIEFING
- A recording of a November 14 web briefing highlighting key findings from the 2023 report is available.
ADDITIONAL BRIEFS
- Additional briefs using 2023 Medicaid budget survey data are published separately:
Executive Summary
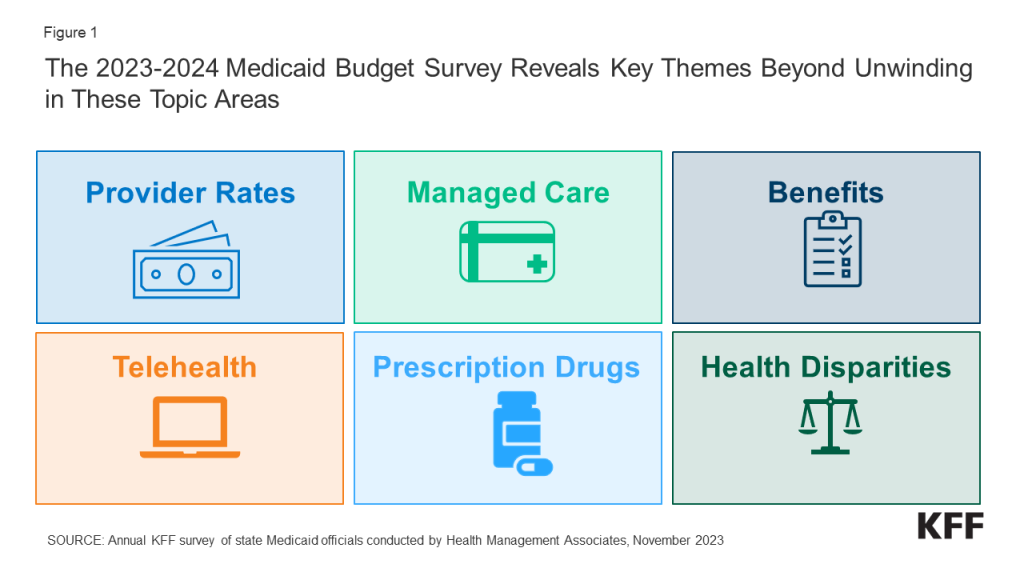
The COVID-19 pandemic profoundly affected Medicaid enrollment, spending, and policy. The pandemic also focused policy attention on longstanding issues resulting in new efforts to reduce health disparities, expand access to care through the use of telehealth, improve access to behavioral health and home and community-based services, and address workforce challenges. Serving more than 90 million low-income Americans and accounting for one-sixth of health care spending (and half of long-term care spending) and a large share of state budgets, Medicaid is a key part of the overall health care system. While the unwinding of the pandemic-related continuous enrollment provision and enhanced federal match rate were the dominant Medicaid policy issues at the end of state fiscal year (FY) 2023 and headed into FY 2024, states were also focused on an array of other priorities that range from core program operations and the unwinding of other pandemic-related emergency policies to developing and implementing new initiatives (Figure 1).
This report highlights certain policies in place in state Medicaid programs in FY 2023 and policy changes implemented or planned for FY 2024, which began on July 1, 2023 for most states.1 The findings are drawn from the 23rd annual budget survey of Medicaid officials in all 50 states and the District of Columbia conducted by KFF and Health Management Associates (HMA), in collaboration with the National Association of Medicaid Directors (NAMD). Overall, 48 states responded to this year’s survey, although response rates for specific questions varied.2 States completed this survey in mid-summer of 2023. Given differences in the financing structure of their programs, the U.S. territories were not included in this analysis.
Key Take-Aways
Provider Rates and Managed Care
- States had implemented (in FY 2023) and were planning (in FY 2024) more fee-for-service (FFS) rate increases than rate restrictions. States reported rate increases more often for nursing facilities and home and community-based services (HCBS) providers than for other provider categories, with several states reporting substantial increases—likely in response to ongoing workforce or staffing-related challenges. In addition, nearly half of states (23) reported increasing primary care physician rates in FY 2023 and nearly two-thirds of states (30) reported plans to do so in FY 2024, representing an increase relative to surveys in recent years. More than three-quarters of states also reported rate increases for behavioral health (mental health and substance use disorder) providers. While the survey only captures changes in FFS reimbursement rates, these rates remain important benchmarks for managed care payments in most states, often serving as the state-mandated payment floor.
- Nearly two-thirds of states that contract with managed care plans reported implementing “risk corridors” to manage pandemic-related uncertainty, and most of these states recouped or expect to recoup funds from managed care plans as a result. Capitated managed care remains the predominant delivery system for Medicaid in most states. As of July 2023, 41 states were contracting with managed care organizations (MCOs). To help respond to utilization shifts and uncertainties in setting capitation payments, the Centers for Medicare & Medicaid Services (CMS) encouraged states to implement two-sided risk mitigation strategies, including risk corridors, for rating periods impacted by the public health emergency (PHE). Risk corridors allow states and health plans to share profit or losses if spending falls above or below specified thresholds. Nearly two-thirds of responding MCO states (23 of 37) reported implementing a pandemic-related MCO risk corridor since March 2020; more than three-quarters (18) of these states reported that they have or will recoup funds from managed care plans.
Benefits and Prescription Drugs
- Most states continue to implement benefit enhancements, particularly for mental health and/or substance use disorder (SUD) services. In addition, to improve maternal and infant health outcomes and address racial/ethnic health disparities, states continue to expand and enhance pregnancy and postpartum services. States dramatically expanded the use of telehealth during the pandemic, and while telehealth coverage policies have now largely stabilized, states continued to report telehealth coverage expansions in FY 2023 and FY 2024.
- Sixteen states reported Medicaid FFS coverage of at least one weight-loss medication for the treatment of obesity for adults as of July 2023. While Medicaid programs must cover nearly all Food and Drug Administration (FDA) approved drugs from manufacturers that have entered into a federal rebate agreement, a long-standing statutory exception allows states to choose whether to cover weight-loss drugs under Medicaid. Some states may be re-evaluating their coverage of weight-loss drugs due to the emergence of a new group of highly effective anti-obesity or weight-loss agents known as GLP-1 (glucagon-like peptide-1) agonists, including Ozempic, Rybelsus, Wegovy, and Mounjaro. (Ozempic, Rybelsus, and Mounjaro are drugs approved to treat diabetes, and covered by Medicaid for that purpose in all states; off-label coverage for weight loss in Medicaid may be limited.) Expanding coverage of weight-loss drugs under Medicaid would increase access to these medications that remain unaffordable or inaccessible for many but, at the same time, would likely contribute to increases in Medicaid drug spending. Rising prescription drug costs are an ongoing concern for states and over two-thirds of states reported at least one new or expanded initiative to contain prescription drug costs in FY 2023 or FY 2024. Efforts to implement or expand value-based arrangements (VBAs) with pharmaceutical manufacturers were the most frequently mentioned cost containment initiative across states.
Social Determinants of Health and Reducing Health Disparities
- A number of states are expanding or enhancing Medicaid coverage to help address enrollee social determinants of health (SDOH) or associated health-related social needs (HRSN). In 2022, CMS released a new framework for covering HRSN services under Section 1115, expanding flexibility for states to add certain short-term housing and nutrition supports as Medicaid benefits and subsequently approved waivers in four states (Arizona, Arkansas, Massachusetts, and Oregon). In 2023, CMS approved additional HRSN waivers in Washington and New Jersey. Looking ahead, one quarter of states cited addressing health-related social needs as a key priority.
- States are implementing strategies to reduce racial and ethnic health disparities, including through changes in managed care contracts. Some state MCO contracts incorporate requirements to reduce health disparities and states may also tie MCO financial quality incentives (e.g., performance bonuses, withholds, or value-based state directed payments) to reducing health disparities. States must require MCOs to implement performance improvement projects (PIPs) to examine access to and quality of care, and these projects often include analysis of health disparities.
Heading into FY 2024, states were focused on unwinding of the continuous enrollment provision in Medicaid but also on addressing other key priorities. States were employing a variety of strategies designed to maintain coverage for eligible individuals and mitigate “procedural” terminations that occur when individuals do not return or complete renewal forms or respond to requests for information. In addition to managing the enormous undertaking of unwinding, states highlighted addressing provider and state workforce shortages, expanding access to behavioral health and long-term services and supports (LTSS), and implementing broader delivery system and value-based initiatives as both key priorities and challenges. A smaller number of states mentioned addressing health-related social needs, improving provider reimbursement rates and/or performing rate studies, implementing initiatives to improve maternal and child health, and expanding eligibility as key priorities. While most states are in a strong fiscal position, many Medicaid directors expressed concern regarding their longer-term fiscal outlook due to the expiration of pandemic-era federal funding and economic factors including slowing revenue growth, inflationary pressures, and workforce challenges.
Acknowledgements
Pulling together this report is a substantial effort, and the final product represents contributions from many people. The combined analytic team from KFF and Health Management Associates (HMA) would like to thank the state Medicaid directors and staff who participated in this effort. In a time of limited resources and challenging workloads, we truly appreciate the time and effort provided by these dedicated public servants to complete the survey and respond to our follow-up questions. Their work made this report possible. We also thank the leadership and staff at the National Association of Medicaid Directors (NAMD) for their collaboration on this survey. We offer special thanks to Jim McEvoy and Karis Burnett at HMA who developed and managed the survey database and whose work is invaluable to us.
Introduction
Nationwide, Medicaid provided health insurance coverage to more than one in five Americans in 2022 and accounted for nearly one-sixth of all U.S. health care expenditures. At the start of the pandemic, Congress enacted the Families First Coronavirus Response Act, which included a requirement that Medicaid programs keep people continuously enrolled through the end of the COVID-19 PHE, in exchange for enhanced federal funding. As a result, total Medicaid/Children’s Health Insurance Program (CHIP) enrollment grew substantially, peaking at 94.5 million people in April 2023, the month following the end of continuous enrollment – an increase of 23.1 million enrollees or 32.4% from February 2020. The uninsured rate also dropped. As of July 2023, total Medicaid/CHIP enrollment was 91.5 million.
The Consolidated Appropriations Act, 2023, signed into law on December 29, 2022, delinked the continuous enrollment provision from the PHE (ending it on March 31, 2023) and phased down the enhanced federal Medicaid matching funds through December 2023. States were given up to 12 months to initiate, and 14 months to complete, an eligibility renewal for all Medicaid- and CHIP-enrolled individuals following the end of the continuous enrollment requirement—a process commonly referred to as “unwinding.” The volume of redeterminations coupled with eligibility workforce shortages, systems issues, and enhanced outreach efforts present challenges for states in implementing the unwinding. Millions are expected to lose Medicaid during the unwinding, potentially reversing recent improvements in the uninsured rate, though not everyone who loses Medicaid will become uninsured. While states could begin disenrolling people starting April 1, 2023, many did not resume disenrollments until May, June, or July.
This report draws upon findings from the 23rd annual budget survey of Medicaid officials in all 50 states and the District of Columbia conducted by KFF and Health Management Associates (HMA), in collaboration with the National Association of Medicaid Directors (NAMD). (Previous reports are archived here.) This year’s KFF/HMA Medicaid budget survey was conducted from June through September 2023 via a survey sent to each state Medicaid director in June 2023 and then a follow-up telephone interview. Overall, 48 states responded by October 2023,3 although response rates for specific questions varied. The District of Columbia is counted as a state for the purposes of this report. Given differences in the financing structure of their programs, the U.S. territories were not included in this analysis. The survey instrument is included as an appendix to this report.
This report examines Medicaid policies in place or implemented in FY 2023, policy changes implemented at the beginning of FY 2024, and policy changes for which a definite decision has been made to implement in FY 2024 (which began for most states on July 1, 20234 ). Policies adopted for the upcoming year are occasionally delayed or not implemented for reasons related to legal, fiscal, administrative, systems, or political considerations, or due to CMS approval delays. Key findings, along with state-by-state tables, are included in the following sections:
Delivery Systems
Context
For more than two decades, states have increased their reliance on managed care delivery systems with the aim of improving access to certain services, enhancing care coordination and management, and making future costs more predictable. State managed care contracts vary widely, in the populations required to enroll, the services covered (or “carved in”), and the quality and performance incentives and penalties employed. Most states contract with risk-based managed care organizations (MCOs) that cover a comprehensive set of benefits (acute care services and sometimes long-term services and supports), but many also contract with limited benefit prepaid health plans (PHPs) that offer a narrow set of services such as dental care, non-emergency medical transportation (NEMT), or behavioral health services. Managed care plans are at financial risk for the services covered under their contracts and receive a per member per month “capitation” payment for these services. A minority of states operate primary care case management (PCCM) programs which retain fee-for-service (FFS) reimbursements to providers but enroll beneficiaries with a primary care provider who is paid a small monthly fee to provide case management services in addition to primary care.
MCO capitation rates are typically established prospectively for a 12-month rating period, regardless of changes in health care costs or utilization.5 However, as pandemic-related enrollment increased, utilization decreased, and other cost and acuity changes began to emerge in 2020, CMS allowed states to modify managed care contracts and many states implemented COVID-19 related “risk corridors” (where states and health plans agree to share profit or losses), allowing for the recoupment of funds. States and plans are now facing another period of heightened fiscal uncertainty due to the expiration of the continuous enrollment period. Medicaid MCOs may see overall average member acuity increase, since people who need more health care may be more likely to stay enrolled, which could result in higher per member utilization and costs.
Medicaid programs can help to address health disparities. In late 2021, CMS published its strategic vision for Medicaid and CHIP which identified equity and reducing health disparities as key focus areas. Some state MCO contracts incorporate requirements to advance health equity and states may also tie MCO financial quality incentives (e.g., performance bonuses, withholds, or value-based state directed payments) to reducing health disparities. States must require MCOs to implement performance improvement projects (PIPs) to examine access to and quality of care, and these projects often include analysis of health disparities.
This section provides information about:
- Managed care models
- Pandemic-related MCO risk corridors
- Strategies to reduce health disparities
Findings
Managed Care models
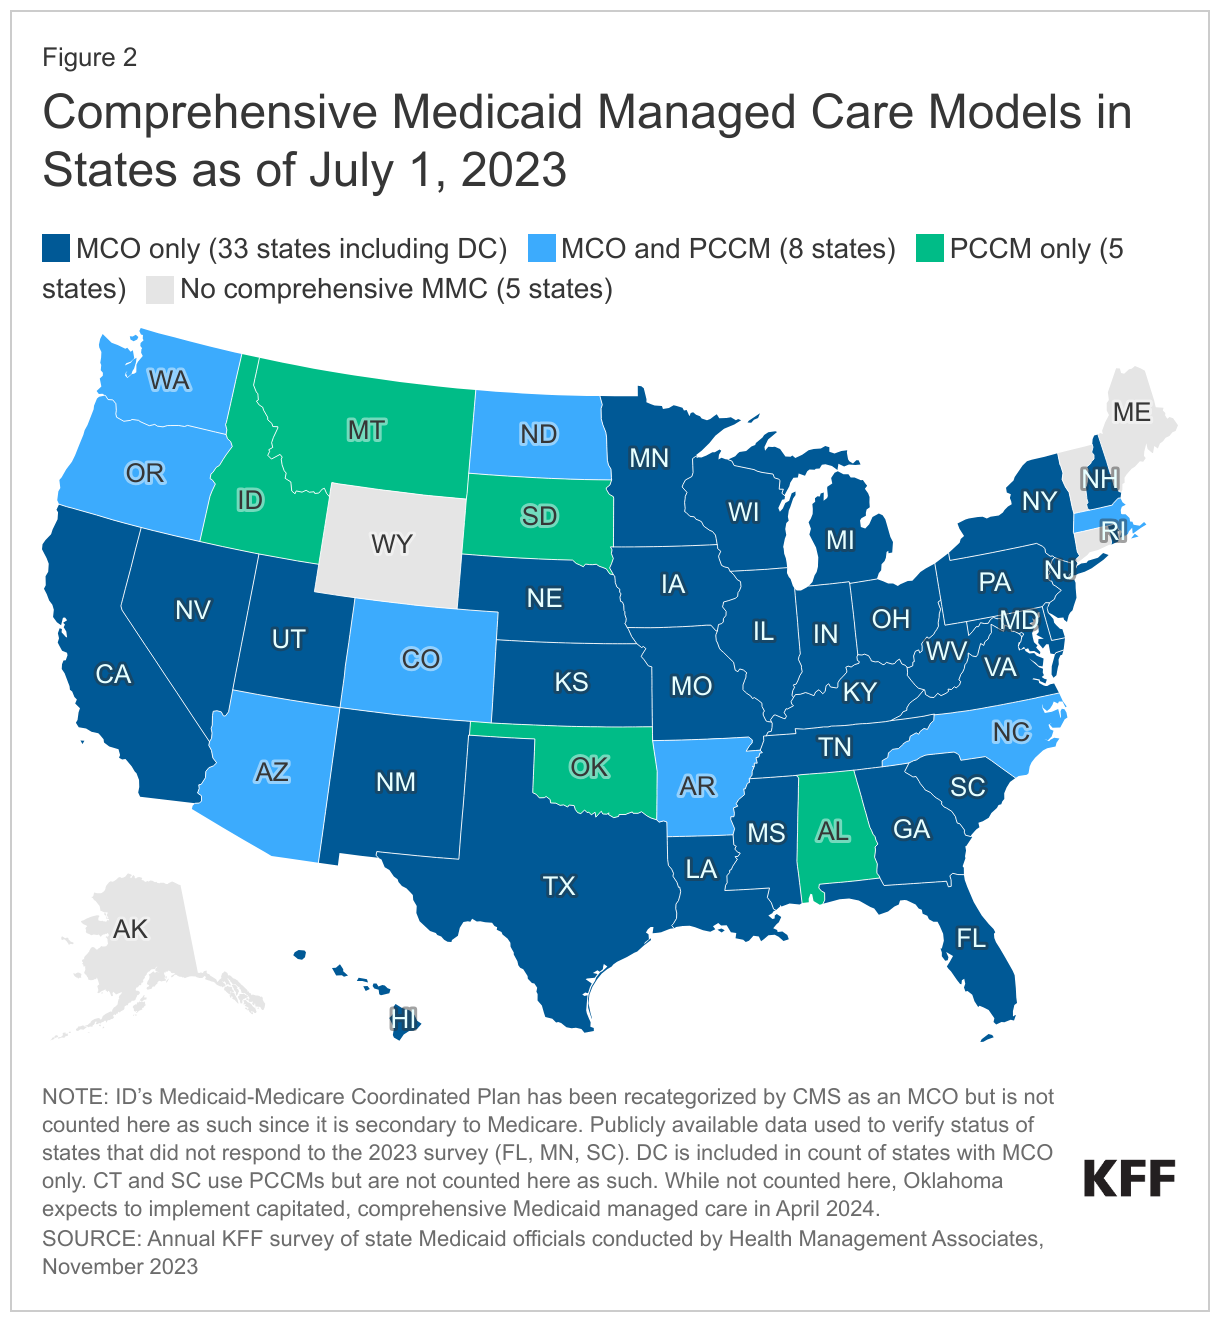
Capitated managed care remains the predominant delivery system for Medicaid in most states. As of July 1, 2023, all states except five – Alaska, Connecticut,6 Maine, Vermont,7 and Wyoming – had some form of managed care (MCOs and/or PCCM) in place (Figure 2). As of July 1, 2023, 41 states8 were contracting with MCOs (unchanged from 2022); only two of these states (Colorado and Nevada) did not offer MCOs statewide (although Nevada reported plans to expand MCOs statewide in 2026). Thirteen states reported operating a PCCM program (with the addition of Oregon), although North Dakota reported plans to end its PCCM program in December 2023.9 While not counted in this year’s report, following the passage of SB 1337,10 Oklahoma expects to implement capitated, comprehensive Medicaid managed care in April 2024.11 The state announced its selection of three managed care plans to deliver services in June 2023.
Of the 46 states that operate some form of comprehensive managed care (MCOs and/or PCCM), 33 states operate MCOs only, five states operate PCCM programs only, and eight states operate both MCOs and a PCCM program. In total, 28 states12 were contracting with one or more limited benefit prepaid health plans (PHPs) to provide Medicaid benefits including behavioral health care, dental care, vision care, non-emergency medical transportation (NEMT), or long-term services and supports (LTSS).
Pandemic-Related MCO Risk Corridors
The COVID-19 pandemic caused major shifts in utilization across the health care industry that could not have been anticipated and incorporated into MCO capitation rate development (especially in 2020 and 2021). CMS encouraged states to implement two-sided risk mitigation strategies, including risk corridors, for rating periods impacted by the PHE. Risk corridors allow states and health plans to share profit or losses (at percentages specified in plan contracts) if aggregate spending falls above or below specified thresholds (“two-sided” risk corridor). Risk corridor thresholds may be tied to a target medical loss ratio (MLR). Risk corridors may cover all/most medical services (and enrollees) under a contract or may be more narrowly defined, covering a subset of services or enrollees. On this year’s survey, states were asked whether they had implemented a pandemic-related MCO risk corridor at any time since March 2020 and whether the state has or will recoup MCO payments made for 2020, 2021, or 2022. (State MCO contract periods may be on a calendar year, fiscal year, or another period.)
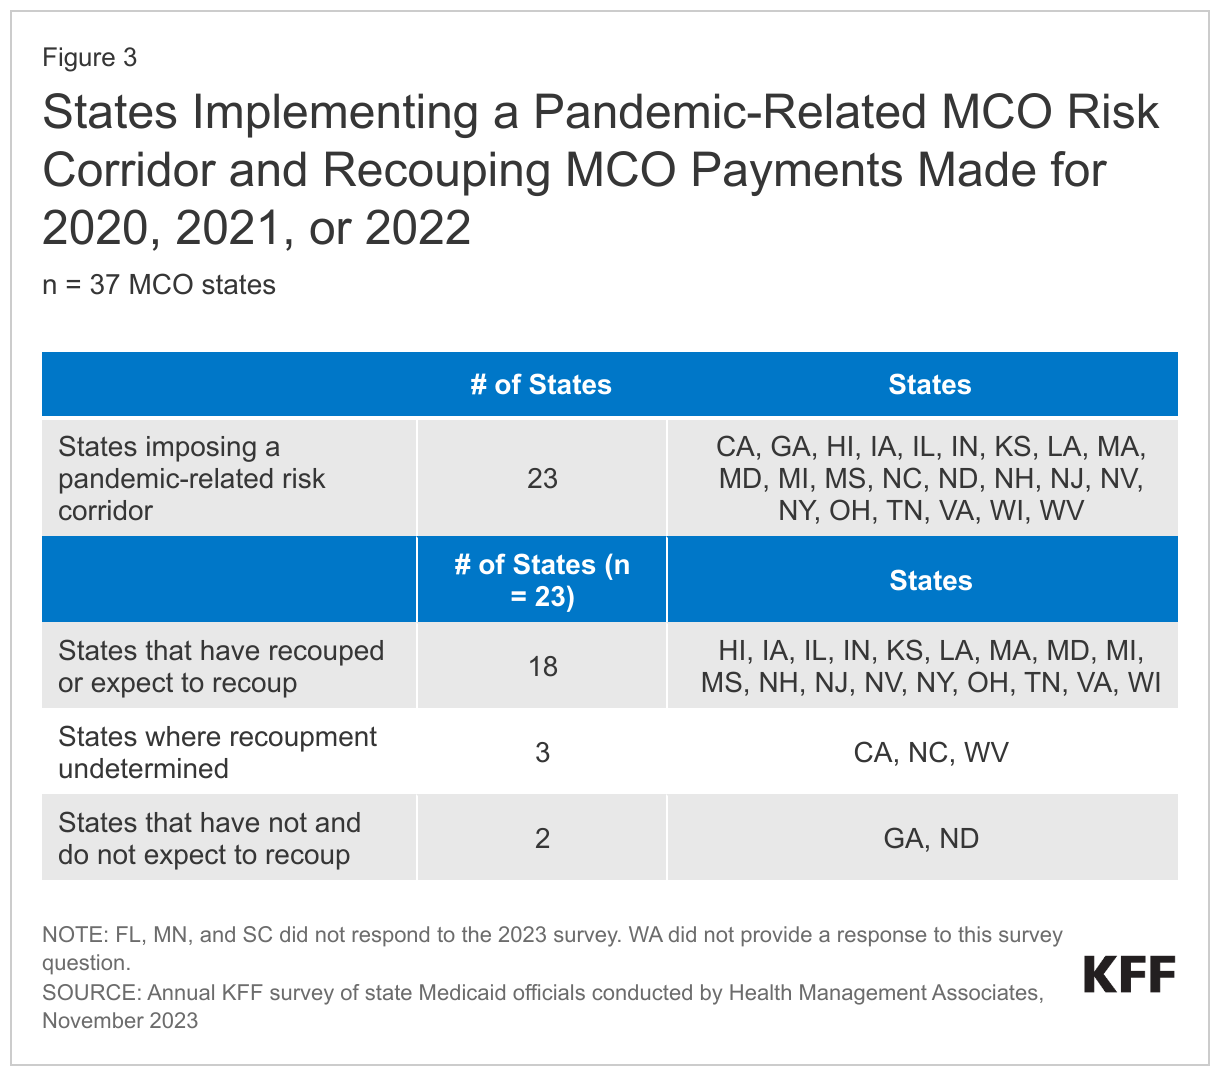
Nearly two-thirds of responding MCO states reported implementing a pandemic-related MCO risk corridor at any time since March 2020; more than three-quarters of these states reported that they have or will recoup funds (Figure 3). Twenty-three of 37 responding MCO states reported imposing risk corridors in their MCO contracts related to the COVID-19 pandemic. Of the states that reported implementing a pandemic-related MCO risk corridor, more than three-quarters (18 of 23) reported that recoupments for payments made for 2020, 2021, and/or 2022 had already occurred or were expected. Three states reported that potential recoupments remained undetermined, and just two states have not and do not expect to recoup payments. Several states also commented on other risk mitigation strategies implemented prior to the pandemic or in response to the pandemic such as pre-existing risk corridors, profits caps, and experience rebates, which are not counted in the table below.
Financial Incentives Tied to Reducing Health Disparities
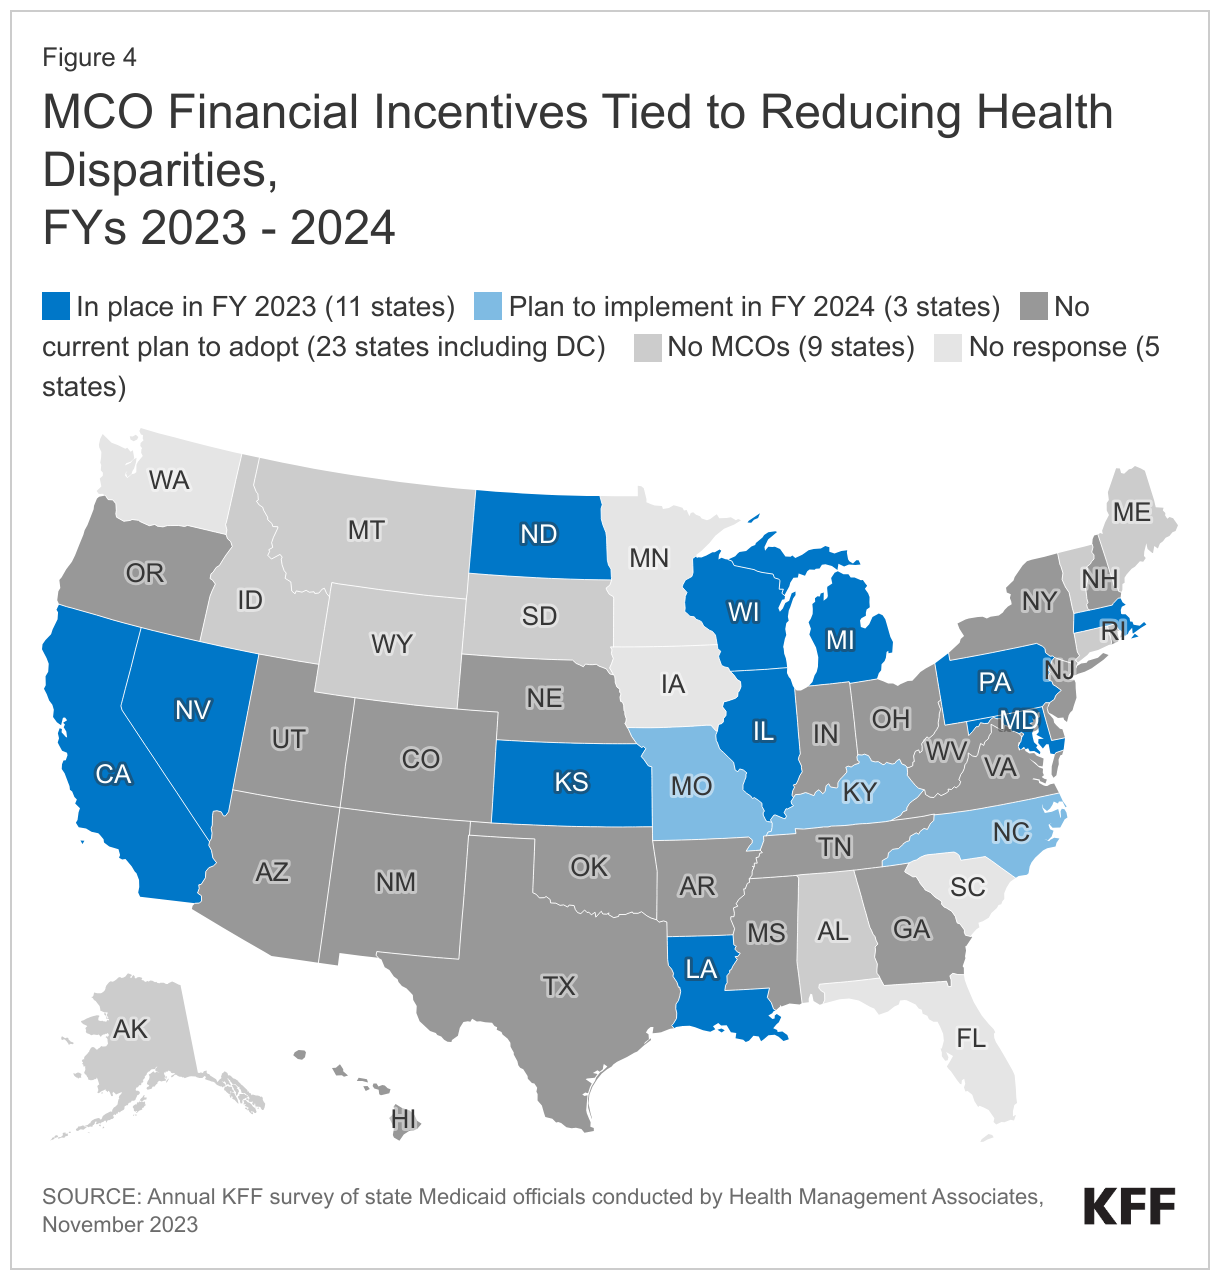
States use an array of financial incentives to improve quality, including linking performance bonuses or penalties, capitation withholds, or value-based state-directed payments to quality measures. States implement financial incentives across delivery systems (fee-for-service and managed care). On this year’s survey, states were asked if they had an MCO financial quality incentive (e.g., a performance bonus or penalty, capitation withhold, quality add-on payment, value-based state directed payment etc.) that rewards quantitative improvement in racial/ethnic disparities for one on more populations in place in FY 2023 or planned for FY 2024.
About one-quarter of responding MCO states (11 of 37) reported at least one MCO financial incentive tied to reducing racial/ethnic disparities in place in FY 2023 (Figure 4). Three additional states report plans to implement MCO financial incentives in FY 2024. States most commonly reported linking (or planning to link) capitation withholds, pay for performance incentives, and/or state-directed provider payments to improvements in health disparities. Four states (Kansas, Maryland, Missouri, and North Carolina) specifically mentioned MCO financial incentives focused on reducing disparities in maternal and child health.
Other notable state examples include:
- California’s CalAIM Incentive Payment Program (IPP) allows MCOs to earn incentive funds for completing quality metrics related to Enhanced Care Management (ECM) services for racial and ethnic groups who are disproportionally experiencing homelessness or chronic homelessness, or who are at risk of becoming homeless with complex health and/or behavioral health conditions. IPP quality metrics also include the monitoring of ECM for racial and ethnic groups who disproportionately meet the population of focus definition (i.e., individuals transitioning from incarceration who have significant complex or behavioral health needs requiring immediate transition of services to the community). The state also reported plans to move to a statewide capitation withhold approach in 2024 that will incorporate health disparity reduction targets.
- Pennsylvania’s MCO pay-for-performance program provides incentive bonus payments for year-over-year incremental improvements on several performance measures where racial disparities are observed.
- In FY 2024, North Carolina plans to withhold a portion of MCO capitation payments to incentivize performance improvement on several quality measures, including reducing disparities in childhood immunization status. To receive the full amount withheld for this measure, plans must improve the rate for the population of interest by 10% or more over the prior year baseline. A separate portion of the withheld funds will be tied to reporting of care needs screening rates, to improve data on sources of disparities.
Other MCO Requirements Related to Reducing Disparities
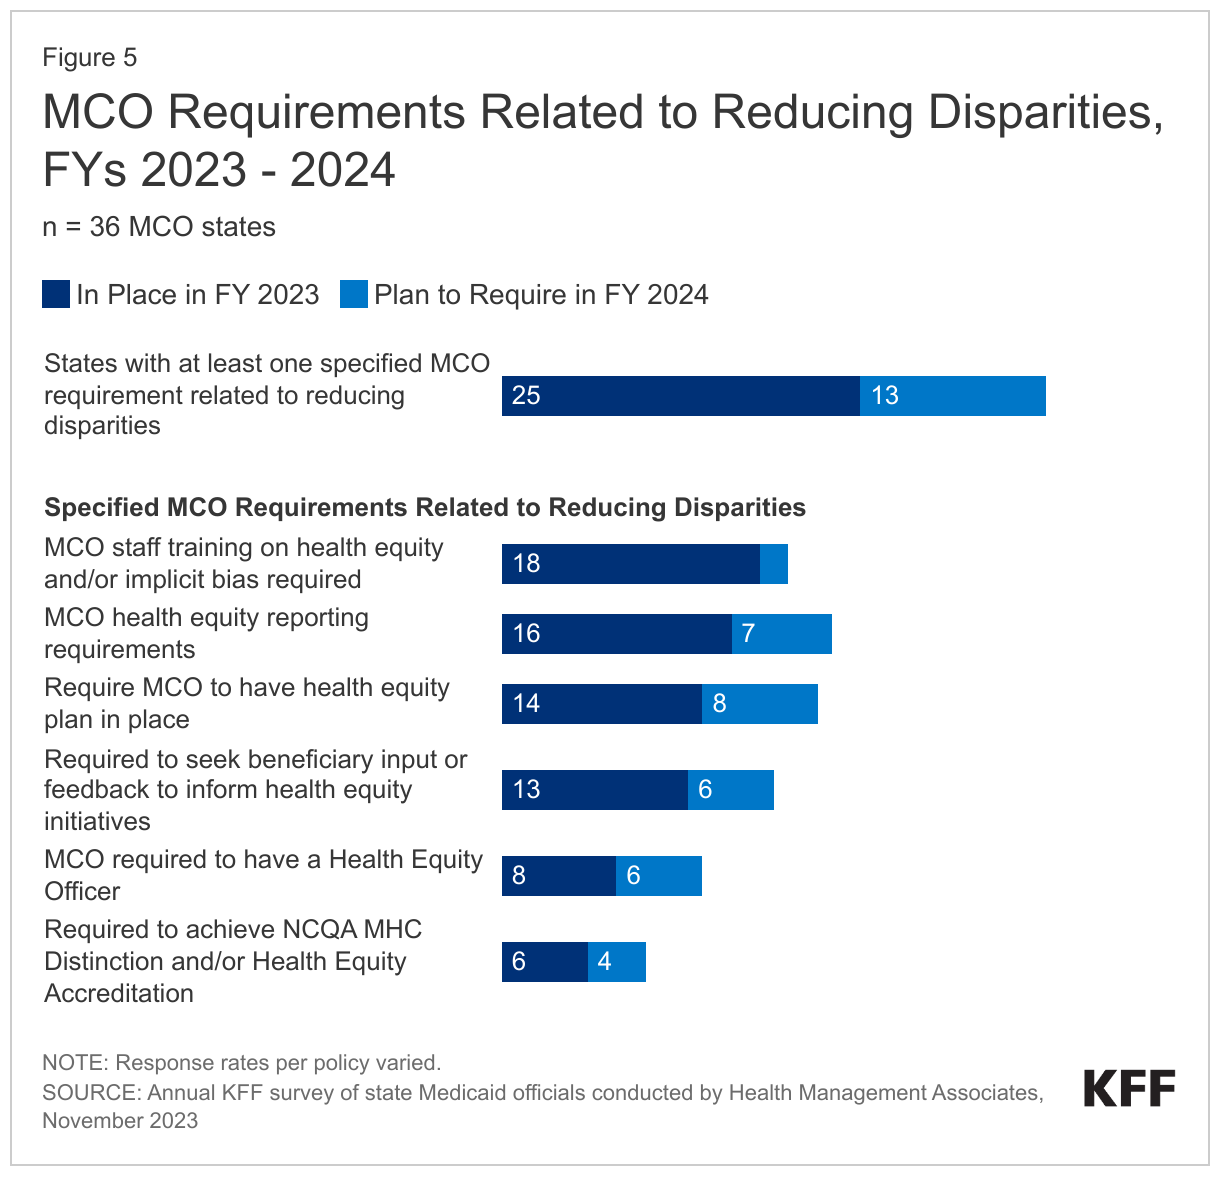
In addition to implementing financial incentives tied to improvements in health disparities, states can leverage managed care contracts in other ways to promote reducing health disparities. For example, states can require MCOs to achieve national standards for culturally competent care, conduct staff training on health equity and/or implicit bias, develop new positions related to health equity, report racial disparities data, incorporate enrollee feedback, among other requirements. On this year’s survey, states that contract with MCOs were asked about whether certain MCO contract requirements related to reducing disparities were in place in FY 2023 or planned for implementation in FY 2024.
More than two-thirds of responding MCO states (25 of 36) reported at least one specified MCO requirement related to reducing disparities in place in FY 2023 (Figure 5). In FY 2023, about half of states reported requiring MCOs to train staff on health equity and/or implicit bias (18 of 35) and meet health equity reporting requirements (16 of 35). Over one-third of states reported requiring MCOs to have a health equity plan in place (14 of 35) and seek enrollee input or feedback to inform health equity initiatives (13 of 35). Fewer states reported requiring MCOs to have a health equity officer (8 of 36) or achieve NCQA’s Multicultural Health Care (MHC) Distinction and/or Health Equity Accreditation (6 of 36). Among states with at least one requirement in place in FY 2023, over half (14 of 25) reported requiring three or more specified initiatives in place (data not shown). The number of MCO states with at least one specified MCO requirement related to reducing disparities grew significantly from 16 states in FY 2022 and is expected to grow to 29 states in FY 2024.
Performance Improvement Projects (PIPs) Focused on Health Disparities
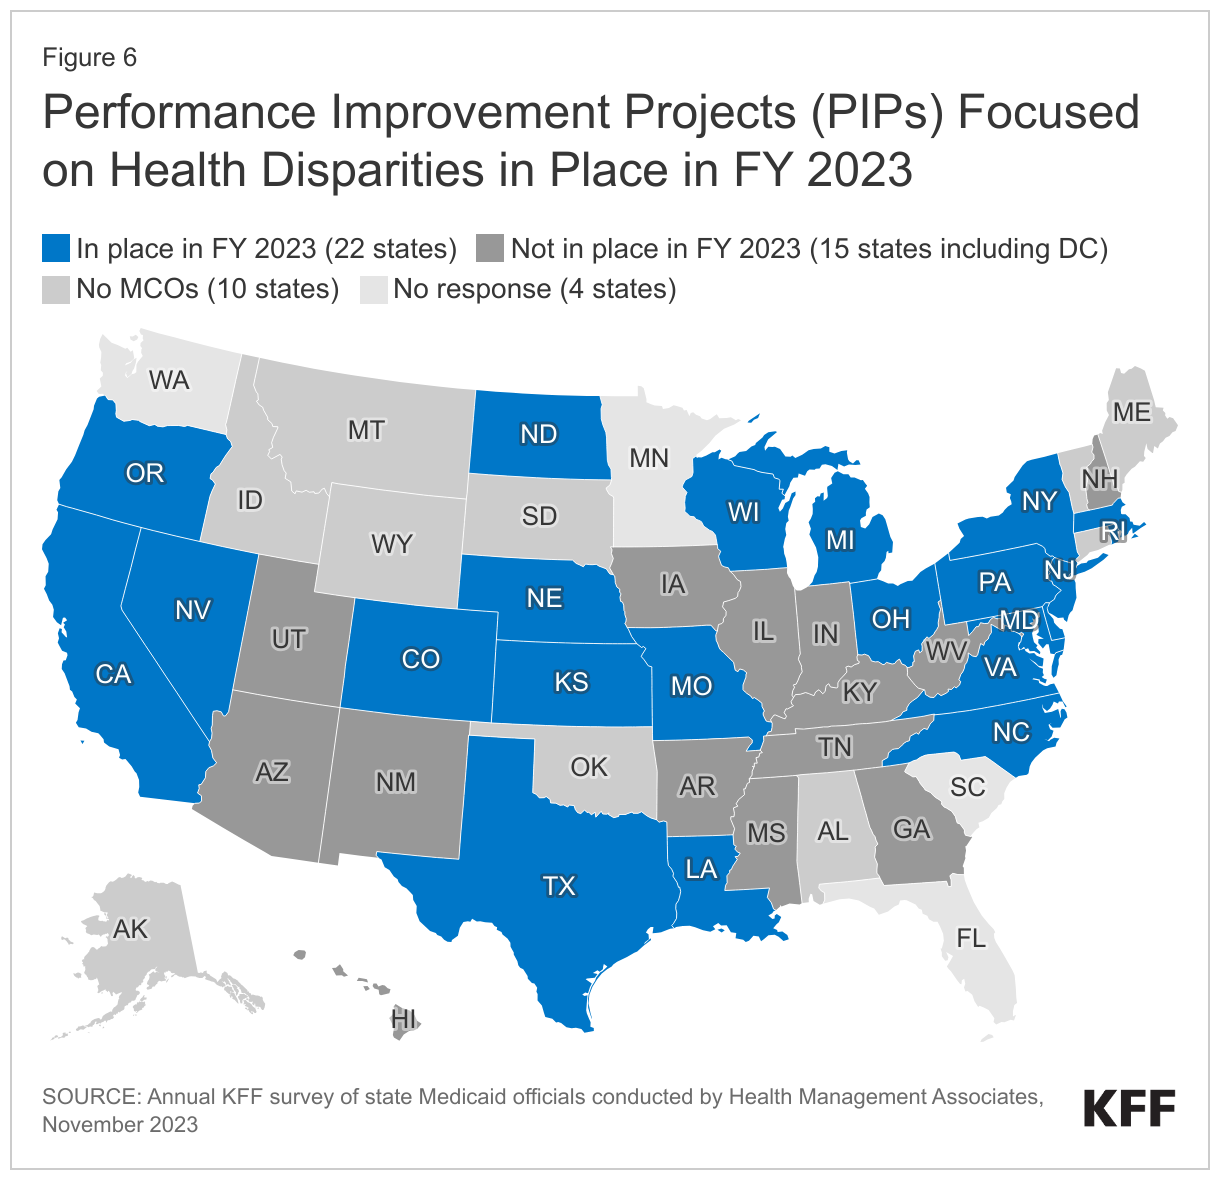
For contracts starting on or after July 1, 2017, federal regulations mandate that states require each MCO or limited benefit PHP to establish and implement an ongoing comprehensive quality assessment and performance improvement (QAPI) program for Medicaid services that includes performance improvement projects (PIPs). PIPs may be designated by CMS, by states, or developed by health plans, but must be designed to achieve significant, sustainable improvement in health outcomes and enrollee satisfaction. On this year’s survey, states were asked if they required MCOs to participate in PIPs focused on health disparities in FY 2023 or planned to in FY 2024.
More than half of responding states that contract with MCOs (22 of 37) reported requiring MCOs to participate in PIPs focused on health disparities in FY 2023 (Figure 6). States reported a range of state-mandated PIP focus areas with an emphasis on reducing disparities / improving health equity including related to:
- Maternal and child health (California, Delaware, Maryland, Massachusetts, Michigan, Missouri, Nevada, Oregon, and Texas)
- Social determinants of health assessment, referral, and follow up (Kansas, North Carolina, Oregon, and Texas)
- Chronic disease-focused (e.g., diabetes, hypertension, COPD) (North Dakota, Ohio, and Oregon)
- Substance Use Disorder (SUD) (Delaware, North Dakota, and Pennsylvania)
Four states (Louisiana, Massachusetts, New York, and Rhode Island) reported all PIPs must include a health equity component or equity and disparities analysis; two states (New Jersey and Wisconsin) reported requirements for MCOs to engage in at least one PIP focused on health disparities. Three states (Colorado, Nebraska, and Virginia) did not specifically describe their health equity-related PIP requirement. Several states also reported plans to implement PIPs focused on disparities in FY 2024 or add health disparities stratifications to existing PIPs.
Provider Rates And Taxes
Context
In general, states have broad latitude under federal laws and regulations to determine fee-for-service (FFS) provider payments so long as the payments: are consistent with efficiency, economy, and quality of care; safeguard against unnecessary utilization; and are sufficient to enlist enough providers to ensure that Medicaid enrollees have access to care that is equal to the level of access enjoyed by the general population in the same geographic area.13 Subject to certain exceptions,14 states are not permitted to set the rates that managed care entities pay to providers. However, state-determined FFS rates remain important benchmarks for MCO payments in most states, often serving as the state-mandated payment floor. Proposed rules from CMS related to ensuring access to Medicaid services would require states to publish all Medicaid FFS payment rates by January 1, 2026, as well as compare payment rates to the Medicare rate for certain services.15 Proposed rules would also set financial thresholds that states cannot fall below when reducing rates for specific services. Additionally, proposed rules related to minimum staffing standards in nursing facilities would require states to report the percent of Medicaid payments for institutional long-term services and supports spent on compensation for direct care workers and support staff.
Historically, FFS provider rate changes generally reflect broader economic conditions. During economic downturns where states may face revenue shortfalls, states have typically turned to provider rate restrictions to contain costs. Conversely, states are more likely to increase provider rates during periods of recovery and revenue growth. However, during the COVID-19 pandemic, state and federal policymakers wished to avoid the use of rate reductions to address budget challenges due to the financial strains that providers were experiencing from the increased COVID-19 testing and treatment costs and from declining utilization for non-urgent care. Federal policymakers adopted a number of policies to ease financial pressure on states, hospitals, and other health care providers, including enhanced Medicaid matching funds for states (phasing down through December 2023) and enhanced funding for home and community-based services (HCBS) (available through March 21, 2025) designed to bolster rates and the direct care workforce. The expiration of these federal funds will impact state budgets and could affect providers, as states consider whether to maintain the funding increases made possible by enhanced federal matching funds, or other one-time funding sources.
States have considerable flexibility in determining how to finance the non-federal share of state Medicaid payments, within certain limits. In addition to state general funds appropriated directly to the Medicaid program, most states also rely on funding from health care providers and local governments generated through provider taxes, user fees, intergovernmental transfers (IGTs), and certified public expenditures (CPEs). Over time, states have increased their reliance on provider taxes, with expansions often driven by economic downturns.
This section provides information about:
- FFS reimbursement rates; and
- Provider taxes
Findings
FFS Reimbursement Rates
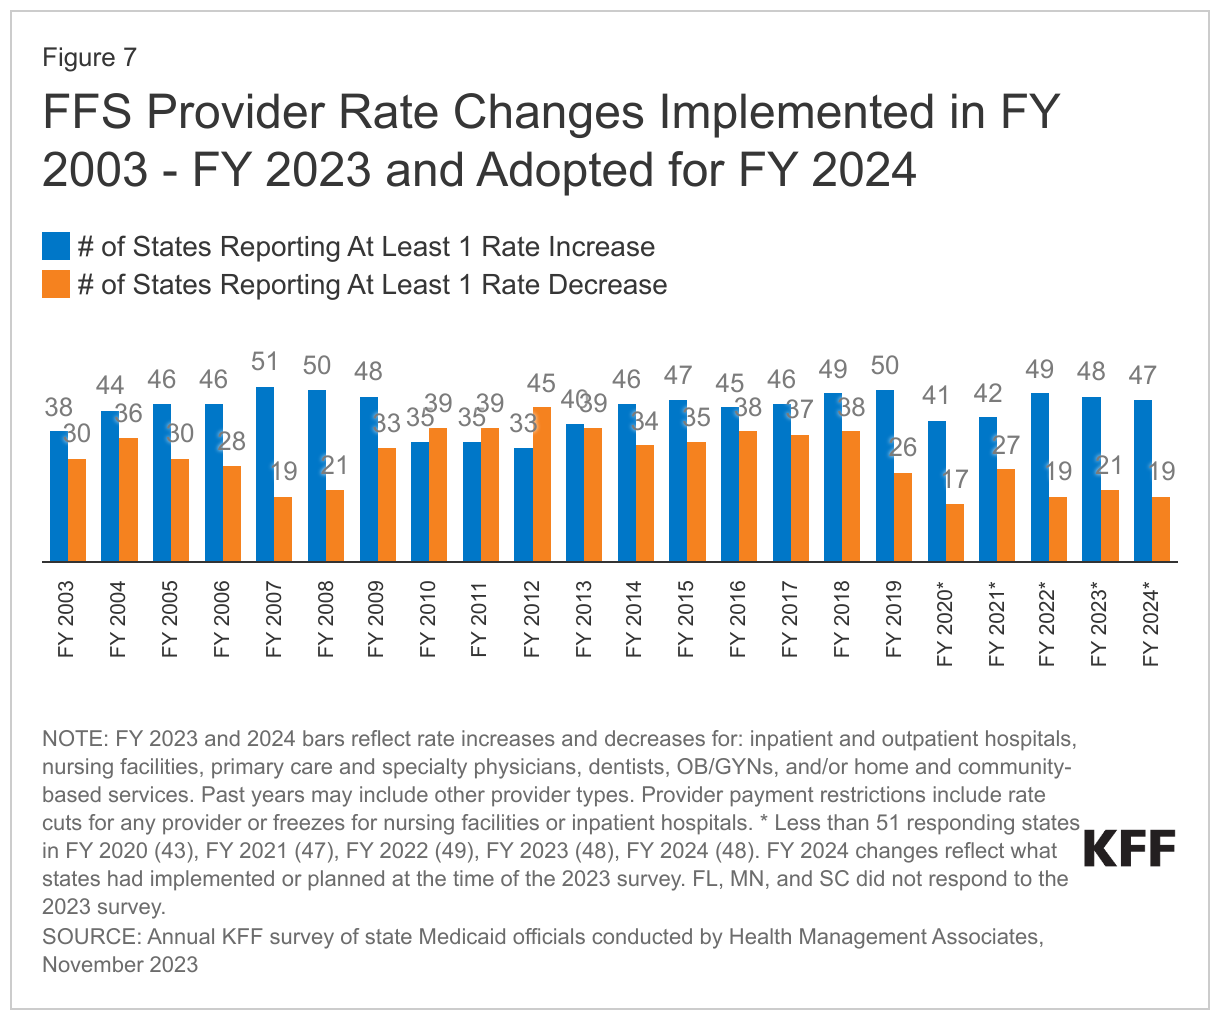
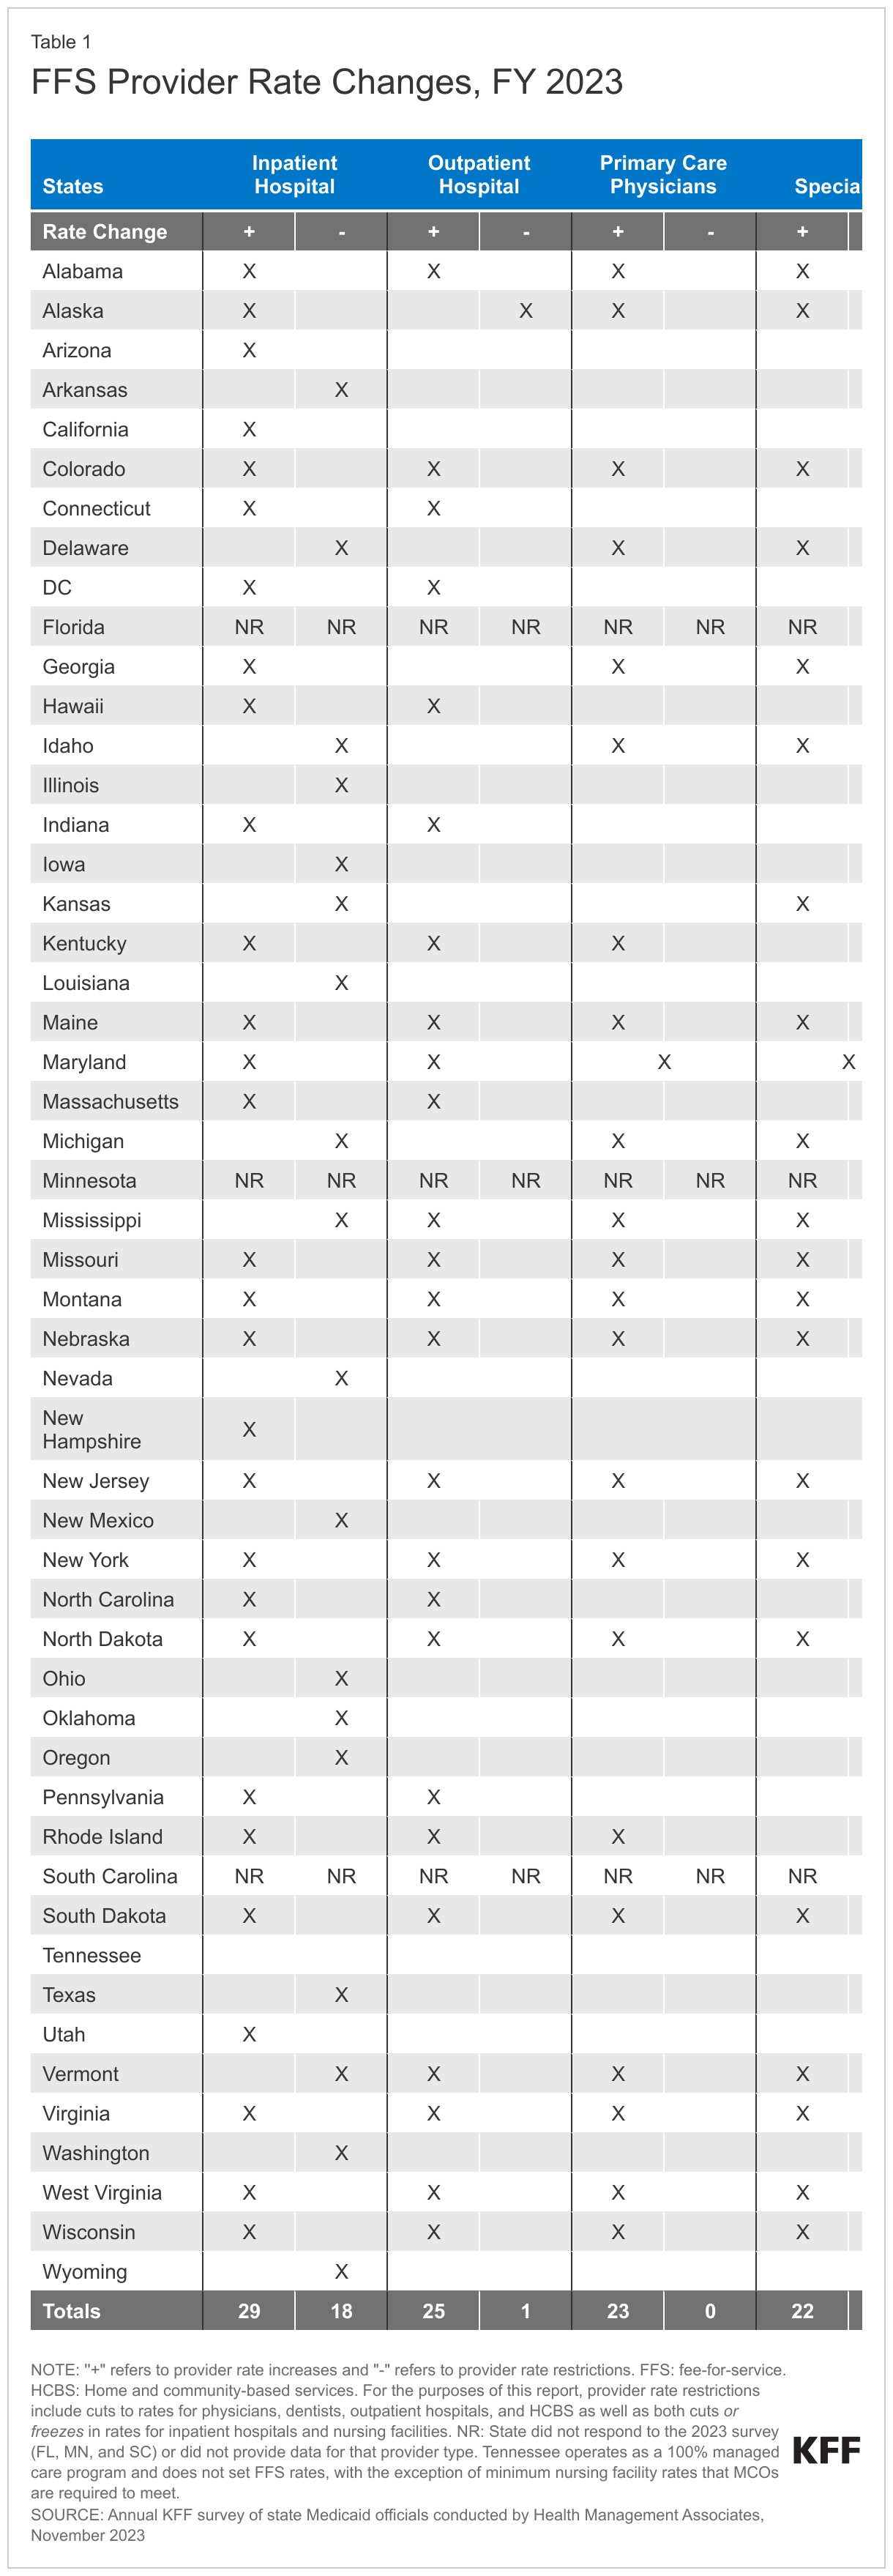
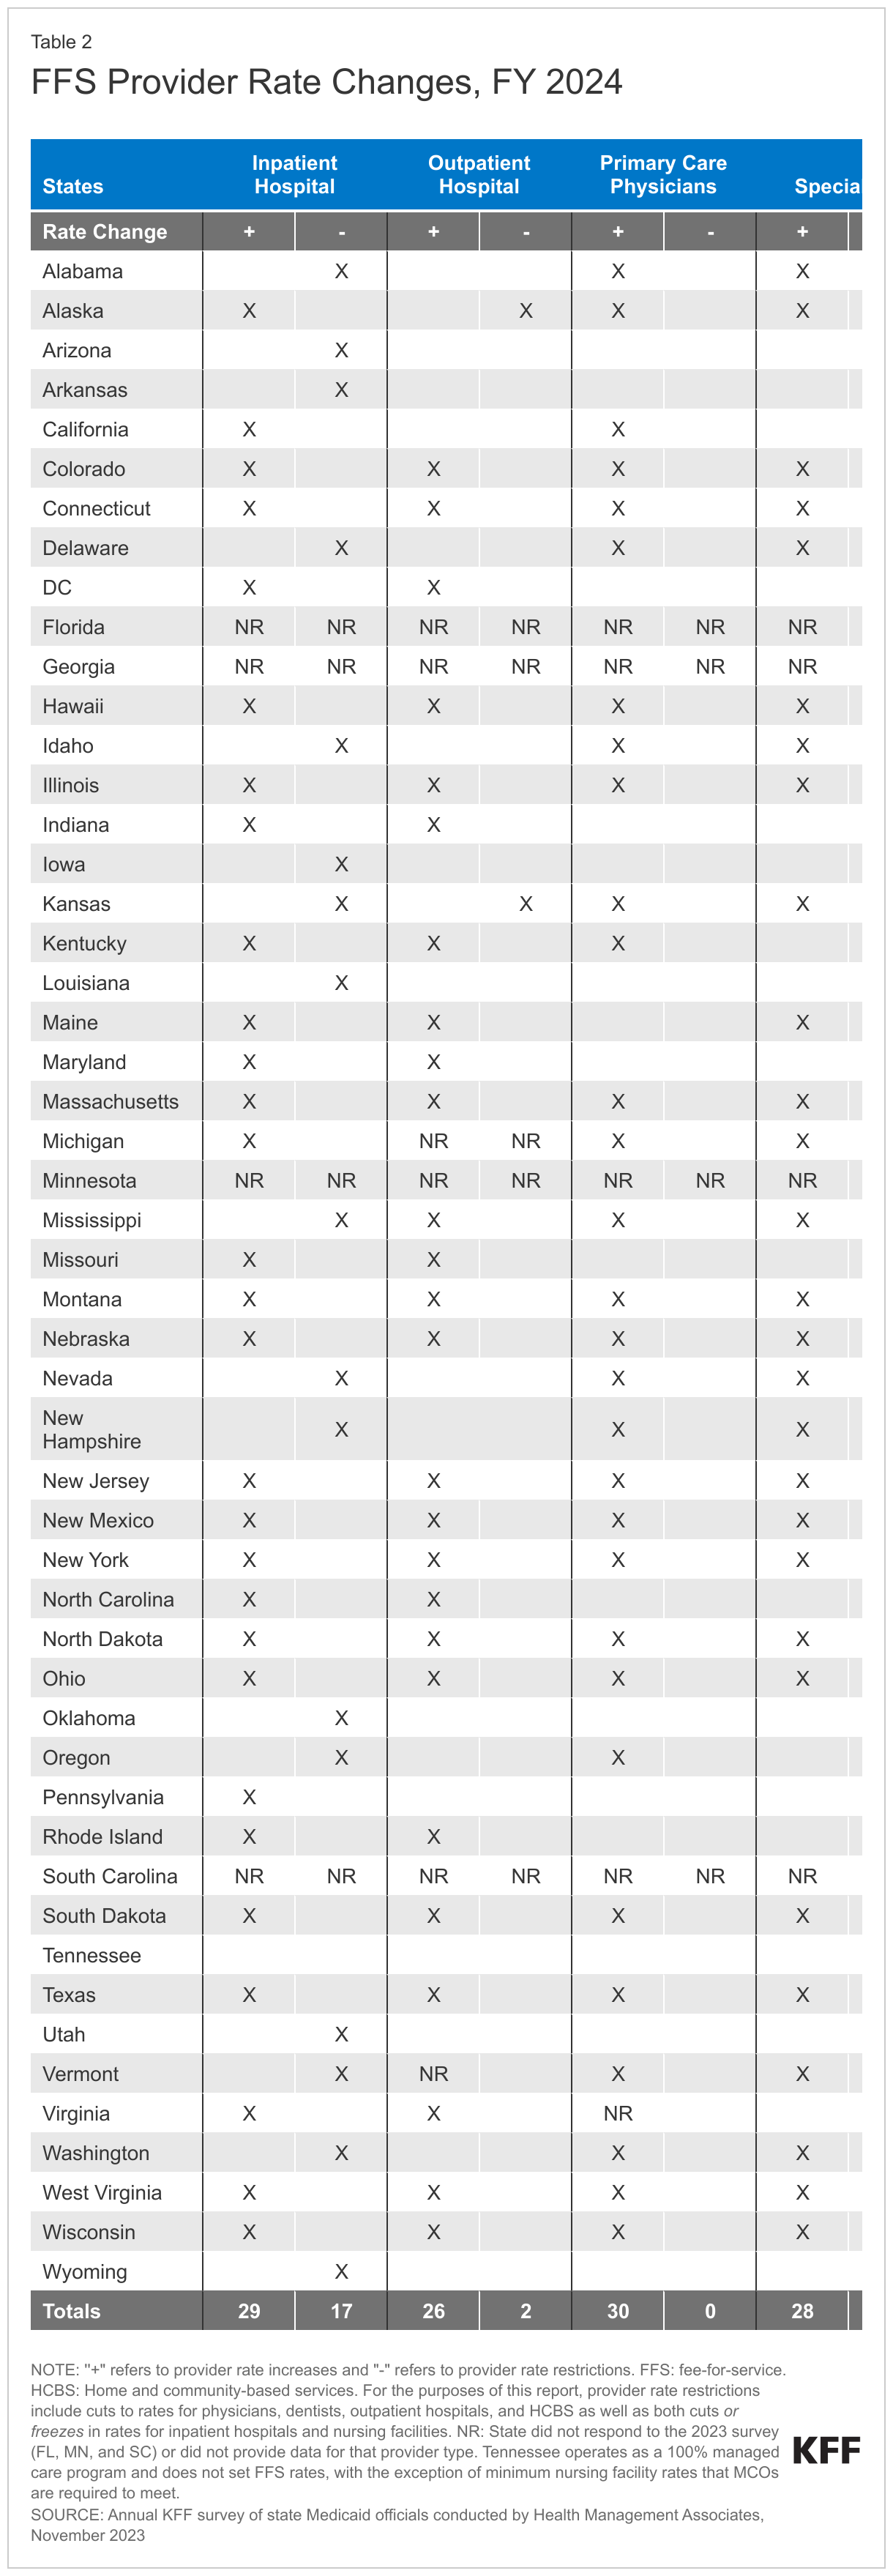
At the time of the survey, responding states had implemented or were planning more FFS rate increases than rate restrictions in both FY 2023 and FY 2024 (Figure 7 and Tables 1 and 2). All responding states in FY 2023 (48) and all but one responding state in FY 2024 (47) reported implementing rate increases for at least one category of provider. Fewer states (21 in FY 2023 and 19 in FY 2024) implemented or were planning to implement at least one rate restriction.
States reported continued pressures to increase provider rates in response to inflationary impacts and workforce shortages. Many states employ cost-based reimbursement methodologies for some provider types, such as nursing facilities and critical access hospitals, that automatically adjust for inflation and other cost factors during the rate setting process. States also reported that rates for some provider types are benchmarked to Medicare rates and therefore increase commensurate with Medicare increases. A few states highlighted comprehensive rate review analyses underway that are expected to continue on a regular schedule in the future (e.g., every four to five years), which may inform the state budget process.
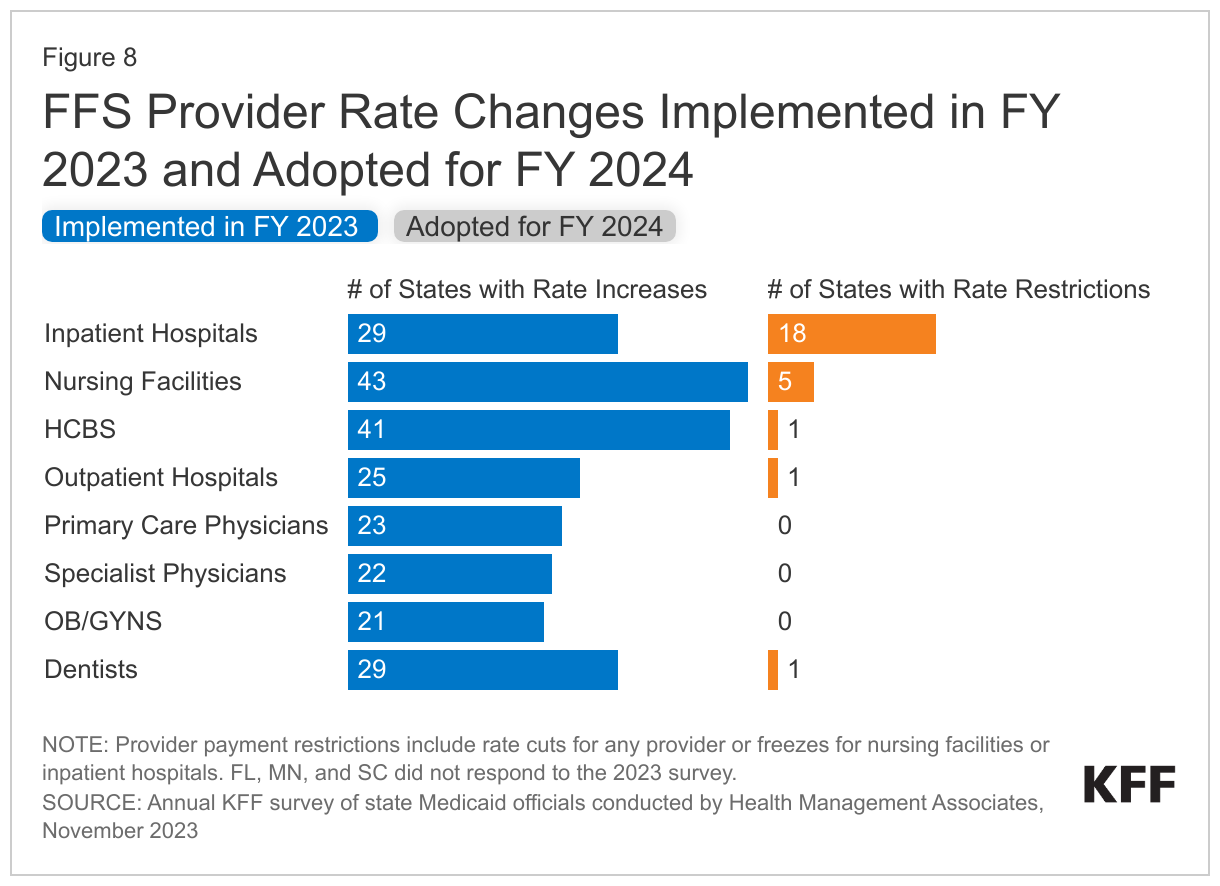
States reported rate increases for nursing facilities and HCBS providers more often than for other provider categories (Figure 8). In some cases, state officials reported that nursing facility and HCBS rate increases included, at least in part, the continuation of pandemic-related payments or represent temporary rate increases or supplemental payments to HCBS providers using American Rescue Plan Act (ARPA) funds. Some states reported enhanced rates associated with the PHE will be discontinued, while other states noted that these rate increases were made permanent. Reflecting the ongoing staffing-related challenges impacting nursing facility and HCBS services, several states reported more significant nursing facility or HCBS rate increases. Examples of HCBS rate increases include the following:
- Alaska reported that rates for HCBS providers were increased by 10% on July 1, 2022, by an average of 5% (following rebasing) on May 1, 2023, and then again on July 1, 2023 (7.9%) to implement legislatively required increases and an inflationary adjustment.
- Colorado increased base wages in the FY 2023-2024 budget for workers providing most HCBS from $15.00 to $15.75 per hour.
- The District of Columbia reported supplemental payments were approved for qualifying HCBS providers so that they will earn an average wage rate of 117.6% of the District’s minimum wage by FY 2025.
- Utah reported in 2023 almost all rates for developmental disabilities waiver services with direct service care components were increased by 19.5%.
- Indiana reported increases of 42.4% for HCBS waivers serving the aged and disabled, 23.3% for HCBS waivers serving persons with intellectual and developmental disabilities, and 32% for home health services.Nevada reported that HCBS rate increases were approved during the 2023 legislative session including for developmental disabilities waiver services (26.9% on average), personal care services (140% on average), and services to frail elderly in Assisted Living Facilities (98% on average).
Examples of notable nursing facility rate increases reported by states include the following:
- Nevada reported that a 24.5% increase for freestanding nursing facilities was approved during its 2023 legislative session.
- Illinois increased its average nursing facility per diem rate by 21% in FY 2023 as part of a major rate reform effort and also reported plans to increase the nursing home support rate (a component of the per diem rate) by 12% on January 1, 2024.
- Nebraska reported a 20% rate increase for nursing facilities in FY 2023 and a 3% increase in FY 2024.
- Ohio reported a 2.3% rate increase for nursing facilities in FY 2023 and a 17.1% increase in FY 2024.
- Wyoming reported a 20% nursing facility rate increase effective July 1, 2023.
Nearly half of responding states (23) reported increasing primary care physician rates in FY 2023 and nearly two-thirds (30) reported plans to do so in FY 2024. This compares with 15 states reporting increases in FY 2022, 19 in FY 2021, and 21 in FY 2020. Notable increases reported for FY 2023 or FY 2024 include a 41.8% increase in specific evaluation and management codes in Alabama and an 11.8% rate increase for primary care providers in Michigan. Other states reported benchmarking to Medicare rates, for example, 100% of the current Medicare rates in Maine, and 80% of Medicare in New York and Oregon.
Similar to the 2022 survey, the 2023 survey found an increased focus on dental rates with more than half of reporting states (29 in FY 2023 and 26 in FY 2024) reporting implementing or plans to implement a dental rate increase, in some cases benchmarked to the American Dental Association national fee survey. This compares with 14 states reporting increases each year in the 2019, 2020, and 2021 surveys.16 Notable dental rate increases reported for FY 2023 or FY 2024 include increasing rates 25% (Connecticut and Wyoming); raising rates to average commercial rates (or a share of commercial rates) (Michigan and Vermont), and introducing a supplemental payment based on average commercial rates (Iowa). Additionally, Illinois reported making a $10 million investment in dental rate increases effective January 2023.
While states reported imposing more restrictions on inpatient hospital and nursing facility rates than on other provider types, most of these restrictions were rate freezes rather than actual reductions. (Because inpatient hospital and nursing facility services are more likely to receive routine cost-of-living adjustments than other provider types, this report counts rate freezes for these providers as restrictions.) There is one important caveat to consider when evaluating FFS hospital rate changes: in addition to FFS reimbursement, states make supplemental payments to fund hospital care such as Upper Payment Limit payments, State Directed Payments, Graduate Medical Education, and Disproportionate Share Hospital payments. One or more of these payment types could be increasing during a fiscal year even if the base hospital payments are not. In fact, one state (Kansas) reported that it restructured a provider tax-funded payment from an add-on payment to a quarterly State Directed Payment which resulted in a reduction to inpatient and outpatient hospital FFS payments in FY 2024.
Beyond the inpatient hospital and nursing facility rate restrictions described above, only three states reported other rate restrictions: Alaska reported reductions in outpatient hospital and dental rates in both FY 2023 and FY 2024, Kansas reported a reduction for outpatient hospital rates in FY 2024, and North Carolina reported HCBS rate reductions in FY 2023 and that both HCBS and nursing facility rates decreased in FY 2024 when COVID-19 add-on payments expired. No states reported legislative action to freeze or reduce rates across all or most provider categories in either FY 2023 or FY 2024.
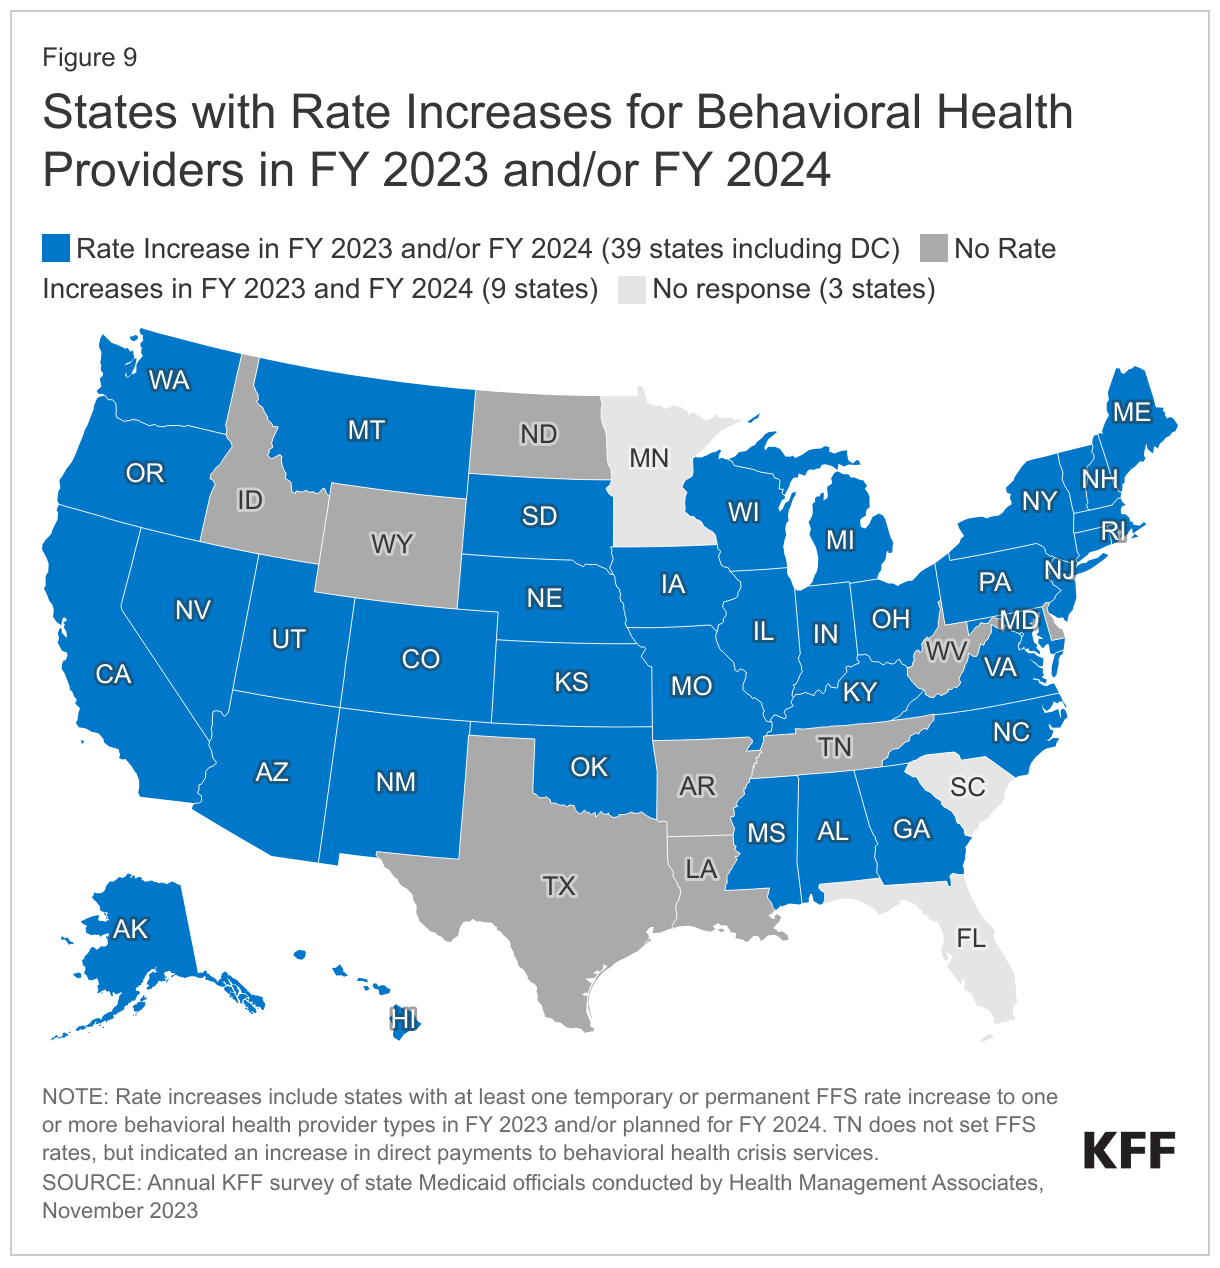
More than three-quarters of responding states (39 of 48) implemented FFS rate increases for one or more behavioral health providers in FY 2023 or plans to do so in FY 2024 (Figure 9). States may increase reimbursement rates for behavioral health (mental health and Substance Use Disorder) providers as one strategy to address workforce shortages. On this year’s survey, states were asked whether they have or plan to increase reimbursement rates for one or more behavioral health providers (in FY 2023 and/or FY 2024). Thirty-two states reported rate increases in FY 2023 and 33 states reported plans to increase rates in FY 2024. Sixteen states reported no rate increases for FY 2023 and 11 states reported no rate increases for FY 2024.
Some states noted rate increases were targeted to specific provider types, such as increases for Substance Use Disorder (SUD) service providers (including outpatient and institutional providers), psychotherapy/counseling providers, or for applied behavioral analysis (ABA) providers. Other states implemented increases that were more widespread. Rate increase examples include:
- Iowa reported that behavioral health intervention providers received a 20.6% increase in FY 2023, ABA providers received an 8.9% increase in FY 2023, individual mental health practitioners will receive a 56.6% increase in FY 2024, SUD providers will receive a 96.5% increase in FY 2024, and Psychiatric Medicaid Institutions for Children will receive a 27.6% increase in FY 2024.
- Nebraska reported across the board behavioral health rate increases of 17% in FY 2023 and 3% in FY 2024.
- New Mexico reported increasing FY 2024 behavioral health rates to 120% of Medicare and plans to review rates annually in the future.
- Oregon reported an aggregate increase of 30% for behavioral health services by procedure code in FY 2023. The state focused on SUD, behavioral health outpatient, ABA, peer support, and residential services.
- South Dakota reported 16% increases for SUD and Community Mental Health Center (CMHC) providers and a 5% inflationary increase for other behavioral health services in FY 2023.
- Vermont reported mental health providers received an 8% rate increase in FY 2023 and a 5% rate increase in FY 2024, while SUD providers received a 5% rate increase in FY 2023 and a 5% rate increase in FY 2024.
A few states mentioned behavioral health rate studies underway or recently completed and/or the implementation of new rate methodologies for certain behavioral health services. Although states were not asked if they require MCOs to implement the FFS rate increases (for example, through a state-directed payment), previous KFF research suggests that many states that contract with MCOs may require MCOs to implement behavioral health provider rate increases. For example, Tennessee reported that through managed care directed payments, provider rates were increased for crisis services in 2023.
Provider Taxes
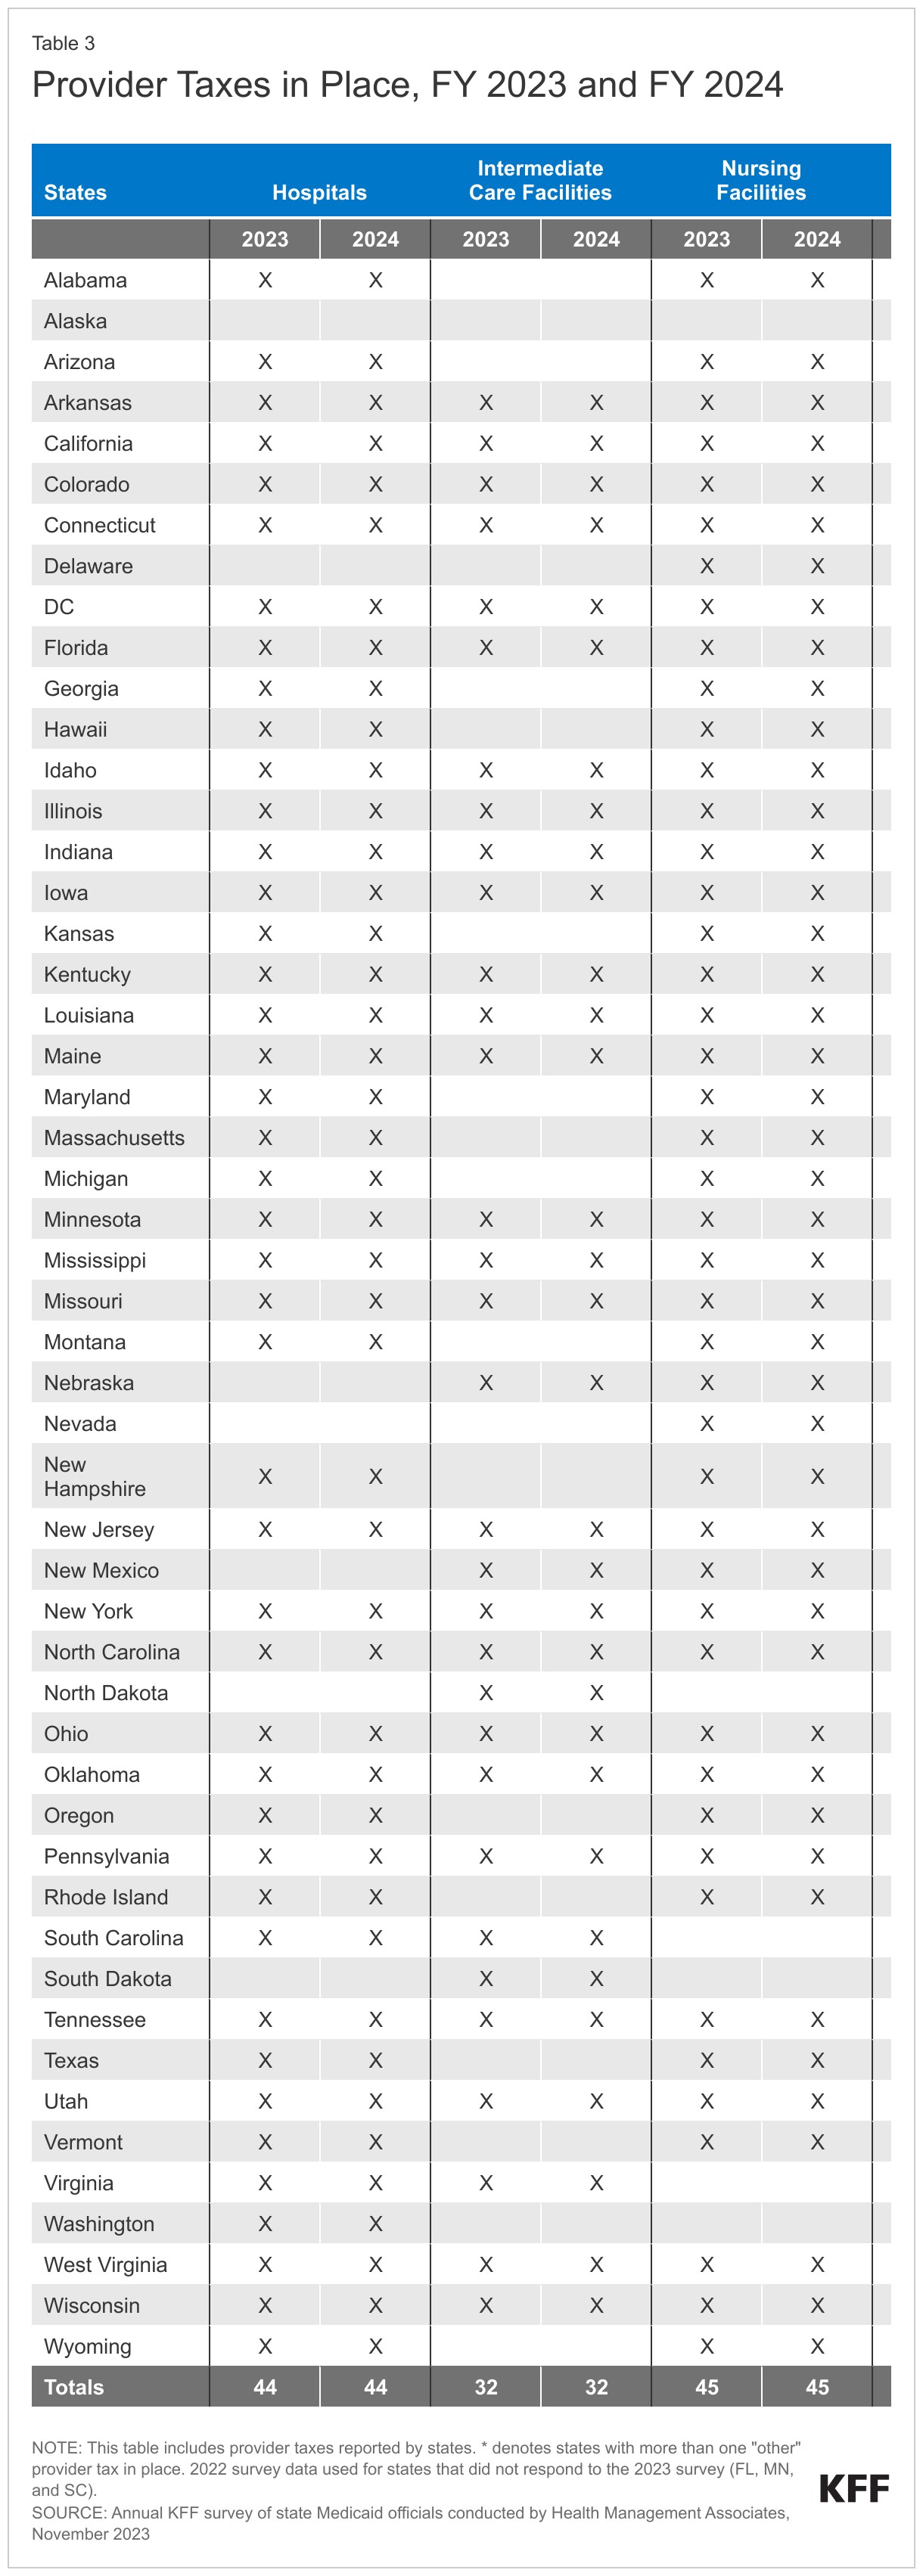
States continue to rely on provider taxes and fees to fund a portion of the non-federal share of Medicaid costs (Figure 10). Provider taxes are an integral source of Medicaid financing, comprising approximately 17% of the nonfederal share of total Medicaid payments in FY 2018 according to the Government Accountability Office (GAO).17 At the beginning of FY 2003, 21 states had at least one provider tax in place. Over the next decade, most states imposed new taxes or fees and increased existing tax rates and fees to raise revenue to support Medicaid. By FY 2013, all but one state (Alaska) had at least one provider tax or fee in place. In this year’s survey, states reported a continued reliance on provider taxes and fees to fund a portion of the non-federal share of Medicaid costs. Thirty-nine states had three or more provider taxes in place in FY 2023 and seven other states had two provider taxes in place (Figure 10).18 As of July 1, 2023, 34 states reported at least one provider tax that is above 5.5% of net patient revenues, which is close to the maximum federal safe harbor or allowable threshold of 6%. Federal action to lower that threshold or eliminate provider taxes, as has been proposed in the past, would therefore have financial implications for many states.
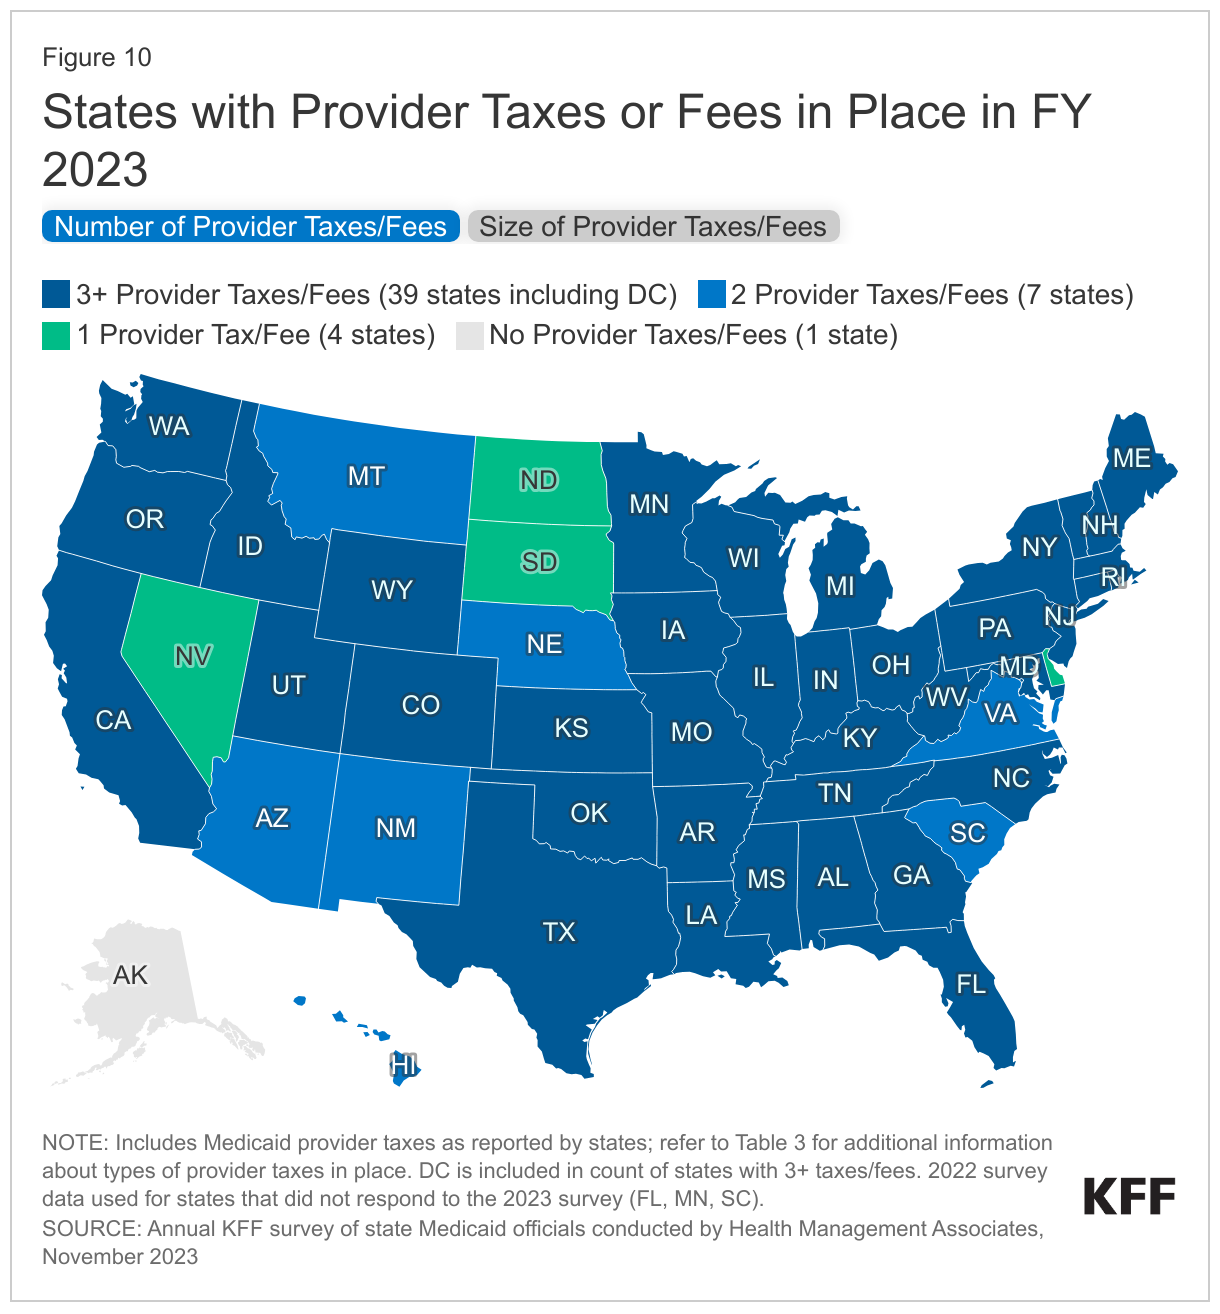
Few states made or are making significant changes to their provider tax structure in FY 2023 or FY 2024 (Table 3). The most common Medicaid provider taxes in place in FY 2023 were taxes on nursing facilities (45 states), followed by taxes on hospitals (44 states), intermediate care facilities for individuals with intellectual disabilities (32 states), MCOs19 (19 states), and ambulance providers (15 states). Only three states reported plans to add new taxes in FY 2024 (Iowa (MCO), Wisconsin (ambulance), and Wyoming (ambulance and Psychiatric Residential Treatment Facilities)). Vermont plans to eliminate a home health tax in FY 2024. Twenty-one states reported planned increases to one or more provider taxes in FY 2024, while three states reported planned decreases (Missouri, Vermont, and Maryland).20
Benefits
Context
State Medicaid programs are statutorily required to cover a core set of “mandatory” benefits, but may choose to cover a broad range of optional benefits. States may apply reasonable service limits based on medical necessity or to control utilization, but once covered, services must be “sufficient in amount, duration and scope to reasonably achieve their purpose.”21 State benefit actions are often influenced by prevailing economic conditions: states are more likely to adopt restrictions during downturns and expand or restore benefits as conditions improve. However, during the COVID-19 pandemic, despite an early and deep economic downturn, additional federal funds and the goal to maintain access to needed services resulted in states using Medicaid emergency authorities to temporarily expand or enhance benefits. In 2020, 2021, and 2022 permanent (i.e., non-emergency) benefit expansions continued to far outweigh benefit restrictions, consistent with prior years.
Recent trends in state changes to Medicaid benefits (both prior to and during the COVID-19 pandemic) reflect state priorities related to behavioral health, maternal and infant health, and reducing disparities in health—including increased interest in leveraging Medicaid to address enrollee social needs (e.g., housing stability, food security). Federal legislation, CMS guidance and technical assistance, and new funding opportunities can also affect state Medicaid benefits.
In August 2022, CMS released updated guidance that outlines state flexibilities and strategies for expanding Medicaid-covered mental health services in schools, and in May 2023, CMS issued guidelines to clarify Medicaid services and billing in schools, as mandated by the 2022 Bipartisan Safer Communities Act.
This section provides information about:
- Benefit changes
- Medicaid coverage or reimbursement of school-based health services
Findings
Benefit Changes
States were asked about benefit changes implemented during FY 2023 or planned for FY 2024, excluding telehealth, pharmacy, and changes made to comply with federal requirements. Benefit changes may be planned at the direction of state legislatures and may require CMS approval.
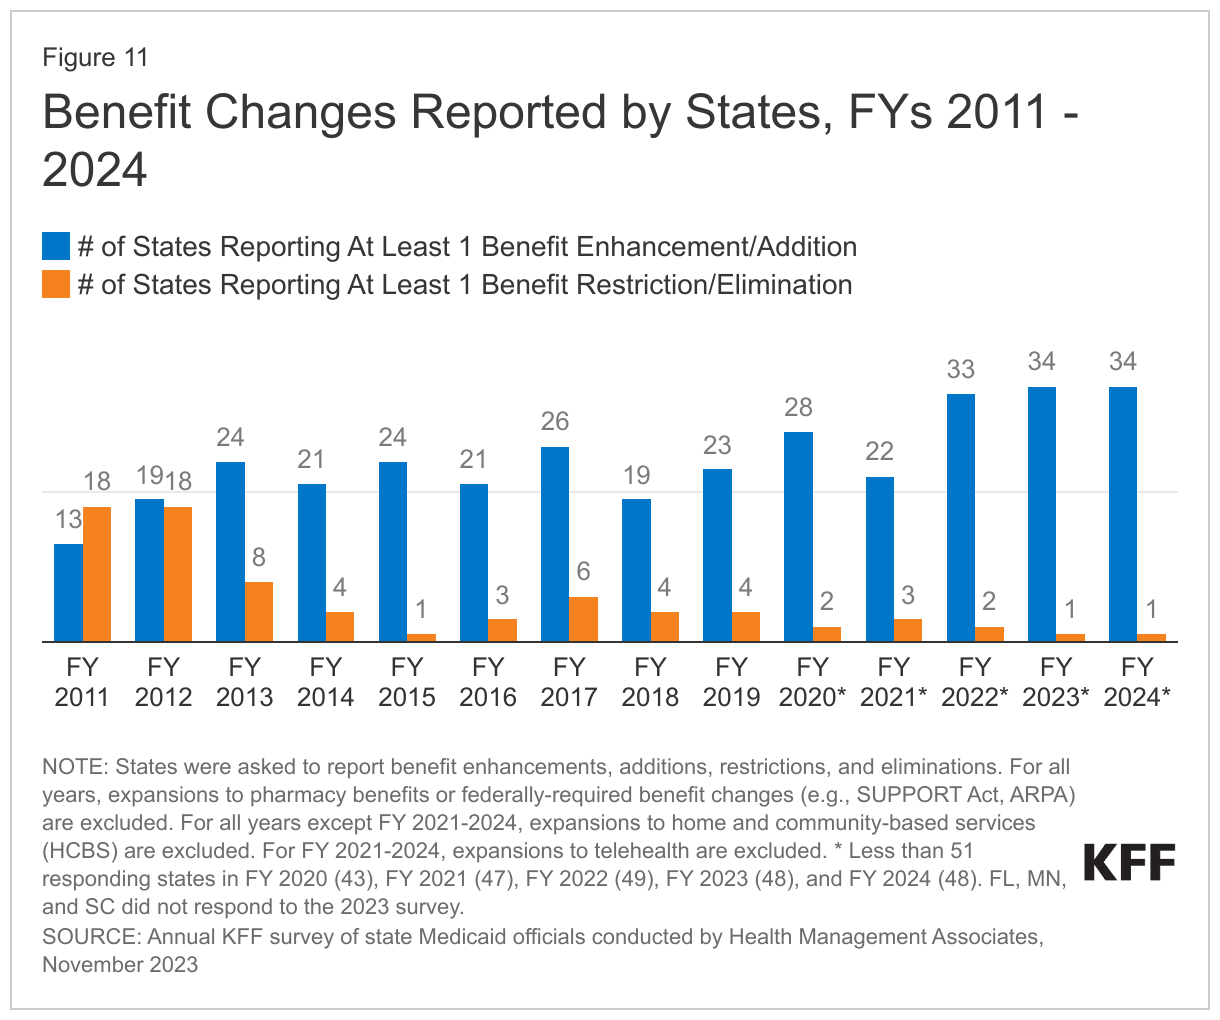
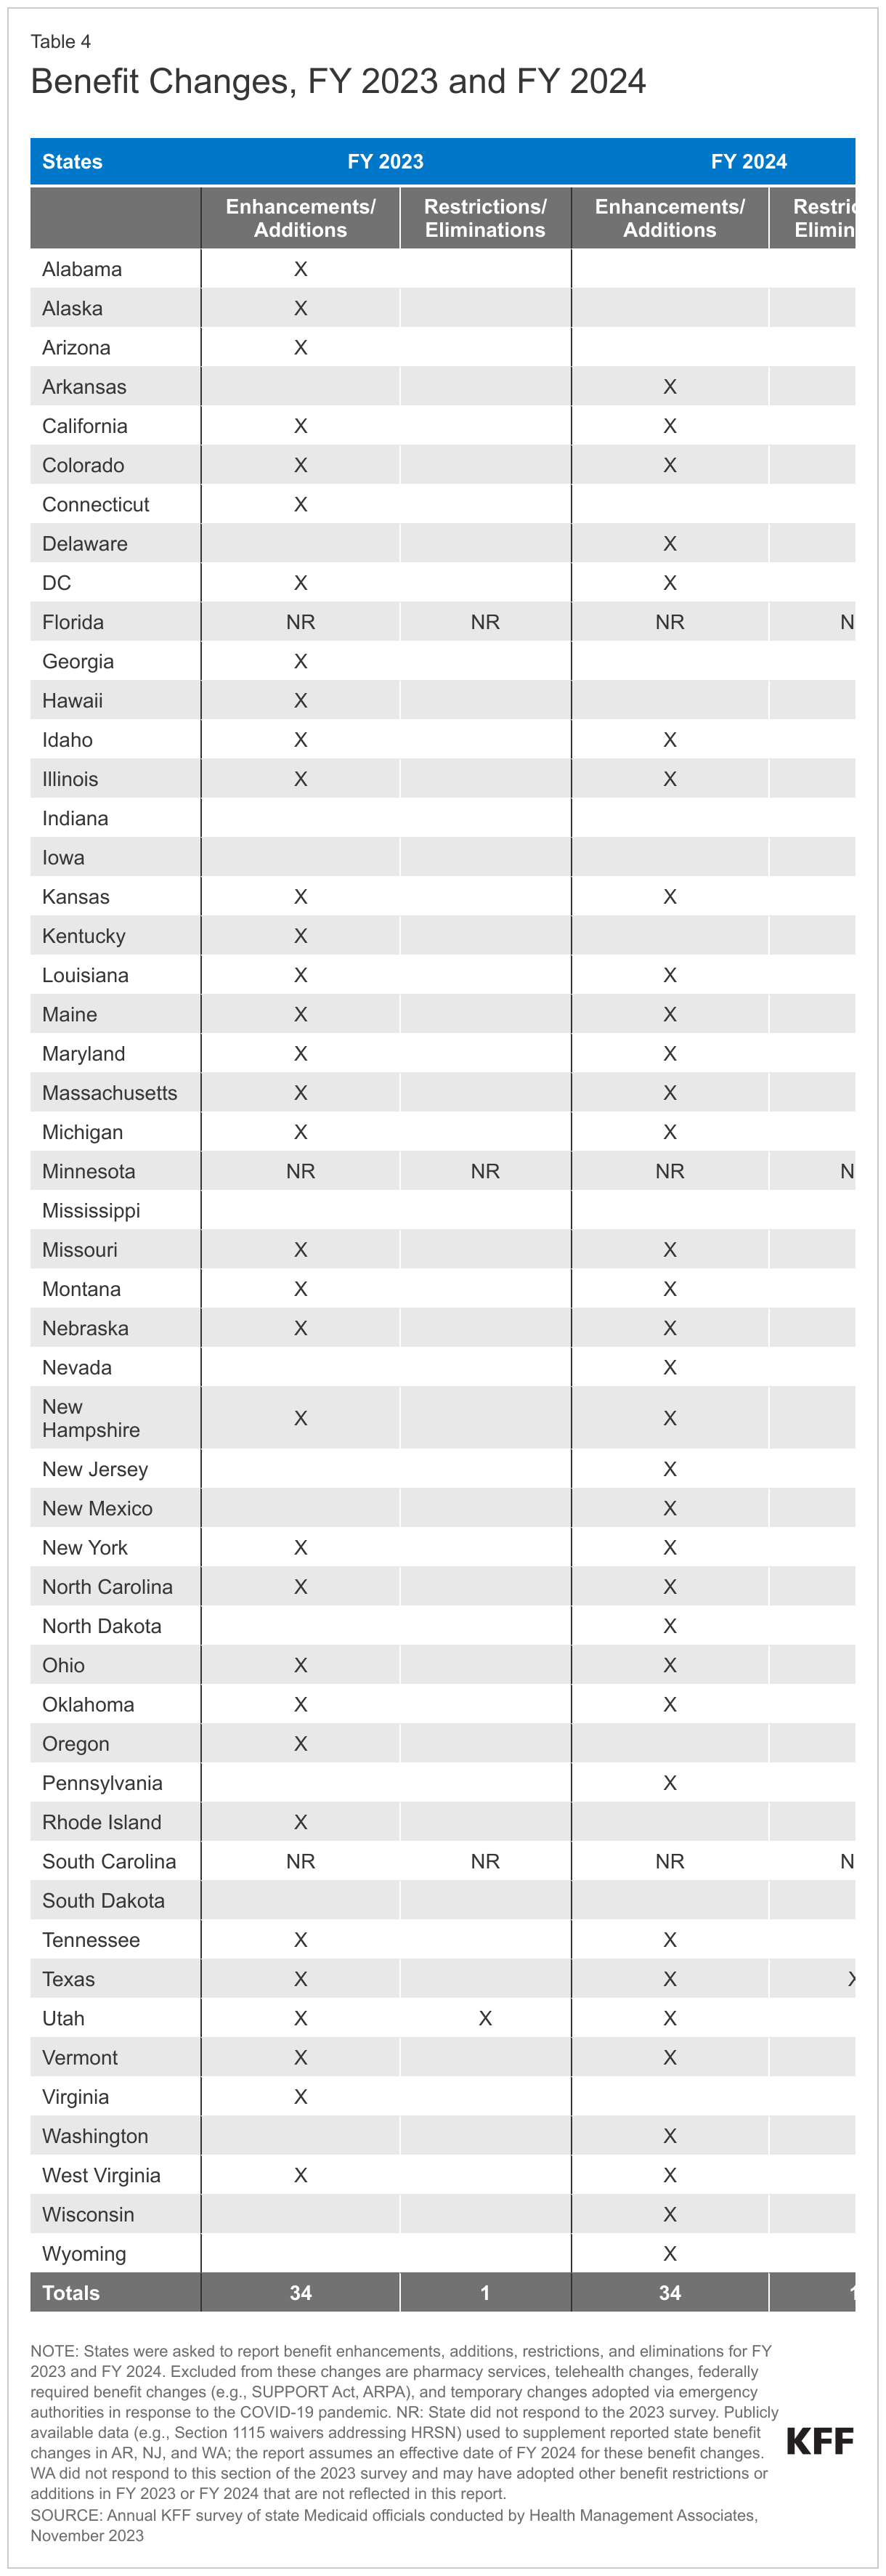
The number of states reporting new benefits and benefit enhancements greatly outpaces the number of states reporting benefit cuts and limitations (Figure 11 and Table 4). Thirty-four states reported new or enhanced benefits in FY 2023, and 34 states reported plans to add or enhance benefits in FY 2024.22 One state reported benefit cuts or limitations in FY 2023 (Utah eliminated coverage of certain gender dysphoria treatments for youth),23 and one state reported cuts or limitations in FY 2024 (Texas limited the age range for dental space maintainer services).24 There are additional details about benefit enhancements or additions in select benefit categories below (Figure 12).
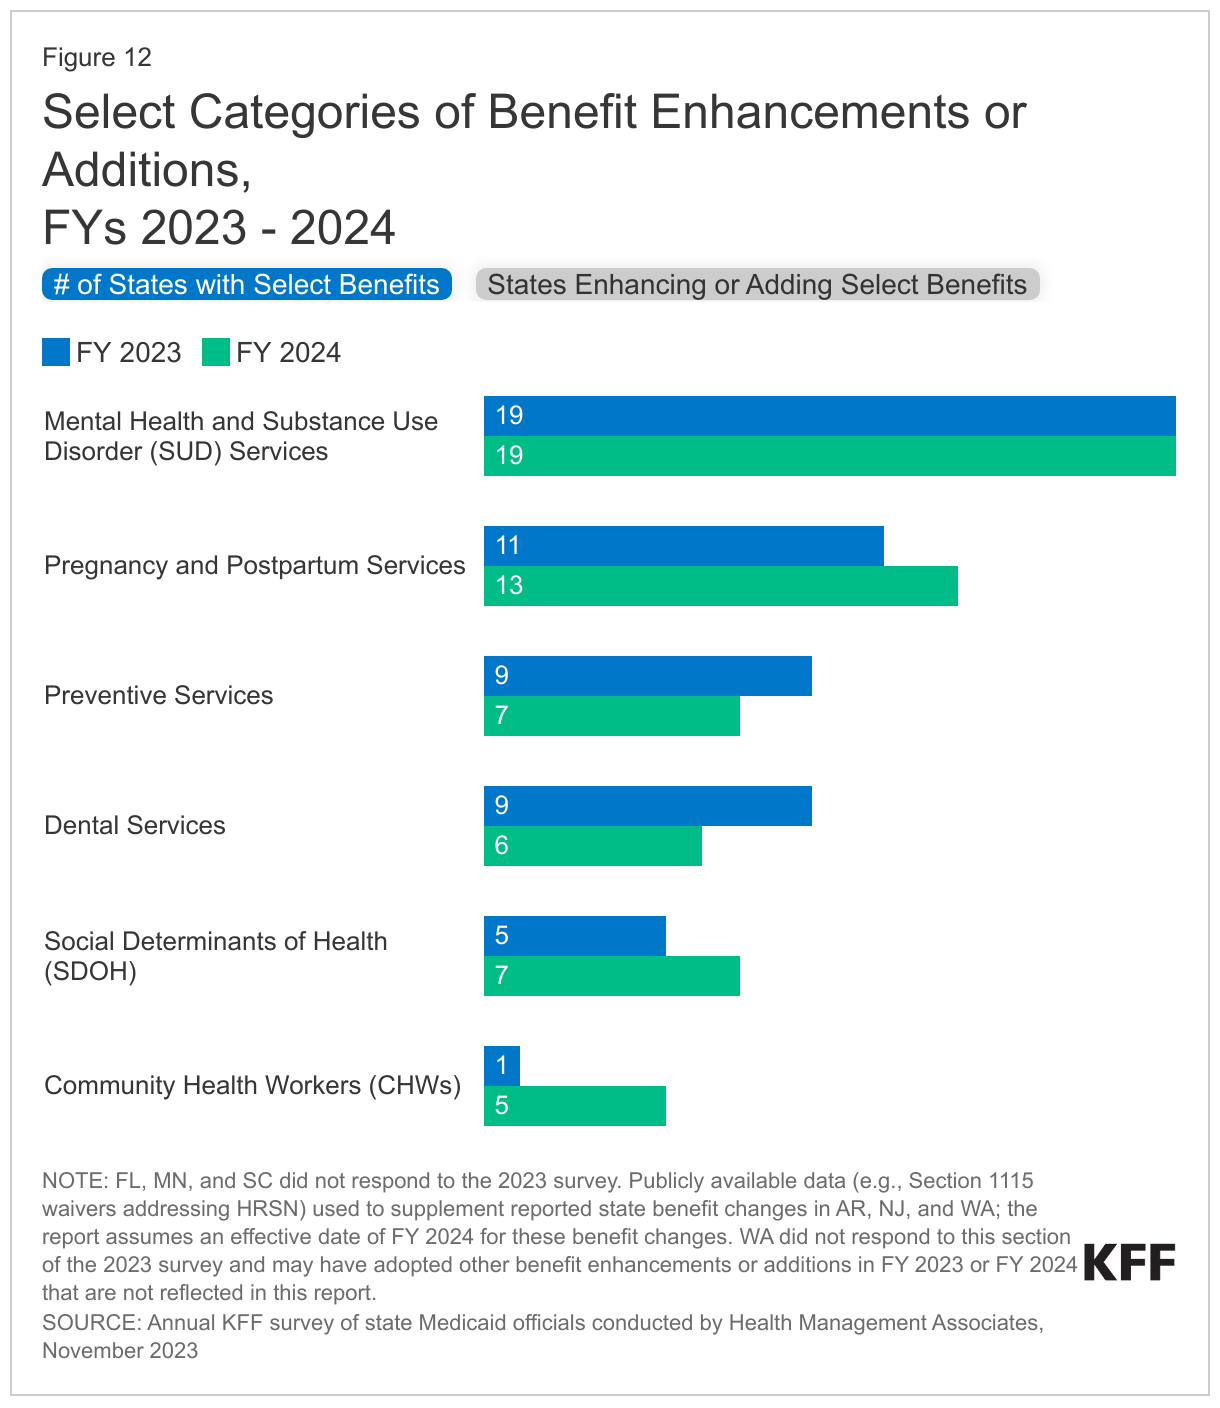
Behavioral Health Services. Mental health and/or Substance Use Disorder (SUD) services continue to be the most frequently reported category of benefit expansions. Consistent with trends in recent years, states reported expanding services across the behavioral health care continuum, including institutional, intensive, outpatient, home and community-based, peer supports, and crisis services. For SUD treatment, this includes expanded access consistent with American Society of Addiction Medicine (ASAM) levels of care. Many of these benefit expansions are targeted to specific populations, including notable expansions and programming for children and youth. States also continue to report benefits and other changes supportive of more coordinated integrated physical and behavioral health care, including collaborative care services and adoption or expansion of Certified Community Behavioral Health Clinics (CCBHCs).25
- At least twelve states reported expanding behavioral health and related services for children and youth,26 including those involved in the child welfare system. These services can prevent the need for more intensive treatment and include therapeutic foster care, respite, and parenting support services. For example, Maine’s Section 1115 “MaineCare” waiver includes a pilot program for parents with SUD involved with, or at risk of involvement with, Child Protective Services. The pilot covers Attachment Biobehavioral Catch-up (ABC), Visit Coaching, and Home-based Skills Development services to offer daily living skills development, increase caregiver knowledge of child development, improve parenting practices, strengthen parent-child attachment, increase child behavioral and biological regulation, and meet the child’s health and safety needs.
- Oklahoma (FY 2023) and Colorado (FY 2024) added safe, secure transportation for enrollees experiencing a behavioral health crisis. Connecticut added coverage for services provided in Mobile Narcotic Treatment Vehicles, which are an extension of the state’s brick-and-mortar Methadone clinics, in FY 2023.
Pregnancy and Postpartum Services. To improve maternal and infant health outcomes and address racial/ethnic health disparities, states continue to expand and enhance pregnancy and postpartum services. (These benefit enhancements are happening alongside the extension of Medicaid postpartum coverage in most states.) Thirteen states reported expanding coverage of doula services.27 Doulas are trained professionals who provide holistic support to individuals before, during, and shortly after childbirth. States also reported adding / expanding coverage of other postpartum supports including lactation services and home visiting programs that aim to support healthy pregnancies and teach positive parenting and other skills to promote self-sufficiency and child wellbeing. A few states report implementing or expanding programs caring for pregnant and postpartum individuals experiencing opioid use disorder or other SUD.
- Six states (Colorado, Illinois, Louisiana, New Hampshire, New Jersey, and Tennessee) reported new benefits to help parents initiate or maintain breast feeding, including breast pumps, human donor milk, and certified lactation counselors and consultants in FY 2023 and FY 2024. Tennessee is proposing to cover diapers for the first two years of a child’s life effective January 2024, pending CMS approval under its TennCare 1115 waiver. Rhode Island added coverage of the evidence-based home visiting program, First Connections in FY 2023. This program serves pregnant individuals and children up to age three with nurse home visits to support breastfeeding and infant feeding, promote healthy growth and development, and connect families with health, mental health, and social supports.
Preventive Services. States are required to provide comprehensive preventive care to children through the EPSDT benefit, and states must cover certain preventive services for adults eligible under the ACA’s Medicaid expansion; however, this coverage is not required for “traditional” Medicaid adults. States reported expanding preventive benefits including screenings, services to prevent and/or manage diabetes (such as continuous glucose monitoring and diabetes self-management training), and access to vaccinations.28
- Four states reported coverage of services provided by pharmacists, including immunizations, patient counseling, and medication therapy management.29
Dental Services. While EPSDT requires states to provide comprehensive dental services for children, states are not required to provide dental benefits to adults. States may choose to provide dental coverage for adults, and historically, some of the states that do include dental benefits provide only limited coverage (e.g., limited to extractions or emergency services). Similar to findings from last year’s survey, several states reported adding comprehensive dental services for adults or other groups, including pregnant individuals or people with disabilities. Other states reported adding or expanding coverage of specific dental services and removing annual dental benefit caps for certain populations.
- North Dakota added coverage of dental case management services in FY 2024, including services to address appointment compliance barriers, care coordination, motivational interviewing techniques, and patient education.
Services Targeting Social Determinants of Health (SDOH). Outside of Medicaid home and community-based services (HCBS) programs, state Medicaid programs have more limited flexibility to address enrollee social needs (e.g., housing, food, transportation etc.). Certain options exist under Medicaid state plan authority as well as Section 1115 waiver authority to add non-clinical benefits. In 2022, CMS released a new framework for covering health-related social needs (HRSN) services under Section 1115 waivers, expanding flexibility for states to add certain short-term housing and nutrition supports as Medicaid benefits (building on CMS guidance from 2021). In this year’s survey, states reported adding home-delivered meals, housing supports, and community violence prevention services.
- In late 2022, CMS approved waivers in four states (Arkansas, Arizona, Massachusetts, and Oregon) under the new HRSN Section 1115 framework. In 2023, CMS approved additional HRSN waivers in Washington and New Jersey.
Community Health Workers (CHWs) / Culturally Competent Care. Several states reported “other” benefit changes to support access to culturally competent care, including coverage of CHWs. CHW services may include culturally appropriate health promotion and education, assistance in accessing medical and non-medical services, translation services, care coordination, patient advocacy, home visits, and social support. Research evidence indicates CHW interventions can be effective in reducing health disparities in communities of color and promoting health equity.30 ,31 ,32
- Six states (Arizona, Kansas, Michigan, Nevada, New York, and Pennsylvania) added or expanded coverage of services provided by CHWs.
- Three states (Arizona, California,33 and New Mexico) are requesting Section 1115 waiver approval to add or expand coverage of traditional native healing practices, which are not currently a Medicaid covered service, for American Indian/Alaska Native (AI/AN) populations. For example, New Mexico’s Turquoise Care Section 1115 Medicaid Demonstration Waiver Renewal Request seeks to expand member-directed traditional healing benefits to all Native American individuals enrolled in managed care.34 If approved, the expansion aims to increase access to culturally appropriate services and improve enrollees’ physical, emotional, and spiritual health. It would have a cap of up to $500 annually.
Box 1: Section 1115 Medicaid Re-entry Waivers
In April 2023, CMS released guidance encouraging states to apply for a new Section 1115 demonstration opportunity to test transition-related strategies to support community re-entry and care transitions for individuals who are incarcerated. This opportunity allows states to partially waive the statutory Medicaid inmate exclusion policy, which prohibits Medicaid from paying for services provided during incarceration (except for inpatient services). This guidance follows CMS’s approval of California’s request to cover a limited package of re-entry services for certain Medicaid-eligible individuals who are incarcerated 90 days prior to release. California will begin providing case management services in April 2024 but will phase in the other pre-release services over two years. In June 2023, CMS approved the second re-entry demonstration in Washington. Washington plans to begin phasing in pre-release services in July 2025.35 As of October 2023, fourteen other states have pending re-entry waiver requests under review at CMS. Waiver requests vary in scope regarding eligibility (all Medicaid-eligible incarcerated individuals or those with certain behavioral or physical health conditions), benefits, and the pre-release coverage period.
Medicaid Coverage or Reimbursement of School-Based Health Services
Schools can be a key setting for providing services to Medicaid-covered children. Medicaid programs may reimburse schools for medically necessary services that are part of a student’s Individualized Education Plan (IEP) under the Individuals with Disabilities Education Act. Medicaid can also reimburse school-based health centers (SBHCs) for services provided to Medicaid-covered children, including routine screenings, preventive care, behavioral health care, and/or acute care services. Since 2014, CMS has permitted payment for any Medicaid services delivered to covered children, regardless of whether the school provides these services to all students without charge. Federal agencies have in the past raised concerns about poor oversight and improper Medicaid billing for school-based services; these agencies also noted that CMS’s claiming guide had not been updated since 2003. On this year’s survey, states were asked if they took action in FY 2023 or plan to take action in FY 2024 to expand Medicaid coverage or reimbursement of school-based health services. In May 2023, CMS released an updated school-based services claiming guide.
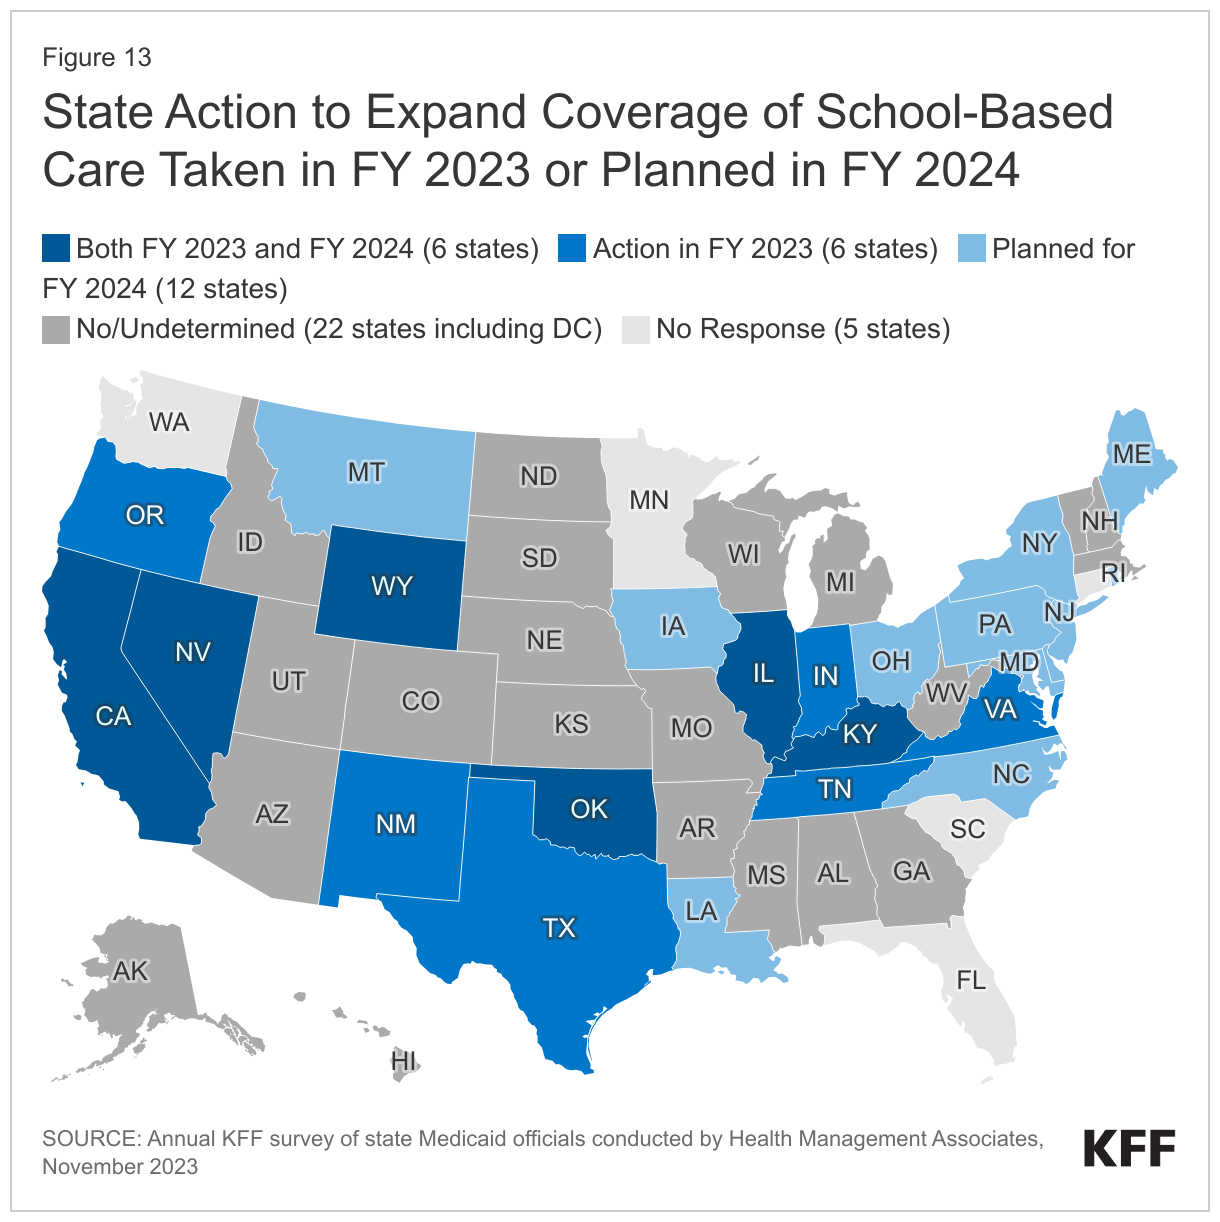
About half of responding states (24 of 46) expanded coverage of school-based care in FY 2023 or planned to do so in FY 2024—a number that may increase as states absorb new CMS guidance (Figure 13). In addition to recent or planned changes, a few states (including Arizona and Nevada) expanded access to school-based care in FY 2022 or earlier. States reported the following types of coverage expansions:
- Expanding covered populations or services. Approximately half of the 24 states reported that they expanded or plan to expand coverage of school-based services beyond just students with an IEP or services covered in an IEP. Some states reported extending coverage to students with 504 plans or other special education plans, while other states were planning broader expansions. For example, Pennsylvania is planning to offer all Medicaid-covered school-based services to all Medicaid-eligible students. While most states focused on broadening the eligible populations, some states such as Oregon, New Jersey, and Texas added new coverage in schools for services such as eye exams, dental screenings, telehealth services, or school-based behavioral health services.
- Adjustments to reimbursement rates or methods. Several states reported changes to reimbursement rates or methods. For example, Illinois reported moving to a cost settlement reimbursement methodology, Oklahoma implemented a Medicaid administrative claiming program, and New York increased reimbursement rates for school-based services. Another state, Tennessee, focused on the administrative aspects of billing by extending the definition of timely filing from 120 to 365 days for some school-based care and requiring MCOs to contract with any school district that seeks a contract for medically necessary, covered school-based services based on the MCO’s standard fee schedule.
- Efforts to increase inter-agency coordination and local school agency participation. A few states reported efforts to improve collaboration between state agencies and local school districts through outreach and training sessions or other technical assistance. For instance, California has allocated $389 million to a school-based behavioral health initiative, aiming to enhance coordination among local education agencies, MCOs, and county behavioral health entities. Similarly, Kentucky has promoted school engagement by offering technical guidance on the implementation and billing of extended school-based care, with further outreach activities scheduled for FY 2024.
Of the 24 states that reported action to expand access to school-based care, half reported implementation challenges. Challenges reported included administrative complexity, confusion about billing and insufficient systems to ensure proper billing, Medicaid claiming and HIPAA compliant record-keeping. States also mentioned provider shortages and coordinating with local school agencies as implementation hurdles.
Pharmacy
Context
States may administer the Medicaid pharmacy benefit on their own or may contract out one or more functions to other parties, including delivery of benefits through managed care organizations (MCOs) and pharmacy benefit managers (PBMs). PBMs may perform a variety of administrative and clinical services for Medicaid programs (e.g., developing a provider network, negotiating rebates with drug manufacturers, adjudicating claims, monitoring utilization, overseeing preferred drug lists (PDLs), etc.) and are used in fee-for-service (FFS) and managed care settings. However, PBMs have been under increasing scrutiny in recent years as more states recognize a need for transparency and oversight. All states have adopted at least one law to regulate PBMs, and legislation to limit spread pricing and increase transparency is also being considered at the federal level.
Managing the Medicaid prescription drug benefit and pharmacy expenditures is a policy priority for state Medicaid programs. Prescription drugs account for approximately 5% of total Medicaid spending, and Medicaid gross and net spending on prescription drugs has increased since 2018 despite a utilization decrease during the COVID-19 pandemic, likely due to increased spending on high-cost drugs. These new high-cost drugs, including cell and gene therapies, can put pressure on state budgets. Under the federal Medicaid Drug Rebate Program (MDRP), states must cover nearly all FDA-approved drugs from rebating manufacturers but can use an array of payment strategies and utilization controls to manage pharmacy expenditures, including PDLs, managed care pharmacy carve-outs, and value-based arrangements (VBAs) negotiated with individual pharmaceutical manufacturers that increase supplemental rebates or refund payments to the state if the drug does not perform as expected. At the federal level, CMS recently issued a proposed rule aimed at increasing price transparency, and there have been recent bills under consideration with Medicaid drug pricing provisions and potential implications for Medicaid drug spending. Further, the passage of the Inflation Reduction Act included a number of prescription drug reforms that primarily apply to Medicare; however, some of the provisions interact with the MDRP and may lead to increases in Medicaid prescription drug spending.
There is particular focus among all payers right now on a new class of drugs to treat obesity. A long-standing statutory exception allows states to choose whether to cover weight-loss drugs under Medicaid, leading to variation in coverage policies across states. Some states may be re-evaluating their coverage of anti-obesity or weight-loss drugs due to the emergence of a new group of highly effective weight-loss agents known as GLP-1 (glucagon-like peptide-1) agonists, including Ozempic, Rybelsus, Wegovy, and Mounjaro. (Ozempic, Rybelsus, and Mounjaro are drugs approved to treat diabetes, and covered by Medicaid for that purpose in all states; however, off-label coverage for weight loss in Medicaid may be limited.) Expanding coverage of weight-loss drugs under Medicaid would increase access to these medications that remain unaffordable or inaccessible for many but, at the same time, would likely contribute to increases in Medicaid drug spending. New American Academy of Pediatrics (AAP) guidelines also now recommend pharmacotherapy obesity treatment for children ages 12 and older. Changes in physicians’ practice stemming from the updated treatment recommendations could have an impact on Medicaid programs and enrollees because Medicaid now covers half of all children in the U.S., and an even larger percentage of children who are likely to have obesity.
This section provides information about:
- Managed care’s role in administering pharmacy benefits
- Pharmacy cost containment
- Coverage of anti-obesity or weight loss drugs
Findings
Managed Care’s Role in Administering Pharmacy Benefits
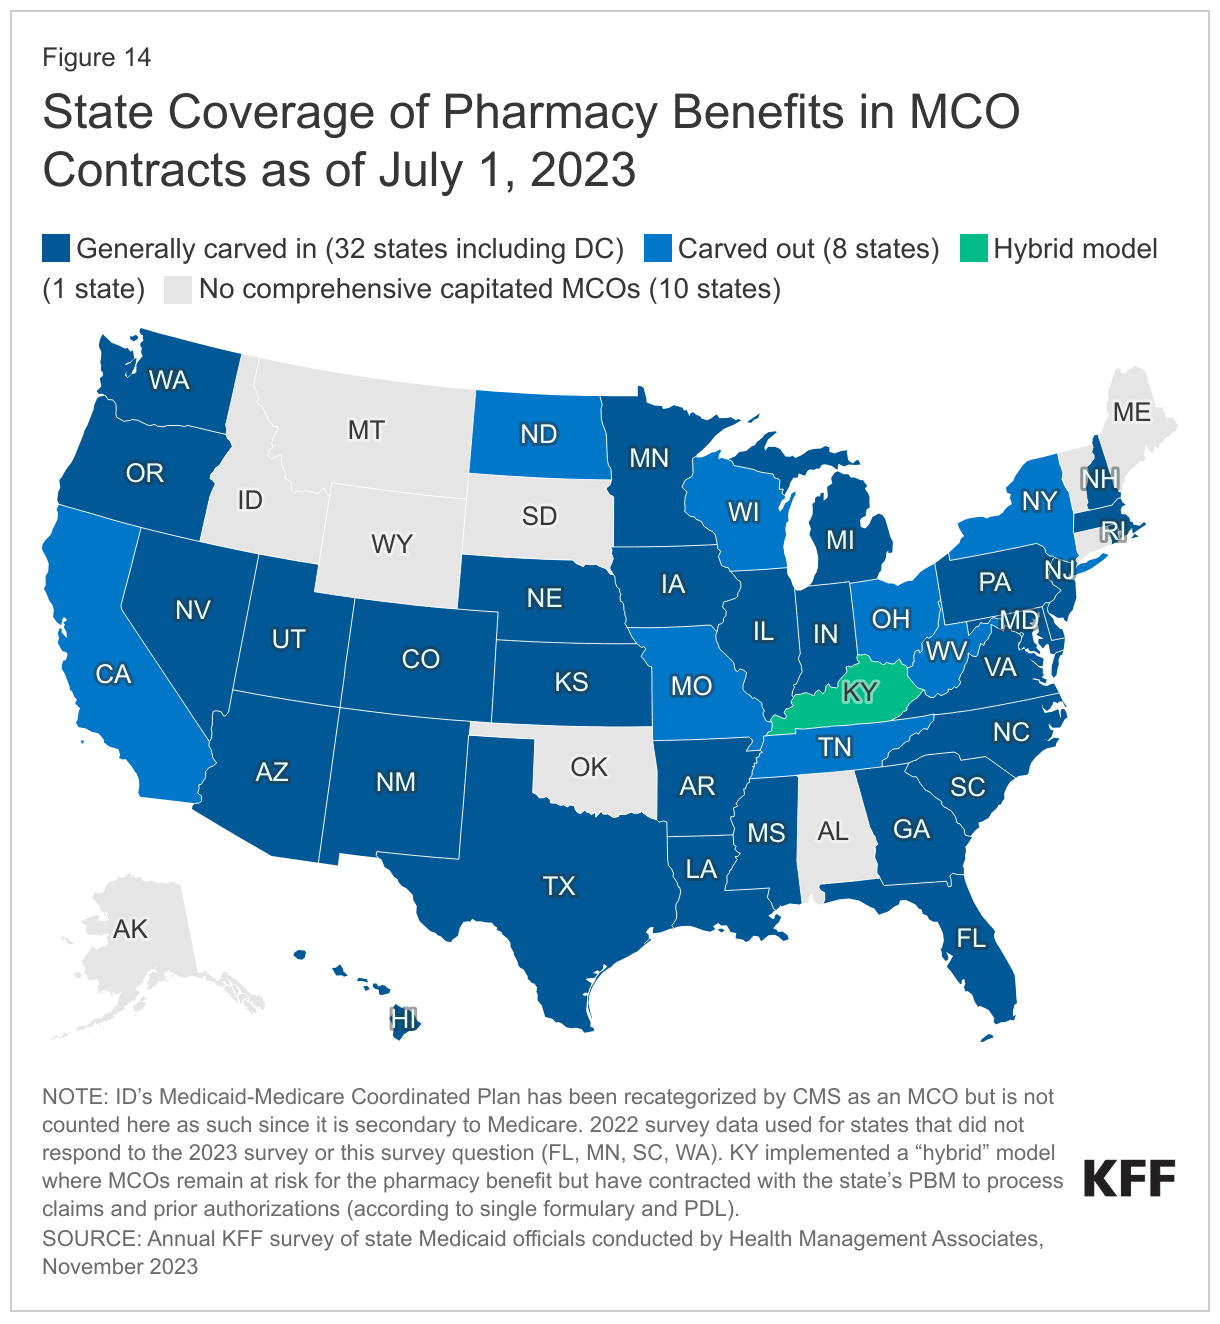
Most states that contract with MCOs include Medicaid pharmacy benefits in their MCO contracts, but eight states “carve out” prescription drug coverage from managed care. While the vast majority of states that contract with MCOs report that the pharmacy benefit is carved in to managed care (32 of 41), eight states (California, Missouri, New York, North Dakota, Ohio, Tennessee, Wisconsin, and West Virginia) report that pharmacy benefits are carved out of MCO contracts as of July 1, 2023 (Figure 14). As of April 1, 2023, New York carved the pharmacy benefit out of managed care, becoming the latest state to implement a full pharmacy carve-out. Instead of implementing a traditional carve-out of pharmacy from managed care, Kentucky contracts with a single PBM for the managed care population. Under this “hybrid” model, MCOs remain at risk for the pharmacy benefit but must contract with the state’s PBM to process pharmacy claims and pharmacy prior authorizations according to a single formulary and PDL. Louisiana and Mississippi report that they are moving to a similar model in FY 2024. In addition, about half of the responding states that generally carve in pharmacy benefits reported carving out one or more specific drug classes from MCO capitation payments as of July 1, 2023. Some of the most commonly carved out drugs include hemophilia products, spinal muscular atrophy agents, hepatitis C drugs, and behavioral health drugs such as psychotropic medications.
Cost Containment Initiatives
Over two-thirds of responding states reported at least one new or expanded initiative to contain prescription drug costs in FY 2023 or FY 2024. On this year’s survey, states were asked to describe any new or expanded pharmacy program cost containment strategies implemented in FY 2023 or planned for FY 2024, including initiatives to address PBM spread pricing and value-based arrangements. States were asked to exclude routine updates, such as to PDLs or state maximum allowable cost programs, as these utilization management strategies are employed by states regularly and are not typically considered major new or expanded policy initiatives.
The largest share of states noting new cost containment policy changes reported initiatives related to value-based arrangements (VBAs) with pharmaceutical manufacturers as a way to control pharmacy costs. Over one-third of responding states reported working toward, implementing, or expanding VBA efforts in FY 2023 or FY 2024. This includes states that are just beginning to lay the groundwork for VBAs in their state, which can include submitting a State Plan Amendment (SPA) to allow VBAs and negotiations with manufacturers. Some examples of drugs targeted for VBAs include hepatitis C treatment, accelerated approval drugs, and long-acting injectable (LAI) antipsychotics. Last year’s survey asked if states had a VBA in place as of July 1, 2022 and found only seven states had VBAs at that time. Though this year’s survey did not specifically ask what states had VBAs in place and instead asked about new or expanded cost containment initiatives more broadly, state interest in VBAs for high-cost drugs appears to be accelerating. Four of the seven states with VBAs in place from last year’s survey also reported plans to expand VBAs in their state in this year’s survey.
While VBAs were the most commonly reported initiative, states also reported a variety of other cost containment policy changes related to utilization management and rebate maximization generally. Among states that reported at least one cost containment initiative, a number reported new or expanded pharmacy cost containment initiatives that target physician administered and/or biologic drugs. These drugs can be very costly, and states are employing strategies to mitigate the cost impact to providers and MCOs. Specific cost containment policy changes reported in FY 2023 and FY 2024 include:
- Significant PDL or rebate changes. At least three states (Alaska, Delaware, and Kentucky) reported initiatives to significantly update or expand their PDLs. Six other states reported new PDL initiatives: Arkansas and South Dakota joined multi-state purchasing pools in FY 2023. Connecticut and Montana moved items traditionally covered as durable medical equipment to pharmacy to allow the state to collect manufacturer rebates on items such as continuous glucose monitors. Maine and Vermont created PDLs for biosimilar physician administered drugs in FY 2023. Maine will require identification of non-340B physician administered drugs on claims to allow the state to capture rebates for these drugs. South Dakota implemented a limited PDL and began collecting supplemental rebates.
- Medication Therapy Management (MTM) Services. At least six states (Alaska, District of Columbia, Hawaii, Mississippi, New Hampshire, and Oklahoma) reported implementing or expanding medication therapy management services to increase adherence, reduce adverse drug events, and improve outcomes in either FY 2023 or FY 2024. By improving management of disease through medication compliance, the states also hope to control costs.
- Uniform PDLs. Uniform PDLs help states maximize supplemental rebates by covering drugs administered under both the FFS and managed care delivery system. They also streamline pharmacy benefit coverage and access for enrollees and providers. At least four states (Indiana, Kentucky, Massachusetts, and Michigan) reported creating or expanding uniform PDL policies for at least a subset of drugs as a cost containment initiative in FY 2023. New Mexico plans to implement a uniform PDL in FY 2025.
- PBMs. At least six states reported initiatives related to PBMs. Ohio in FY 2023 and Louisiana and Mississippi in FY 2024 plan to move to contracting with a single PBM. Tennessee plans to create a partial risk-sharing program with its PBM in FY 2024 with the goal of improving medication compliance and medical outcomes. New Hampshire reported new clawback contract language in FY 2023, and Delaware plans to expand an initiative on PBM reporting in FY 2024. This year saw fewer initiatives related to PBM transparency and spread pricing than previous survey years, but states have taken significant action on this front since 2016.
- A few states reported other cost containment strategies. Mississippi reported introducing a high-cost drug risk corridor into managed care contracts starting in FY 2023, which allowed them to carve in all drugs that were previously carved out. Two states, Vermont and Utah, plan to carve out certain high-cost drugs in FY 2023 and FY 2024, respectively. Nevada will implement a physician-administered drug fee schedule and a specialty physician-administered drug management program in FY 2024. North Carolina is enforcing 340B ceiling price limits, and a few states also mentioned efforts related to quantity limits and utilization management.
Coverage of Weight-Loss Drugs
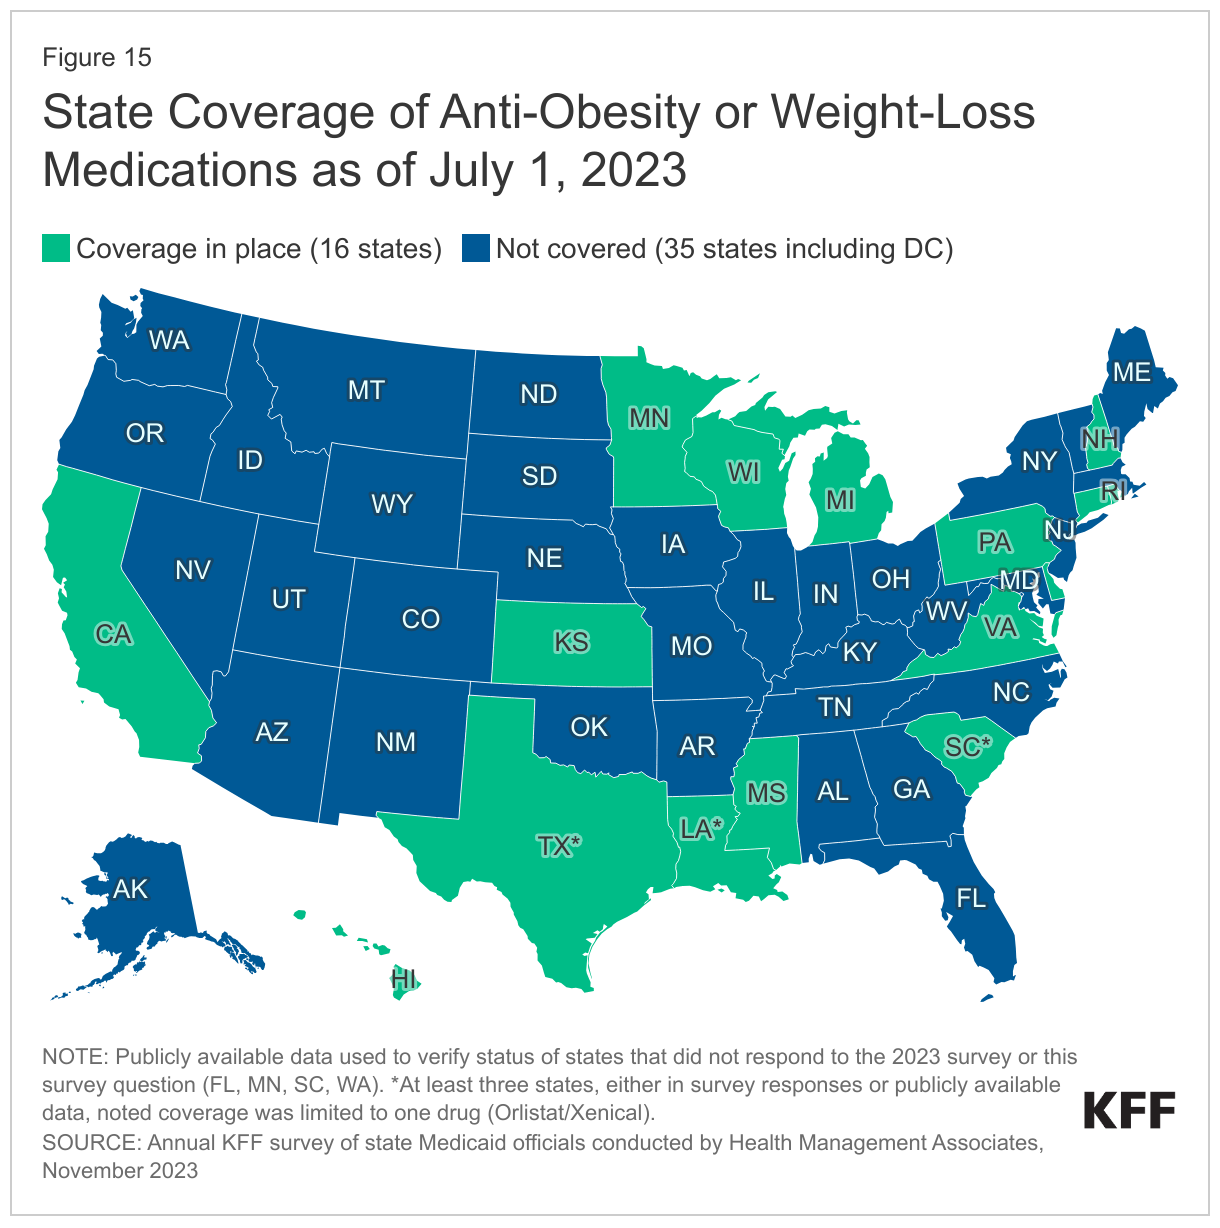
Sixteen state Medicaid programs reported covering at least one weight-loss medication for the treatment of obesity for adults under FFS as of July 1, 2023 (Figure 15). The survey asked states to identify whether they covered anti-obesity or weight-loss medications for adults when prescribed for the treatment of obesity under FFS and if a co-morbid condition was required. At least ten states that reported covering these medications noted a comorbidity was required. Though not specifically addressed in the survey, at least three states also noted coverage was limited to one drug (Orlistat/Xenical) at this time,36 and a few states mentioned imposing body mass index (BMI) or prior authorization requirements when covering these drugs. While indicating they do not currently cover weight-loss drugs, at least five states (Illinois, Massachusetts, New Mexico, Utah, and Vermont) noted they were evaluating or considering adding coverage.
Telehealth
Context
States have broad authority to determine whether and how to cover telehealth in Medicaid. While all states had some form of Medicaid telehealth coverage prior to the pandemic, policies regarding allowable services, providers, and originating sites varied widely;37 further, Medicaid telehealth payment policies were unclear in many states.38 To increase health care access and limit risk of viral exposure during the pandemic, all 50 states and the District of Columbia expanded coverage and/or access to telehealth services in Medicaid. For example, states expanded the range of services that can be delivered via telehealth; established payment parity with face-to-face visits; expanded permitted telehealth modalities; and broadened the provider types that may be reimbursed for telehealth services. These telehealth expansions contributed to substantial growth in Medicaid and CHIP services delivered via telehealth during the first months of the PHE. States reported and CMS data show that behavioral health services delivered via telehealth increased dramatically during the PHE. Overall, per-enrollee telehealth use in Medicaid and CHIP spiked in April 2020, stabilized from June 2020 through March 2021, and then decreased through July 2022.
A key issue to watch going forward will be CMS rulemaking. CMS is expected to finalize rules in the months ahead that relate to enrollees’ ability to access services, and are specifically designed in part to “strengthen standards for timely access to care,” which may have implications for telehealth policy.
This section provides information about:
- Telehealth policy changes implemented in FY 2023 or planned for FY 2024
- State strategies to assess/improve telehealth quality used in FY 2023 or planned for FY 2024
Findings
Telehealth Policy Changes FY 2023 AND FY 2024
During the COVID-19 pandemic, many states used temporary Medicaid emergency authorities to expand telehealth coverage and also took advantage of their existing broad authority to further expand telehealth without the need for CMS approval. By 2022, states reported making permanent a broad range of temporary policies that were adopted to expand the use of telehealth during the pandemic as well as limiting certain telehealth policies (e.g., coverage of or payment parity for audio-only) that were implemented on an emergency basis. In this year’s survey, states were asked to indicate whether telehealth policy changes were implemented in FY 2023 or were planned for FY 2024 in key telehealth areas where states have discretion including services covered via telehealth, provider types reimbursed, allowable modalities, originating site policies, and reimbursement parity. States were asked to include any changes to current policy – even if the policy being changed was temporary due to the COVID-19 PHE.
While state responses suggest telehealth policy has largely stabilized after rapid expansion during the pandemic, states that reported telehealth policy changes in FY 2023 or FY 2024 reported more expansions than limits. The most frequent expansions to telehealth policy reported were for allowable modalities, services covered via telehealth, and provider types reimbursed. The most frequent limits reported were for services delivered via telehealth. Examples of state telehealth policy changes implemented in FY 2023 or planned for FY 2024 are described below:
- Services Covered. Several responding states indicated some service limitations went into effect at the end of the federal PHE (which ended on May 11, 2023). For example, Colorado reported temporary coverage of well-child visits via telehealth ended at the end of the PHE. Pennsylvania reported ending temporary Appendix K flexibility for remote/telehealth services in the state’s aging and physical disabilities waivers. Several responding states also reported expanding services covered via telehealth in FY 2023. For example, Texas reported an expansion of telehealth coverage for mental health and Substance Use Disorder treatment services in FY 2023.
- Provider Types Reimbursed. While few states reported changes to provider types allowed to be reimbursed for telehealth services, most provider type policy changes reported were expansions. For example, Michigan reported that during the PHE the state expanded allowable providers to physical therapy (PT), occupational therapy (OT), speech-language pathology (SLP), audiologists, and dentists and at the end of the PHE the state made these allowable provider types permanent. In FY 2024, Kansas reported plans to expand telehealth policy to cover out of state providers. North Dakota reported plans to cover certain teledentistry services in FY 2024.
- Allowable Modalities. While a few states reported expanding coverage of audio-only services in FY 2023, a few states reported discontinuing reimbursement of audio-only for some services. Hawaii reported audio-only modality was limited to behavioral health services (in accordance with 2023 Hawaii state legislation) at the end of the federal PHE. During state interviews, a number of states noted the ongoing evaluation of the efficacy and appropriateness of services delivered by audio-only modality as well as the modality’s impact on disparities. Four states (California, New York, Texas, and Vermont) cited remote patient monitoring (RPM) as a modality expansion in FY 2023, while Massachusetts noted considering expansion of RPM in FY 2024. Three states (Colorado, Massachusetts and New York) reported expanding coverage to allow for e-consults in FY 2023 or FY 2024.
Few states reported originating site or reimbursement parity policy changes. Most policy changes reported in these areas were expansions (i.e., liberalizing originating site definitions (to allow patients to receive telehealth services from their homes) or establishing or making telehealth payment parity permanent).
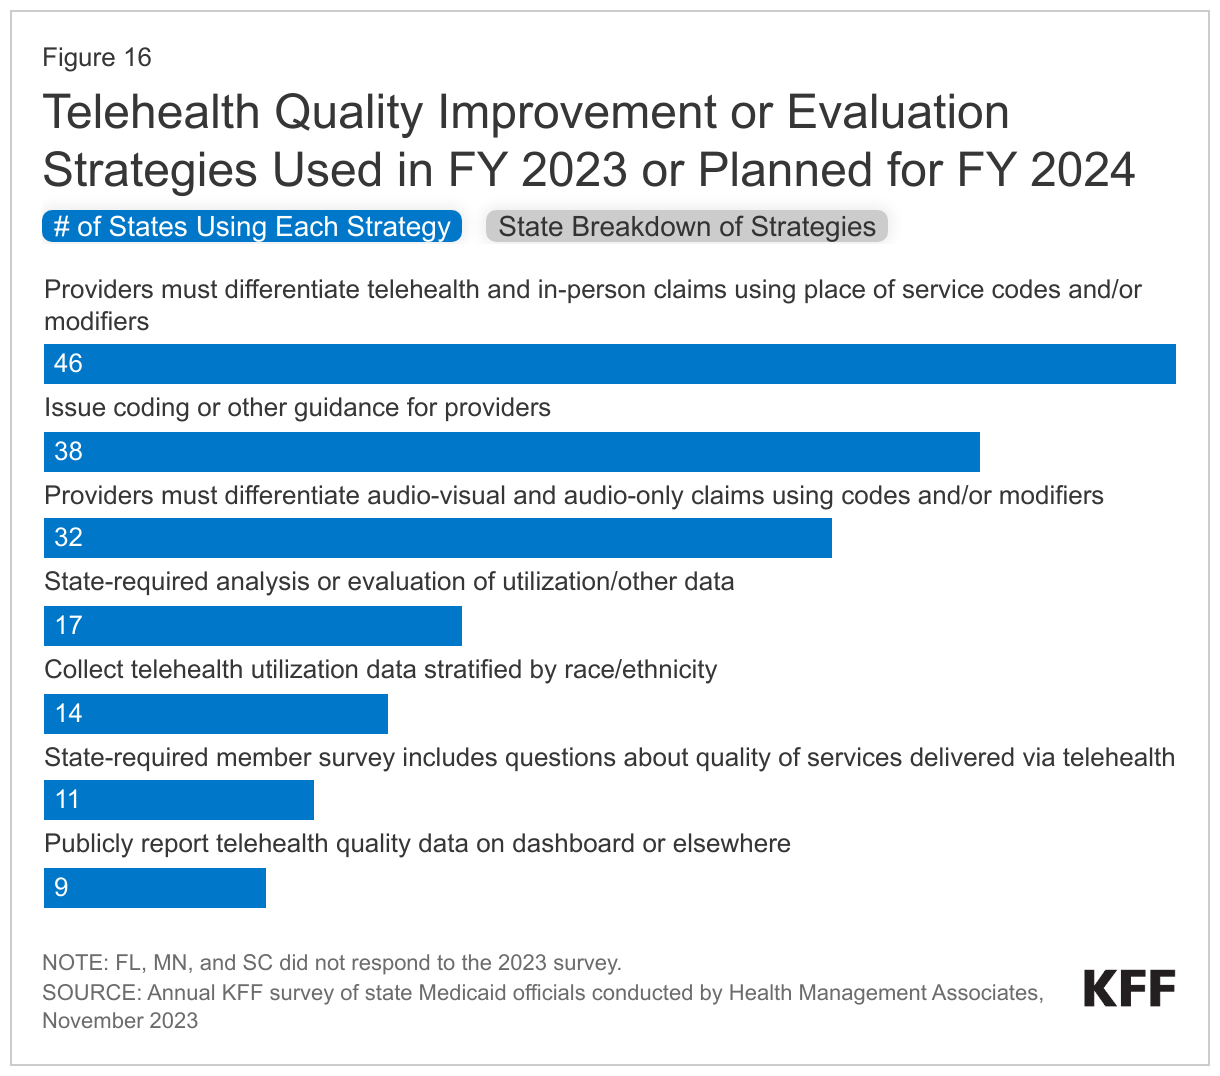
Telehealth Quality
The rapid expansion of Medicaid telehealth policies and utilization during the pandemic prompted questions about the quality of services delivered via telehealth. To fulfill a directive in the 2020 Coronavirus Aid, Relief, and Economic Security (CARES) Act to report on the federal pandemic response, in March 2022 the Government Accountability Office (GAO) released a report that analyzed states’ experiences with telehealth in Medicaid and evaluated state and federal oversight of quality of care and program integrity risks.39 In the report, the GAO raised concerns about the impact of telehealth delivery on quality of care for Medicaid enrollees and recommended that CMS collect information to assess these effects and inform state decisions. CMS acknowledged but has not yet acted on these recommendations. Further, the 2022 Bipartisan Safer Communities Act directs the agency to issue guidance to states on options and best practices for expanding access to telehealth in Medicaid, including strategies for evaluating the impact of telehealth on quality and outcomes.40
The survey asked states to identify Medicaid agency strategies to assess/improve telehealth quality used in FY 2023 or planned for FY 2024 (Figure 16). Most responding states reported requiring providers to differentiate telehealth and in-person claims using place of service codes and/or modifiers. Slightly fewer, but more than half of responding states reported requiring providers to differentiate audio-visual and audio-only claims using codes and/or modifiers. About one-third of responding states reported state-required analysis of evaluation or utilization or other data, and a similar number of states reported collecting telehealth utilization data stratified by race/ethnicity (which may assist states in better understanding disparities in telehealth use and access by race/ethnicity).
Future Outlook: Key Priorities And Challenges In Fy 2024 And Beyond
After three years of operating under the COVID-19 pandemic PHE and the Medicaid continuous enrollment provision, the PHE ended in May 2023, and the Consolidated Appropriations Act, 2023, was enacted, ending the Medicaid continuous coverage requirement as of March 31, 2023 and phasing out the pandemic-related enhanced federal matching funds by the end of 2023. At the time of the survey, all states remained heavily focused on completing Medicaid redeterminations and were employing a variety of strategies such as adopting unwinding waivers to streamline the process, conducting new and enhanced outreach to enrollees, and investing in system enhancements to increase automatic renewals designed to maintain coverage for eligible individuals. A number of states also commented on the challenges of completing the redeterminations while at the same time maintaining ongoing business operations and/or pursuing new high priority initiatives. Beyond unwinding of the continuous enrollment provision, states reported other pressing challenges and key priorities (Figure 17).
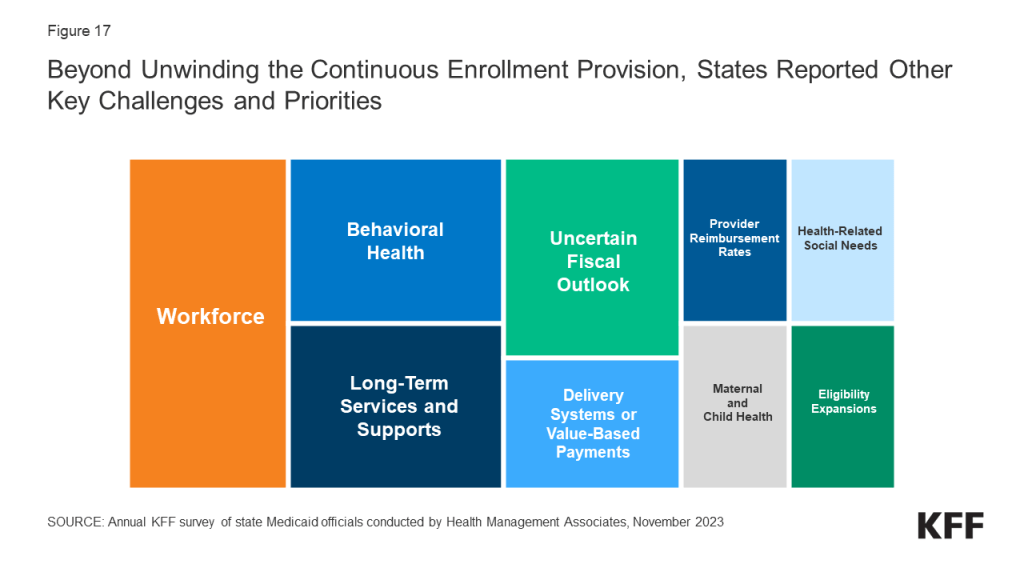
Three quarters of responding states reported workforce challenges relating to health care providers, state staff, or both. States frequently reported shortages of nurses, direct care workers, and behavioral health providers often resulting in access challenges for children’s behavioral health services, dental services, primary and maternity care, home and community-based services (HCBS), and institutional services. One state also cited OB (obstetrics) deserts and hospital closures in rural areas as challenges affecting all payers, not just Medicaid. More than a third of responding states also cited state staff workforce challenges including the difficulty of recruiting and retaining staff with specialized technical expertise and the need for greater “bandwidth” to implement and manage complex projects. Other states noted losses of institutional knowledge within state staff, burnout, and the need to ramp up recruitment and succession planning in anticipation of a large number of state staff retirements in the next few years.
More than half of responding states identified behavioral health improvements as a key priority or challenge. For example, states are working to expand access to behavioral health services through efforts to build out the behavioral health continuum of care, integrate physical health and behavioral health services, implement mobile crisis services, expand behavioral health services in schools, and add coverage of evidence-based behavioral health service models. Several states commented on efforts to implement Certified Community Behavioral Health Clinics (CCBHCs) and others referred more generally to behavioral health reform or statewide behavioral health transformation efforts which may include but extend beyond the Medicaid program. In alignment with the state-identified behavioral health priorities, a quarter of responding states reported significant behavioral health challenges including workforce shortages, lack of access to behavioral health services, especially for children and youth, gaps in the behavioral health service continuum, and the challenge of integrating physical health and behavioral health.
More than half of responding states cited a key priority or challenge related to long-term services and supports (LTSS). Several states reported that sustaining implementation of HCBS expansions made possible by pandemic-related flexibilities and enhanced funding made available in the 2021 American Rescue Plan Act (ARPA) remained a top priority. Others reported LTSS priorities included nursing facility payment transformation and quality improvement, implementation of LTSS managed care, expansion of HCBS waiver slots, compliance with the HCBS Settings Rule, implementation of an Electronic Visit Verification system, and LTSS redesign efforts to enhance HCBS compliance and quality. Several states highlighted LTSS-related challenges including workforce shortages, the aging of the population, LTSS access, and nursing facility and HCBS provider financial challenges.
More than one-third of responding states reported a delivery system improvement or value-based payment initiative as a key priority. Several states commented on planned managed care re-procurements that would incorporate enhanced quality and outcomes expectations, two states (North Carolina and Oklahoma) reported planned or ongoing managed care implementations, and one state (Idaho) reported on the implementation of “value care organizations” (similar to Accountable Care Organizations). Other states reported on ongoing delivery system reform efforts under waiver authority, new quality incentive and value-based payment programs, initiatives to replace primary care case management programs with a new care management model or alternative payment model (APM), and efforts to strengthen managed care oversight.
While most states at the time of the survey reported favorable state fiscal conditions, over half of responding states noted an uncertain fiscal outlook. Some cited the expiration of one-time funding, especially ARPA funds for the HCBS services, while others noted the end of the pandemic-related enhanced federal matching funds as a challenge. Other states commented on the budgetary impacts of inflation, workforce challenges, provider pressure to increase reimbursement rates, the challenge of working with the legislature to craft the budget, and the general ongoing expectation for responsible budget management with sustainable growth. One state also commented on the need for contingency plans to address “potential headwinds.”
Other key priorities cited by more than one-quarter of responding states include: addressing health-related social needs, improving provider reimbursement rates and/or performing rate studies, implementing initiatives to improve maternal and child health, and expanding eligibility. Specifically, states mentioned implementing the option to expand postpartum coverage and preparing for the required implementation of 12-month continuous coverage for children as key eligibility expansions. Compared with past surveys, somewhat fewer states mentioned IT system modernization initiatives as key priorities, although nearly a quarter reported an IT system-related priority and several states reported significant IT challenges.
Methods
KFF commissioned Health Management Associates (HMA) to survey Medicaid directors in all 50 states and the District of Columbia to identify and track trends in Medicaid spending, enrollment, and policy making. This is the 23rd annual survey conducted at the beginning of the state fiscal year (FY) from FY 2002 through FY 2024. Additionally, ten mid-fiscal year surveys were conducted during state fiscal years 2002-2004, 2009-2013, 2021, and 2022 when a large share of states were considering mid-year Medicaid policy changes due to state budget and revenue shortfalls and/or the COVID-19 pandemic. Findings from previous surveys are referenced in this report when they help to highlight current trends. Archived copies of past reports are available on the following page.
The KFF/HMA Medicaid survey on which this report is based was sent to state Medicaid directors in June 2023. The survey instrument (in Appendix) was designed to document policy actions in place in FY 2023 and implemented or planned for FY 2024 (which began for most states on July 1, 2023).41 The survey captures information consistent with previous surveys, particularly for provider payment rates, benefits, and managed care, to provide some trend information. Each year, questions are added or revised to address current issues.
Medicaid directors and staff provided data for this report in response to a written survey and a follow-up telephone interview. Overall, 48 states responded in mid-summer of 2023, though response rates for specific questions varied.42 Forty-four states participated in a follow-up telephone interview, conducted between July and September 2023.43 The telephone discussions are an important part of the survey to ensure complete and accurate responses and to record additional context for and complexities of state actions. The District of Columbia is counted as a state for the purposes of this report, and the U.S. territories were not included in this analysis, given differences in the financing structure of their programs.
The survey does not attempt to catalog all Medicaid policies in place for each state. This report highlights certain policies in place in state Medicaid programs in FY 2023 and policy changes implemented or planned for FY 2024. Experience has shown that adopted policies are sometimes delayed or not implemented for reasons related to legal, fiscal, administrative, systems, or political considerations, or due to delays in approval from CMS. While the unwinding of the pandemic-related continuous enrollment provision and enhanced federal match rate were the dominant Medicaid policy issues when states completed this survey, states were also focused on an array of other priorities that ranged from core program operations and the unwinding of other pandemic-related emergency policies to pursuing and implementing new initiatives.
Appendix
Survey Instrument
Download the Survey (.pdf)
Endnotes
- State fiscal years begin on July 1 except for these states: New York on April 1; Texas on September 1; Alabama, Michigan, and District of Columbia on October 1. ↩︎
- Florida, Minnesota, and South Carolina did not respond to the 2023 survey. In some instances, we used publicly available data or prior years’ survey responses to obtain information for these states. However, unless otherwise noted, these states are not included in counts throughout the survey. ↩︎
- Florida, Minnesota, and South Carolina did not respond to the 2023 survey. In some instances, we used publicly available data or prior years’ survey responses to obtain information for these states. However, unless otherwise noted, these states are not included in counts throughout the survey. Among responding states, four states (Alabama, New Hampshire, New Jersey, and Washington) did not participate in a follow-up telephone interview. ↩︎
- State fiscal years begin on July 1 except for these states: New York on April 1; Texas on September 1; Alabama, District of Columbia, and Michigan on October 1. ↩︎
- Medicaid and CHIP Payment And Access Commission, “Medicaid Managed Care Capitation Rate Setting,” March 2022; https://www.macpac.gov/wp-content/uploads/2022/03/Managed-care-capitation-issue-brief.pdf. ↩︎
- Connecticut does not have capitated managed care arrangements but does carry out many managed care functions through ASO arrangements that include payment incentives based on performance, intensive care management, community workers, educators, and linkages with primary care practices. ↩︎
- Vermont runs a public, non-risk bearing prepaid health plan delivery model under its Section 1115 Global Commitment to Health waiver. ↩︎
- Idaho’s Medicaid-Medicare Coordinated Plan has been recategorized by CMS as an MCO but is not counted here as such since it is secondary to Medicare. Publicly available data used to verify status of Washington and three other states that did not respond to the 2023 survey (Florida, Minnesota, and South Carolina). ↩︎
- For purposes of this report, states contracting with “PCCM entities” are also counted as offering a PCCM program. In addition to furnishing basic PCCM services, PCCM entities also provide other services such as intensive case management, provider contracting or oversight, enrollee outreach, and/or performance measurement and quality improvement. 42 CFR §438.2. ↩︎
- A previously planned managed care transition was struck down, in June 2021, by the Oklahoma Supreme Court which ruled that the Oklahoma Health Care Authority did not have the authority to implement the program without legislative approval. ↩︎
- Oklahoma Health Care Authority, “OHCA Selects Organizations to Assist in Serving Oklahoma Medicaid”, June 8, 2023; https://oklahoma.gov/ohca/about/newsroom/2023/june/ohca-selects-organizations-to-assist-in-serving-oklahoma-medicaid.html ↩︎
- Florida did not respond to the 2023 survey. Therefore, the status of its dental services PHP was confirmed via publicly available data. Dental PHPs in Arkansas and New Hampshire and New Jersey’s NEMT PHP were also confirmed via publicly available data. ↩︎
- Social Security Act Section 1902(a)(30)(A) and 42 CFR Section 447.204. ↩︎
- Federal regulations permit only the following exceptions that allow states to make payments directly to providers or direct managed care plan expenditures for plan-covered services: state directed payments and permissible pass-through payments that comply with the requirements at 42 C.F.R. § 438.6, and provider payments required by federal law or regulation, for example, prospective payment system rates required for federally qualified health centers (FQHCs). ↩︎
- The Managed Care Access, Finance, and Quality (“Managed Care” NPRM), would require states to submit an annual payment analysis comparing certain managed care provider rates to Medicare rates. ↩︎
- The total number of states responding to this question in the prior surveys was 51 in the 2019 survey, 43 in the 2020 survey, and 47 in the 2021 survey. ↩︎
- Government Accountability Office, Medicaid: CMS Needs More Information on States’ Financing and Payment Arrangements to Improve Oversight (Washington, DC: Government Accountability Office, December 2020), https://www.gao.gov/assets/gao-21-98.pdf ↩︎
- Throughout the Provider Taxes section, we use 2022 survey data for Florida, Maryland, Minnesota, New Hampshire, South Carolina, Washington, and Wisconsin. ↩︎
- The Deficit Reduction Act of 2005 amended the federal Medicaid provider tax law to restrict the use of MCO taxes effective July 1, 2009. Prior to that date, states could apply a provider tax to Medicaid MCOs that did not apply to MCOs more broadly and could use that revenue to match Medicaid federal funds. Since 2009, several states have implemented new MCO taxes that tax member months rather than premiums and that meet the federal statistical requirements for broad-based and uniform taxes. In addition to the 12 states reporting implemented MCO taxes, some states have implemented taxes on health insurers more broadly that generate revenue for their Medicaid programs. ↩︎
- Twenty-one states reported planned increases to one or more provider taxes in FY 2024: Arizona, California, Colorado, Georgia, Hawaii, Iowa, Idaho, Illinois, Kansas, Louisiana, Missouri, Mississippi, North Carolina, Nevada, Ohio, Oklahoma, Pennsylvania, Tennessee, Utah, Vermont, and West Virginia. These increases were most commonly for taxes on hospitals. ↩︎
- 42 C.F.R. Section 440.230(b). ↩︎
- In a few instances throughout this section, publicly available data (e.g., Section 1115 waiver documents or Medicaid State Plan Amendment documents) is used to supplement reported state benefit changes. ↩︎
- Utah Department of Health and Human Services, “Medicaid Information Bulletin,” February 2023: https://medicaid.utah.gov/Documents/manuals/pdfs/February2023Interim-MIB.pdf ↩︎
- Texas Medicaid & Healthcare Partnership, “Texas Medicaid Provider Procedures Manual,” September, 2023: https://www.tmhp.com/sites/default/files/file-library/resources/provider-manuals/tmppm/pdf-chapters/2023/2023-09-september/2_04_Childrens_Services_0.pdf ↩︎
- The Medicaid Certified Community Behavioral Health Center (CCBHC) Medicaid demonstration program aims to improve the availability and quality of ambulatory behavioral health services and to provide coordinated care across behavioral and physical health. CCBHCs provide a comprehensive range of nine types of services. The CCBHC demonstration program was first established by the Protecting Access to Medicare Act of 2014; more recently, the 2022 Bipartisan Safer Communities Act allocated funds for additional planning grants to states to participate in the demonstration. U.S. Department of Health and Human Services, Office of the Assistant Secretary for Planning and Evaluation and Office of Behavioral Health, Disability, and Aging Policy, Certified Community Behavioral Health Clinics Demonstration Program: Report to Congress, 2019 (U.S. Department of Health and Human Services, September 2020), https://aspe.hhs.gov/sites/default/files/migrated_legacy_files/196036/CCBHCRptCong19.pdf Protecting Access to Medicare Act of 2014, Pub. L. No. 113-93 (April 1, 2014), https://www.congress.gov/113/statute/STATUTE-128/STATUTE-128-Pg1040.pdf Bipartisan Safer Communities Act, Pub. L. No. 117-159 (June 25, 2022), https://www.congress.gov/117/plaws/publ159/PLAW-117publ159.pdf ↩︎
- The 12 states that reported expanding behavioral health and related services for children and youth are: Delaware, Hawaii, Idaho, Illinois, Louisiana, Maine, Missouri, Montana, Nebraska, New Mexico, New York, and Ohio. ↩︎
- The 13 states that reported expanding coverage of doula services are: Colorado, Delaware, District of Columbia, Illinois, Kansas, Massachusetts, Michigan, Nevada, New Hampshire, New York, Ohio, Oklahoma, and Pennsylvania. ↩︎
- Beginning October 1, 2023, Section 11405 of the Inflation Reduction Act (IRA) requires Medicaid coverage for approved adult vaccines recommended by the Advisory Committee on Immunization Practices (ACIP) and their administration, without cost sharing. ↩︎
- The 4 states that reported coverage of services provided by pharmacists are: Illinois, Oklahoma, Pennsylvania, and Wyoming. ↩︎
- Chidinma A. Ibe, Debra Hickman and Lisa A. Cooper, “To Advance Health Equity During COVID-19 and Beyond, Elevate and Support Community Health Workers,” JAMA Health Forum 2, no.7 (July 2021), https://doi.org/10.1001/jamahealthforum.2021.2724. ↩︎
- Sonia Ahmed, et al. “Community health workers and health equity in low- and middle-income countries: systematic review and recommendations for policy and practice,” International Journal for Equity in Health 21, no. 49 (April 2022), https://doi.org/10.1186/s12939-021-01615-y. ↩︎
- Miya L. Barnett, et al. “Mobilizing Community Health Workers to Address Mental Health Disparities for Underserved Populations: A Systematic Review” Administration and Policy in Mental Health and Mental Health Services Research 45, (July 2017), https://doi.org/10.1007/s10488-017-0815-0. ↩︎
- California previously reported the addition of Traditional Healers and Natural Helpers to deliver culturally appropriate care for AI/AN individuals with SUD in the FY 2022-2023 Annual KFF survey of state Medicaid officials. The California Health Care Services’ CalAIM Behavioral Health Initiative link indicates this proposed policy change is still pending. ↩︎
- Currently, traditional healing benefits are available as a covered Specialized Therapy under New Mexico’s Self-Directed Community Benefit (CB) program for individuals who are elderly or disabled and meet a nursing facility level of care. They may also be reimbursed by MCOs as a value-added service. Source: https://www.hsd.state.nm.us/wp-content/uploads/Tribal-Meetings.pdf ↩︎
- Washington State Health Care Authority, “Washington Medicaid Transformation Project (MTP 2.0),” September 14, 2023, https://www.spokanecounty.org/DocumentCenter/View/50550/Washington-Medicaid-Transformation-Project-MTP-20_09152023 ↩︎
- Texas and Louisiana noted coverage of only Orlistat/Xenical in their survey response; publicly available data sources used to verify coverage status in South Carolina. ↩︎
- State Telehealth Medicaid Fee-For-Service Policy: A Historical Analysis of Telehealth: 2013-2019 (Center for Connected Health Policy, January 2020), https://www.cchpca.org/2021/04/Historical-State-Telehealth-Medicaid-Fee-For-Service-Policy-Report-FINAL.pdf ↩︎
- Rose C. Chu, Christie Peters, Nancy De Lew, and Benjamin D. Sommers, State Medicaid Telehealth Policies Before and During the COVID-19 Public Health Emergency (Washington, DC: U.S. Department of Health and Human Services, Office of the Assistant Secretary for Planning and Evaluation, July 19, 2021), https://aspe.hhs.gov/sites/default/files/2021-07/medicaid-telehealth-brief.pdf ↩︎
- Government Accountability Office, Medicaid: CMS Should Assess Effect of Increased Telehealth Use on Beneficiaries’ Quality of Care (Washington, DC: Government Accountability Office, March 2022), https://www.gao.gov/assets/gao-22-104700.pdf ↩︎
- Bipartisan Safer Communities Act, Pub. L. No. 117-159 (June 25, 2022), https://www.congress.gov/117/plaws/publ159/PLAW-117publ159.pdf ↩︎
- State fiscal years begin on July 1 except for these states: New York on April 1; Texas on September 1; Alabama, District of Columbia, and Michigan on October 1. ↩︎
- Florida, Minnesota, and South Carolina did not respond to the 2023 survey. In some instances, we used publicly available data or prior years’ survey responses to obtain information for these states. However, unless otherwise noted, these states are not included in counts throughout the survey. ↩︎
- Among responding states, four states (Alabama, New Hampshire, New Jersey, and Washington) did not participate in a follow-up telephone interview. ↩︎