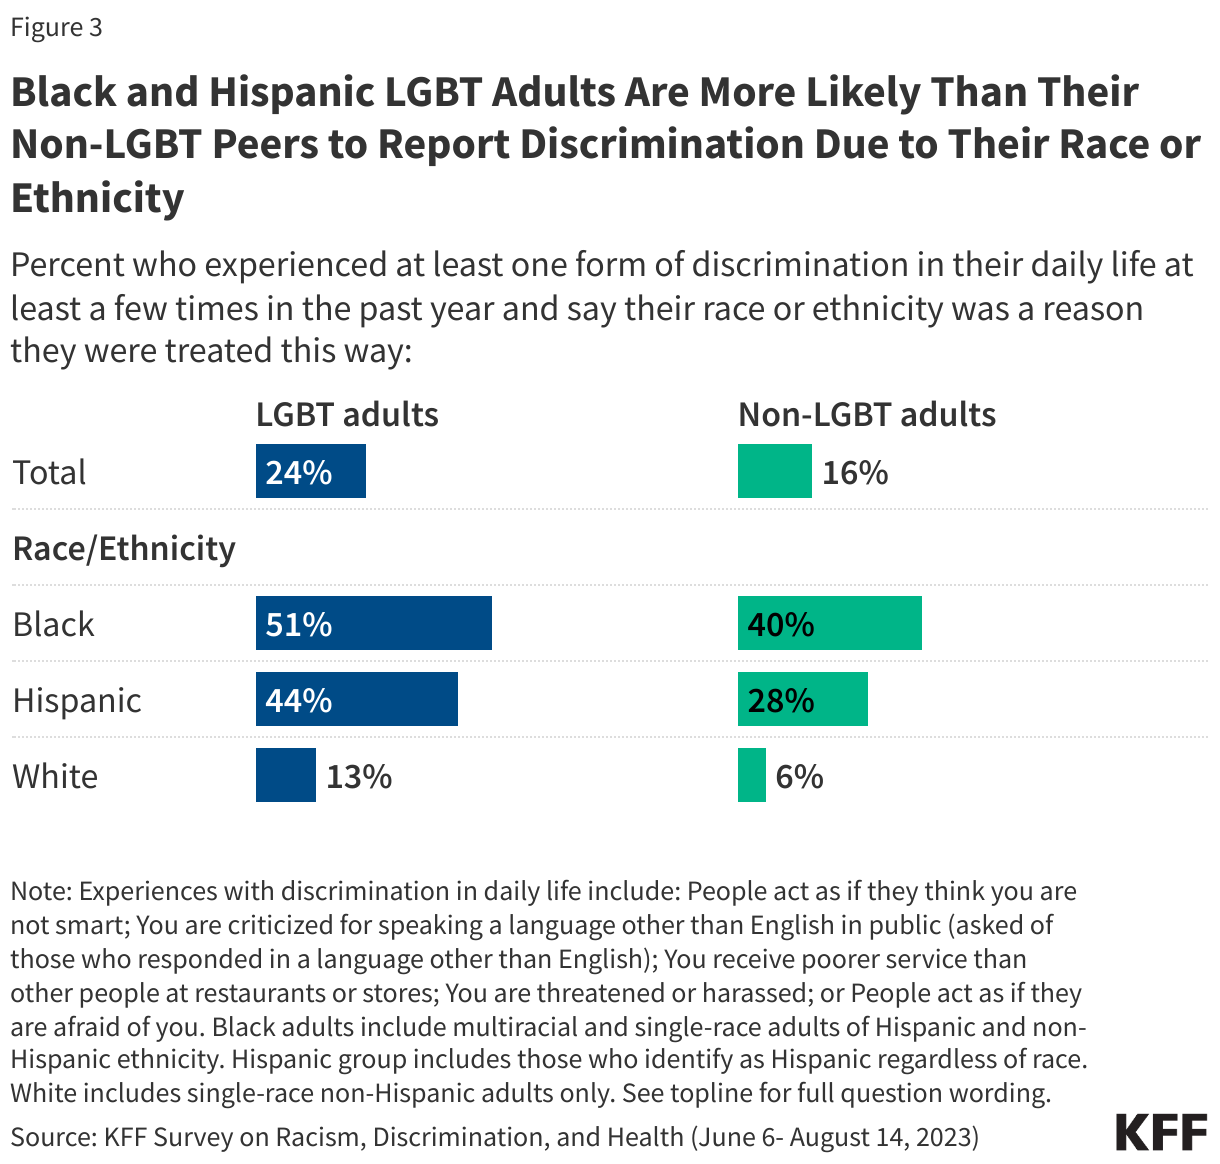
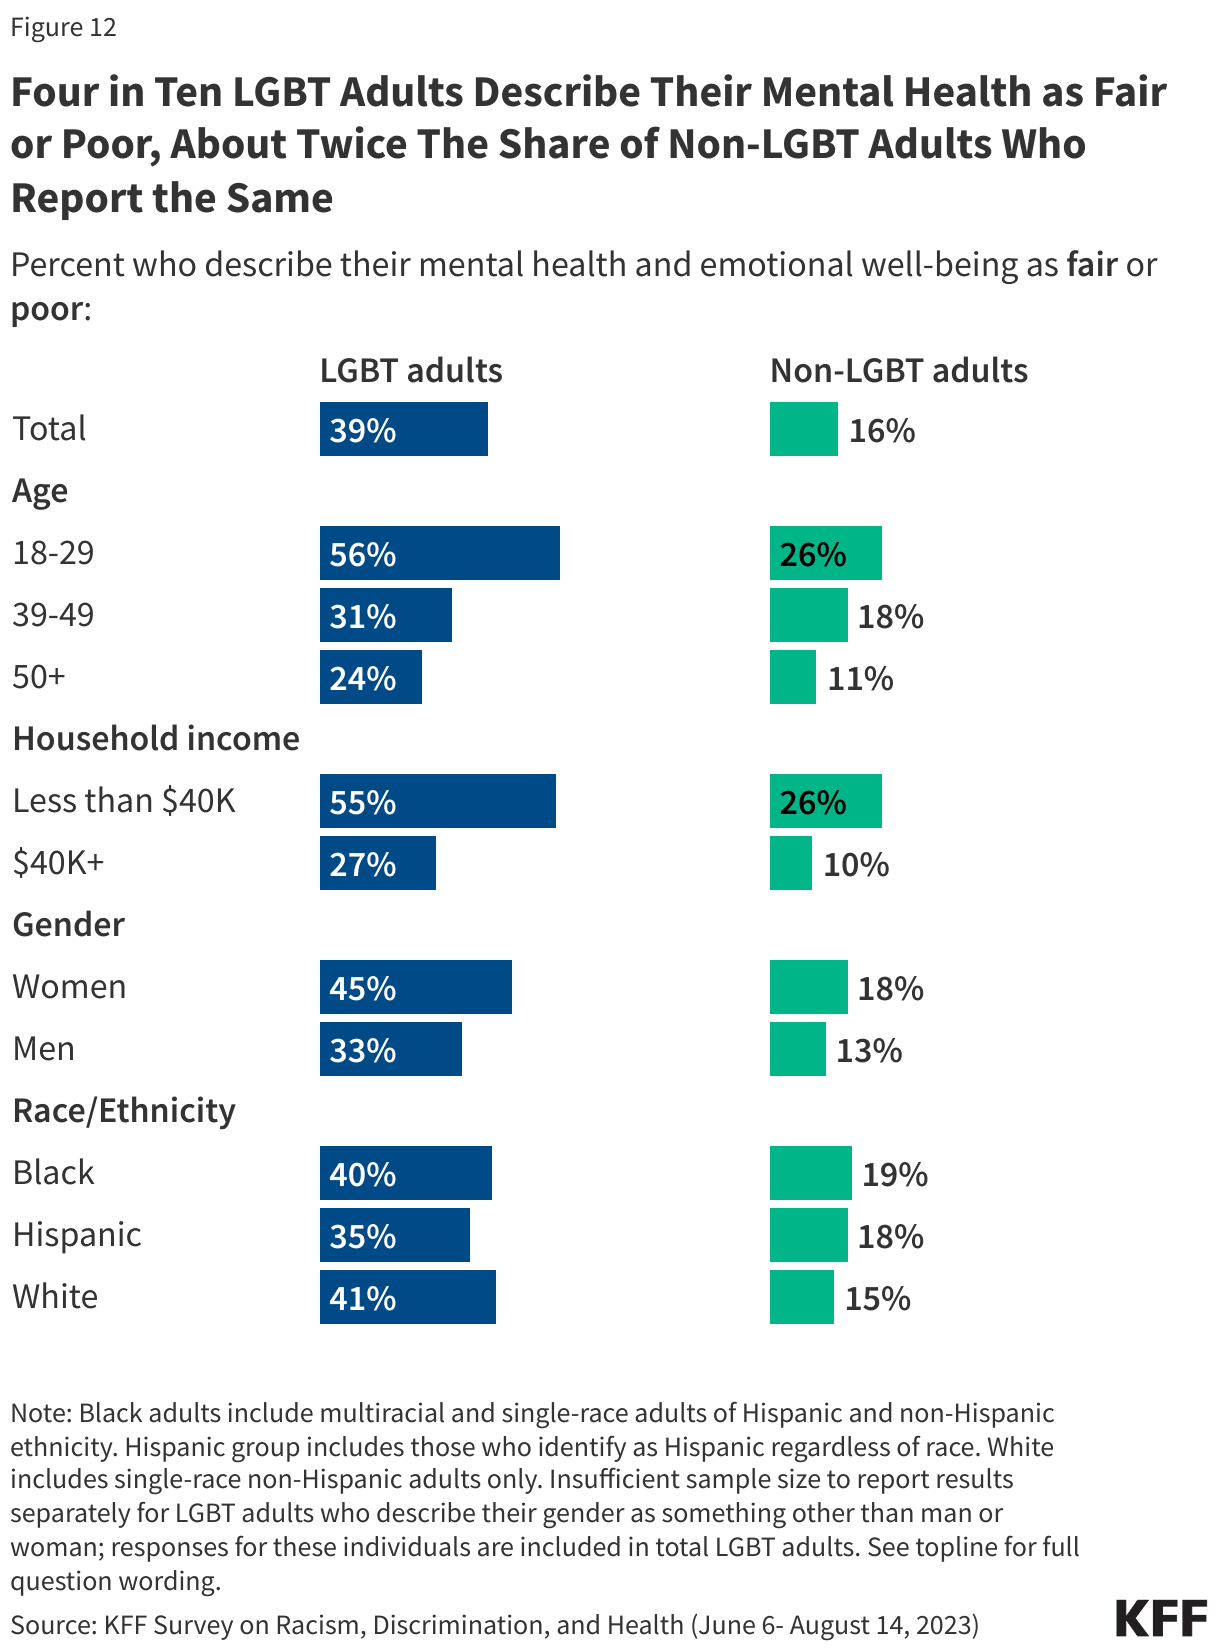
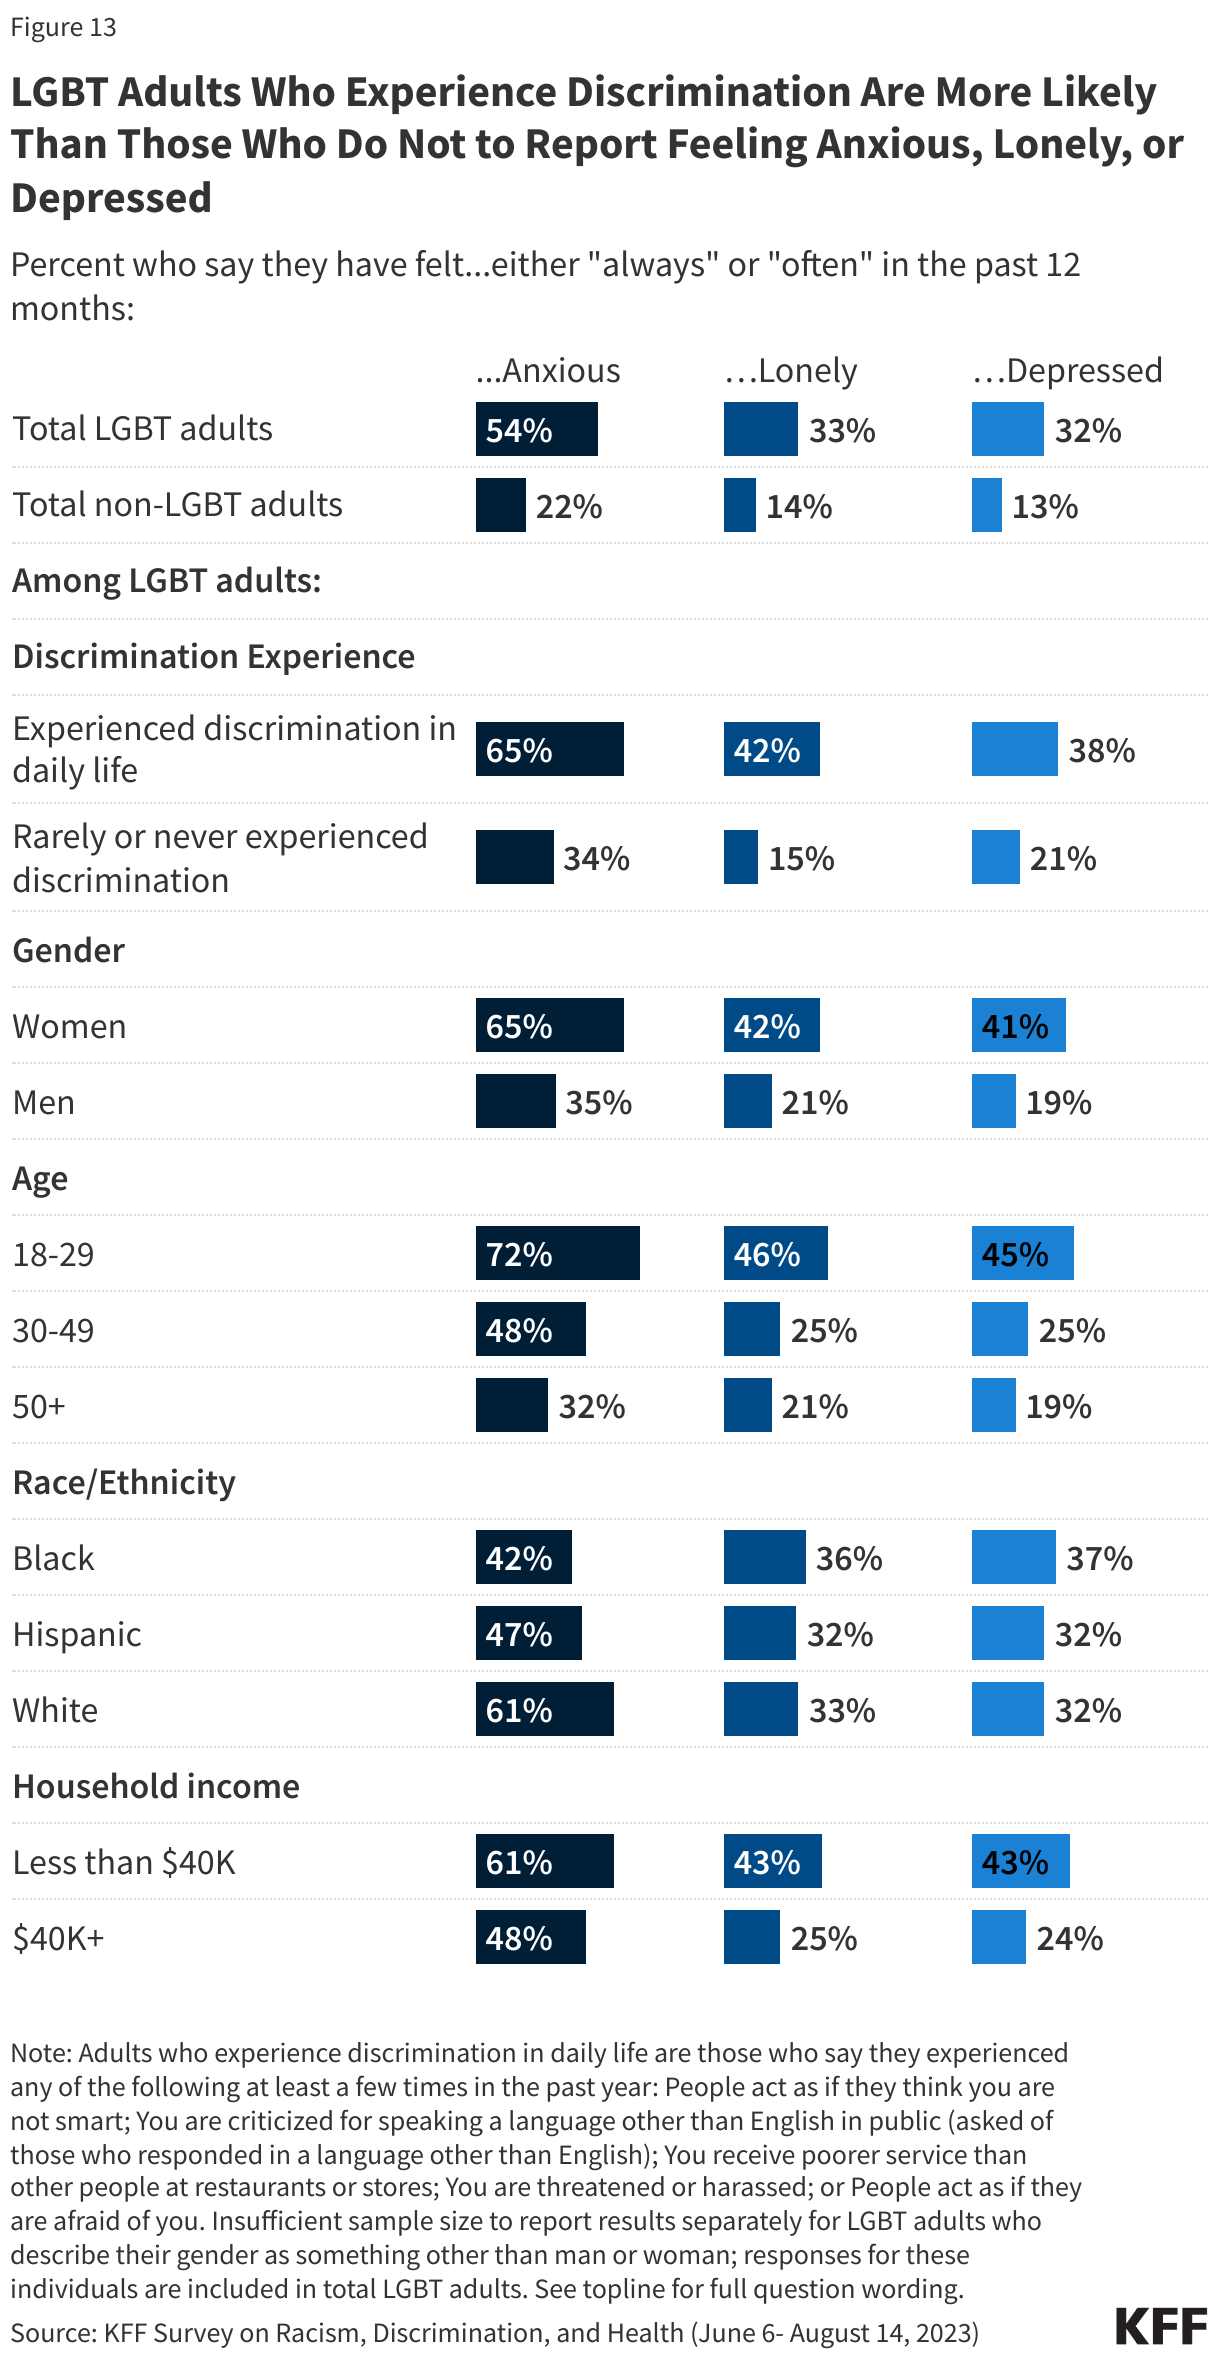
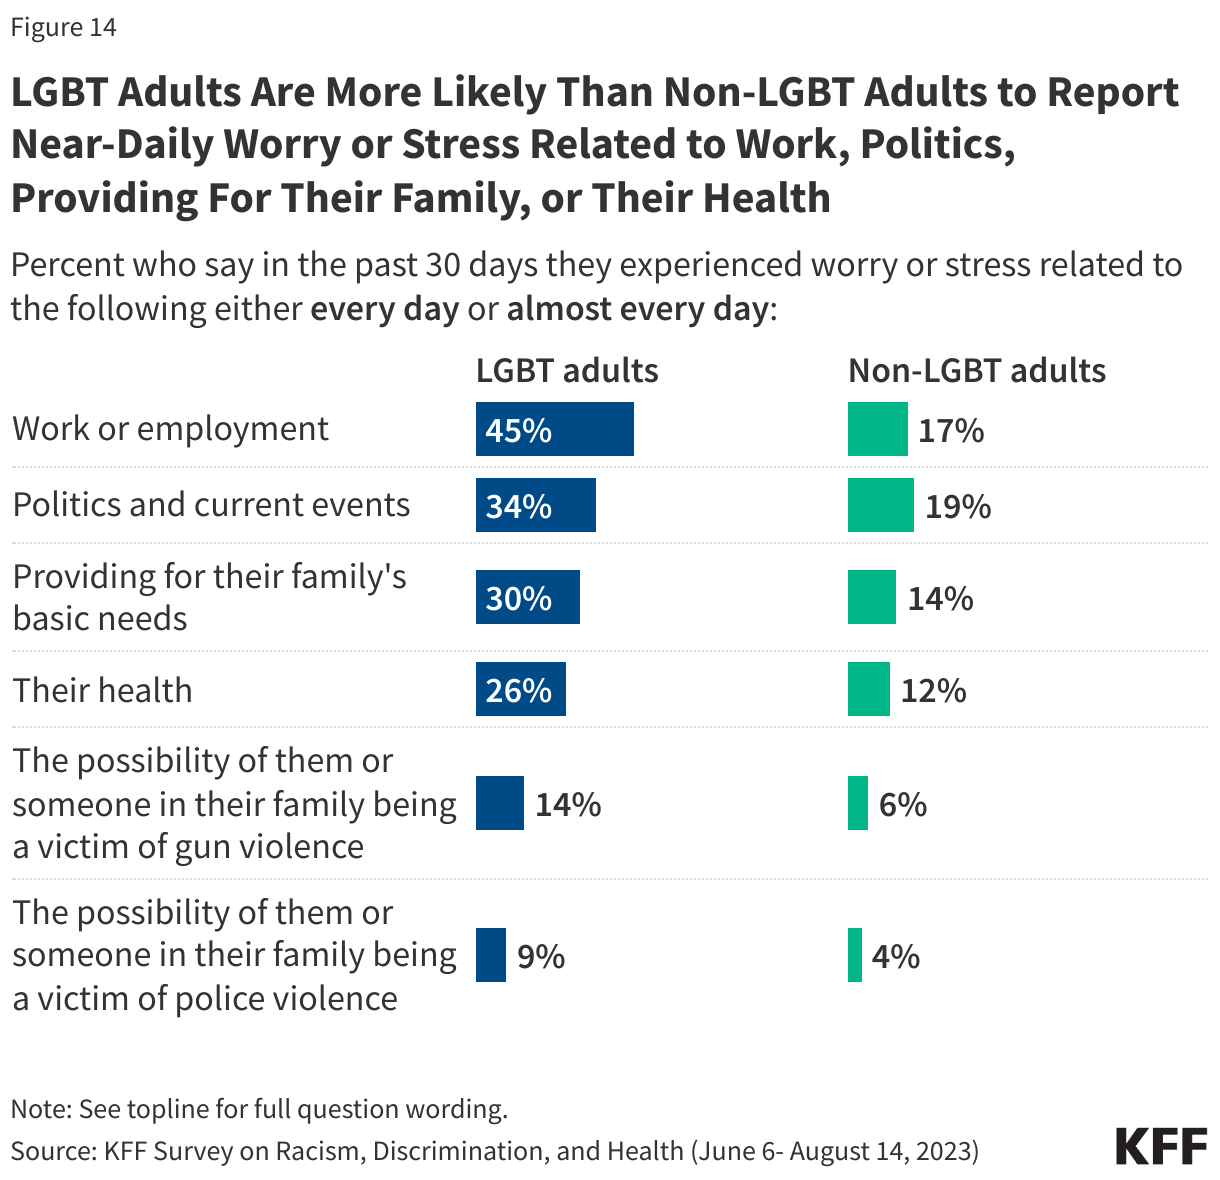
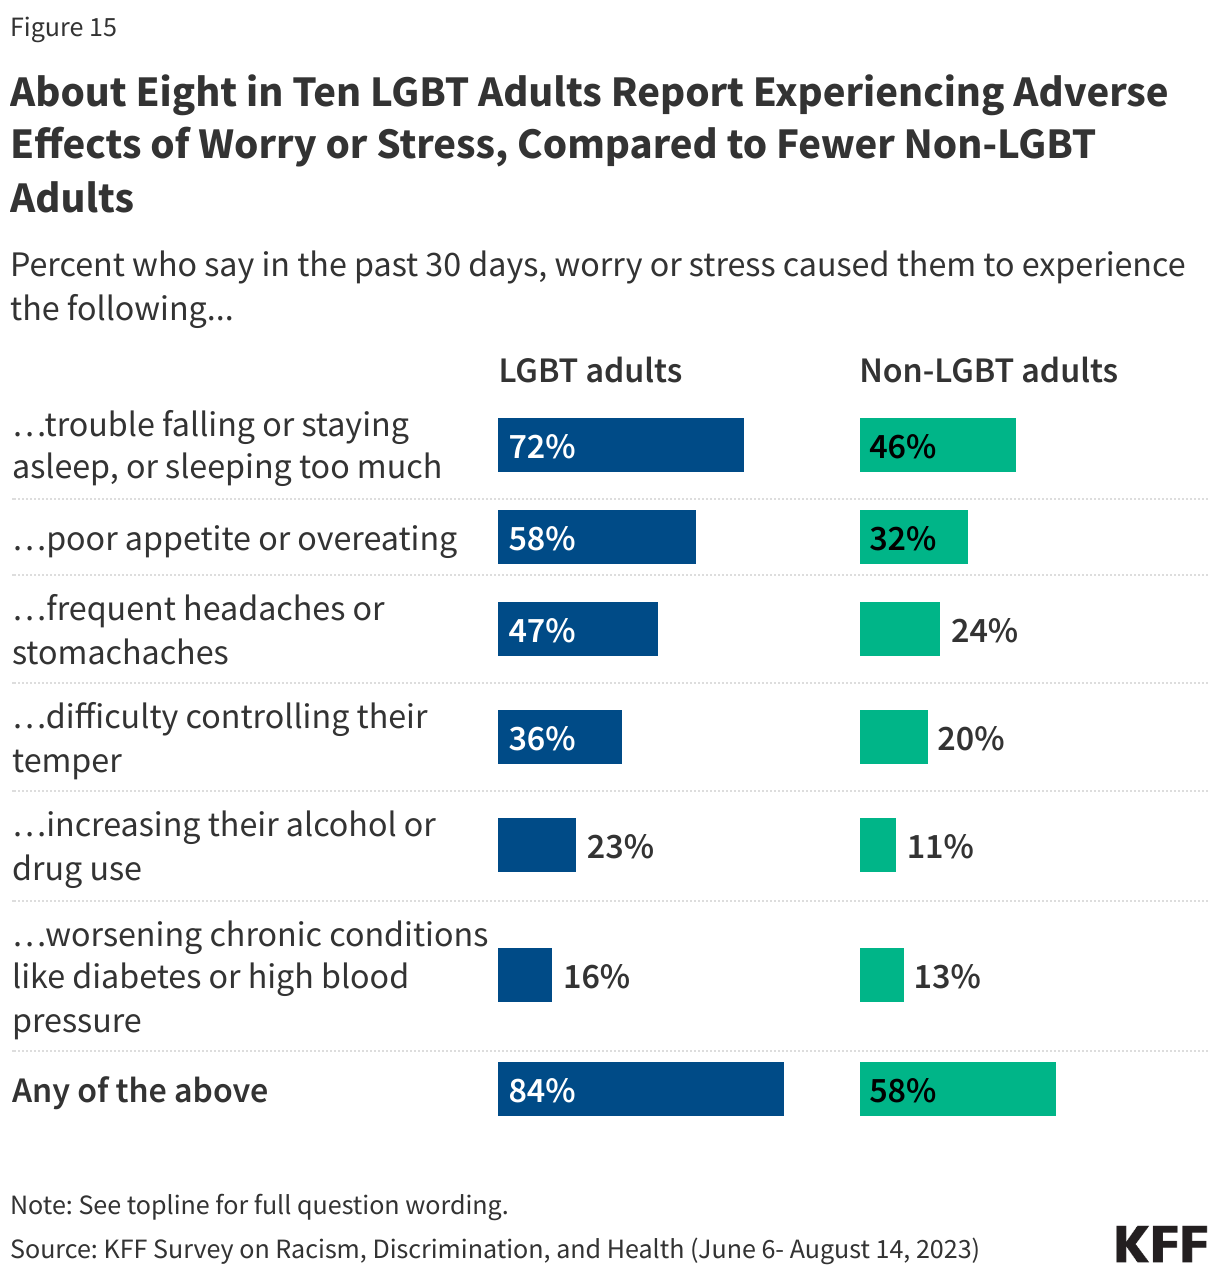
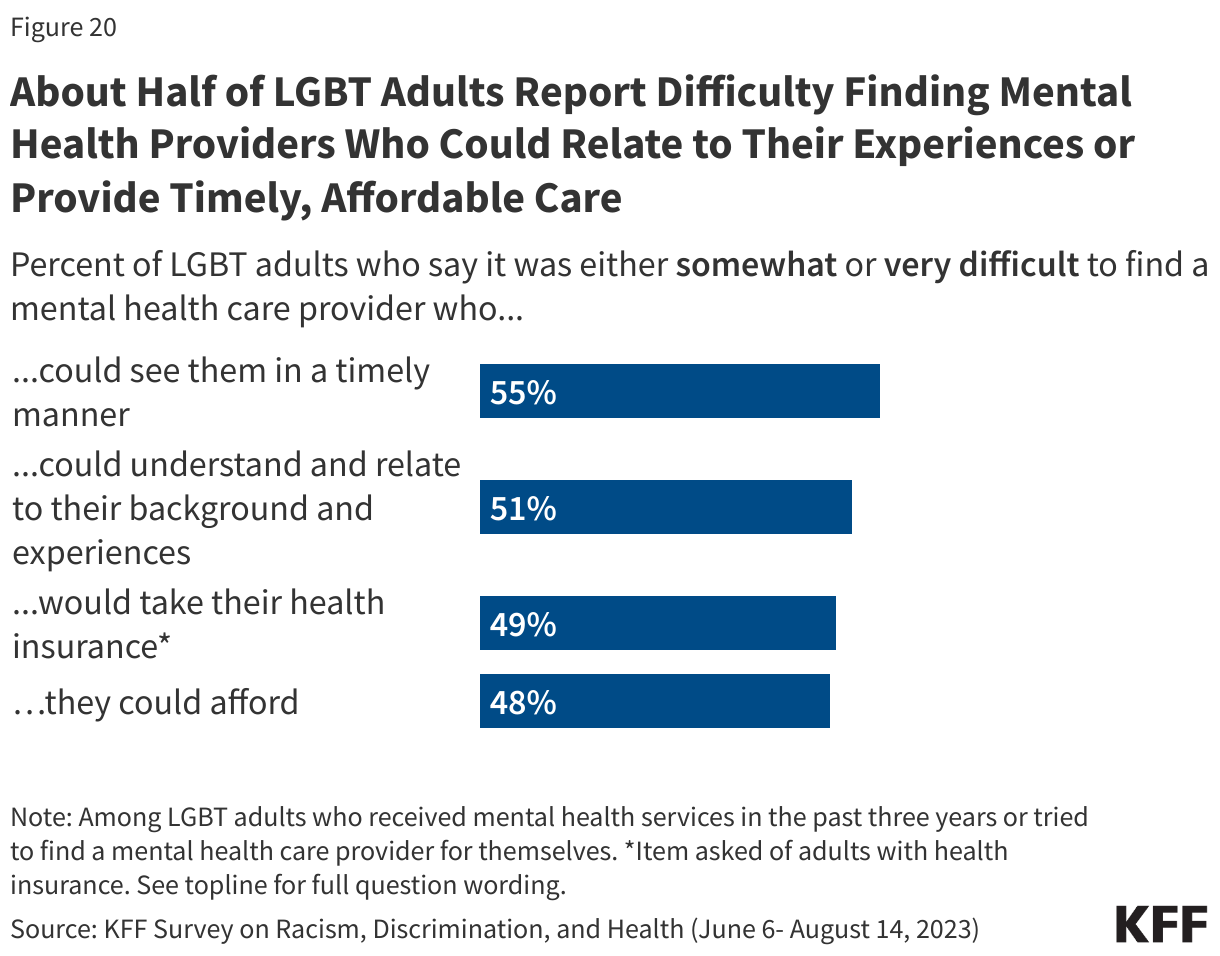
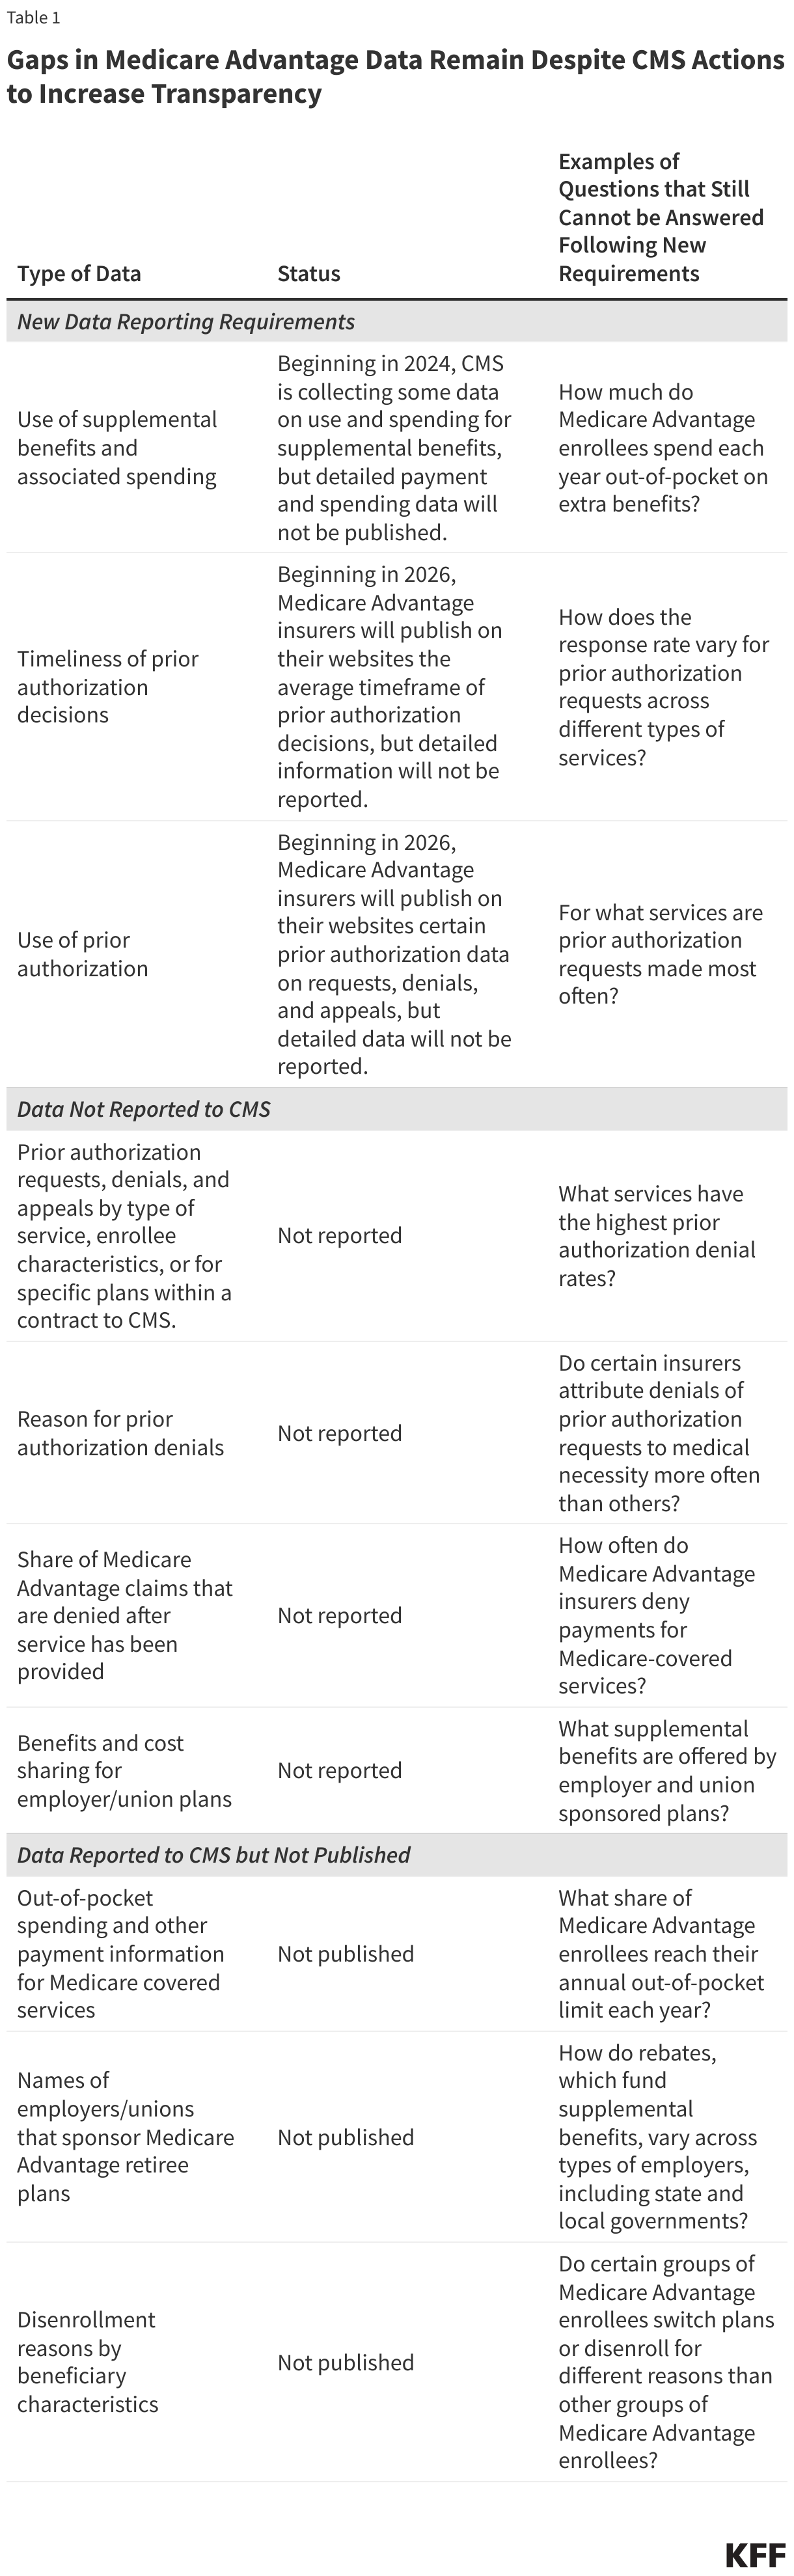
Gaps in Medicare Advantage Data Remain Despite CMS Actions to Increase Transparency
This analysis was updated on May 22, 2024 to clarify the description of the data gaps that remain with respect to spending on supplemental benefits.The Centers for Medicare and Medicaid Services (CMS) has recently taken actions to increase transparency in Medicare Advantage, the private plan alternative to traditional Medicare that now provides Medicare coverage to more than half of all eligible Medicare beneficiaries. In particular, the agency has clarified and expanded reporting requirements for Medicare Advantage insurers pertaining to use of supplemental benefits that may be available to researchers and others upon request within a few years. In addition, CMS is requiring Medicare Advantage insurers to post summary data on the timeliness and use of prior authorization on their own websites beginning in 2026.
Payments to Medicare Advantage insurers are both higher and growing faster than spending in traditional Medicare. In 2024, MedPAC estimates that the Medicare program will spend 22% more per Medicare Advantage enrollee ($83 billion) than for similar beneficiaries in traditional Medicare. Despite the higher payments, researchers have found few differences between Medicare Advantage and traditional Medicare in beneficiary experience, affordability, service utilization, and quality. Additionally, though recent CMS actions aim to increase transparency in Medicare Advantage, substantial data gaps remain that limit the ability of policymakers and researchers to conduct oversight and assess the program’s performance, and for Medicare beneficiaries to compare Medicare Advantage plans offered in their area. For example, Medicare Advantage insurers are not required to report prior authorization requests, denials, and appeals by type of service, for specific plans within a contract, or reasons for prior authorization denials. They are also not required to report to CMS complete information on denied claims for inpatient, physician and other services already delivered to enrollees. Other information is collected by CMS, but not published, including out-of-pocket spending by Medicare Advantage enrollees, and the characteristics of enrollees who switch Medicare Advantage plans or disenroll to get coverage under traditional Medicare. Some of this information would also be useful to Medicare beneficiaries when choosing among the large number of plans offered in their area. CMS recently put out a Request for Information (RFI) seeking input on additional Medicare Advantage data that could further improve program oversight and beneficiary decision making.
In this brief, we describe new CMS data reporting requirements and identify remaining gaps (Table 1). We also discuss the implications for program oversight and beneficiary decision making and provide illustrative questions that cannot be answered because of the lack of data. In general, the data gaps described below apply to all types of Medicare Advantage plans, including those available for individual enrollment, special needs plans (SNPs), and group plans sponsored by employers and unions.
New Data Reporting Requirements
CMS is now collecting additional data on use and spending of supplemental benefits, such as dental, vision, and hearing.
The vast majority of Medicare Advantage enrollees are in plans that offer some coverage of dental, vision and hearing services, as well as other supplemental benefits that are not otherwise covered under traditional Medicare. While KFF’s prior work documents substantial variation in the scope and generosity of supplemental benefits offered, historically, there has been no information available to describe how many enrollees actually use these benefits, the specific items or services they receive, or associated out-of-pocket spending. Further, there has been no information to assess whether use and spending varies across subgroups of beneficiaries.
In recent years, per enrollee Medicare payments to Medicare Advantage insurers that pay for these benefits have increased rapidly. In the last five years, these payments, also referred to as rebates, have more than doubled, rising from $1,140 per enrollee in 2018 to over $2,300 per enrollee in 2024. To assist in answering questions about how these benefits are being used, CMS has taken several actions.
First, CMS recently reinstated detailed medical loss ratio reporting requirements and is also now requiring spending data for specific categories of supplemental benefits to be reported, beginning with the 2023 plan year. This additional information will be useful in understanding spending by Medicare Advantage plans on specific categories of extra benefits. However, since the data are reported at the contract level, it will not be possible to examine how spending varies across plans that offer different combinations of extra benefits.
Second, CMS issued new requirements for more data collection related to supplemental benefits for plan year 2024. These data include: the unit of utilization used by the plan when measuring utilization (e.g., admissions, visits, procedures, trips, purchases); the number of enrollees eligible for the benefit; the number of enrollees who used the benefit at least once as well as total instances of utilization; the total net amount incurred by the plan to offer the benefit; and the total out-of-pocket-cost per utilization for enrollees. CMS also published a memo in February 2024 describing system changes and supplemental instructions to assist plans in reporting data on the use of supplemental benefits to the Medicare Advantage Encounter Data System.
This descriptive information will make it possible in the future to assess the extent to which these benefits are being used by Medicare Advantage enrollees, and whether use of supplemental benefits varies by beneficiary characteristics (e.g., race/ethnicity or health status), plan type (e.g., SNPs, group plans or individually sold plans), or region. This data may also be used to assess whether supplemental benefits are helping to address health disparities by filling specific social or medical needs, such as transportation, and whether the benefits are being targeted to those with the greatest needs. Some analysis of out-of-pocket spending may also be feasible. Though CMS will have some of this information available as early as 2025, it is not clear when the data will be available to researchers and other interested parties.
Despite the new requirements, data gaps will remain. For example, it will be difficult to determine the total out-of-pocket spending for certain categories of extra benefits, such as dental coverage, since it will not be possible to determine what combination of reported services (i.e., dental exams, cleanings, x-rays, etc) enrollees used in a given year. Additionally, for other categories of extra benefits (i.e., over-the-counter allowances) it will not be possible to determine how spending varies across the range of items or services covered by the plan, since only aggregate spending by category of extra benefit, rather than detailed spending data for different types of transactions will be available.
Questions about supplemental benefits that cannot be answered with new reporting requirements because data are not reported or published:
- How much do Medicare Advantage enrollees spend each year out-of-pocket on extra benefits?
- Do insurers deny claims for certain types of extra benefits more than others?
- How often are requests for prior authorization for services covered as a supplemental benefit denied?
Medicare Advantage insurers will be required to publish some data on the timeliness of prior authorization decisions and use of prior authorization.
Health insurers use prior authorization to both contain spending and prevent enrollees from receiving unnecessary or low-value services. Virtually all Medicare Advantage enrollees are in a plan that requires prior authorization for some services. Generally, higher cost services, such as Part B drugs (e.g., chemotherapy) and inpatient hospital stays, are more likely than lower cost services to be subject to prior authorization. Even supplemental benefits, such as hearing tests and transportation, are often subject to prior authorization requirements.
A prior KFF analysis found that over 35 million prior authorization requests were submitted to Medicare Advantage insurers in 2021, with over 2 million of those requests fully or partially denied. Just 11% of denials were appealed, though 82% of those appeals were at least in part successful.
CMS recently finalized three rules with provisions pertaining to the use of prior authorization – one clarifying the coverage criteria Medicare Advantage plans can use when making prior authorization determinations, a second intended to improve the timeliness and transparency of prior authorization decisions, and a third that will require plans to evaluate the effect of prior authorization policies on people with certain social risk factors.
Among other changes, the second rule shortens the timeframe within which Medicare Advantage insurers are required to respond to prior authorization requests. Beginning in 2026, the rule also requires Medicare Advantage insurers to publish the average timeframe for prior authorization decisions on their websites. However, policymakers, researchers, or other parties will have to go to each insurer’s website to collect the information instead of having access to this data in a single file. Additionally, there is no requirement that Medicare Advantage insurers provide any information about how long appeals decisions take.
Further, the data that will be publicly reported will be at an “organization” level and is not required to include the length of time by type of service or for people with specific conditions. This information could be helpful in understanding variation in the average response time. For example, people with diabetes might be interested in not just knowing whether they will need annual approval of their diabetes supplies, but also how long they can expect that authorization to take based on the plan in which they enroll.
In addition to data on the timeliness of prior authorization decisions, the second rule also requires plans to post on their websites certain prior authorization information (excluding for drugs) beginning in 2026, including all items and services that require prior authorization, as well as the share of prior authorization requests that were approved, denied, and approved after appeal. It is unclear how helpful these new requirements will be for either policymakers, researchers or other parties who wish to compare these measures across plans. These new requirements duplicate information plans currently report to CMS and that has historically been made available as a public use file at the contract level, though starting with plan year 2022 data, access to these data will require a data use agreement and carry a fee.
The reporting requirements in the rule thus do not expand the information that is available, and in some ways are less useful because people who do not get access to the data from CMS will have to go to individual plan websites.
Moreover, Medicare Advantage insurers are still not required to report prior authorization requests, denials, and appeals by type of service, enrollee characteristics, or for specific plans within a contract to CMS, as described in the section below.
Questions about the timeliness of prior authorization determinations that cannot be answered because data are not reported:
- How does the response rate vary for prior authorization requests across different types of services?
- Does the timeliness of prior authorization decisions vary across plan types?
- How timely are appeal decisions?
Ongoing Data Gaps: Data not Reported to CMS
Medicare Advantage insurers are not required to report prior authorization requests, denials, and appeals by type of service, enrollee characteristics, or for specific plans within a contract to CMS.
As mentioned above, CMS is requiring Medicare Advantage insurers to post some information on the timeliness of prior authorization decisions and use of prior authorization on their websites. Even with the changes in the recent CMS rules, there are still no data to document the number of prior authorization requests, denials, and appeals by type of service. In the rule, CMS stated they were not requiring data at the service level because they “have concerns about data overload, patient understanding, and usability of the data. For example, reporting at the specialty level and service level could be overwhelming because of the volume of information presented.” It is therefore not possible to assess whether prior authorization requests for certain types of services are denied more often by some plans than others, or whether prior authorization requests tend to be denied more for some types of services than others. While the more detailed information could be overwhelming for beneficiaries, it would still be useful for policymakers engaging in oversight.
Additionally, the aggregate-level data that CMS is requiring Medicare Advantage plans to post on their websites will only be available at the contract, rather than plan level. Contracts can include multiple types of Medicare Advantage plans, sometimes combining those available for individual purchase with SNPs and employer-sponsored plans. For example, most D-SNP enrollees (81%) are in plans that are in a contract with other Medicare plan types, and most contracts include at least three plans. CMS stated in the rule that they were keeping data at the contract level because a “consistent approach of contract-level reporting in the MA program will give consumers useful information while limiting plan burden.” However, by aggregating data in this way, it is not possible to assess variations in prior authorization practices across plans within a contract, including across plans that serve different populations. For example, if CMS required Medicare Advantage insurers to report prior authorization requests and denials at the plan level, beneficiaries could compare across the plan options of the same type (e.g., plans available for individual purchase) in their county.
Insurers are also not required to report prior authorization data by demographic characteristics of Medicare Advantage enrollees, such as race/ethnicity, sex, age, or diagnosed health conditions. Without such data, it is not possible to assess whether prior authorization requirements have a disproportionate impact on certain subpopulations of enrollees, which could affect access to care, out-of-pocket costs, and health outcomes.
The lack of data about the services for which prior authorization is requested and the decisions made by plans also make it difficult to assess whether Medicare Advantage insurers are complying with CMS requirements to cover all Medicare Part A and Part B services. The Health and Human Services Office of the Inspector General (OIG) requested detailed information for a sample of denials from Medicare Advantage insurers, and found that the insurers may be using prior authorization to deny requests for services covered under traditional Medicare. While CMS recently clarified this requirement through rulemaking, without plan-level data, by type of service, it will not be possible to determine whether plans are complying.
Further, plans do not report the extent to which providers in their network may be exempt from prior authorization requirements, for example as part of “gold-carding” programs that waive requirements for providers with a history of complying with the insurer’s prior authorization policies. Medicare beneficiaries might find it helpful to consider how broadly prior authorization requirements apply across providers when choosing among plans.
Questions about the impact of prior authorization decisions that cannot be answered because data are not reported:
- For what services are prior authorization requests made most often?
- What services have the highest prior authorization denial rates?
- Are people with certain health conditions subject to more prior authorization requirements and how do denials vary by diagnoses?
- How do prior authorization request denials vary by demographic characteristics of Medicare Advantage enrollees?
- Which insurers receive the most prior authorization requests and how do denials and appeals vary across insurers and plans?
- What share of providers are exempt from prior authorization requirements, what services do they provide, and what are the characteristics of their patients?
- Are some groups of Medicare Advantage enrollees more likely to appeal prior authorization denials than others?
Medicare Advantage insurers do not report the reasons for prior authorization denials to CMS.
While Medicare Advantage insurers are required to provide enrollees and providers with an explanation when denying a prior authorization request, CMS does not collect this information. Requests may be denied because a provider did not submit the necessary documentation, because the plan has determined the service is not medically necessary, or because the plan imposes other requirements for coverage (such as trying a more basic service first). This information would be helpful in understanding the potential effect recent actions to improve the prior authorization process. For example, if most denials of prior authorization requests are because the service was not deemed medically necessary, efforts to increase transparency of the coverage criteria, such as those recently included in a final rule, may be more likely to have an impact.
Questions about the reasons for prior authorization denials that cannot be answered because data are not reported:
- What share of prior authorization denials are attributed to medical necessity compared to other reasons, such as insufficient documentation or requiring a more basic service first?
- What types of services are more likely to have prior authorization requests denied due to medical necessity?
- Do certain insurers attribute denials of prior authorization requests to medical necessity more often than others?
- Are Black Medicare Advantage enrollees more likely to have a prior authorization request denied because of medical necessity than White Medicare Advantage enrollees?
- Are Medicare Advantage enrollees with certain health conditions more likely to have a prior authorization request denied because of medical necessity than other Medicare Advantage enrollees?
Medicare Advantage insurers do not report complete data on denied claims for services that have already been delivered.
The Medicare Advantage encounter data do not have a field to definitively identify claims for which payment was denied. This contrasts with claims data for traditional Medicare. In a recent study, the Office of the Inspector General (OIG) concluded that the lack of this information makes it challenging or impossible to conduct oversight, including fraud investigations.
Medicare Advantage insurers also submit contract-level data on the number of payment requests by certain providers and whether those requests were approved or denied. These data exclude most requests for payment for services delivered by contract providers and do not include a reason for the denial, information about the type of service delivered, or the characteristics of the enrollees affected. Without this information it is not possible to determine how often Medicare Advantage insurers deny claims for services that have already been delivered, or to assess how denials vary across different dimensions.
Enhancing the Medicare Advantage encounter data and other information on payment requests submitted by Medicare Advantage insurers could help CMS and other policymakers conduct oversight. Additionally, this information may be helpful to beneficiaries who wish to assess the potential burden associated with ensuring services are paid for when choosing between plans.
Questions on payment denials that cannot be answered because data are not reported:
- How often do Medicare Advantage insurers deny payments for Medicare-covered services?
- Which types of services are most often denied after they have been delivered?
- What are the main reasons payments are denied and does that vary across plans and insurers?
- Which insurers deny claims after services have been delivered most often?
- How do denial rates vary across demographic characteristics of Medicare Advantage enrollees?
- Are payment denials more common among Medicare Advantage enrollees with certain health conditions than others?
Medicare Advantage insurers do not report benefit and cost sharing information for employer/union sponsored plans.
About 5.4 million Medicare beneficiaries are enrolled in a group Medicare Advantage plan through a former employer or union. For group plans, the employer or union contracts with a Medicare Advantage insurer and Medicare pays a fixed, risk-adjusted payment per enrollee each month. The plan must cover all services covered under Part A and Part B of Medicare and may also provide supplemental benefits.
CMS requires Medicare Advantage insurers to submit information related to benefits, including cost sharing and the value of supplemental benefits, as well as anticipated gains/losses, as part of the annual bidding process for most plans they intend to offer in an upcoming plan year. However, because employer and union sponsored group plans are exempt from bidding, CMS does not collect this information. Thus, it is not possible to assess how benefits and cost sharing compare for those enrolled in a group plan versus those enrolled in a plan that is generally available for individual purchase or a special needs plan. Additionally, analyses of margins by plan type, such as those published annually by the Medicare Payment Advisory Commission (MedPAC), cannot separately consider employer and union sponsored plans.
Medicare pays more for enrollees in Medicare Advantage plans, including group plans sponsored by employers and unions, than for traditional Medicare beneficiaries. In addition, employer plans have their payments increased more on average under the quality bonus program (QBP) than other types of plans, with total spending for group plans under the QBP totaling at least $2.5 billion in 2023. Additional data are necessary to assess the value this higher spending provides to enrollees in these plans.
Questions about employer and union retiree plan benefits that cannot be answered because data are not reported:
- What supplemental benefits are offered by employer and union sponsored plans?
- How do benefit and cost sharing requirements vary across employer and union sponsored plans?
- How does the value of common supplemental benefits, such as dental, vision, and hearing, compare between employer and union sponsored plans versus individually available or special needs plans?
- Are margins for employer and union sponsored plans similar to margins for other types of Medicare Advantage plans?
Ongoing Data Gaps: Data That are Collected by CMS, but not Made Publicly Available
CMS does not publish detailed out-of-pocket liability and other payment information submitted by Medicare Advantage plans.
Medicare beneficiaries may be drawn to Medicare Advantage because of the potential for lower out-of-pocket spending, particularly compared to traditional Medicare without a supplemental insurance policy. MedPAC estimates that 39% of rebate dollars paid to Medicare Advantage insurers, or an average of $75 per enrollee per month, go toward reducing cost sharing. Additionally, unlike traditional Medicare, Medicare Advantage plans are required to have an annual out-of-pocket limit. However, little is known about actual out-of-pocket spending by Medicare Advantage enrollees. While out-of-pocket costs are estimated for each Medicare Advantage plan’s enrollees using information in the plan benefit package, these estimates rely on utilization patterns for traditional Medicare beneficiaries and are not reconciled with actual spending by a plan’s enrollees.
CMS does require Medicare Advantage insurers to submit detailed encounter data that includes information about the services enrollees use and their diagnosed health conditions, as well as payment information. Based on a review of data submission requirements, it is unclear what information is reported, the level of detail of the payment information, or the extent to which reported data are accurate and complete. For example, it is not possible to determine how often Medicare Advantage insurers submit information about out-of-pocket liability. In addition, since providers in capitated arrangements or staff models do not receive a payment per service, information about payments to these providers for specific services is unlikely to be included in encounter data.
There is little transparency about both payments to providers and out-of-pocket liability because publicly available Medicare Advantage encounter data do not include information on either. Current regulations state that CMS may release data “subject to the aggregation of dollar amounts reported for the associated encounter to protect commercially sensitive data.” While this regulation may limit the level of detailed information CMS can release on payments to providers at the service level, it does not prohibit publishing any payment information. Further, it is not clear to what extent plans are required to report, or why CMS does not publish information on out-of-pocket liability. Plan-specific information about enrollee liability, which typically reflects out-of-pocket spending, and Medicaid spending for people dually eligible for Medicare and Medicaid, would help beneficiaries compare actual out-of-pocket liability both across plans and compared to traditional Medicare. It could additionally illuminate how cost-burdens vary across subgroups of Medicare Advantage enrollees, including those with particular health conditions, such as diabetes, heart disease, or cancer.
Medicare Advantage plans vary substantially in their cost-sharing structures. For many types of services, it is difficult to determine what enrollees are required to pay out of pocket, because cost sharing takes the form of coinsurance and the prices paid to providers are not reported. While current regulations may prevent CMS from publishing the prices Medicare Advantage insurers pay providers, CMS could provide information on the actual amounts for which enrollees were liable. This would be useful in examining the implications of the variation in cost-sharing structures.
Making available more detailed information about provider payments would inform our understanding of how Medicare Advantage insurers allocate resources across types of health care services, and how that compares to traditional Medicare. Medicare Advantage offers the promise of coordinated care that focuses on delivering high-value interventions before serious health care conditions develop. However, it is difficult to assess the extent to which plans incur expenditures, for example, for care coordination or preventive care, or whether they are more oriented toward reducing unnecessary and duplicative services.
Questions about out-of-pocket liability and other Medicare Advantage spending that cannot be answer because data are not published:
- How much spending are Medicare Advantage enrollees liable for across specific services, such as skilled nursing facility stays, MRIs, or chemotherapy?
- Does average out-of-pocket liability vary across plans or insurers?
- Do dual-eligible beneficiaries in special needs plans (SNPs) have higher or lower out-of-pocket liability than dual-eligible beneficiaries in non-SNPs? How does this vary across states and what might be the impact on state Medicaid spending?
- What share of Medicare Advantage enrollees reach their annual out-of-pocket limit each year?
- Do Medicare Advantage plans typically pay more, less or about the same as traditional Medicare for various services?
- How does spending by Medicare Advantage insurers on preventive services compare to traditional Medicare spending on these same services?
CMS does not publish the names of employers/unions that receive Medicare payments to provide Medicare Advantage group plans to retirees.
Employers are increasingly turning to Medicare Advantage to provide retiree health coverage. Often, retirees have no choice but to receive their retiree health benefits through a Medicare Advantage plan. If they are unhappy with the plan, they could opt for different coverage, but would have to give up their benefits, the value of which was arguably part of their compensation while working.
CMS collects the name and address of the employers who provide retiree coverage through Medicare Advantage plans, but does not publish it because it considers this information to be proprietary. Combined with the lack of information about plan benefits and cost sharing, not having information on which employers are offering retiree benefits through a Medicare Advantage plan makes it difficult to assess the implications for affected beneficiaries.
Questions about sponsors of employer and union retiree plans that cannot be answered because data are not published:
- What industries use Medicare Advantage to provide retiree health coverage most often?
- How do rebates, which fund supplemental benefits, vary across types of employers, including state and local governments?
- How is spending under the quality bonus program distributed across different types of employers?
CMS does not include characteristics of people who disenrolled from Medicare Advantage in published disenrollment data.
A relatively small share of beneficiaries in Medicare Advantage disenroll from their Medicare Advantage plan and switch to traditional Medicare, though the rates are higher for some groups, including people dually eligible for Medicare and Medicaid and those in their last year of life. Somewhat larger shares of Medicare Advantage enrollees do disenroll from their plan and switch to another Medicare Advantage plan. While there is a contract-level composite measures for reasons for disenrollment, the data do not include characteristics of people who disenrolled. Adding information about the race/ethnicity, age, dual status, and long-term care facility residence could help promote health equity by providing the information to assess whether disenrollment is higher for certain groups, and whether the reason for disenrollment varies.
Questions about disenrollment from Medicare Advantage that cannot be answered because data are not published:
- Do Black Medicare Advantage enrollees switch plans or disenroll for different reasons than White Medicare Advantage enrollees?
- Are dual eligible beneficiaries more or less likely to switch plans or disenroll from Medicare Advantage because of problems with coverage of doctors and hospitals?
- Do Medicare Advantage enrollees in poorer health switch plans or disenroll more often because of problems getting the plan to provide and pay for needed care?
This work was supported in part by Arnold Ventures. KFF maintains full editorial control over all of its policy analysis, polling, and journalism activities.