Key Takeaways
In the three months since the initial KFF Survey of Women Voters, several major unexpected political events have taken place, impacting voters’ motivations and voting decisions for Election Day. This includes President Biden’s announcement that he would no longer seek reelection, with Vice President Harris quickly garnering the Democratic nomination as his replacement. To better understand how these and other events have impacted campaign dynamics and how voters feel leading into the November election, KFF resurveyed women voters and finds a very different female electorate one month before Election Day. Some key takeaways from the KFF Survey of Women Voters Revisited include:
- Since Vice President (VP) Harris entered the 2024 presidential race, abortion has become the most important issue for women under age 30, rising in the ranks above inflation, this group’s top issue from earlier this summer. Four in ten (39%) women voters under 30 now say abortion is the most important issue to their vote, doubling the share who said the same back in June. Harris’ increased campaign rhetoric on reproductive rights also seems to be resonating with the Democratic base, notably younger Democratic women voters. Democratic women of reproductive age (under age 50) are now nearly twice as likely say they trust her “a lot” to discuss issues related to abortion (66%, up from 35% in June). Among women voters overall, Harris holds a two to one advantage over former President Trump on which candidate they trust to do a better job deciding policy related to abortion access, birth control access, and IVF.
- Inflation continues to be the number one issue for women voters heading into this election and remains high among priorities for Black (51%) and Hispanic (41%) women. In a flip from earlier this summer, voters of color are now giving VP Harris an advantage on handling the rising costs of household expenses. Black women are seven times more likely to say they trust VP Harris (70% trust Harris, 10% trust Trump) and most Hispanic women also trust the VP (53% trust Harris, 35% trust Trump). This is a change from June, when many Black and Hispanic women said they did not trust either political party to do a better job addressing household costs and many disapproved of President Biden’s handling of inflation.
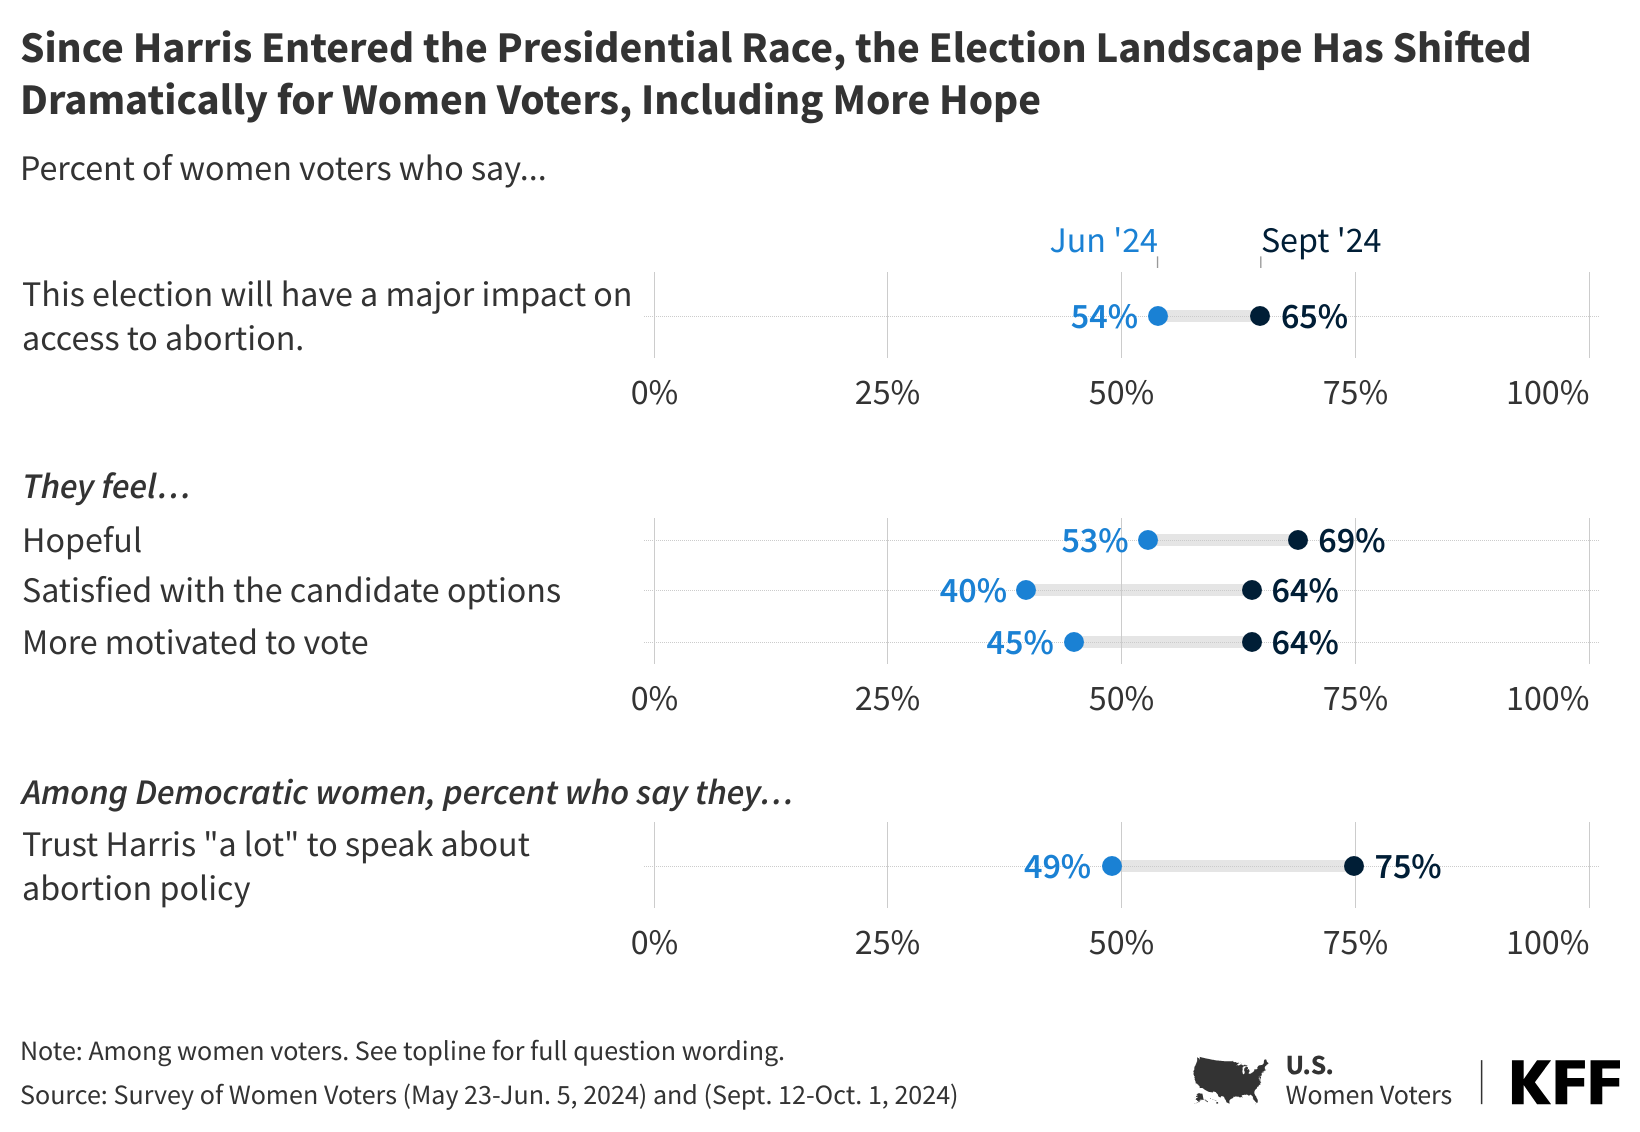
- Women voters, especially Democratic and Black women voters, are now more satisfied with their choices for president and more motivated to vote than they were back in June. The share of Democratic women voters who say they are satisfied with their choices for president has increased thirty-nine percentage points, as well as a thirty-point increase among Black women. In addition, majorities of both Democratic women and Black women now say they are “more motivated” to vote in the upcoming election than in previous presidential elections, and many attribute this increased motivation directly to VP Harris replacing President Biden as the Democratic nominee. Republican women voters, on the other hand, who were more positive back in early summer than their Democratic counterparts, now trail behind in both candidate satisfaction and motivation to vote.
- In addition to feeling more enthusiastic, a larger share of Democratic women voters now reports feeling “hopeful” about the upcoming election, but they are also more likely to say they feel “anxious.” Democratic women voters may be feeling increased anxiety as they are also now more likely to see the November election as having major implications on abortion access in the country.
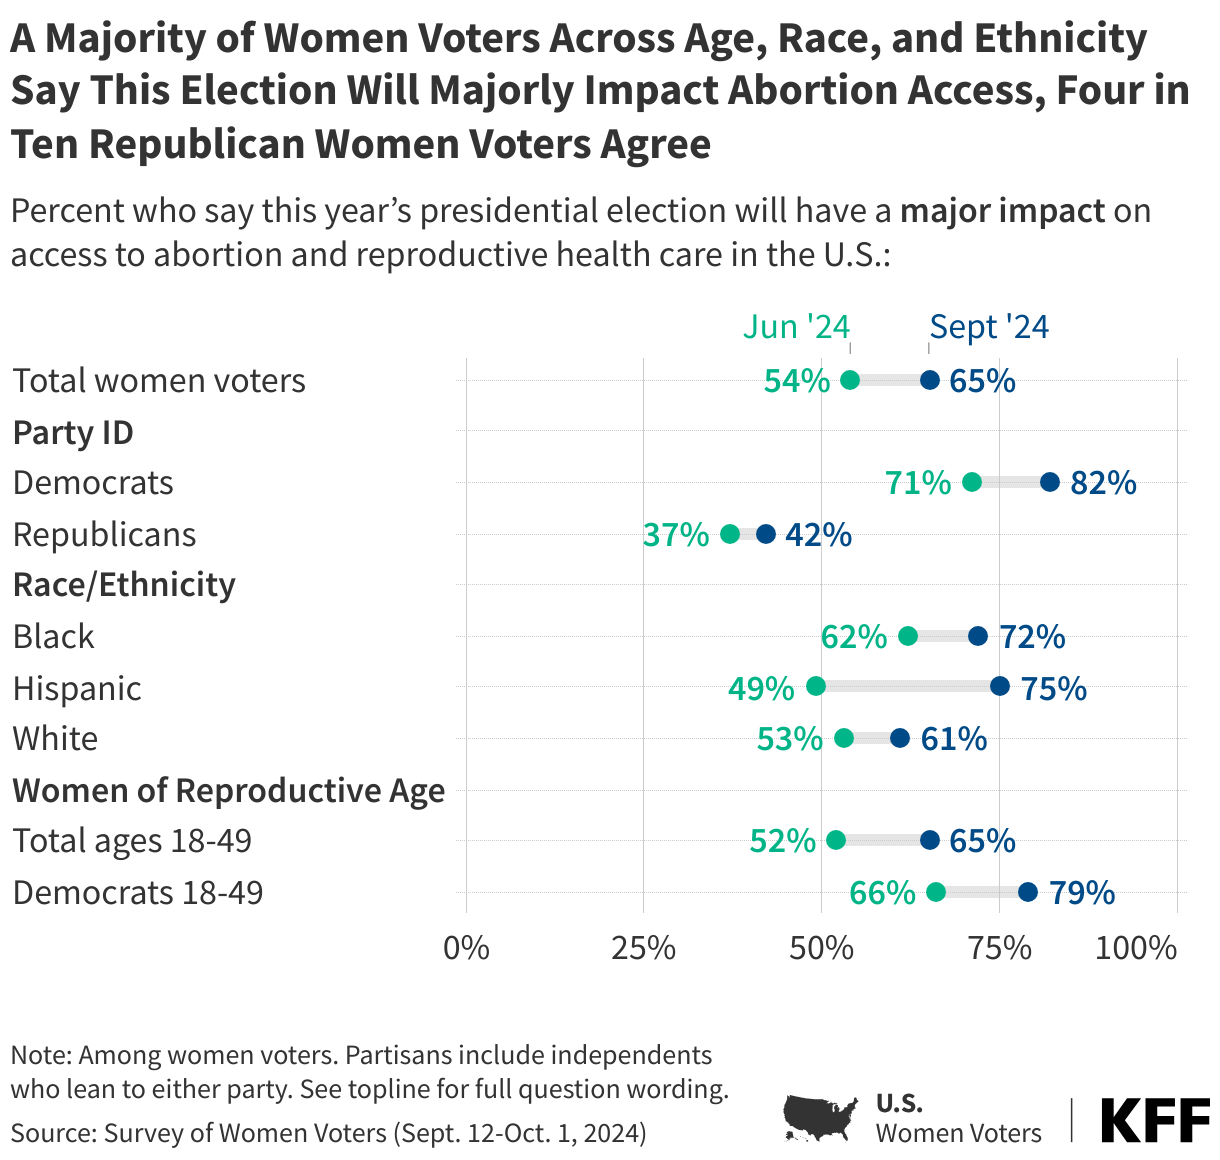
- Women voters are now 11-percentage points more likely to say that this presidential election will have a “major impact” on access to abortion in the U.S. (65%, up from 54%). Democratic women of reproductive age are now 13-percentage points more likely to say this election matters in a major way for abortion access. Republican women, on the other hand, don’t see the election as a major tipping point on abortion access with a majority saying the presidential election will have either a “minor impact” or “no impact.”
Inflation Remains Women Voters’ Top Issue, Harris Is Seen as Better Candidate to Handle Rising Household Expenses
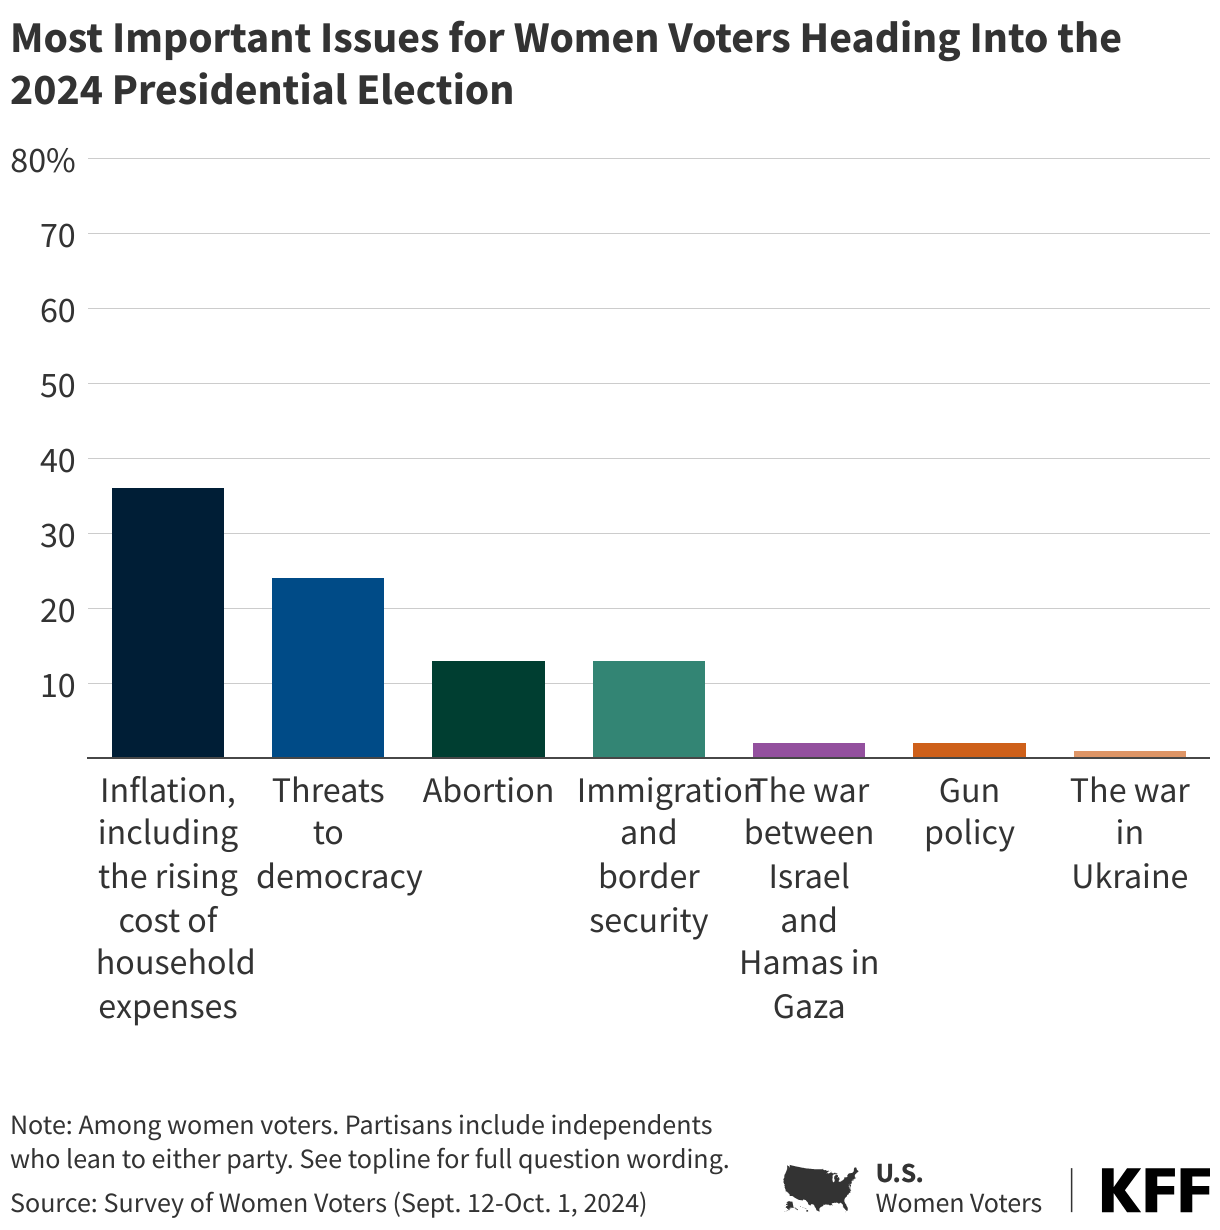
Inflation, including the rising cost of household expenses, continues to be the most important issue for women voters overall, with more than one in three (36%) citing it as the “most important” issue in their vote for president. This is followed by threats to democracy (24%), and immigration and border security (13%). A slightly larger share of women voters now say abortion is the most important issue to them (13%) than earlier this summer (10%), perhaps a reflection of the increased emphasis placed on reproductive rights by the Harris-Walz ticket.
With Harris as the Democratic nominee heading into the election, about one in five (18%) Democratic women voters, rising to one in four (26%) Democratic women voters of reproductive age, say that abortion is the most important issue to them. Even still, inflation remains the most important issue for Democratic and Republican women voters, unchanged from earlier in this campaign season.
The rising cost of household expenses remains the top issue among key groups of women voters, most notably Black and Hispanic women. Large majorities of Black women voters (68%) and Hispanic women voters (70%) report worrying “a lot” about affording basic household expenses, and this may be why inflation remains their top voting issue with about half (51%) of Black women and four in ten Hispanic women (41%) saying inflation is their top issue, compared to about one-third of White women (32%). Similar shares of White women prioritize inflation and threats to democracy (27%) this election cycle.
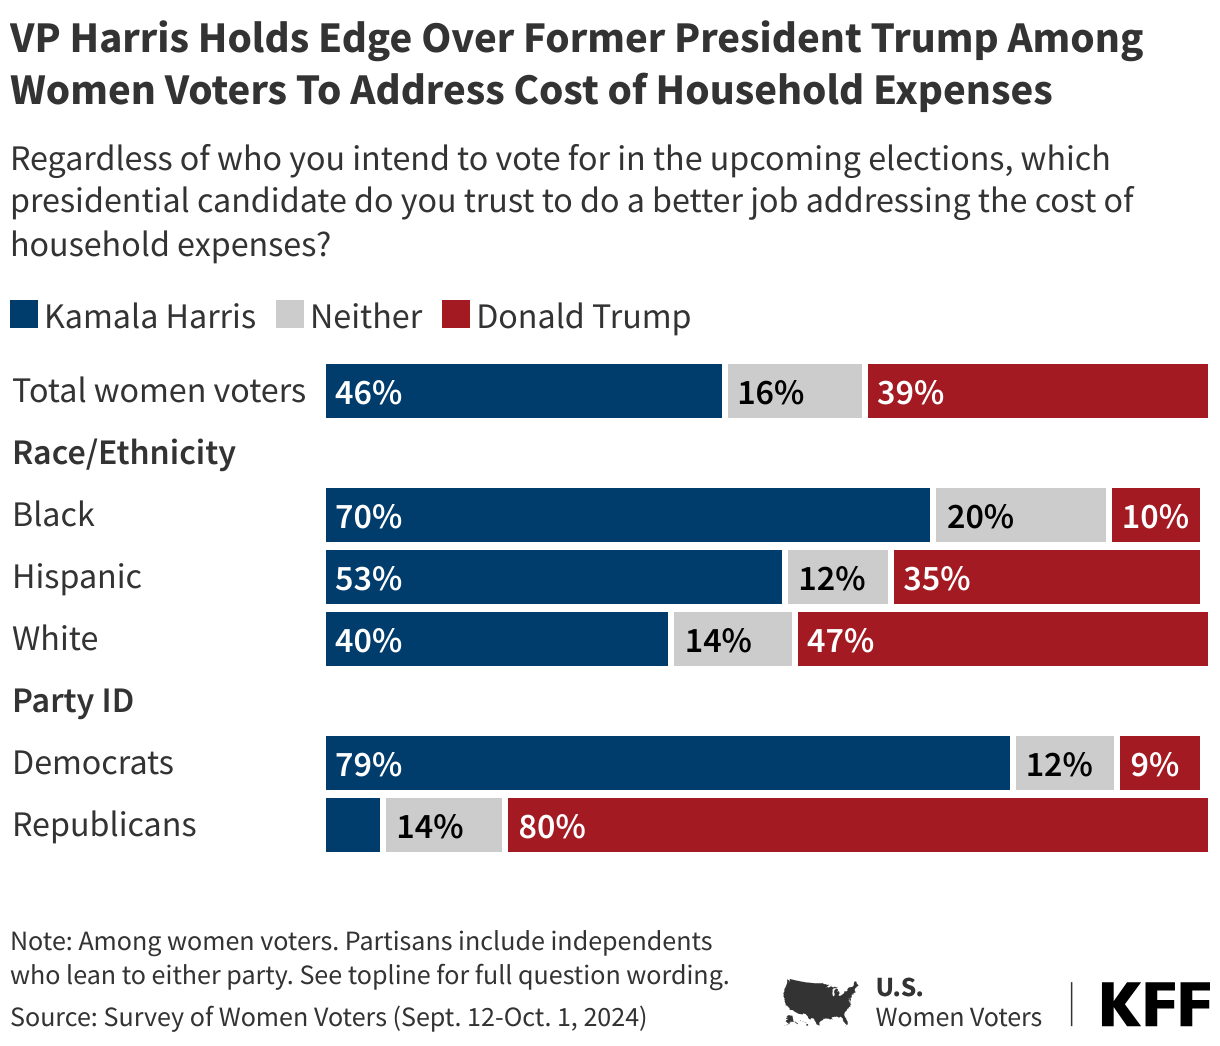
Vice President Harris holds the edge among women voters when it comes to handling the rising cost of household expenses, with about half (46%) trusting her over former President Trump (39%). One in six women voters say they trust “neither” candidate to address costs. Harris’ overall advantage on this issue is especially notable because back in June, voters were split evenly on which party they trusted more to deal with this issue, giving neither party the advantage.
Harris’s advantage is particularly strong among Black and Hispanic women voters, while White women are split between the two candidates on the issue. Black women voters are seven times as likely to trust Harris on this issue over Trump (70% trust Harris more vs. 10% trust Trump). A slight majority of Hispanic women voters trust Harris (53%) to address costs, and about one in three trust Trump (35%) on the issue. In June, the Democratic Party fared better than the Republican Party among Black and Hispanic women, though to a lesser extent. At the time, four in ten Black (41%) and Hispanic (43%) women voters said they trusted neither political party to best address costs. About half of White women now say they trust Trump to better handle costs (47%), while four in ten trust Harris more (40%).
Partisans are split, with majorities trusting their party’s nominee to better address the cost of household expenses. One in seven Republican (14%) and one in eight Democratic (12%) women voters say they do not trust either candidate.
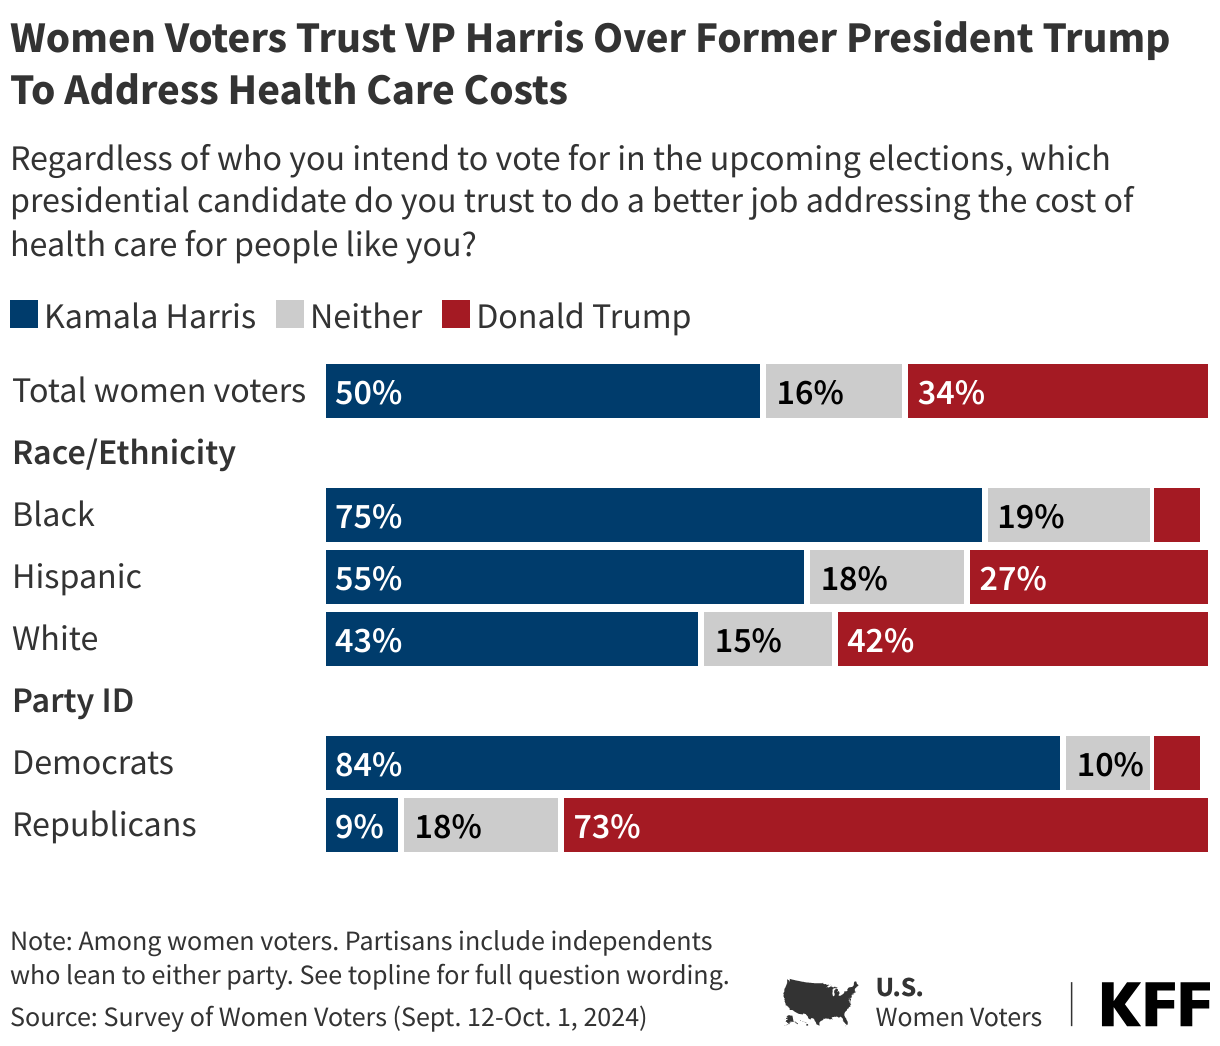
Harris also has a strong advantage as the candidate women voters trust to do a better job addressing health care costs, with half saying they trust her and one in three (34%) saying they trust Trump. One in six women voters say they trust “neither” candidate to address health care costs.
Among Black women, Harris holds the strongest advantage, with three in four saying they trust the VP more on this issue, while just 5% say they trust Trump more. Hispanic women trust Harris more, at a 2 to 1 ratio (55% for Harris vs. 27% for Trump). White women are split evenly between the two candidates on who they would trust to lower the cost of health care for people like them (43% trust Harris vs. 42% trust Trump). Again, partisans are most likely to trust their party’s candidate on this issue, though nearly one in five Republican women (18%) and one in ten Democratic women say they trust neither candidate.
Women Voters View the Stakes on Abortion Access as High
Women voters are more likely to say that this election will have a “major” impact on abortion access than they were June, when President Biden was still the Democratic nominee. Now, two-thirds (65%) of women voters think this election will have a “major” impact, up from just over half (54%) in June. Large majorities of Black women (72%), Hispanic women (75%), White women (61%), women of reproductive age (65%), women over age 50 (64%), and Democratic women (82%) now expect this election to have a major impact on abortion access. Democratic women of reproductive age are now 13 percentage points more likely to say this election will majorly impact abortion access (79% now, 66% in June). For Republican women, the perceived stakes of this election on abortion have remained low throughout this campaign cycle with about four in ten Republican women continuing to say they expect a major impact.
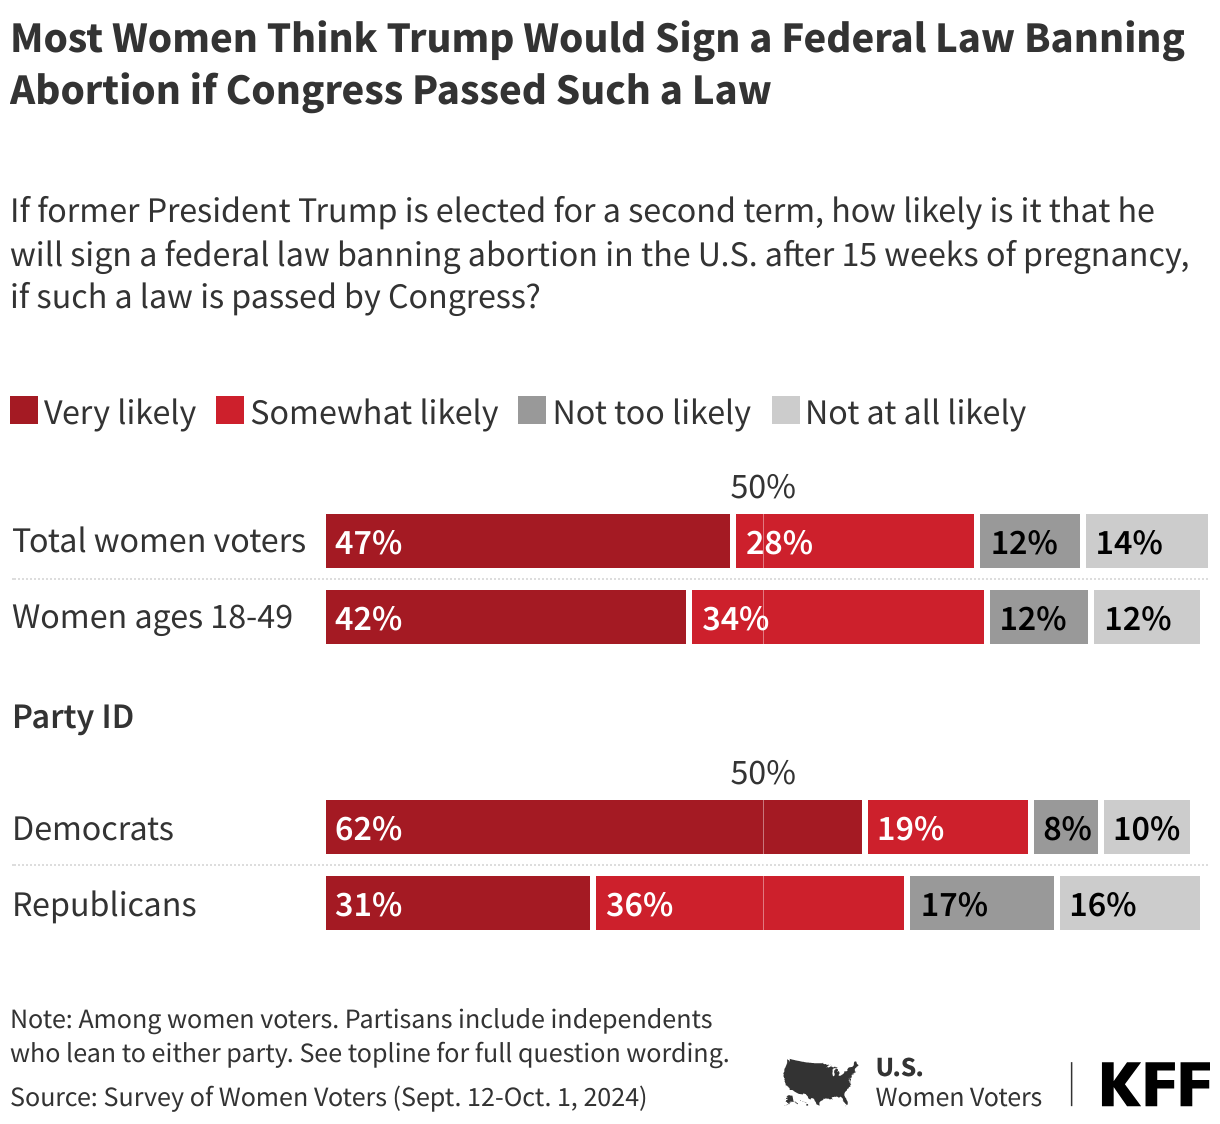
Three in four women voters say that if elected, they think former President Trump would sign a federal law banning abortion in the U.S. after 15 weeks of pregnancy, should Congress pass such a law. This includes nearly half (47%) who say this is “very likely.” Majorities across partisans as well as women of reproductive age say they think it is likely that former President Trump will sign a federal law banning abortions after 15 weeks in the U.S., if such a law is passed by Congress. Trump has repeatedly said that he will not sign a federal abortion ban. A federal ban on abortion is unpopular among women voters, with two-thirds overall saying they would oppose a nationwide ban on abortion at 15 weeks of pregnancy. Six in ten Republican women, however, support a nationwide ban.
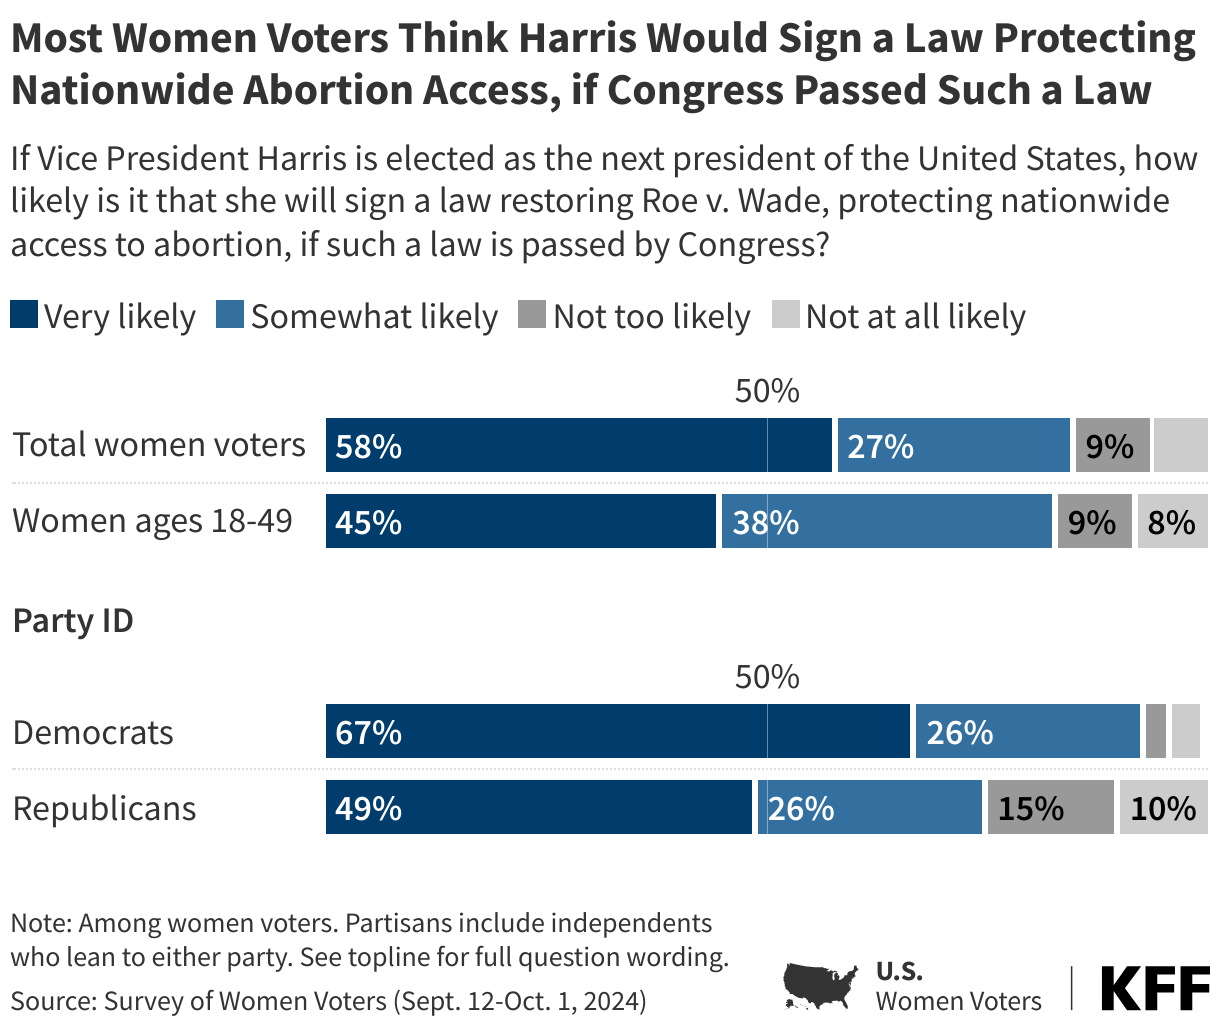
In contrast, most women across party lines, including about nine in ten (94%) Democratic women and three in four Republican women, say VP Harris is likely to sign a law restoring Roe v. Wade, protecting nationwide access to abortion, if she is elected and if such a law is passed by Congress. Seven in ten women voters support a nationwide right to abortion, including majorities of Democratic and independent women voters.
Notably, these women voters were less certain of President Biden’s intentions for abortion policy in his second term when he was the Democratic nominee; in June, about seven in ten (72%) women voters said it was likely Biden would sign a law guaranteeing a federal right to abortion until fetal viability, including about one-third (36%) who said this was “very likely.” At the time, Republican women were more likely to say this was “very likely” than Democratic women (46% vs. 32%), suggesting that the messaging from the Harris campaign has been clearer to Democratic voters.
VP Harris Holds Advantage on Reproductive Health Issues
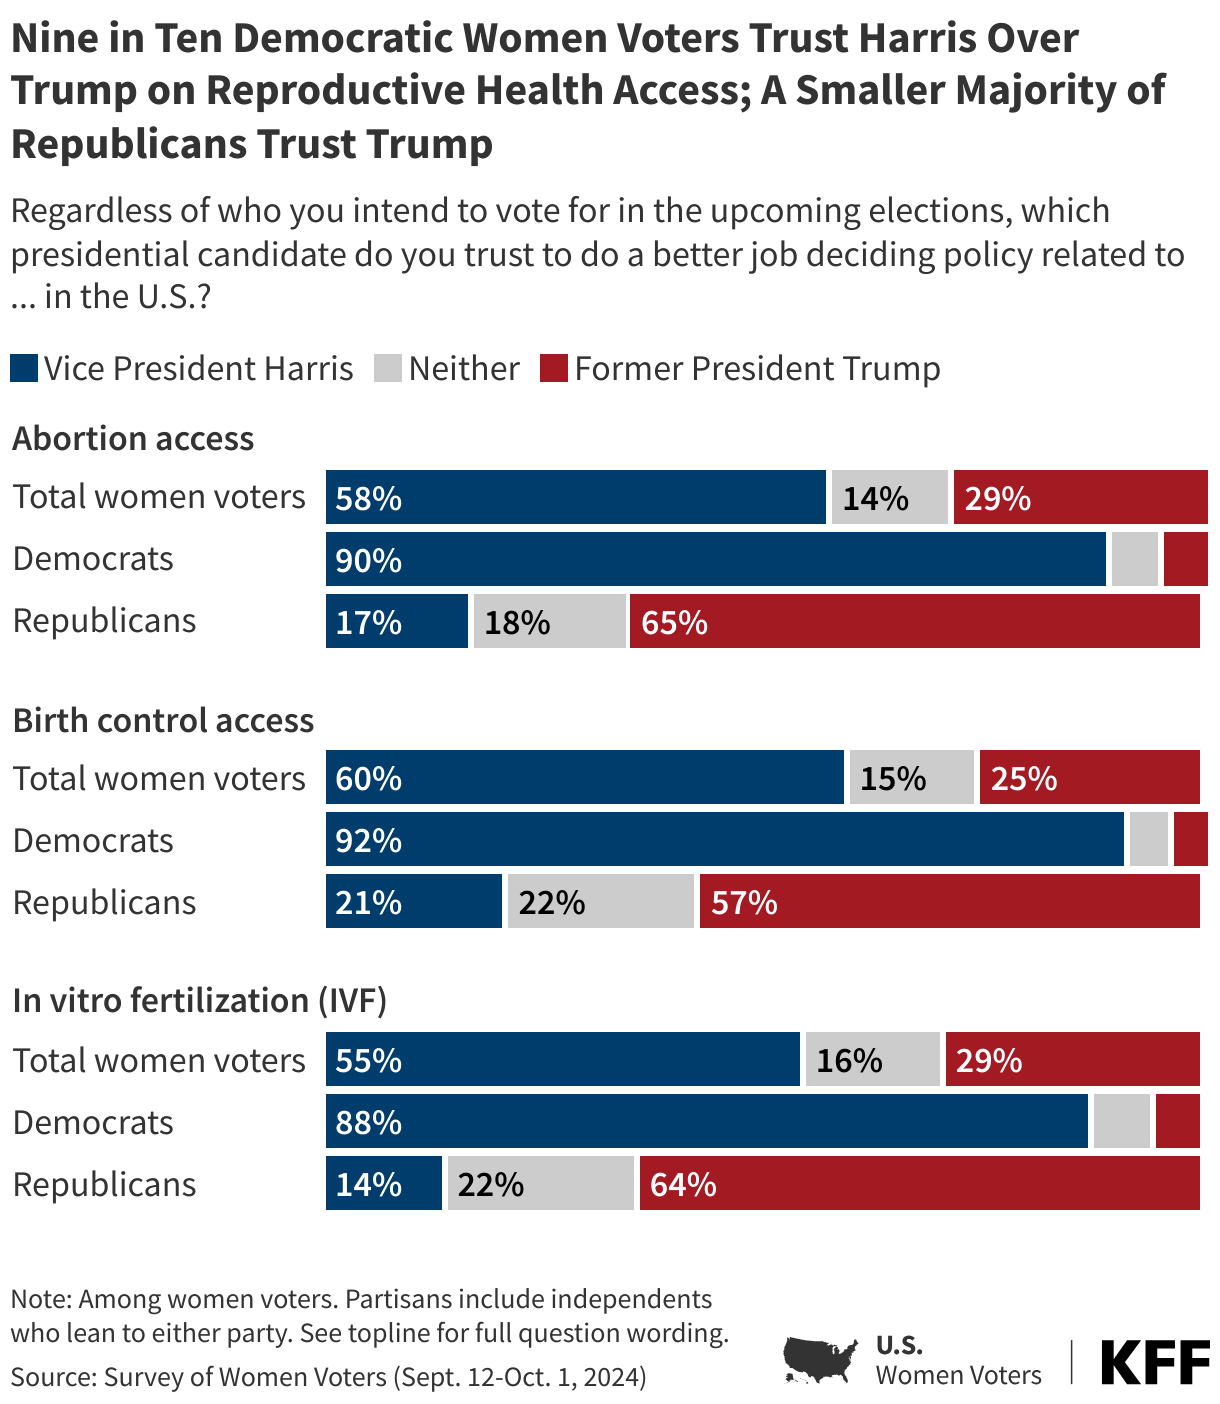
Nearly twice the share of women voters say they trust Vice President Harris to do a better job than former President Trump deciding policy related to abortion access in the U.S. (58% v. 29%), birth control access (60% vs. 25%) and IVF (55% vs. 29%).
Democratic women overwhelmingly say they trust Harris over Trump to decide policy on each of the issues: abortion access (90% vs. 4%), birth control access (92% vs. 4%), and IVF access (88% vs. 5%). In addition, Democratic women are ten percentage points more likely to say they trust Harris to address each of these reproductive health issues than they were to trust Biden in June. About six in ten Republican women say they trust Trump over Harris on the issue of abortion access (65% vs. 17%), birth control access (57% vs. 21%), and access to IVF (64% vs. 14%). However, about one in five or more Republican women say they do not trust either candidate on each of these areas.
Among women voters overall, Harris fares better on each of these issues than Biden did in June. At the time, President Biden had the edge over Trump on each of these issues, but a substantial share of women voters said they trust “neither” candidate.
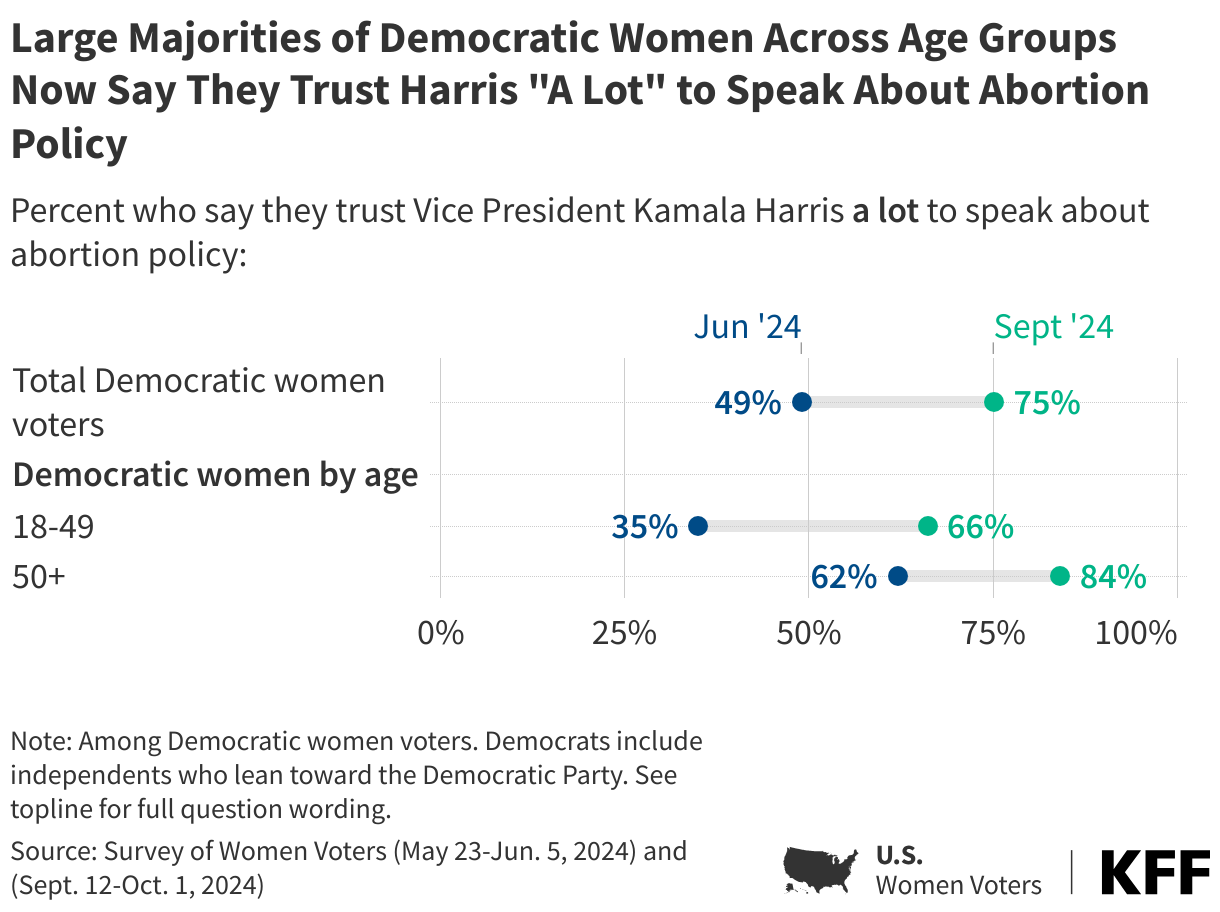
Democratic women voters are also becoming more comfortable with Harris speaking on abortion policy. Back in June, about half (49%) of Democratic women voters said they trusted her “a lot” to speak about abortion policy. That share has increased to three in four in the latest Women Voters resurvey. The most notable increase is among Democratic women of reproductive age, who were skeptical of the VP on this issue earlier this summer. The share of Democratic women ages 18 to 49 who say they trust her “a lot” to speak about abortion has nearly doubled in four months, from about one-third (35%) to about two-thirds (66%).
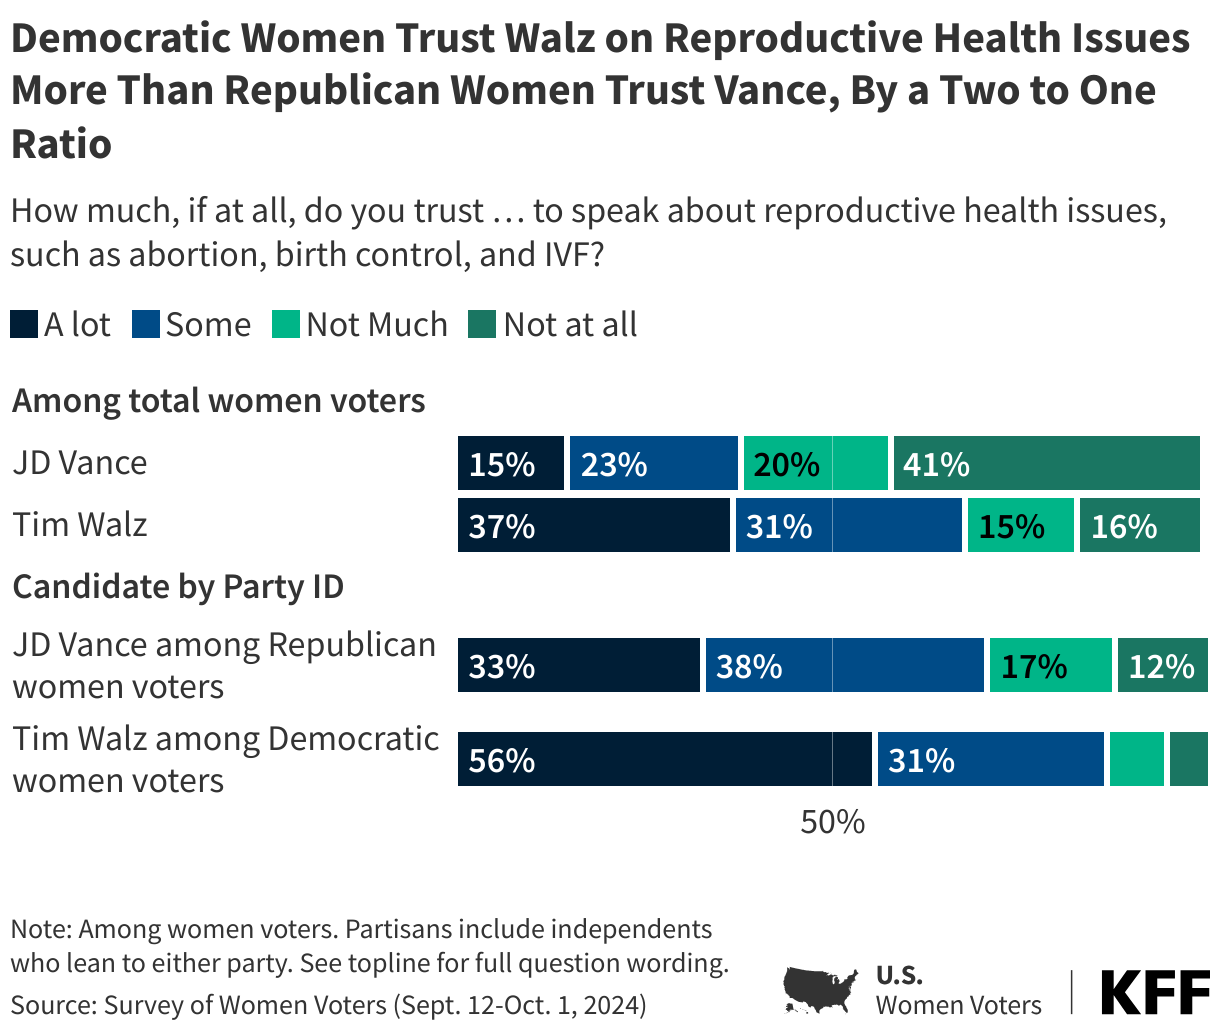
Surveyed before the first and only vice-presidential debate of this election cycle, Democratic women are 23-percentage points more likely to say they have “a lot” of trust in their party’s VP candidate, Tim Walz, to speak on issues related to reproductive health than Republican women are of Republican vice-presidential nominee JD Vance (56% vs. 33%).
Abortion Rises as a Key Issue for Young Women
Beyond inflation, larger shares of women voters rank abortion as their most important issue heading into this election than in June (13%, up slightly from 10%). This increase is largely driven by young women.
Abortion is now the single most important issue to women under age 30, with about four in ten (39%) naming it as their top issue, followed by inflation (28%). This is a dramatic shift from earlier this summer, when half (48%) of women under age 30 cited inflation, and one in five (20%) cited abortion as their top issue. About one in ten women ages 30-54 (12%) or ages 55 and older (7%) say that abortion is their top issue, unchanged from earlier this summer.
The stakes for this group are high: about seven in ten (72%) women voters ages 18-29 say this year’s election will have a major impact on access to abortion and one in five say it will have a “minor impact.” Few (8%) say this election won’t impact abortion access.
VP Harris fares better among this group on the issue of abortion than Trump (69% say they trust her on the issue, 19% trust the former president), and she fares better than Biden did among this group in June. Earlier this summer, about half (49%) said they trusted Biden to do a better job deciding abortion access policy, and about one in five (18%) trusted Trump. An additional third (33%), however, said they trusted neither candidate at the time.
Mood of the Election
In early summer 2024, the initial KFF Survey of Women Voters reported that women voters were not largely enthusiastic about the upcoming 2024 presidential election. Resurveyed three months later with a change at the top of the Democratic Party ticket, women voters are not only more satisfied about their options for president, but two-thirds (64%) say they are more motivated to vote in this election compared to previous presidential elections. And while many still feel “anxious” and “frustrated,” a majority now say they are “hopeful” and half say they are “enthusiastic” – marking a massive shift in how women voters see the 2024 election.
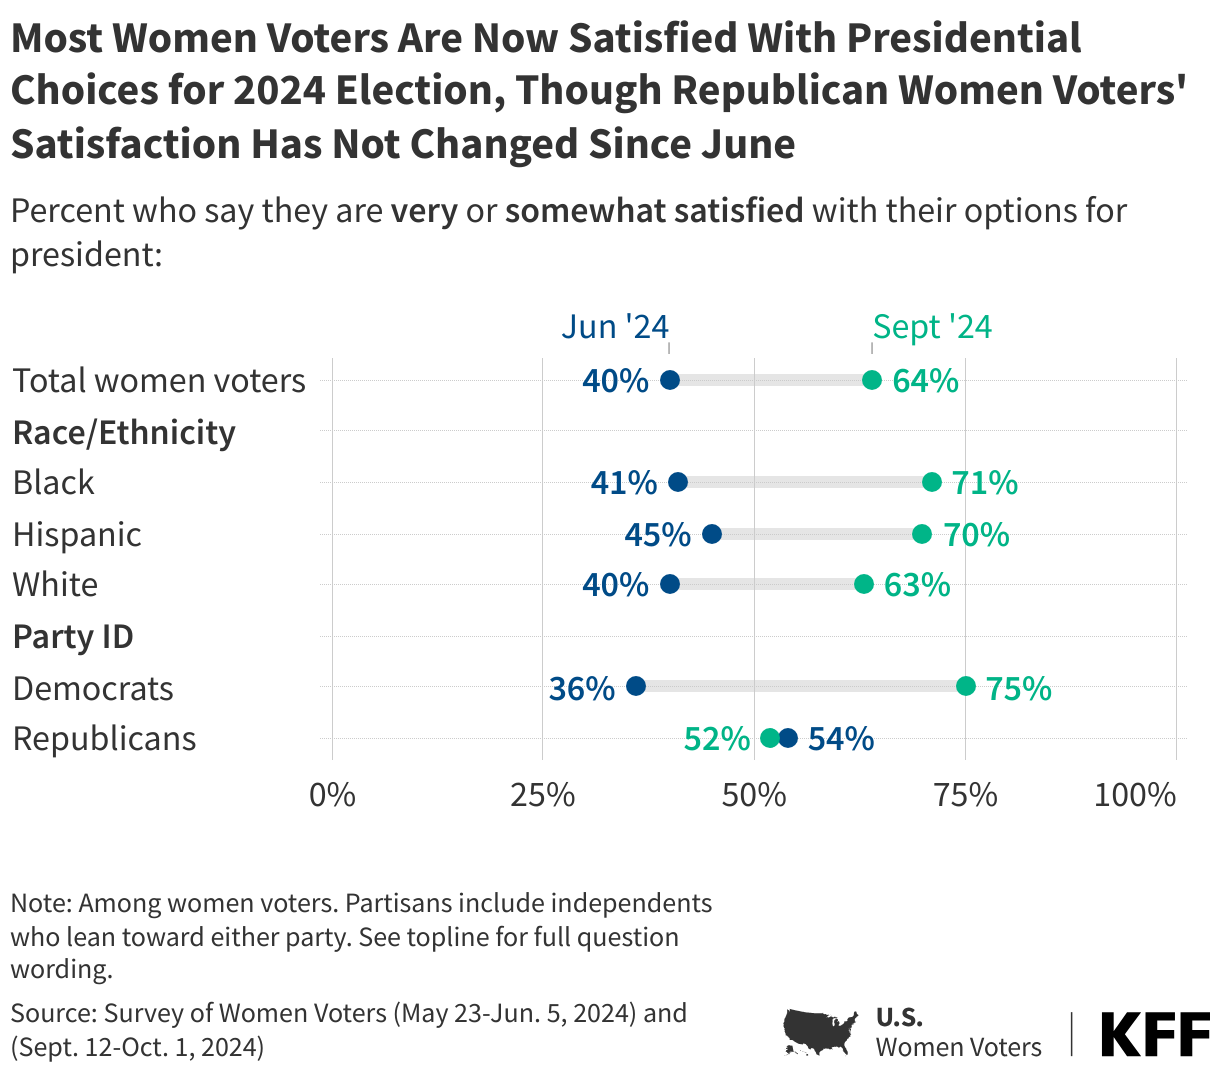
Two-thirds of women voters now say they are either “very satisfied” or “somewhat satisfied” with their options for president, up from 40% back in June 2024. Three months ago, the only groups of women voters who said they were satisfied with their options were slight majorities of Republican women (54%) and women voters ages 65 and older (52%). In the latest poll, a majority of women voters across race and ethnicity, party identification, and age say they are satisfied with their choices. This includes a nearly forty percentage point increase in satisfaction among Democratic women voters. Republican women, who were more satisfied than Democrats with their choices back in June, are now less likely to report being satisfied than their Democratic counterparts. About half (52%) of Republican women voters say they are satisfied with their choices for president, similar to their responses from June.
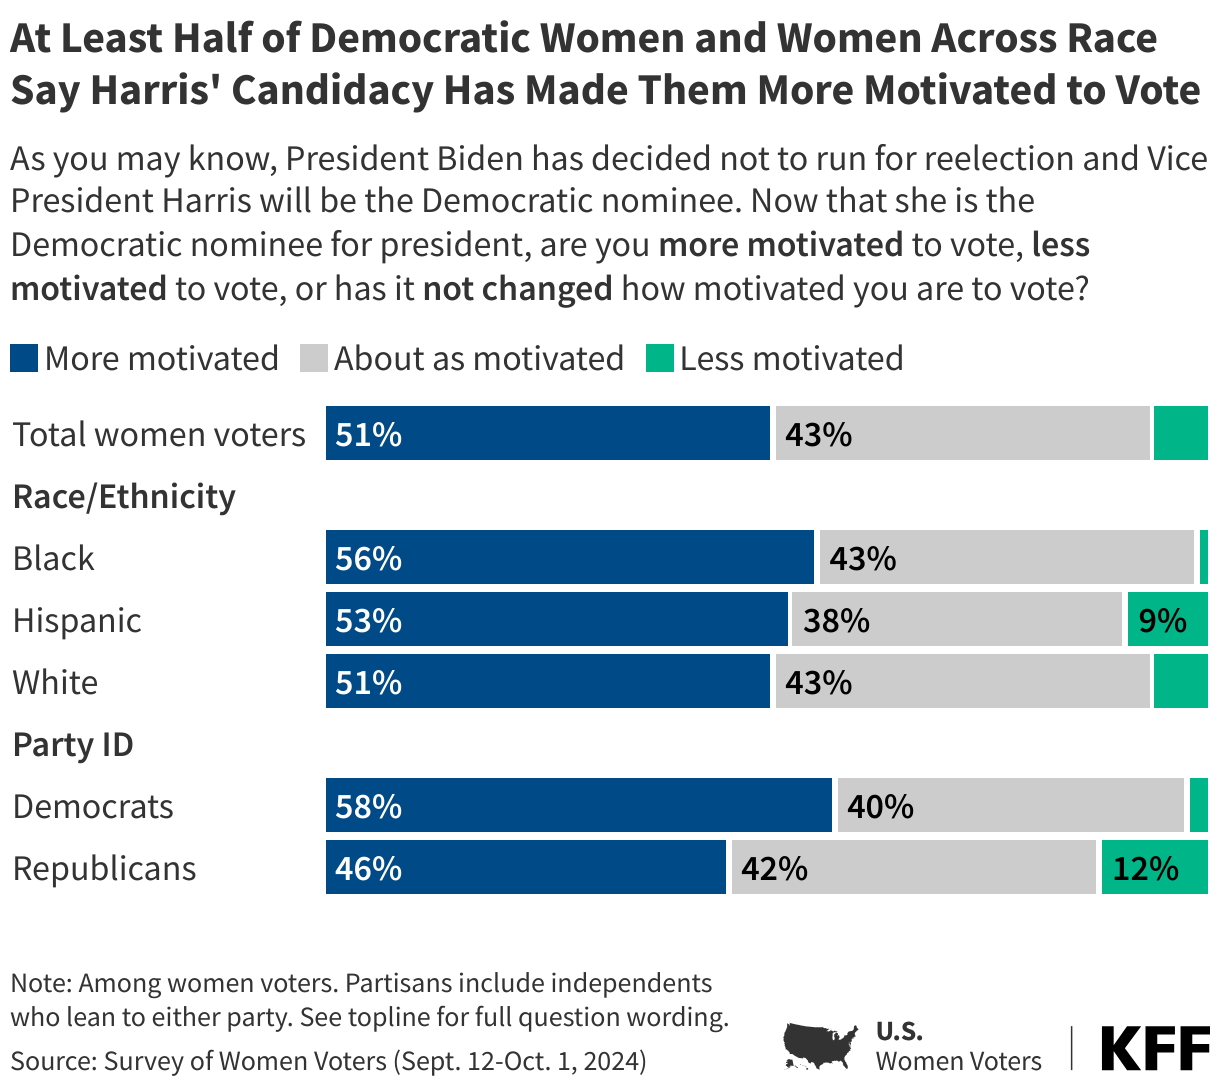
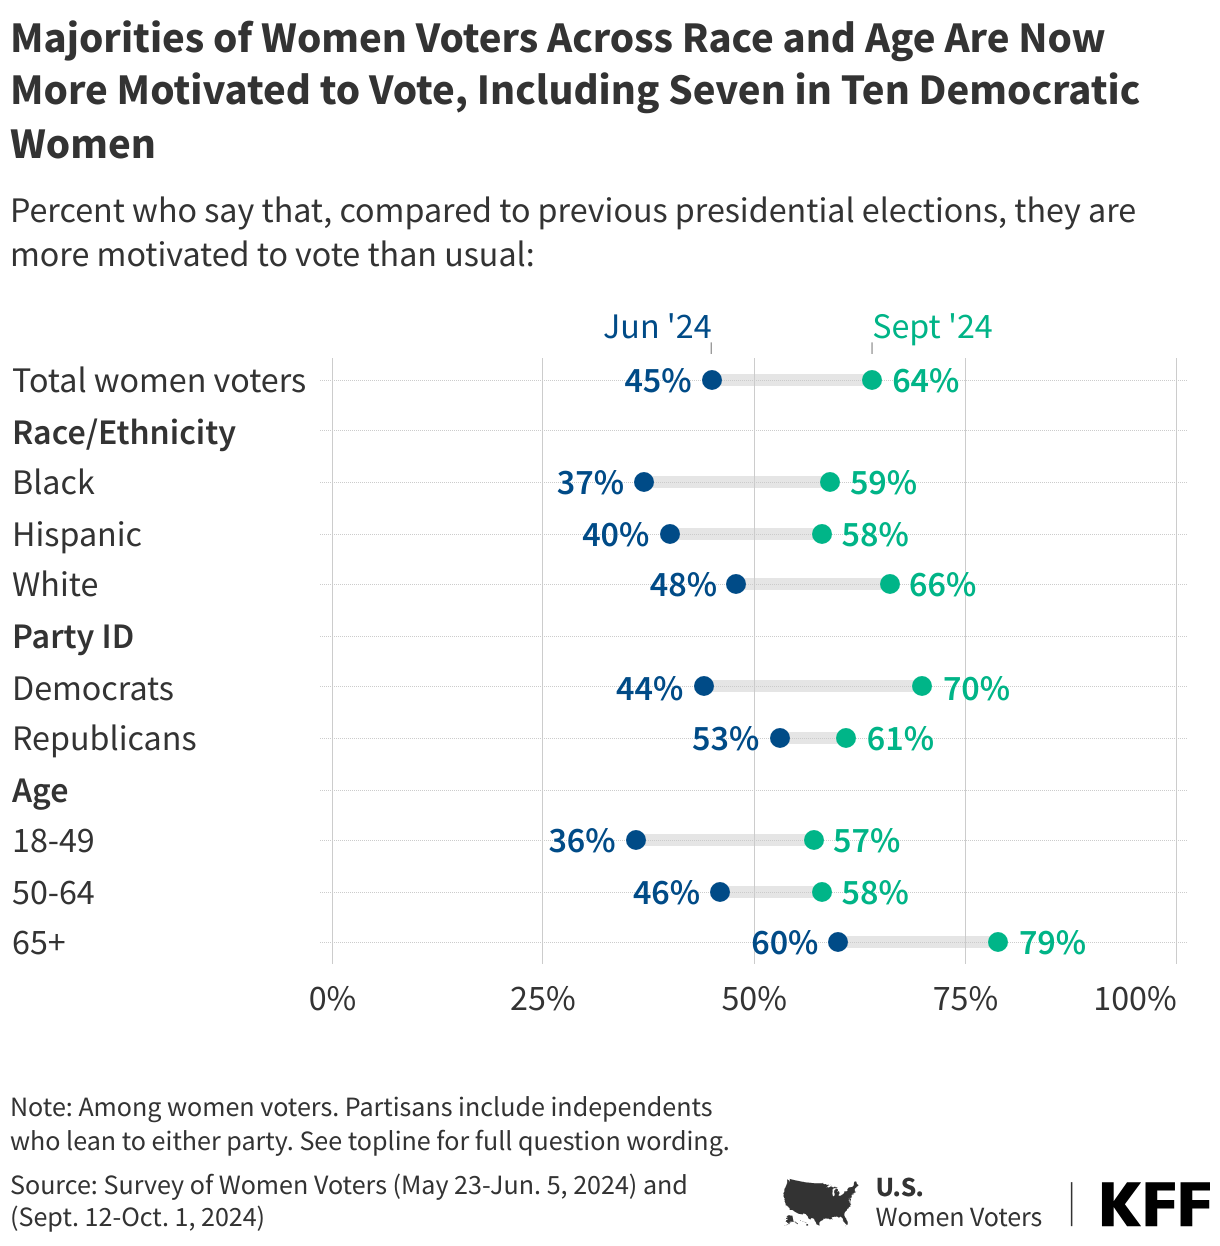
In addition, the share of women voters who now say they are “more motivated” to vote in this presidential election compared to previous elections has increased 19 percentage points, up to 64% in September. This includes a 26-percentage point increase among Democratic women voters, while the share of Republican women voters who say they are more motivated to vote has increased slightly from 53% to 61%.
Black women are another group that has seen a considerable increase in the share who say they are now more motivated to vote, especially since so many reported being unsatisfied and not as motivated back in June. Nearly six in ten Black women voters now say they are more motivated to vote compared to the previous election, up from 37% in June. Women voters, across age groups, are all more likely to say they are “more motivated” now compared to four months ago.
For many, the increase in motivation isn’t just because it is closer to Election Day; half of voters (51%) say Vice President Harris becoming the Democratic nominee for president has made them “more motivated” to vote in the upcoming election. The share of voters who say Harris’ candidacy has made them more motivated increases to nearly six in ten Black women voters and Democratic women voters. The share of women voters who say they are more motivated this election cycle because of Harris’ candidacy also includes 55% of women voters who say abortion is the most important issue in determining their vote choice.
When asked explicitly why they are more motivated now that President Biden has decided not to run for reelection and VP Harris is the nominee, Democratic women offer responses saying she is a better candidate or that she has a better chance of beating former President Trump.
Democratic Women in Their Own Words: “Why are you now more motivated to vote in the upcoming election now that Vice President Harris is the Democratic nominee?”
“She seems like a competent candidate closer to my age group and will understand issues that affect my generation more than Biden.” – Hispanic Democratic woman from California, age 37
“I feel the Democrats have a better chance with Harris as the candidate.” – White Democratic woman from New Hampshire, age 64
“She is younger, female and a person of color. I was concerned that President Biden could not win reelection. I now think we have a chance.” – White Democratic woman from Michigan, age 50
“I think she is educated I think she is on top of it smart and intelligent and knows some of the ropes. If we need a change we might as well start with her.” – Black Democratic woman from Oklahoma, age 70
But it isn’t just key constituents of the Democratic base who are now more motivated by Harris’ nomination – nearly half (46%) of Republican women voters also say they are more motivated to vote, mostly to ensure Harris isn’t elected. When asked directly about why they are now more motivated, Republican women say it because they want to make sure Trump wins because they don’t want her to win.
Republican Women in Their Own Words: “Why are you now more motivated to vote in the upcoming election now that Vice President Harris is the Democratic nominee?”
“She hasn’t done anything to help the American people in four years, why would we want her to be commander in chief!” – White Republican woman from Ohio, age 75
“So President Trump will be reelected.” – Multi-racial Republican woman from Illinois, age 43
“She is not qualified to be president.” – White Republican woman from Pennsylvania, age 64
“Hoping she doesn’t become the first female president.” – White Republican woman from Texas, age 38
“Because Kamala Harris is a threat to our country.” – White Republican woman from Nebraska, age 77
Women Voters Feel Both Anxious and Hopeful About Upcoming Election
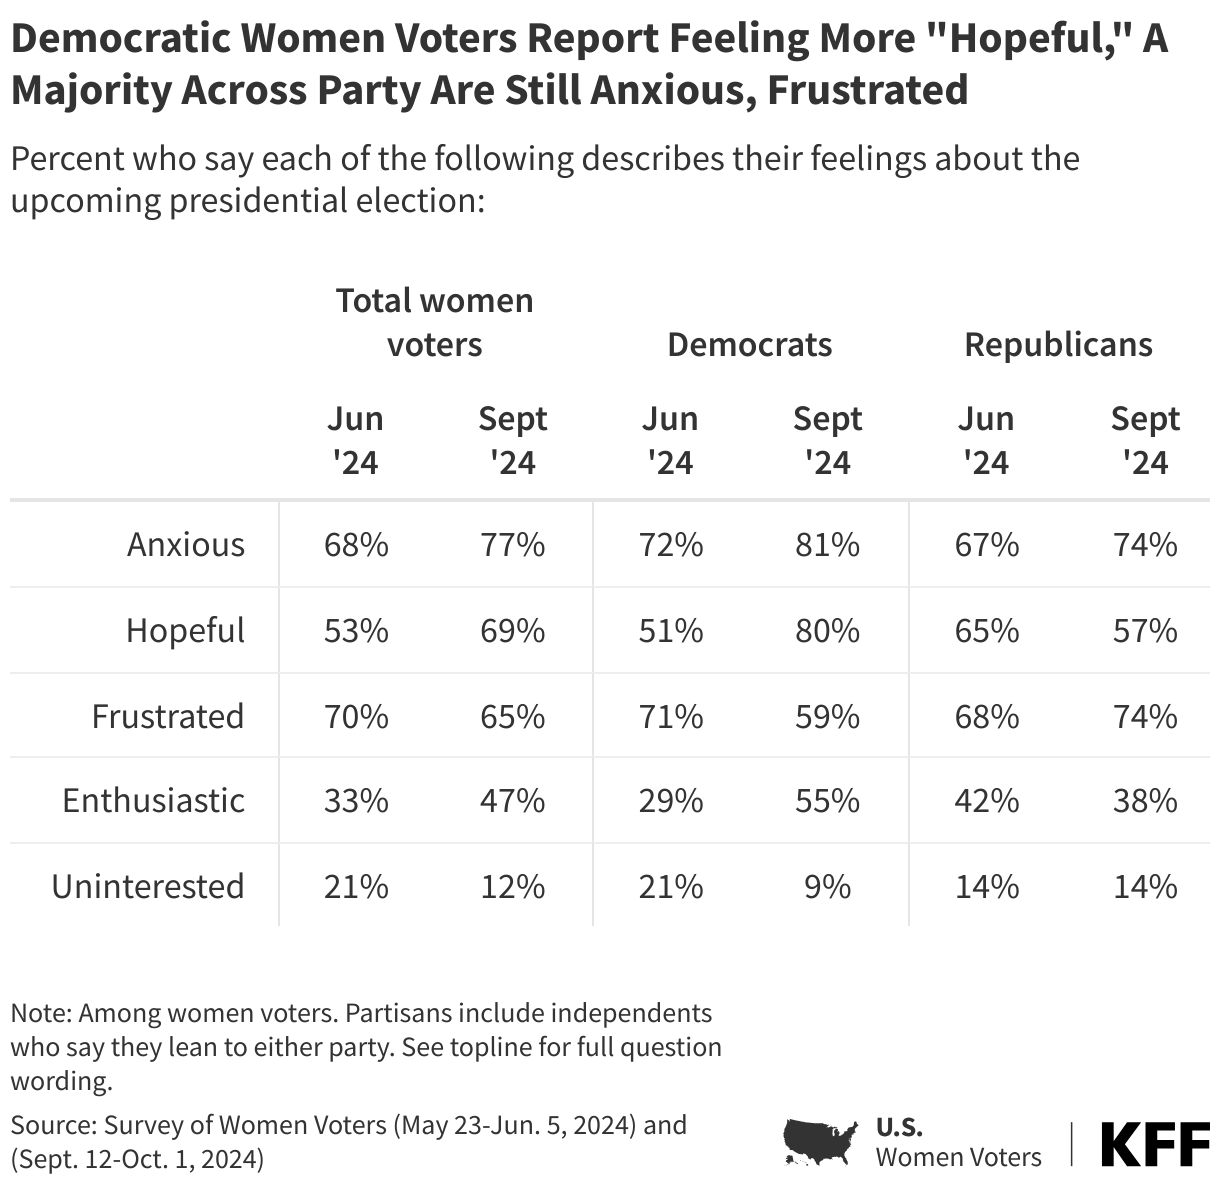
Back in June, the most common feelings women voters had about the upcoming presidential election were frustration and anxiety. Three months later, a majority of women voters still say they feel “frustrated” (65%) or “anxious” (77%) about the upcoming election, but seven in ten (69%) now say they feel “hopeful” (up from 53% in June). In addition, nearly half (47%) of women voters say they feel “enthusiastic,” up from a third back in June. The share of women voters who say they feel “uninterested” in the election has dropped from 21% to 12%.
While anxiety and frustration are high for women across partisanship, Democrats now hold the edge on hope and enthusiasm. Eight in ten Democratic women report being “hopeful” (up from 51% in June). Earlier this summer, Republican women were more hopeful than Democratic women, but Democratic women now report feeling more hope. Democratic women also hold the edge on “enthusiasm,” whereas Republican women were more enthusiastic than Democratic women back in June.
In Their Own Words: “What emotion best describes how you feel about the upcoming presidential election?”
When women voters are asked to offer an emotion that best describes how they are feeling about the upcoming presidential election, “hopeful” and “scared” are among the most common feelings – illustrating an electorate that is experiencing both positive and negative emotions from the upcoming election with two candidates who they view very differently.
Among Democratic women voters:
“Very concerned, but cautiously optimistic.” – White Democratic woman from Texas, age 60
“Nervous, scared, hopeful, angry, and anxious.” – Hispanic Democratic woman from Texas, age 66
“We need a good, strong and firm presidential leader for all the people in the United States of America.” – Black Democratic woman from Florida, age 68
Among Republican women voters:
“Worried that fraud will take place again like it did in 2020.” – White Republican woman from Texas, age 73
“Fear of outcome. Uneasiness.” – White Republican woman from Nebraska, age 77
“Ready to MAGA.” – White Republican woman from New Jersey, age 39
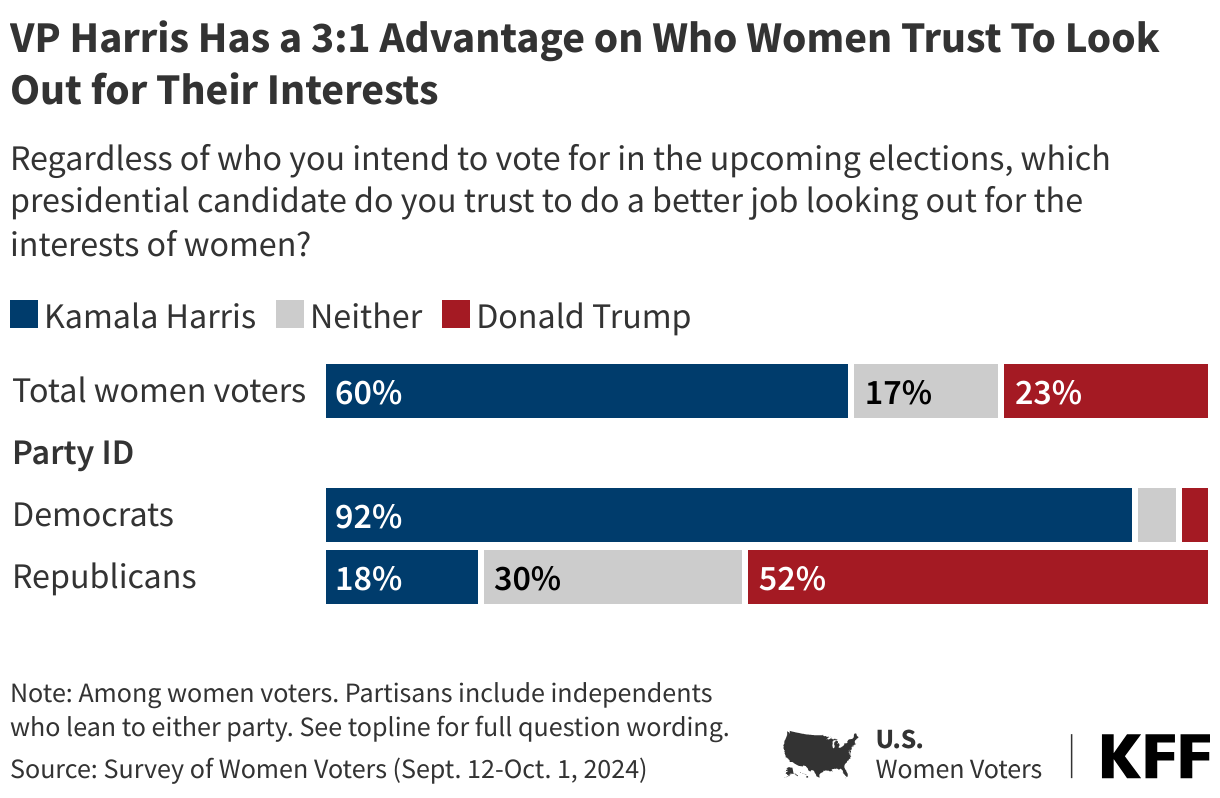
Vice President Harris has a strong advantage among women voters on which candidate they trust do a better job “looking out for the interests of women,” with nearly three times as many women voters saying they trust Vice President Harris (60%) than say the same about former President Trump (23%). Nearly all of Democratic women voters (92%) say they trust VP Harris more to look out for the interests of women, while about half of Republican women voters (52%) say they trust former President Trump. One in five (18%) Republican women voters say they trust VP Harris more to do a better job looking out for the interests of women and three in ten say they don’t trust either candidate.
For Some, the First Female President Is a Motivating Factor
When asked why they are now more motivated to vote, seven percent of women voters say it is because they want a woman candidate to win and are motivated by the thought of having the first woman president.
Half (47%) of women voters say that being a woman doesn’t hurt or help Vice President Harris as a candidate while one in three (34%) say it helps her as a candidate, and one in five say it hurts her as a candidate. Republican women voters are much more likely to say Harris’ gender doesn’t make a difference (60% v. 35%), while three in ten (28%) Democratic women voters say it hurts her as a candidate compared to one in ten Republican women.
Most women voters say their vote choice hasn’t changed since VP Harris became the Democratic nominee, with the vast majority (98%) of women voters who said back in June that they planned on voting for President Biden now saying they plan on voting for VP Harris. Additionally, 85% of women voters who said they planned on voting for former President Trump back in June continue to say they plan on voting him in the most recent poll. However, a small share (20%) of women voters who either planned on voting for Trump back in June or said they were not going to vote now say they plan on voting for VP Harris (11% of all women voters). When voters are asked why they now plan on voting for VP Harris, about a quarter offer reasons related to seeing Harris as a better candidate and for many her personal characteristics including her age, experience, and ability to care for people resonates most.
In Their Own Words: “What about Harris makes you want to vote for her?”
“I guess because I’m a woman and it makes me hopeful that she can do a better job running compared to past presidents. Plus we’ve never had a female president so I think it’s about time.” – White independent woman from California, age 36
“She seems like she will make changes for everyone and will actually do things for the country and do things for our future, especially with me being part of the younger generation to vote.” – Black Democratic woman from North Carolina, age 26
“She genuinely cares about people and I feel she will make the USA a better place to live and afford.” – White independent woman from Pennsylvania, age 56
“Her leadership skills and stances on abortion and economy and experience in politics.” – Hispanic Democratic woman from California, age 33
“She’s pleasant. She treats everyone fairly. I’ve never heard her disrespect anyone or treat them unfairly and I think just having morals is very important.” – Black Democratic woman from Georgia, age 38
“She wants to raise the minimum wage, she’s an advocate for reproductive rights, and stricter gun control.” – Asian Democratic woman from Texas, age 23
“She is sharp, energetic, not intimidated by Trump, has values, will stand up for women.” – White Democratic woman from Washington, age 61
“Plans to improve health, boost the economy and mitigate climate change.” – Hispanic Democratic woman from Minnesota, age 27
“Her age, her stance on issues, how she conducts herself, her experience. She was my top choice in 2020 and I have been a supporter of hers for a long time. I think her experience in every branch of government, her specific stances, and her personal traits are all assets in this moment in American history.” – White Democratic woman from New York, age 35
On the other hand, women voters who plan on voting for former President Trump in the 2024 presidential election offer responses related to his previous experience or his policy decisions when asked about their vote choice. Four in ten women voters who plan on voting for Trump say they think he is a better choice and that he did a good job during his presidency. About a quarter of Trump supporters say his economic policies are why they plan on voting for him.
In Their Own Words: “Why do you plan to vote for former President Donald Trump in the 2024 presidential election?
“He is a business man who understands relationships, the economy and has integrity. I can see why people can’t stand his arrogance, but beyond that his word you can take to the bank.” – White Republican woman from Oregon, age 33
“Kamala Harris’s position on many issues is way too liberal.” – White Republican woman from Florida, age 61
“The cost to live has gone up and I can barely afford things anymore. My mortgage has gone up $300/ month.” – White Republican woman from Illinois, age 37
“Because he’s strong and I believe he’s got the nation’s best interests at heart. Even though I don’t like his personality but that doesn’t matter.” – White Republican woman from Kentucky, age 75
“He is better for the hard working middle class Americans and he has many grandkids to look out for by making good policies for America and he has experience and a good record as president.” – White Republican woman from Colorado, age 29
“His policies align more with my values of small government, lower taxes, and less socialism.” – White Republican woman from Missouri, age 45