Medicare Advantage Has Become More Popular Among the Shrinking Share of Employers That Offer Retiree Health Benefits

Published: Nov 18, 2024

Employer and union-sponsored retiree health plans play an important role in providing supplemental benefits to about a quarter (24%) of all people with Medicare or 14.5 million Medicare beneficiaries. However, the share of employers offering retiree health benefits has been shrinking. Among large employers that offer health benefits to active workers, the share offering retiree health benefits has dropped from 66% in 1988 to 24% in 2024, according to the latest KFF Employer Health Benefits Survey. And among large firms offering health benefits to active workers and retirees, 64 percent offer retiree health benefits to Medicare-age retirees in 2024. Among the declining share of large firms that offer retiree health benefits to Medicare-age retirees, Medicare Advantage has become more popular.

This analysis examines the extent to which large private and non-federal public employers that offer retiree health benefits are turning to Medicare Advantage, using data from the 2024 KFF Employer Health Benefits Survey (see methods).

Highlights:

  • Slightly more than half (56%) of large employers offering retiree health benefits to Medicare-age retirees in 2024 offer coverage to at least some retirees through a Medicare Advantage plan, more than double the share in 2017 (26%).
  • About half of large employers (53%) that offer Medicare Advantage coverage to their retirees in 2024 do not give retirees a choice in coverage options.
  • Slightly more than half (56%) of large employers offering retiree benefits through a Medicare Advantage plan believe the shift to Medicare Advantage lowered the cost per retiree.
  • Among large firms that offer retiree health benefits but do not offer benefits through a Medicare Advantage plan in 2024, 6% are very likely or somewhat likely to do so in the next two years.

Employer or union-sponsored retiree health benefits cover some or all of Medicare’s cost-sharing requirements and may provide supplemental benefits that are not covered by traditional Medicare. Until fairly recently, employer and union-sponsored retiree health benefits were typically designed to coordinate or wrap around traditional Medicare.

Concerns about retiree health benefit costs have led employers and unions to implement a variety of changes to limit their financial obligations, such as imposing caps on their retiree health liability, shifting toward defined contribution approaches, increasing retirees’ premium contribution, and more recently, by offering their Medicare-eligible retirees coverage through Medicare Advantage plans. Medicare Advantage plans, mainly HMOs and PPOs, provide all Medicare-covered benefits, typically include Part D drug coverage, and often include supplemental benefits such as lower cost sharing and vision, dental, and hearing benefits. Medicare Advantage enrollees continue to pay the Medicare Part B premium, but often pay no additional premium for covered benefits.

Unlike other Medicare Advantage plans, employer plans are not required to provide detailed information about their benefit design, including supplemental benefits. Therefore, it is not possible to assess how benefits and cost sharing compare for those enrolled in a group plan versus those enrolled in a plan that is generally available for individual purchase or a special needs plan. While group enrollment as a share of total Medicare Advantage enrollment has fluctuated between 17% to 20% since 2010, the actual number of group enrollees has increased from 1.8 million in 2010 to 5.7 million in 2024 as Medicare Advantage enrollment overall has grown.

Under this approach, employers and unions contract with a Medicare Advantage private insurer to provide all Medicare-covered benefits as well as any supplemental benefits for their Medicare-eligible retirees (and spouses). The employer (or union) and/or private insurer (acting on behalf of an employer) receives a payment from the federal government (Medicare) and agrees to cover all Medicare-covered benefits, along with a package of supplemental benefits for retirees in their group. Payments are based on the bids of other Medicare Advantage plans available to individual (non-group) enrollees, and set as a percentage of the area benchmark, adjusted for geography and risk. Employer plans are eligible to receive rebates and bonus payments from Medicare, both of which help cover the costs associated with supplemental benefits for their retirees and contribute to the growth in Medicare spending. Bonus payments for group Medicare Advantage plans accounted for $2.6 billion in spending in 2024.

Slightly more than half (56%) of all large firms (firms with 200 or more workers) that offer retiree health benefits to Medicare-age retirees do so through a Medicare Advantage plan in 2024, more than double the share in 2017 (26%) (Figure 1).

Among Large Firms Offering Retiree Health Benefits to Medicare-Age Retirees in 2024, Slightly More Than Half (56%) Provide These Benefits Through a Contract With a Medicare Advantage Plan, More Than Double the Share in 2017 (26%)

For retirees, the shift to Medicare Advantage can mean similar or better benefits and lower costs but can also mean more limited access to doctors and hospitals in the plan’s network and greater exposure to cost management tools, such as prior authorization, that may limit access to Medicare-covered services. These limitations are, in part, why public sector retirees in New York City sued to stop being moved to a Medicare Advantage plan in 2022 and may explain why a Manhattan Supreme Court Judge prohibited the implementation of this plan.

Among large firms (200 or more workers) offering retiree benefits through a contract with a Medicare Advantage plan, about half (53%) provide at least some retirees no choice but to receive their retiree health benefits through a Medicare Advantage plan in 2024 (Figure 2).

Among Large Firms Offering Retiree Benefits Through a Contract with a Medicare Advantage plan in 2024, About Half (53%) of These Firms Offer Retirees No Choice But to Receive Their Retiree Health Benefits Through a Medicare Advantage Plan

Retirees in firms that offer health benefits exclusively through Medicare Advantage plans have the option to enroll in traditional Medicare, but if they do, they may be required to give up retiree benefits in perpetuity. They may or may not be able to purchase a Medigap policy to supplement traditional Medicare, depending on their health condition, since most states do not have guaranteed issue protections for Medigap.

Among large firms (200 or more workers) offering retiree benefits through a contract with a Medicare Advantage plans, 56% believe that the shift to offering Medicare Advantage plans lowered their per retiree costs.

Among Large Firms Offering Retiree Benefits Through a Contract With a Medicare Advantage Plan, Slightly More Than Half (56%) of Firms Believe the Shift to Medicare Advantage Lowered the Cost Per Retiree

Further, 11% of large firms said the shift to Medicare Advantage plans did not lower their per retiree costs, while 33% did not know the answer.

More than half of all large employers offering Medicare Advantage to their retirees say the shift to Medicare Advantage plans lowered their per retiree costs, which may be a strategy to maintain benefits for their retirees, rather than terminate or scale back coverage. For example, in 2022, the state of Connecticut estimated the state would save $400 million over the following three years by switching retirees to a different Medicare Advantage administrator. Similarly, in 2023, New York City estimated that it would save $600 million annually by switching its city retirees to Medicare Advantage.

However, the rising number of Medicare-eligible retirees into Medicare Advantage plans has implications for Medicare spending because Medicare pays more for enrollees in Medicare Advantage plans (including for group plans) than it pays for similar people in traditional Medicare, which contributes to higher Medicare spending that ultimately affects the solvency of the Medicare Trust Fund and higher Medicare premiums paid by all beneficiaries, raising questions as to whether employers are limiting their liability for retiree health benefits at the expense of the Medicare program.

Among large firms (200 or more workers) offering retiree health benefits but do not offer benefits through a Medicare Advantage plan in 2024, 6% are very likely or somewhat likely to do so in the next two years.

Among Large Firms Offering Retiree Health Benefits That Do Not Offer Benefits Through a Medicare Advantage Plan in 2024, Only a Small Share of Firms (6%) Are Very Likely or Somewhat Likely to Do So in the Next Two Years

In contrast, 73% of firms say they were somewhat unlikely or very unlikely to offer retiree benefits through a Medicare Advantage plan in the next two years, while 21% of firms said they do not know whether they are likely to do so.

This work was supported in part by Arnold Ventures. KFF maintains full editorial control over all of its policy analysis, polling, and journalism activities.

Methods

This analysis uses data from the KFF 2024 Employer Health Benefits Survey, published in October 2024 and fielded from January to July 2024. This survey asks retiree health benefits questions only of large firms offering health benefits to active worker (200 or more workers). The survey does not include information about union-administered benefits. For additional information, see Survey Designs and Methods.

The U.S. Government and Global Tuberculosis Efforts

Published: Nov 18, 2024

This fact sheet does not reflect recent changes that have been implemented by the Trump administration, including a foreign aid review and restructuring. For more information, see KFF’s Overview of President Trump’s Executive Actions on Global Health.

Key Facts

  • Tuberculosis, an infectious disease caused by bacteria, is the leading cause of death from a single infectious agent worldwide, despite being preventable and often curable. Since the World Health Organization declared tuberculosis (TB) to be a global health emergency in 1993, global efforts to address TB have become more prominent, and worldwide TB incidence and mortality rates have fallen. Still, in 2023, there were an estimated 10.8 million new cases of TB globally, including 662,000 new cases in people living with HIV, and an estimated 1.25 million people died from TB, including an estimated 161,000 people who were HIV-positive.
  • In response to the persistent challenges related to TB, including drug-resistant TB, the U.N. General Assembly has held two high-level meetings on TB – in 2018 and 2023 – to discuss these challenges and examine progress toward global goals, including ending the epidemic by 2030.
  • U.S. government (U.S.) involvement in global TB efforts was relatively limited until the late 1990s. Since that time, its efforts to address TB have grown, and now the U.S. is one of the largest donors to global TB control.
  • U.S. TB activities reach approximately 50 countries (including at least 20 of the 30 high burden countries where most new cases are occurring), and focus on preventing, detecting, and treating TB, including drug-resistant TB, as well as research and development.
  • U.S. funding for global TB efforts was $406 million in FY 2024, up from $242 million in FY 2015. Additionally, the U.S. is the largest donor to the Global Fund to Fight AIDS, Tuberculosis and Malaria (Global Fund), which has approved over $11 billion in funding for TB programs worldwide.

Global Situation1 

Tuberculosis, an infectious disease caused by bacteria, is the leading cause of death from a single infectious agent worldwide, despite being preventable and often curable. Approximately a quarter of the world’s population has “latent” TB, meaning they have been infected by TB bacteria but are not yet ill with the disease and cannot transmit it (see box below); about 5-10% of people infected with TB will, at some point during their lifetime, develop symptoms of “active” TB, which can be spread to others. When a person with active TB coughs, sneezes, or spits, the bacteria spreads into the air where it may be inhaled by and infect others. TB is found all over the world, though the vast majority of TB cases are concentrated in a handful of countries in Southeast Asia, Africa, and the Western Pacific region. People in resource-poor settings, especially those living in poverty or in crowded living conditions with poor ventilation (e.g., prisons or mines), are disproportionately affected.

Tuberculosis (TB): A bacterial infection caused by Mycobacterium tuberculosis. Not all people who become infected with TB will develop symptoms. Those who do not become ill are referred to as having “latent TB” and cannot spread the infection to others, while those who become ill with “active TB disease” have symptoms like coughing (sometime with sputum or blood), chest pains, weakness, weight loss, fever, and night sweats. The disease usually affects the lungs, but in serious cases, it can affect other parts of the body and, if not treated properly, can be fatal.

In the 1990s and early 2000s, concern about rising incidence in some areas, new outbreaks, TB/HIV co-infection, and the emergence of TB drug resistance prompted key global health actors and governments, including the U.S. government, to make preserving and advancing the progress of global efforts against TB a priority.2  In 1993, WHO declared TB to be a global health emergency. Since then, global efforts to address TB have become more prominent, and global TB incidence and mortality rates have fallen overall. Still, significant challenges remain, as TB returned to being the world’s leading cause of death from a single infectious agent in 2023 (following a 3-year hiatus during which COVID-19 displaced it). It is also the leading cause of death in people living with HIV and a major cause of death related to antimicrobial resistance (i.e., drug resistance). The second U.N. high-level meeting on TB, held in 2023, reviewed progress toward ending TB and set new targets for achievement by 2027 after targets set during the first U.N. high-level meeting, held in 2018, were not achieved.3 

Morbidity and Mortality4 

  • In 2023, there were 10.8 million new cases (i.e., incident cases) of people who developed active TB disease. Although active TB is treatable and curable in most cases,5  an estimated 1.25 million people died from TB in 2023, including an estimated 161,000 people who were HIV-positive. Globally, between 2015 and 2023, TB incidence fell by 8.3% and TB-related deaths fell by 23%.6  While progress has been made, these reductions fall short of global targets (see Global Goals), and detecting TB cases — and then linking diagnosed cases to treatment — remains a significant challenge, one that had been made even more complicated in the context of COVID-19. The pandemic disrupted TB case detection and treatment services and resulted in an increase in the number of people with undiagnosed and untreated TB, as well as increased transmission and mortality.
  • People who suffer from other conditions that impair the immune system (e.g., HIV) are at a higher risk of developing active TB, as are people who use tobacco. TB and HIV are frequently referred to as co-epidemics (or dual epidemics) due to their high rate of co-infection. TB is the leading cause of death among people living with HIV, especially in developing countries. In 2023, among the 10.8 million new active TB cases, about 6% were people who were also HIV-positive, and of the 1.25 million people who died from TB, about 13% were HIV-positive.
  • Drug-resistant TB has emerged as a major challenge to global TB control efforts. Cases that fail to respond to standard first-line drugs are known as multidrug-resistant TB (MDR-TB), while those that fail to respond to both first- and second-line drugs are known as extensively drug-resistant TB (XDR-TB).7  In 2023, an estimated 400,000 people developed MDR-TB or resistance to rifampicin (RR-TB), the most effective first-line drug.8  MDR/RR-TB has been reported in most countries, with 30 countries identified as having a high burden of MDR/RR-TB specifically and five countries — India, Russia, Indonesia, China, and the Philippines — accounting for over half of the global number of people who developed MDR/RR-TB in 2023.

Interventions

The End TB Strategy, the internationally-recognized strategy for ending the TB epidemic, outlines interventions aimed at decreasing TB-related morbidity, death, and transmission. They include:

  • early diagnosis of TB via sputum-smear microscopy,
  • treatment (usually a six-month course of antibiotics for drug-sensitive TB) and patient support for all people with TB,
  • scaled-up diagnosis and management of MDR- and XDR-TB,
  • systematic screening for and management of TB among people living with HIV and others in high-risk groups,
  • preventive treatment, including TB preventive treatment (TPT) and vaccination9  for high-risk groups, and
  • research and development (R&D) of new tools (e.g., new TB diagnostics, drugs, and vaccines) and improved approaches.

Other interventions include the development of policies and systems that support TB activities, such as improved standardized data collection, quality assurance and rational use of drugs, and monitoring and evaluation of outcomes; sustained political and financial commitment to TB efforts; health systems strengthening; and increased health workforce capacity to respond to TB.

Global Goals

Since the 1993 declaration of TB as a global health emergency by WHO, major global TB goals have most recently been set through the following:

  • Adopted in 2015, the Sustainable Development Goals (SDGs) aim to end the TB epidemic by 2030 under SDG Goal 3, which is to “ensure healthy lives and promote well-being for all at all ages.”
  • Endorsed by governments at the 2014 World Health Assembly, the End TB Strategy set an overarching goal of ending the global TB epidemic as well as targets for achieving, by 2035, a 95% reduction in TB deaths and a 90% reduction in TB incidence (compared with 2015 levels).10  It builds on the earlier 2006 international Stop TB Strategy, in which WHO outlined the goal of eliminating TB as a public health problem by 2050.11  The Global Plan to End TB outlines the steps and resources needed to achieve the End TB Strategy’s goals and is periodically updated by the Stop TB Partnership (an international network of public and private entities working to eliminate TB).
  • In 2018, the U.N. General Assembly held its first-ever high-level meeting (HLM) on TB, where world leaders adopted a new Political Declaration that reaffirmed global TB commitments. The Political Declaration also articulated commitments on TB research and innovation, and a framework to help countries implement these commitments – the Global Strategy for Tuberculosis Research and Innovation – was adopted by governments at the 2020 World Health Assembly. The second U.N. HLM on TB took place in September 2023, reviewing progress since the first HLM and setting new targets for achievement by 2027.12 

U.S. Government Efforts

U.S. involvement in global TB efforts was relatively limited until the late 1990s. Since that time, its efforts to address TB have grown, and now the U.S. is one of the largest donors to global TB control.13 

History and Goals14 

In 1998, the U.S. Agency for International Development (USAID) began a global TB control program, and over the following decade, the U.S. assigned a heightened priority to and provided greater funding for bilateral and multilateral TB efforts.

The passage of the legislation that launched the President’s Emergency Plan for AIDS Relief (PEPFAR) in 2003 placed a heightened priority on U.S. global TB efforts that continues to this day. The U.S. Leadership Against HIV/AIDS, Tuberculosis, and Malaria Act of 2003 (the legislation that created PEPFAR) included TB under its umbrella, authorizing five years of funding for bilateral TB efforts and the Global Fund to Fight AIDS, Tuberculosis and Malaria (an independent, international financing institution created in 2001 that provides grants to countries to address TB, HIV, and malaria). The Lantos-Hyde U.S. Global Leadership Against HIV/AIDS, Tuberculosis, and Malaria Reauthorization Act of 2008, which reauthorized PEPFAR, set targets for U.S. bilateral TB efforts and authorized another five years of funding. Subsequent reauthorizations of PEPFAR – under the 2013 PEPFAR Stewardship Act, 2018 PEPFAR Extension Act, and 2024 short-term reauthorization of PEPFAR (“Extension of Certain Requirements of PEPFAR“) – did not specify authorization for funding for TB (however, Congress effectively authorizes funding when it appropriates funding for a purpose) (See the KFF fact sheet on PEPFAR, the KFF fact sheet on the Global Fund, and the KFF brief on PEPFAR reauthorization.)

In 2022, USAID released its eight-year Global Tuberculosis (TB) Strategy 2023-2030, which outlines current U.S. global TB goals.15  These goals include, by 2030, to contribute to:

  • a 35% reduction in TB incidence relative to a 2019 baseline,
  • a 52% reduction in TB mortality relative to a 2019 baseline,
  • diagnosing and initiating treatment on 90% of incident (new cases of) TB and drug-resistant TB,
  • maintaining treatment success rates of 90% for individuals with drug-sensitive TB and drug-resistant TB, and
  • providing TB preventive treatment (TPT) to 30 million people.

These goals overlap with and reaffirm the U.S. commitment to the WHO End TB Strategy 2030 targets and SDG goal for TB.

The U.S. has also placed a heightened emphasis on addressing antimicrobial resistance.16  At the first U.N. TB HLM in 2018, the National Institutes of Health (NIH) released the Strategic Plan for Tuberculosis Research, which aims to accelerate its TB research including MDR-TB research; it was recently updated in 2024. In addition in 2020, the U.S. released its updated National Action Plan for Combating Antibiotic-Resistant Tuberculosis, which identifies interventions and articulates a strategy to respond to the domestic and global challenges of MDR-TB from 2020 through 2025.17 

Organization

The U.S. Agency for International Development (USAID) serves as the lead implementing agency for U.S. global TB efforts, with other agencies also carrying out TB activities. Collectively, these efforts reach approximately 50 countries, including at least 20 of the 30 high burden countries (HBCs, which are designated by WHO as having high numbers of TB cases and collectively account for approximately 87% of new TB cases globally).18  All U.S. global TB efforts are coordinated under the international working group of the Federal Tuberculosis Task Force (a coalition of federal agencies involved in U.S. global and domestic TB efforts).

USAID TB Program

USAID’s bilateral TB program aims to support specific country needs19  in its 24 priority countries (which are mainly in sub-Saharan Africa, South Asia, and Southeast Asia) and to focus on key interventions, including:

  • accelerated detection and treatment of TB for all patients,
  • scaled up prevention and treatment of MDR-TB,
  • expanded coverage of interventions for TB-HIV co-infection (in coordination with U.S. HIV efforts under PEPFAR; see below20 ),
  • improvements in the TB service delivery platforms and overall health system, and
  • support for accelerated research and innovation.

The agency reported that in USAID TB priority countries, TB-related mortality decreased by 9% in 2023 compared to 2019, representing the second year in a row that mortality decreased below pre-pandemic levels.21 

Other U.S. TB Efforts

The U.S. also supports TB activities through several other agencies, including:

  • the Centers for Disease Control and Prevention (CDC), which provides technical support on epidemiology and surveillance, laboratory strengthening, and clinical and program operations, and also supports clinical and operational research;
  • NIH, which, as the leading funder of TB research and development (R&D), supports basic, applied, and clinical R&D of new drugs, vaccines, and diagnostics;
  • the State Department’s Bureau of Global Health Security and Diplomacy, which leads U.S. efforts to address TB-HIV co-infection through PEPFAR; and
  • the Department of Defense (DoD), whose overseas laboratories help to monitor the quality of TB diagnostic services and conduct operational research.

Multilateral Efforts

The U.S. partners with international institutions and supports global TB funding mechanisms. Key partners include WHO and the Stop TB Partnership. Additionally, the U.S. government is the largest donor to the Global Fund, which has approved over $11 billion in funding for TB programs worldwide, and one of the largest donors to the Global Drug Facility (a mechanism of the Stop TB Partnership that provides grants to countries for TB drugs).22 

Funding23 

U.S. funding for global TB has grown over the past decade, with much of the increase occurring in more recent years; U.S. funding for TB rose from $242 million in FY 2015 to $406 million in FY 2024 (see figure for the latest information).24  Additional U.S. support for TB activities is provided through its contribution to the Global Fund. (See the KFF fact sheet on the U.S. Global Health Budget: Tuberculosis and the KFF budget tracker for more details on historical appropriations for global TB.)

Most U.S. bilateral funding for TB is provided through the Global Health Programs account at USAID with additional funding provided through the Economic Support Fund account, as well as funding through CDC.25  It includes U.S. contributions to the Global Drug Facility.26 

U.S. Funding for Global Tuberculosis (TB), FY 2016 - FY 2025
  1. WHO, “Tuberculosis,” fact sheet, Oct. 2024; WHO, Global TB Report 2024, 2024; USAID, Renewing Global Efforts to End TB: Tuberculosis Report to Congress, FY 2023, Jan. 2024. ↩︎
  2. WHO, “Global Tuberculosis Programme,” World Health Assembly Resolution 44.8, 1991; WHO, WHO Report on the Global TB Epidemic 1998, 1998; WHO, “Tuberculosis,” fact sheet, August 2002; TB Alert, “TB Timeline,” webpage, http://www.tbalert.org/about-tb/tb-in-time/tb-timeline/. ↩︎
  3. Global targets set at the first U.N. high-level meeting (HLM) on TB, for achievement between 2018-2022, include treatment and preventative treatment targets, as well as annual funding targets for TB research and universal access to TB services. The world fell short on all but one (preventative treatment for people living with HIV) of these targets. The new targets set at the second HLM include coverage targets for treatment, preventative treatment, rapid diagnostic testing, and health and social benefits; the rollout of safe and effective TB vaccines; and annual funding targets for TB research and universal access to TB services, all to be achieved between 2023-2027. ↩︎
  4. WHO, Global Tuberculosis Report 2024, 2024; WHO, “Tuberculosis,” fact sheet, Oct. 2024. ↩︎
  5. Treatment in most cases is usually a six-month course of antibiotics. ↩︎
  6. Globally, between 2010 and 2020, TB incidence fell by approximately 2% per year but then increased by 4.6% between 2020 and 2023 due to impacts of the COVID-19 pandemic. Increases in incidence may be due to increases in the number of people having undiagnosed and untreated TB (due to COVID-related service disruptions) and the subsequent development of disease among those newly infected. ↩︎
  7. Treatment options for these forms of TB are very limited. ↩︎
  8. That is, people with MDR-TB have a combined resistance to rifampicin and isoniazid (another key first-line TB drug). ↩︎
  9. No effective vaccine currently exists to prevent transmission of TB. The BCG (Bacillus Calmette-Guérin) vaccine is partially effective in preventing some serious TB complications in children and is recommended by WHO as a component of routine childhood immunization in countries with a high TB burden. ↩︎
  10. This means the incidence rate will be an average of less than 10 TB cases per 100,000 population. WHO: “Post-2015 Global TB Strategy and targets,” fact sheet, Dec. 2014; “Implementing the End TB Strategy: The Essentials, 2022” Dec. 2022, https://www.who.int/publications/i/item/9789240065093 ↩︎
  11. This means that “the global incidence of TB disease will be less than 1 case per million population per year.” ↩︎
  12. Global targets set at the first U.N. high-level meeting (HLM) on TB, for achievement between 2018-2022, include treatment and preventative treatment targets, as well as annual funding targets for TB research and universal access to TB services. The world fell short on all but one (preventative treatment for people living with HIV) of these targets. The new targets set at the second HLM include coverage targets for treatment, preventative treatment, rapid diagnostic testing, and health and social benefits; the rollout of safe and effective TB vaccines; and annual funding targets for TB research and universal access to TB services, all to be achieved between 2023-2027. ↩︎
  13. KFF analysis of OECD DAC CRS database, October 2024. ↩︎
  14. USAID: USAID, Expanded Response to TB, Sept. 2004 and updated Jan. 2009; USAID, Fast Facts: Tuberculosis, Oct. 2010. ↩︎
  15. This succeeds the prior five-year USG Global TB Strategy 2015-2022 and five-year Lantos-Hyde USG TB Strategy (March 2010). ↩︎
  16. In 2014, the White House announced the National Strategy for Combating Antibiotic-Resistant Bacteria (CARB) and issued an executive order directing the U.S. government to “work domestically and internationally to reduce the emergence and spread of antibiotic-resistant bacteria.” USAID, “Antimicrobial Resistance and the Threat of Multidrug-Resistant TB,” webpage, https://2012-2017.usaid.gov/what-we-do/global-health/tuberculosis/antimicrobial-resistance-and-threat-multidrug-resistant-tb; White House, Executive Order – Combating Antibiotic-Resistant Bacteria, 2014. See also: USG, National Strategy for Combating Antibiotic-Resistant Bacteria, 2014, https://www.cdc.gov/drugresistance/pdf/carb_national_strategy.pdf; White House, “Fact sheet: Obama Administration Releases National Action Plan to Combat Antibiotic-Resistant Bacteria, 2015, https://obamawhitehouse.archives.gov/the-press-office/2015/03/27/fact-sheet-obama-administration-releases-national-action-plan-combat-ant. ↩︎
  17. The National Action Plan for Combating Multidrug-Resistant Tuberculosis was first released in 2015 and then updated in 2020 to reflect its 2020-2025 strategy. ↩︎
  18. USAID and CDC’s TB efforts together reach approximately 50 countries, including those reached through regional efforts as well as PEPFAR-supported TB/HIV efforts. USAID, USAID’s Global Tuberculosis (TB) Strategy 2023–2030, 2022; USAID, Tuberculosis Report to Congress FY 2023, January 2024; USAID, “Tuberculosis: Countries,” webpage, accessed October 2024, https://www.usaid.gov/global-health/health-areas/tuberculosis/countries; CDC, “Global HIV & TB: Where We Work,” webpage, updated June 10, 2024, https://www.cdc.gov/global-hiv-tb/php/where-we-work/index.html; WHO, Global Tuberculosis Report 2024, 2024; WHO, “Tuberculosis,” fact sheet, Oct. 2024. ↩︎
  19. As outlined in a partner country’s national TB strategic plan, per the current and prior USG global TB strategies. ↩︎
  20. In 2023, as part of the U.S. commitment toward achieving the U.N. High Level Meeting 2027 target to detect and treat TB among 90% of those who develop TB, PEPFAR launched an effort to detect 2 million active TB cases over the next five years and prevent at least 500,000 TB-related deaths among people living with HIV. PEPFAR, Press release: PEPFAR Launches New Effort to Fight TB: Goal to Detect Two Million Cases and Prevent 500,000 Deaths, September 2023. ↩︎
  21. At the same time, TB incidence increased by 8 percent in 2023 compared to 2019 (though the rate of this increase has been slowing); USAID reports this increase is indicative of the residual impact of continuing to identify people with TB who were missed during the pandemic. ↩︎
  22. Global Fund: “Data Explorer,” accessed October 2024,https://data.theglobalfund.org/ ↩︎
  23. KFF analysis of data from the Office of Management and Budget, Agency Congressional Budget Justifications, Congressional Appropriations Bills, and U.S. Foreign Assistance Dashboard website, ForeignAssistance.gov. ↩︎
  24. FY24 is based on funding provided in the “Further Consolidated Appropriations Act, 2024” (P.L. 118-47) and is a preliminary estimate. ↩︎
  25. Represents specified funding for international TB programs in the President’s budget request, ForeignAssistance.gov, and Congressional appropriations bills. Additional support for international TB programs is provided through bilateral HIV programs at the State Department to address TB/HIV co-infection, for technical support and research activities through the CDC, and for research activities at the NIH. Prior to FY20, global TB funding at CDC was provided through the “HIV/AIDS, Viral Hepatitis, STI and TB Prevention” funding line; in the FY20 Request, the administration proposed to create a new “Global Tuberculosis” funding line under global health programs at CDC and to transfer $7.2 million from the “HIV/AIDS, Viral Hepatitis, STI and TB Prevention” funding line to “Global Tuberculosis” for both FY18 and FY19. The FY20 appropriations bill formalized this transfer. Funding amounts provided through this transfer are not currently available for the years prior to FY18. ↩︎
  26. Funding for the Global Drug Facility is provided through the Global Health Programs (GHP) account at USAID. ↩︎

Medicare Advantage 2025 Spotlight: A First Look at Plan Offerings

Authors: Meredith Freed, Jeannie Fuglesten Biniek, Anthony Damico, and Tricia Neuman
Published: Nov 15, 2024

Note: This analysis was updated on November 25th to reflect the October version of the 2025 CMS Landscape file.Over the last decade, Medicare Advantage, the private plan alternative to traditional Medicare, has taken on a prominent role in the Medicare program. In 2024, nearly 33 million Medicare beneficiaries are enrolled in a Medicare Advantage plan, more than half, or 54%, of the eligible Medicare population.

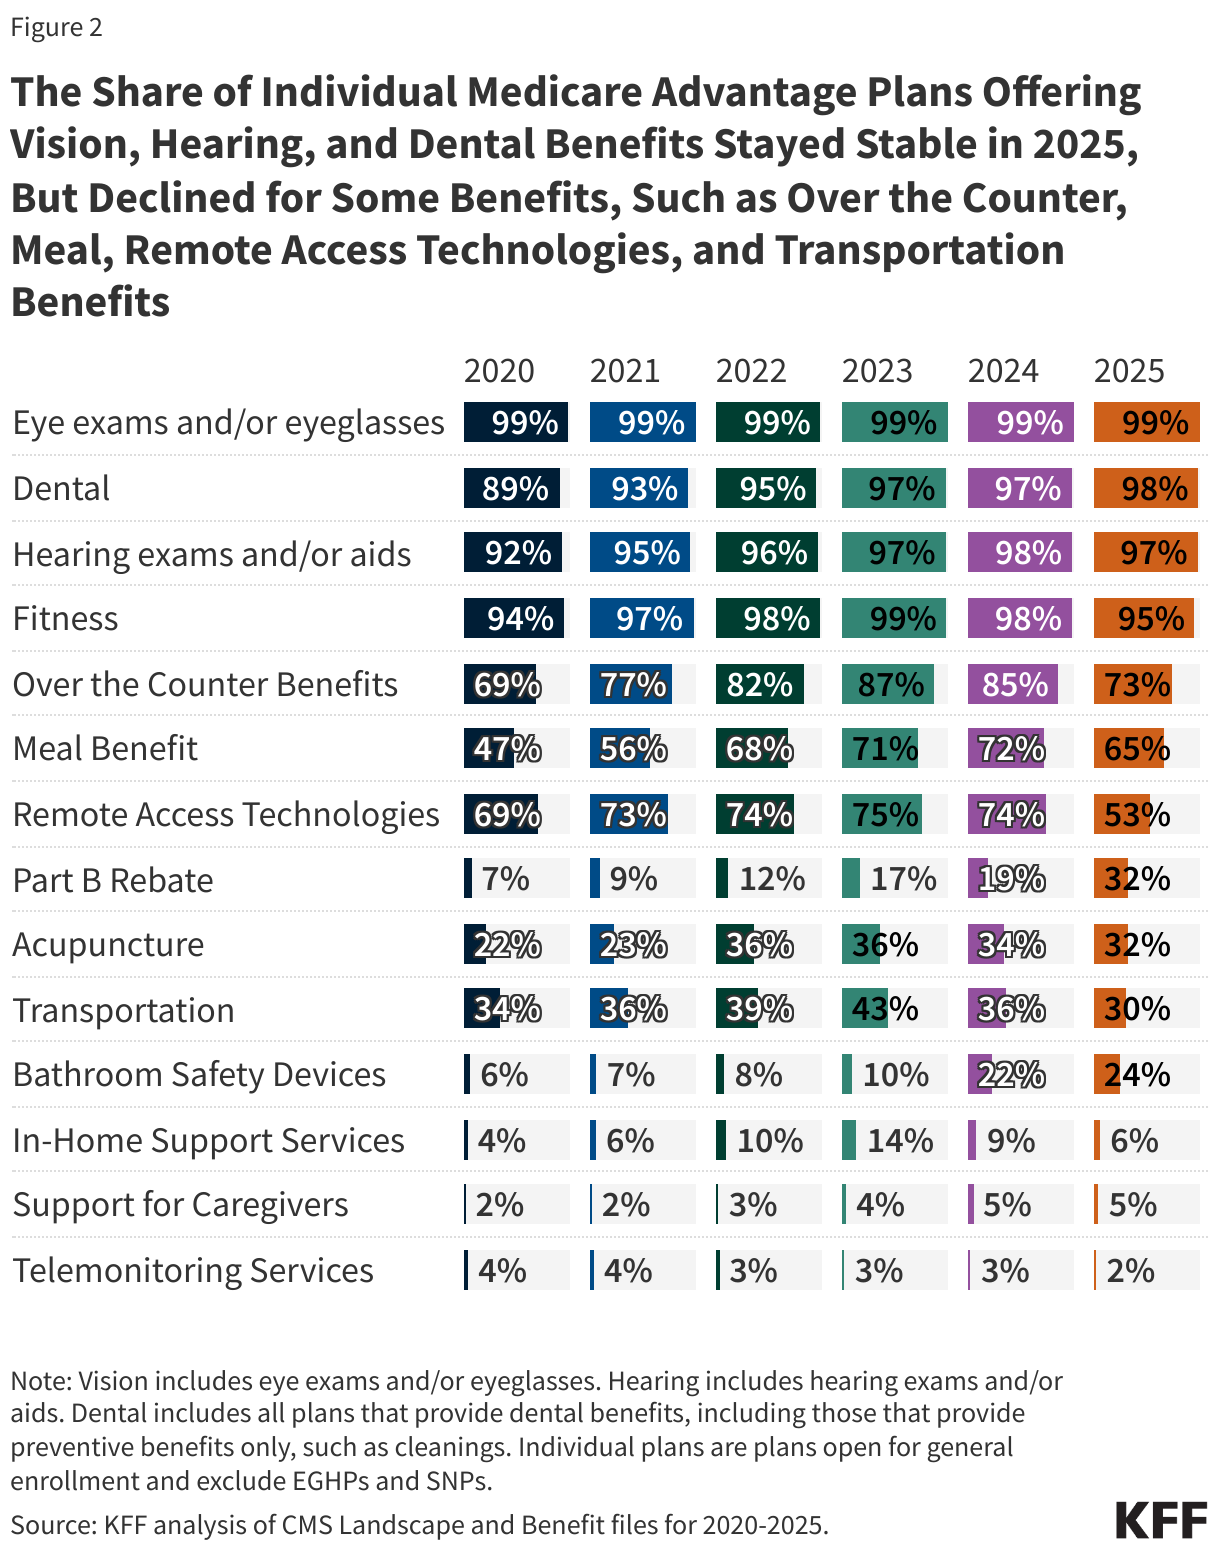
Despite concerns that modifications to the payment formula and higher utilization would impact the number of Medicare Advantage plans offered in 2025, the Medicare Advantage market appears to be relatively stable. While Medicare Advantage insurers have made some adjustments in their offerings, the average Medicare beneficiary has a choice of more than 30 Medicare Advantage prescription drug (MA-PD) plans, and virtually all plans provide multiple extra benefits like vision, hearing and dental benefits, similar to last year.

This brief provides an overview of the Medicare Advantage plans that are available for 2025 and key trends over time. This analysis uses data from the CMS Landscape files. In general, this brief refers to individual Medicare plans available for general enrollment, excludes Special Needs Plans (SNPs), except where noted, and excludes employer plans. (See methods for more details.) A second, companion analysis, describes premiums and benefits that are available for 2025 Medicare Advantage plans and over time.

Medicare Advantage Highlights for 2025

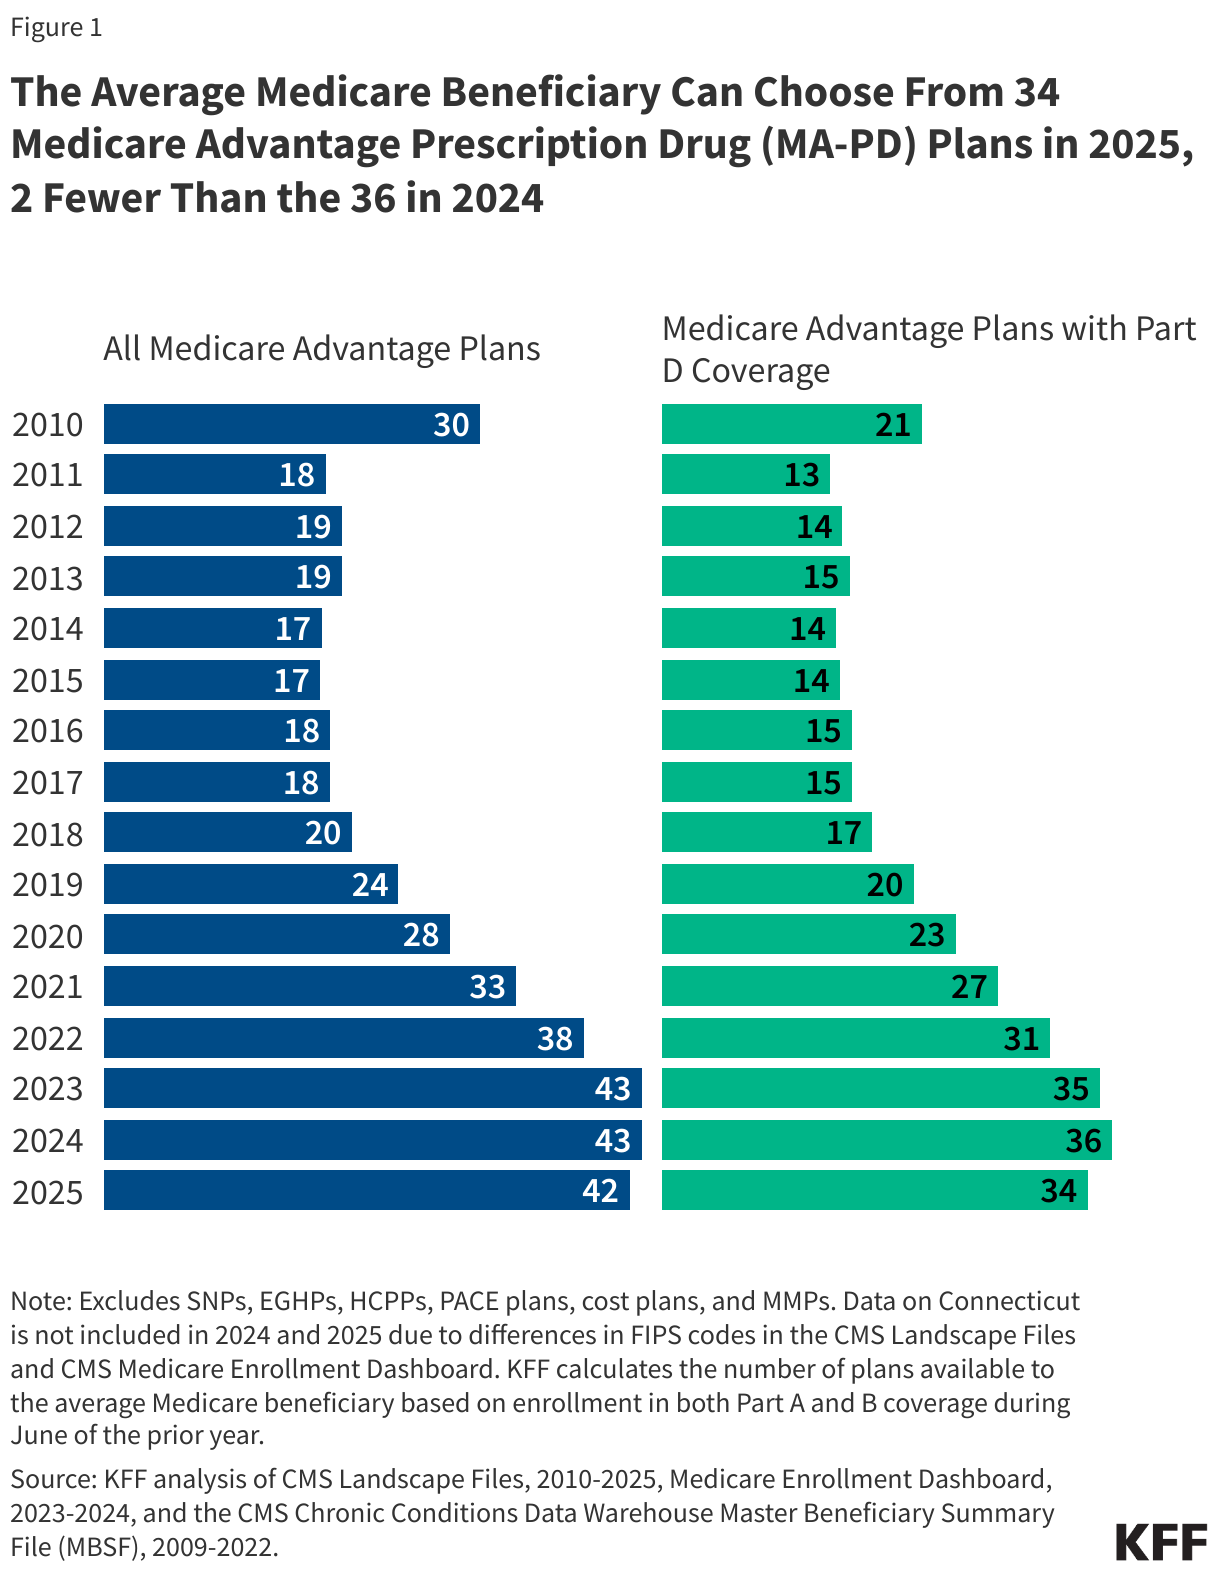
  • The average Medicare beneficiary will have the option of 34 Medicare Advantage prescription drug (MA-PD) plans in 2025, 2 fewer than the 36 options available in 2024. Across all plans for individual enrollment, including those with and without prescription drug coverage, the average beneficiary has 42 options in 2025, compared to 43 options in both 2023 and 2024.
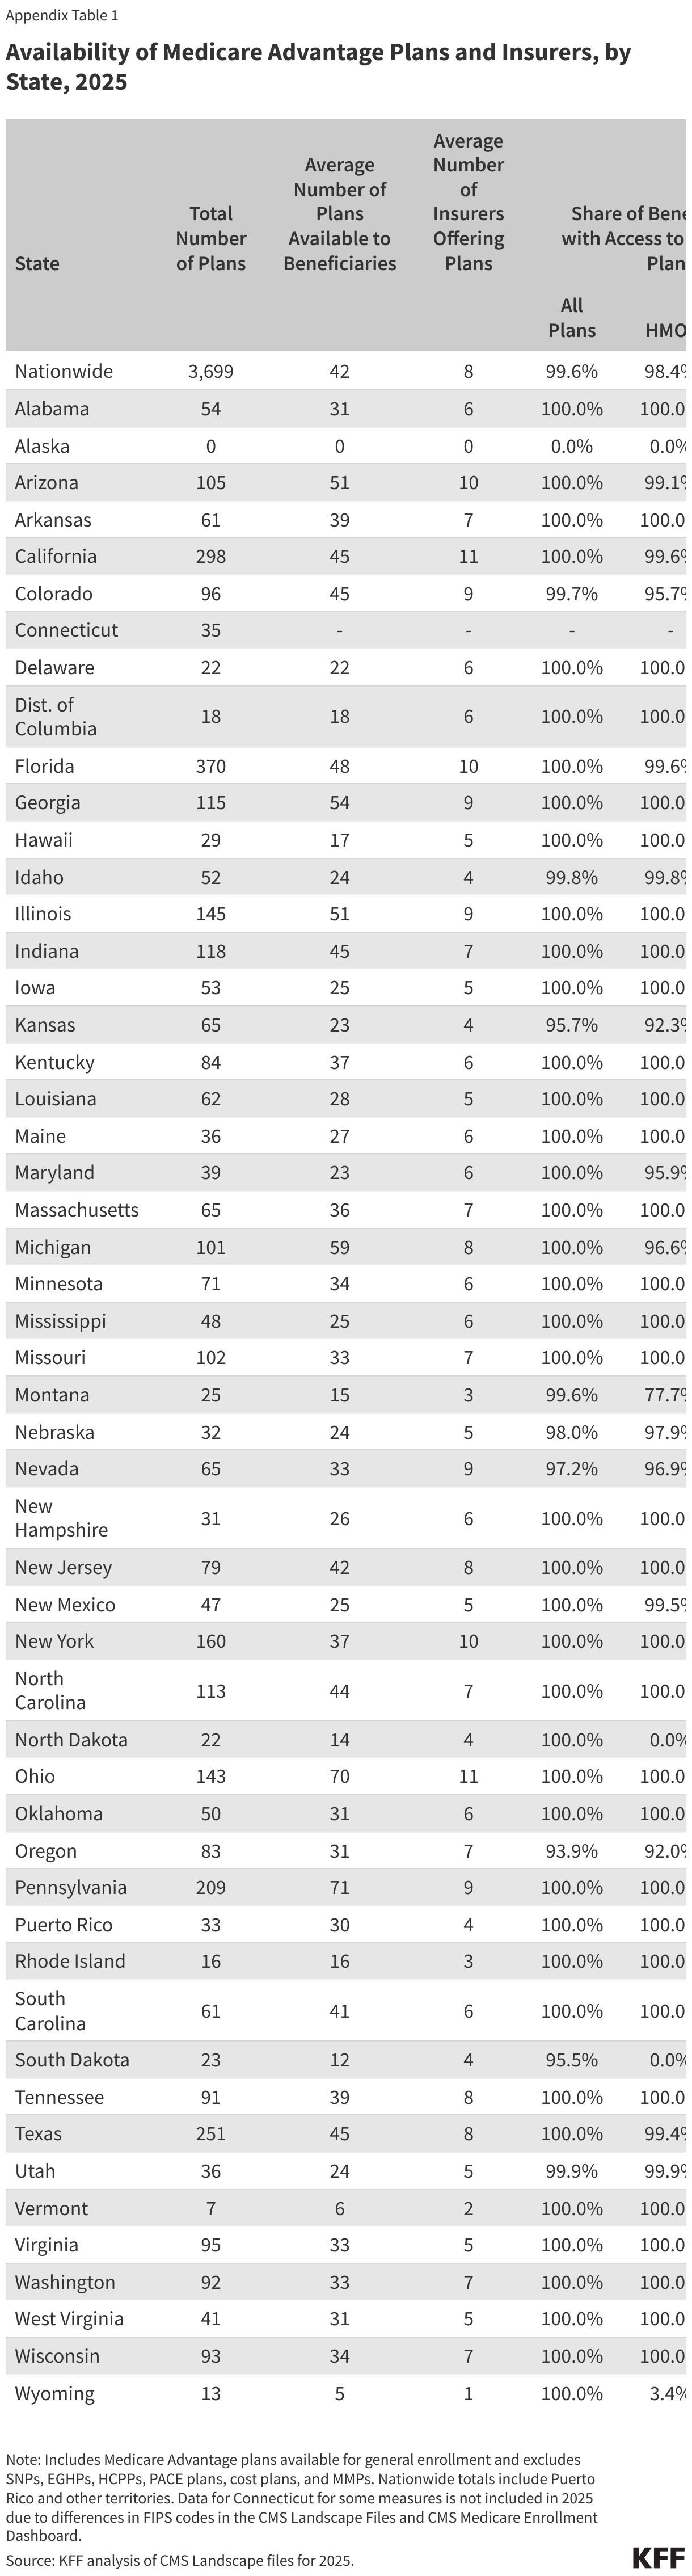
  • The number of plans available to the average beneficiary varies across states. In 27 states and Puerto Rico, the average beneficiary has a choice of fewer plans in 2025 than in 2024, while in 16 states and DC, the average beneficiary has a choice of more plans, and in six states the number of plans available, on average, stayed the same.
  • Nearly one-third of Medicare beneficiaries (32%) live in a county with more than 50 Medicare Advantage plans available in 2025, up from 7 percent in 2020, and similar to 2024 (33%). Less than 0.5 percent live in a county with no plans available.
  • The average Medicare beneficiary can choose among plans offered by 8 firms in 2025, the same as in 2024. Three new insurers entered the Medicare Advantage market in 2025, while eight firms exited the market in 2025.
  • Major insurers are both expanding into new counties and exiting others. For example, Humana is entering 12 new counties and exiting 70 counties, while UnitedHealthcare is entering 42 new counties and exiting 38 counties. Both insurers are offering plans in nearly 90% of all U.S. counties.
  • About 5% of current Medicare Advantage enrollees in individual MA-PDs (or about 1.4 million people) are in a plan that has been terminated for 2025, while up to 7% of enrollees in MA-PDs (or as many as 1.8 million people) may be affected by a consolidation, meaning they are in a plan where some portion of the 2024 enrollment will be automatically assigned to a different plan in 2025.
  • More than half (58%) of Medicare beneficiaries live in a county (1,188) where at least one firm is offering 10 or more plans for individual enrollment.

Plan Offerings in 2025

Number of Plans

Number of Plans Available to Beneficiaries. For 2025, the average Medicare beneficiary will have access to 34 Medicare Advantage prescription drug (MA-PD) plans, just 2 fewer than the 36 in 2024 (Figure 1). Across all plans for individual enrollment, including those with and without prescription drug coverage, the average beneficiary has 42 options in 2025, compared to 43 options in both 2023 and 2024. Since 2018, the number of plans available to the average beneficiary has doubled. These numbers exclude employer- or union-sponsored group plans, Special Needs Plans (SNPs), PACE plans, cost plans, and Medicare-Medicaid plans (MMPs) that are only available to select populations.

The Average Medicare Beneficiary Can Choose From 34 Medicare Advantage Prescription Drug (MA-PD) Plans in 2025, 2 Fewer Than the 36 in 2024

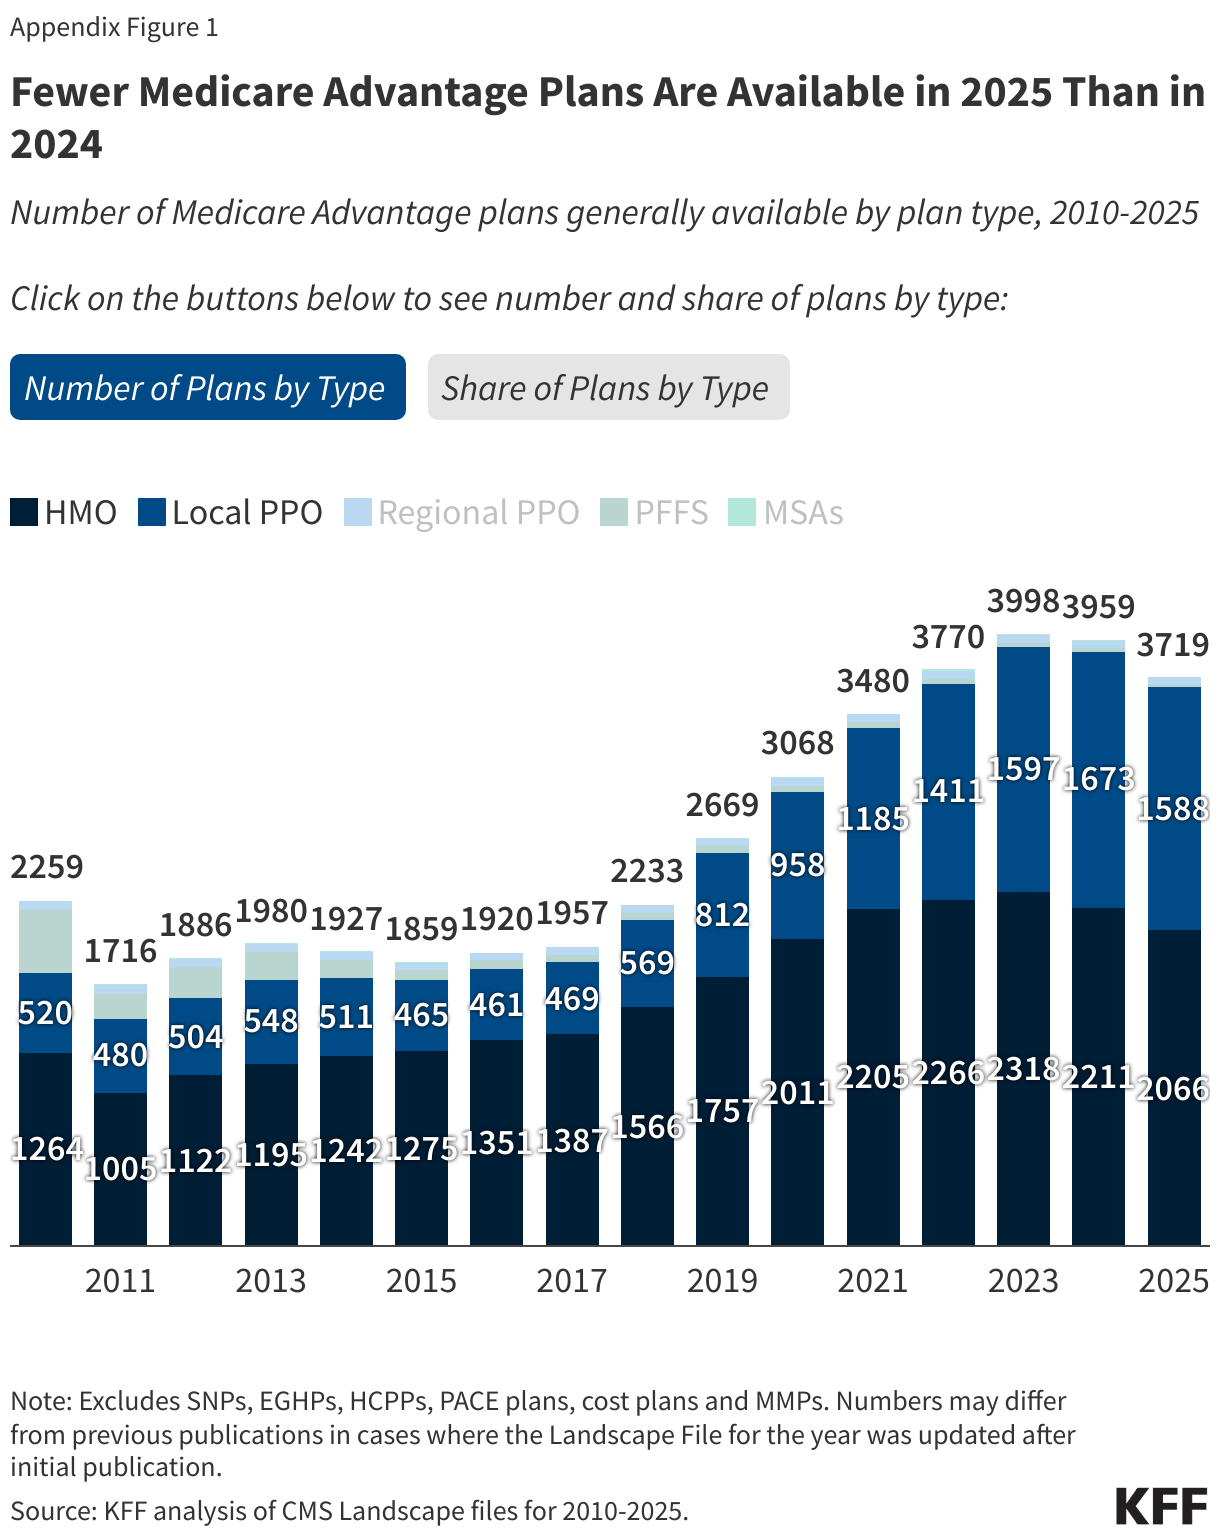
Total Number of Plans. In total, 3,719 Medicare Advantage plans are available nationwide for individual enrollment in 2025 – a 6% decrease from the number of plans (240 fewer plans) offered in 2024 (Appendix Figure 1).

HMOs account for more than half (56%) of all Medicare Advantage plans offered in 2025 but have declined as a share of all Medicare Advantage plans since 2017 (71% of plans), while during this period local PPOs rose as a share of all plans (Appendix Figure 1). During this period, the share of plans that are local PPOs increased from 24% to 43%. The share of plans that are regional PPOs has slowly declined from around 3% of plans offered in 2017 to 1% in 2025.

While many employers and unions also offer Medicare Advantage plans to their retirees, no information about these 2025 plan offerings is made available by CMS to the public during the Medicare open enrollment period. Employer and union plans are administered separately and may have enrollment periods that do not align with the Medicare open enrollment period.

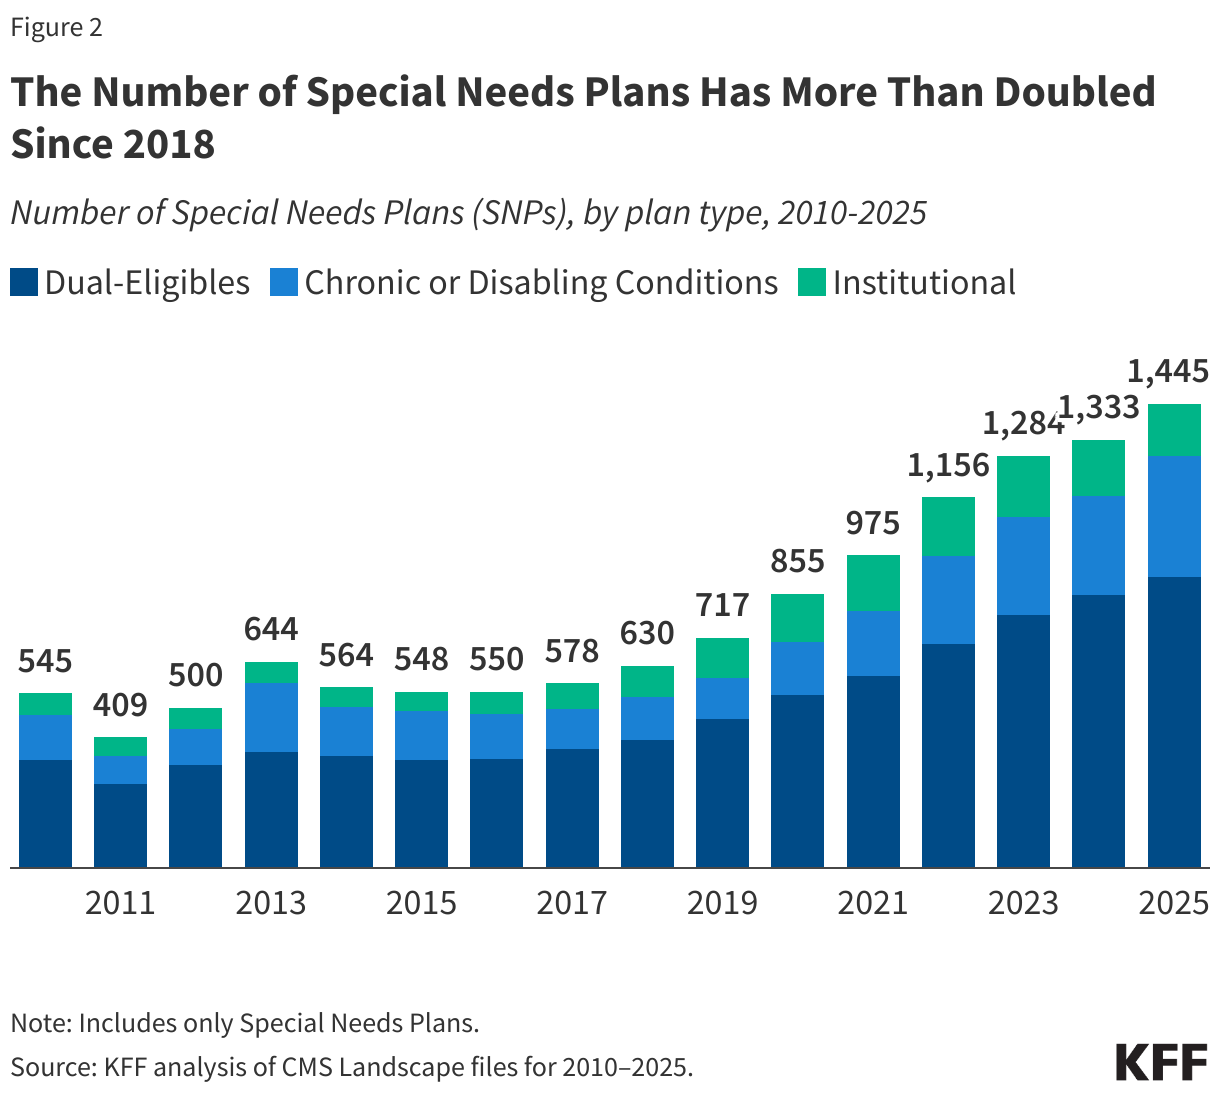
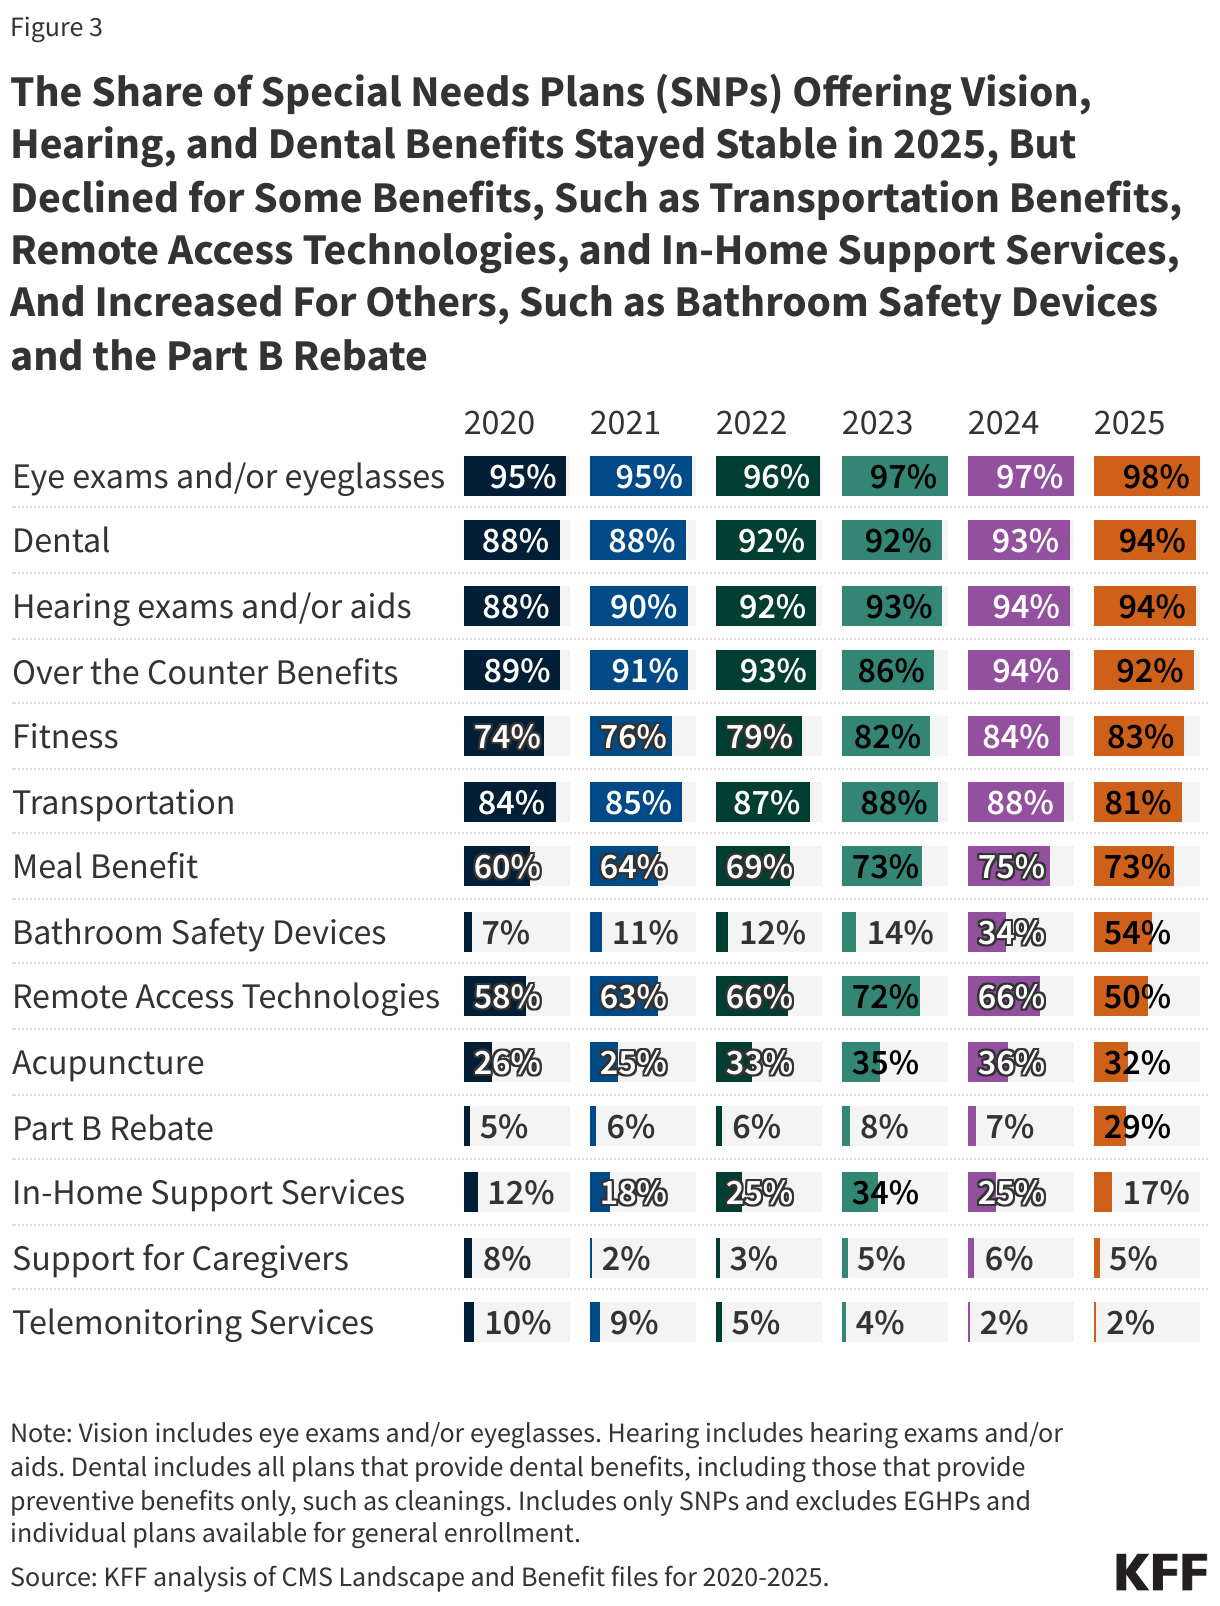
Special Needs Plans (SNPs). In 2025, 1,445 SNPs will be offered nationwide, an 8 percent increase between 2024 and 2025 (Figure 2).

The Number of Special Needs Plans Has More Than Doubled Since 2018

D-SNPs. Nearly two-thirds of SNPs (63%) are designed for people dually eligible for Medicare and Medicaid (D-SNPs). The number of D-SNPs has increased substantially since 2018, increasing from 401 D-SNPs in 2018 to 909 D-SNPs in 2025 (up from 851 D-SNPs in 2024), suggesting insurers continue to be drawn to this high-need population. In 2024, 5.9 million Medicare beneficiaries are enrolled in D-SNPs.

I-SNPs. The number of SNPs for people who require an institutional-level of care (I-SNPs) nearly doubled from 97 plans in 2018 to 189 plans in 2023, before dropping modestly to 173 plans for 2024 and 160 in 2025. In 2024, about 115,000 Medicare beneficiaries are enrolled in I-SNPs.

C-SNPs. The number of SNPs offered for people with chronic conditions (C-SNPs) has nearly tripled since 2018, from 132 plans that year to 376 plans in 2025 (an increase of 67 plans since 2024). Most C-SNPs focus on people with diabetes, heart disease, or lung conditions, as has been the case since the inception of C-SNPs. For 2025, one firm is offering a C-SNP for people with dementia (different than the one firm offering one in 2024). Two firms are offering C-SNPs for people with mental health conditions (compared to no firms in 2024), and one firm is offering a C-SNP for people with HIV/AIDS, the same one as in 2024. Ten firms are offering C-SNPs for people with end-stage renal disease (up two from 2024). In 2024, 675,000 Medicare beneficiaries are enrolled in C-SNPs.

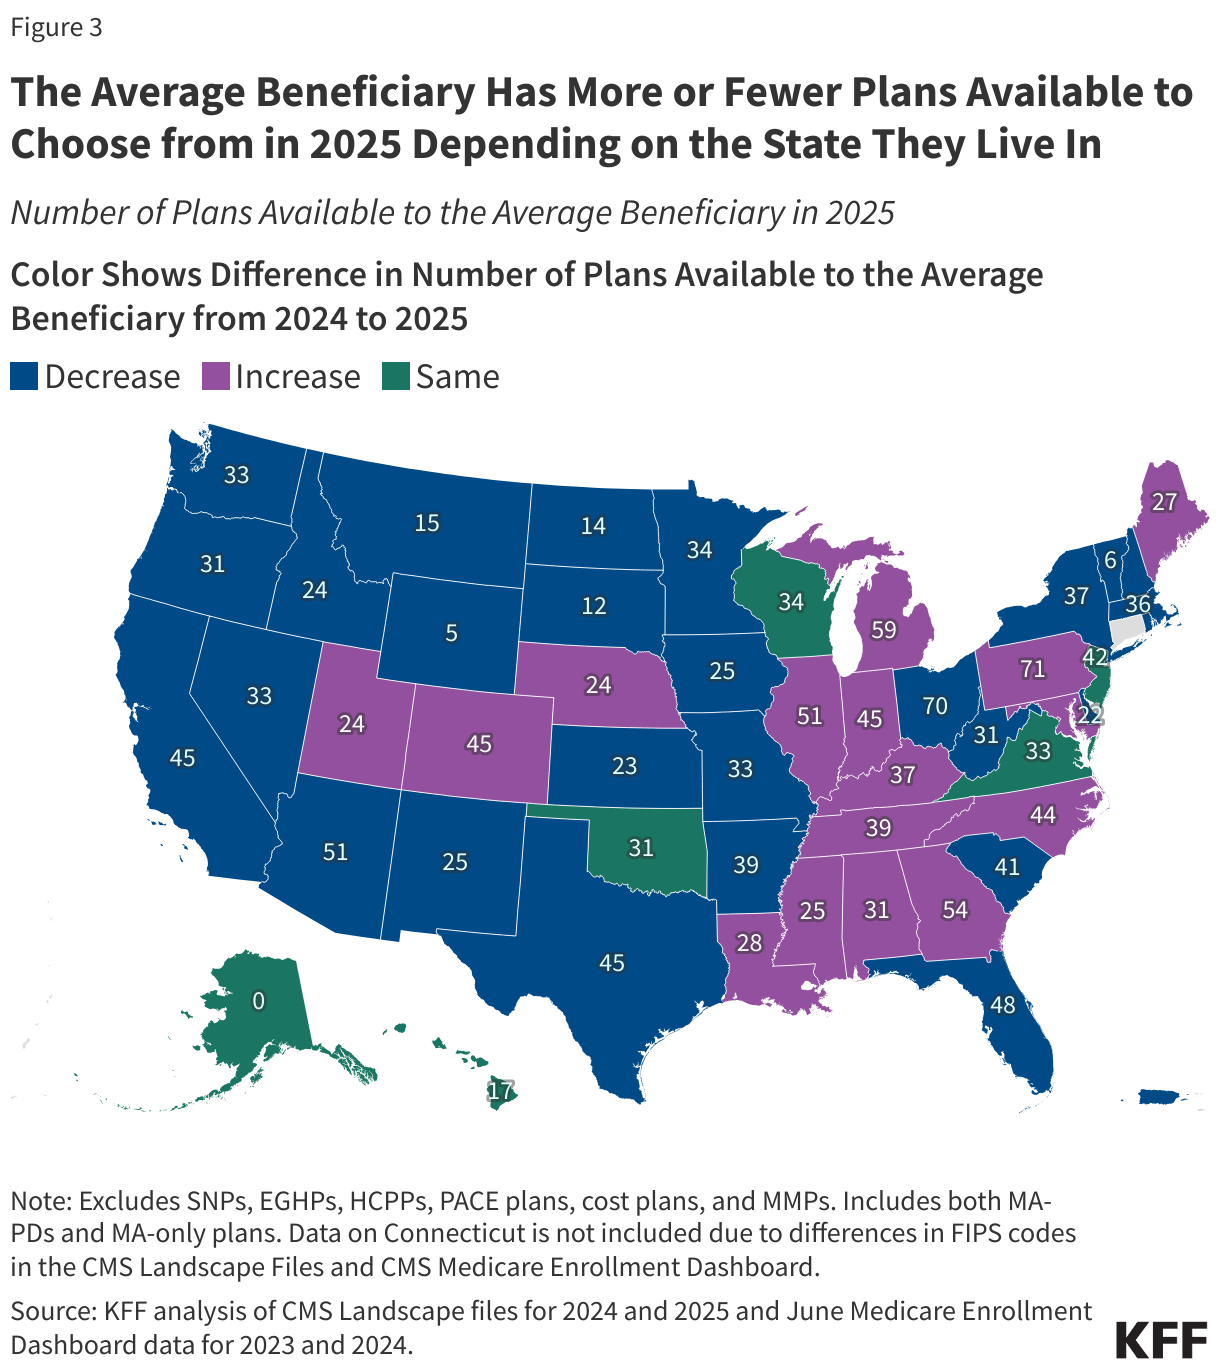
Variation in Medicare Advantage Plans, by State and County. The number of plans available to the average beneficiary varies across states (Figure 3; Appendix Table 1). In 27 states and Puerto Rico, the average beneficiary has a choice of fewer plans in 2025 than in 2024. In 16 states and DC, the average beneficiary has access to more plans in 2025 than in 2024. In the remaining six states, the number of plans available to the average beneficiary stayed the same. This includes Alaska, which had no plans available in 2025, as in 2024. Connecticut is not included in this calculation – see methods for more details.

The Average Beneficiary Has More or Fewer Plans Available to Choose from in 2025 Depending on the State They Live In

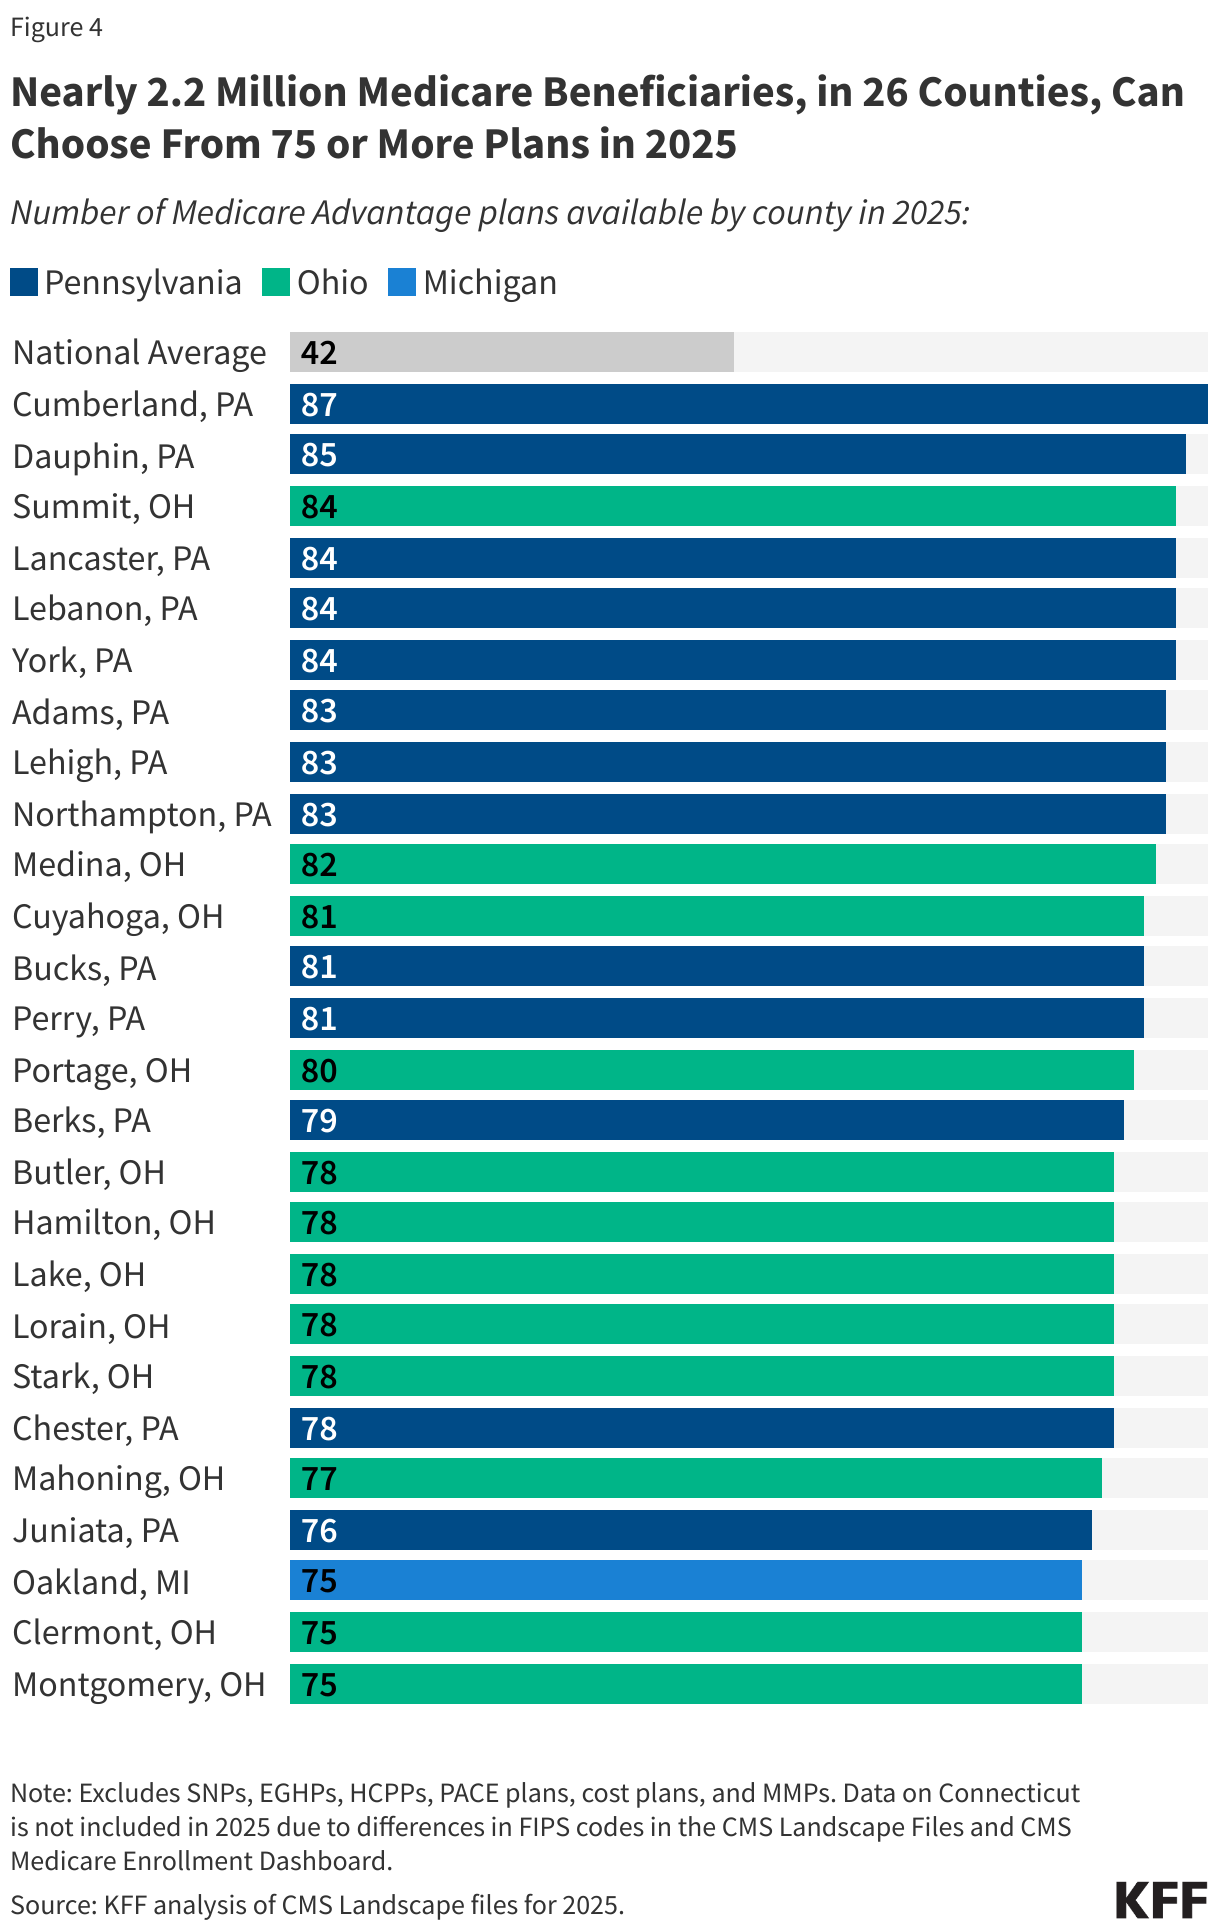
Nearly 2.2 million beneficiaries in 26 counties can choose from 75 or more Medicare Advantage plans in 2025 (down slightly from 29 counties in 2024). In the same 26 counties, beneficiaries can choose from 63 to 73 Medicare Advantage plans with Part D coverage. Similar to the last three years, the counties with the most plan options are predominantly in Pennsylvania and Ohio. In Pennsylvania, for example, beneficiaries can choose from 80 or more Medicare Advantage plans in 10 counties, including Dauphin County (Harrisburg). Beneficiaries in Cumberland, Pennsylvania can choose from 87 Medicare Advantage plans – the most offerings of any county in the U.S. In Ohio, beneficiaries can choose from 80 or more Medicare Advantage plans in 4 counties, including Summit County (Akron) and Cuyahoga County (Cleveland). In Michigan, beneficiaries in Oakland County (Detroit metro area) can choose from 75 plans (Figure 4).

Nearly 2.2 Million Medicare Beneficiaries, in 26 Counties, Can Choose From 75 or More Plans in 2025

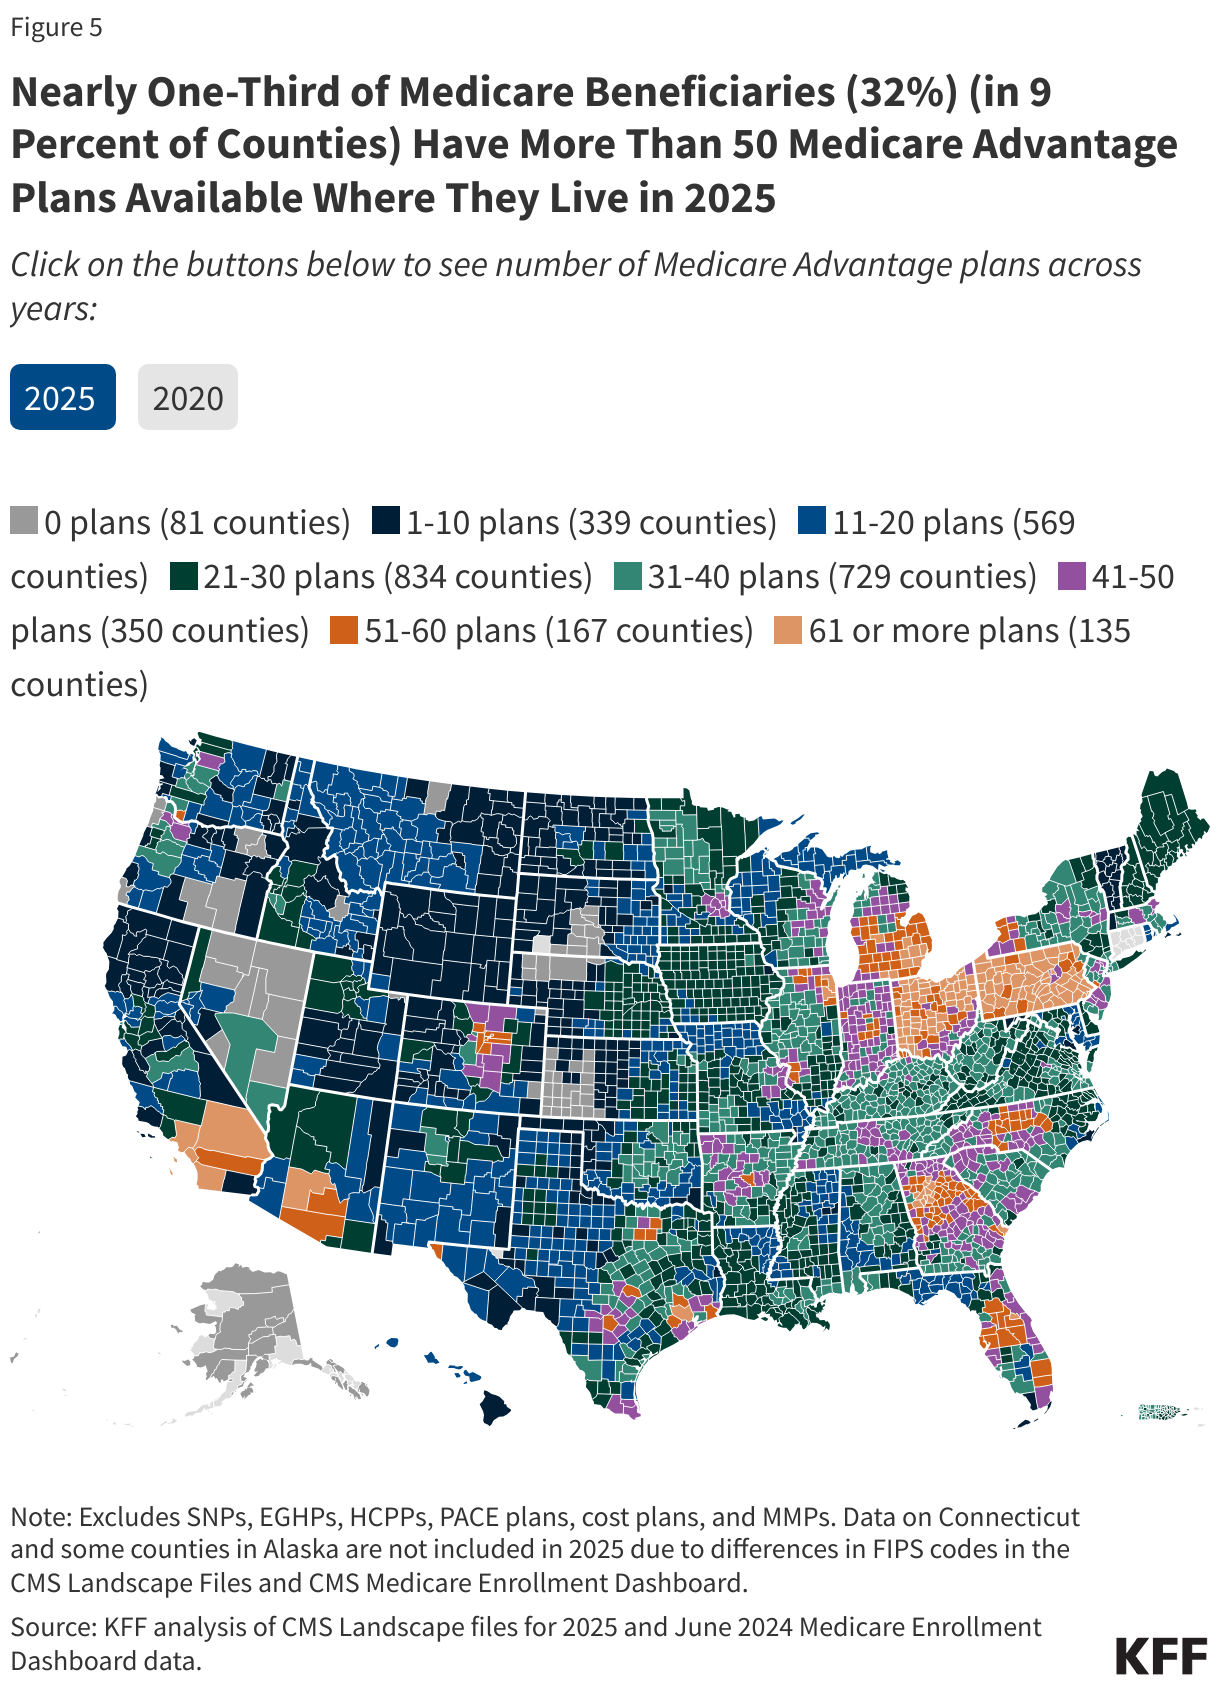
In 2025, nearly one-third (32%) of Medicare beneficiaries (in 9 percent of counties) can choose from more than 50 Medicare Advantage plans (Figure 5).

Nearly One-Third of Medicare Beneficiaries (32%) (in 9 Percent of Counties) Have More Than 50 Medicare Advantage Plans Available Where They Live in 2025

Nearly one-third of Medicare beneficiaries (32%) have a choice of at least 50 Medicare Advantage plans in 2025, roughly the same as 2024 (33%). In 2025, less than 0.5 percent of beneficiaries live in a county with one to four Medicare Advantage plans available, while less than 0.5 percent of beneficiaries live in a county without any plans available. Similar to 2024, there are no Medicare Advantage plans for individual enrollment being offered in any county in Alaska in 2025, which includes about 99,000 beneficiaries. In 81 counties, about 250,000 Medicare beneficiaries (including those in Alaska) will not have access to a Medicare Advantage plan (an increase from 58 counties and about 196,000 Medicare beneficiaries in 2024). Additionally, no Medicare Advantage plans are available in territories other than Puerto Rico.

Variation in Medicare Advantage Plans by Geographic Status. Medicare beneficiaries living in metropolitan areas – counties with at least 50,000 people – can choose from 45 Medicare Advantage plans in 2025 on average (down from 47 in 2024), including 37 with Part D coverage, substantially more than beneficiaries living in rural or micropolitan areas. Beneficiaries in micropolitan areas (10,000 to 50,000 people) can choose from an average of 31 plans (1 fewer plan than in 2024), including 24 with Part D coverage.

Beneficiaries in rural areas – counties with less than 10,000 people – can choose from an average of 27 plans (the same as in 2024), including 21 with Part D coverage. Since 2020, when 14 plans were available on average to beneficiaries living in rural areas, the availability of plans in rural areas has nearly doubled.

As in recent years, virtually all Medicare beneficiaries (99.6%) have access to a Medicare Advantage plan as an alternative to traditional Medicare, including almost all beneficiaries in metropolitan areas (99.9%), micropolitan (99.0%) and rural (97.8%) areas.

Medicare Advantage Plan Availability by Firm

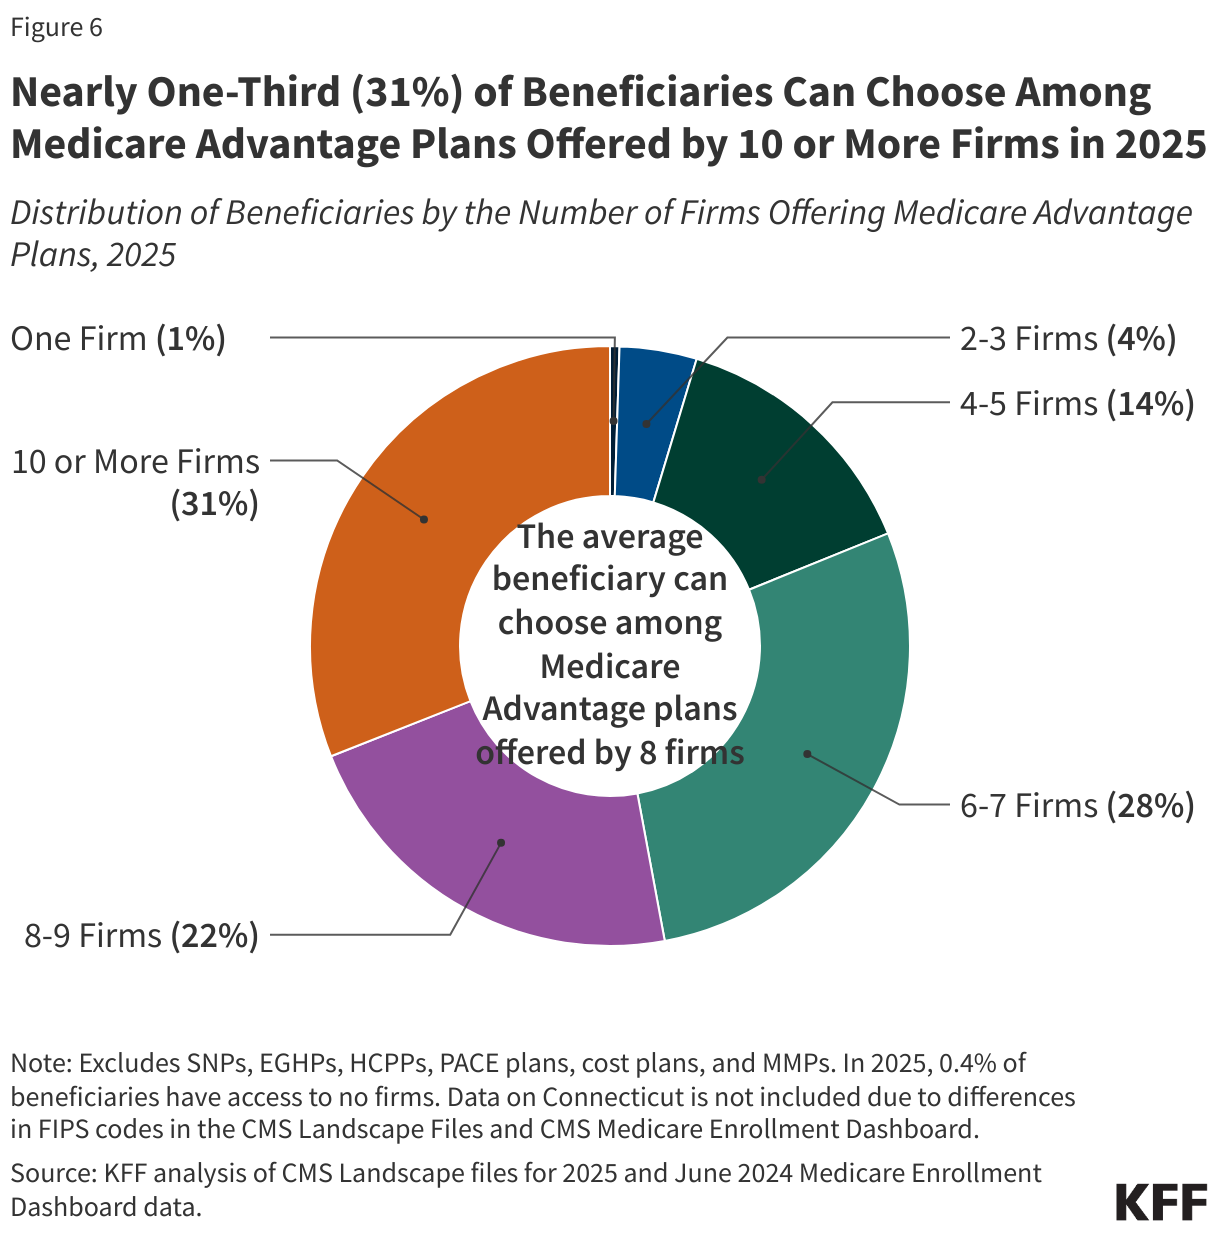
The average Medicare beneficiary is able to choose from plans offered by 8 firms in 2025, the same as in 2024 (Figure 6). Despite most beneficiaries having access to plans operated by several different firms, enrollment is concentrated in plans operated by UnitedHealthcare and Humana, and together UnitedHealthcare and Humana account for nearly half (47%) of Medicare Advantage enrollment in 2024.

Nearly One-Third (31%) of Beneficiaries Can Choose Among Medicare Advantage Plans Offered by 10 or More Firms in 2025

In 2025, nearly one-third of beneficiaries (31%), in 169 counties, are able to choose from plans offered by 10 or more firms or other sponsors (a decline from 33% in 2024). In contrast, nearly 5 percent of beneficiaries live in a county where one to three firms offer Medicare Advantage plans (501 counties).

Further, in 126 counties, only one firm will offer Medicare Advantage plans in 2025. These are mostly rural counties with relatively few Medicare beneficiaries (less than 1 percent of total). In some of these counties, there were no firms offering Medicare Advantage in 2024, e.g., 5 counties in Idaho (Benewah, Clearwater, Custer, Lemhi, and Lewis). In contrast, Medicare beneficiaries in some counties had access to plans offered by two or three firms in 2024 but only one firm in 2025, such as people living in Coos County, Oregon.

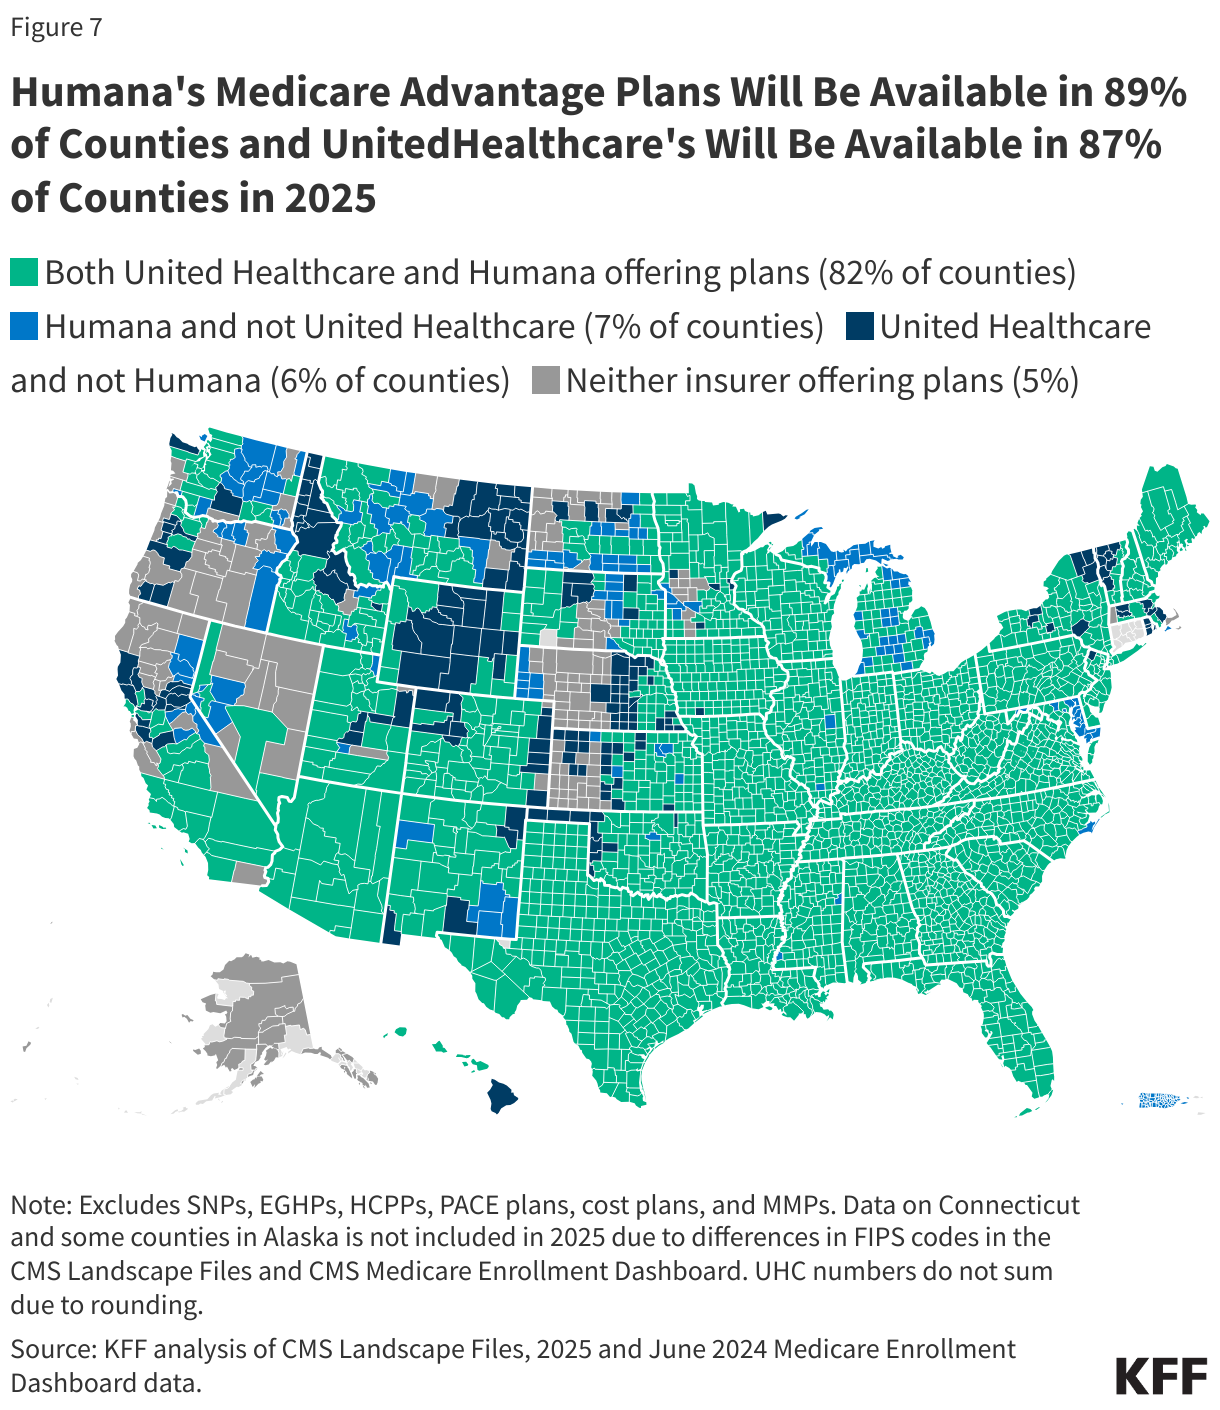
Availability of Plans by Firm and County. UnitedHealthcare and Humana, the two firms with the most Medicare Advantage enrollees in 2024, have large footprints across the country, offering plans in most counties, similar to 2024 (Figure 7).

Humana's Medicare Advantage Plans Will Be Available in 89% of Counties and UnitedHealthcare's Will Be Available in 87% of Counties in 2025

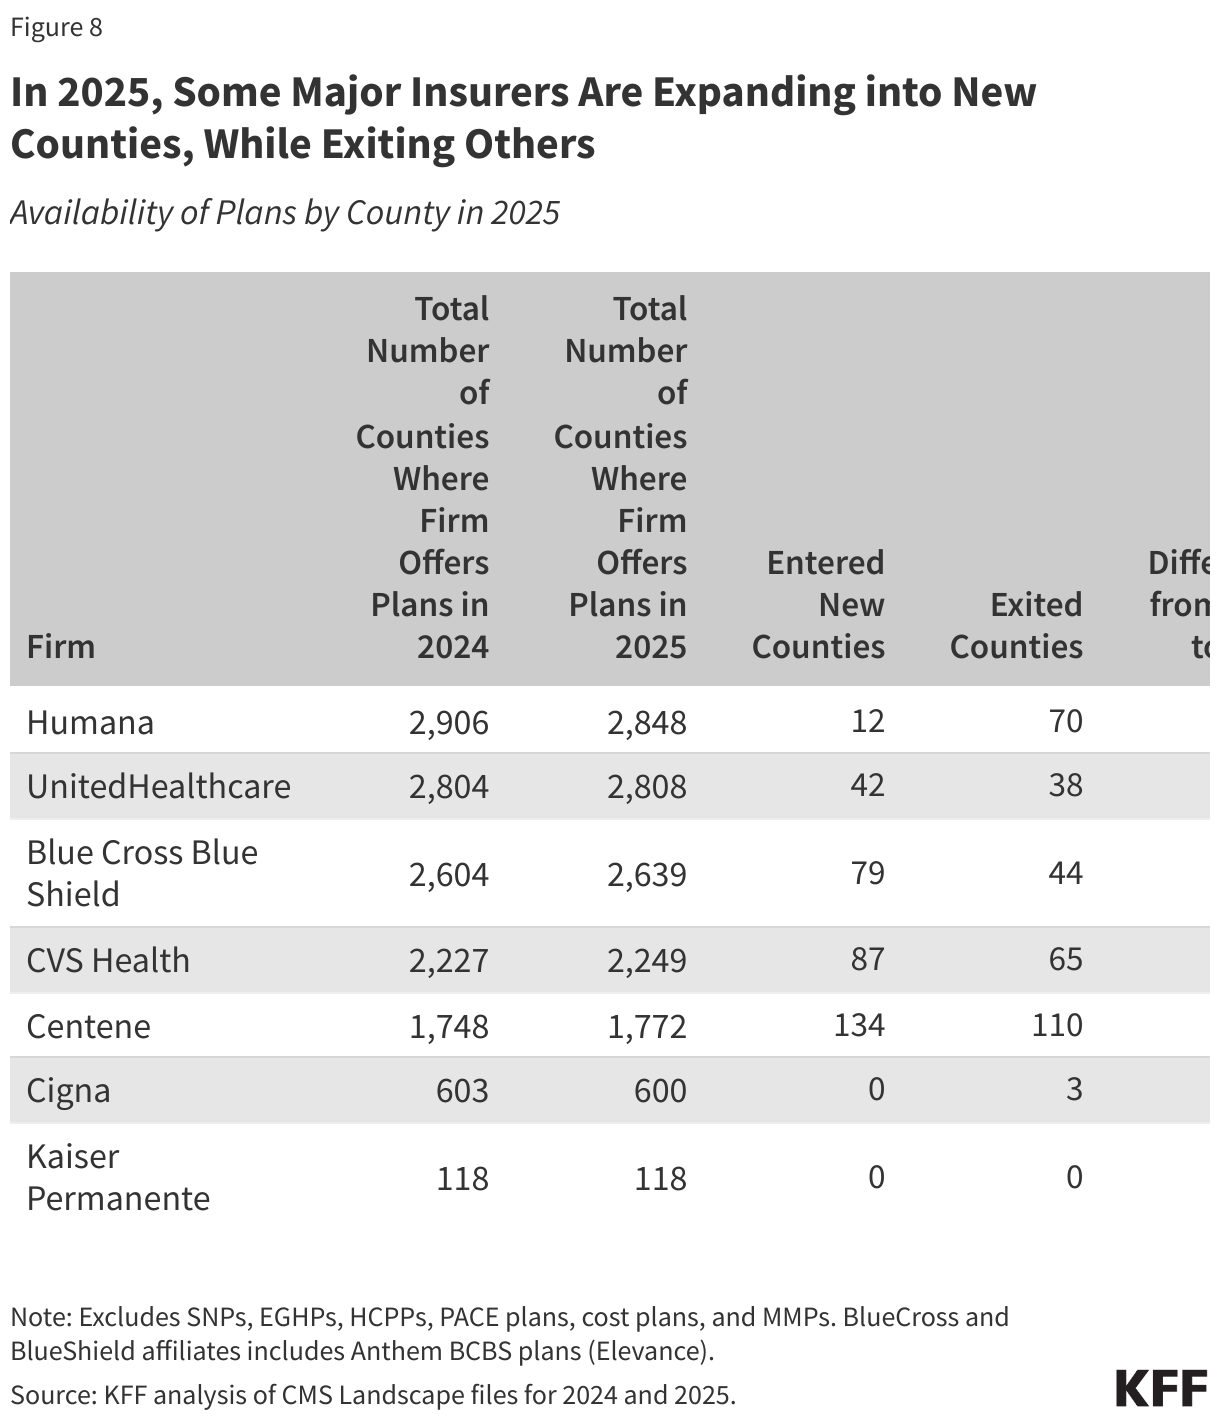
Some major insurers are expanding into new counties, while leaving others (Figure 8).

In 2025, Some Major Insurers Are Expanding into New Counties, While Exiting Others

Humana is offering plans in more counties than any other large Medicare Advantage insurer – 2,848 counties in 2025 – though that represents a decrease of 58 counties from 2024. Humana is exiting 70 counties, while entering 12 new counties. UnitedHealthcare is offering plans in 2,808 counties in 2025, an increase of 4 counties from 2024. UnitedHealthcare entered more counties (42 new counties) than it exited (38 counties).

Blue Cross Blue Shield Affiliates are offering plans in 2,639 counties in 2025, an increase of 35 counties from 2024. Blue Cross Blue Shield Affiliates are exiting 44 counties, but are entering 79 new counties. CVS is offering plans in 2,249 counties, an increase of 22 counties. CVS exited 65 counties, but is entering 87 new counties.

Insurer decisions to exit some counties while entering new ones may suggest that local market factors impact insurer evaluations about their potential to attract enrollees and earn a profit.

Multiple Plan Offerings by Firms in the Same County. Many Medicare Advantage firms are also offering more than one plan option in each county.

More than half (58%) of Medicare beneficiaries live in a county (1,188) where at least one firm is offering 10 or more plans for individual enrollment. For example, in Cumberland County, Pennsylvania (the county with the most plan offerings – 87), four firms are offering 10 or more plans (Humana, Blue Cross Blue Shield Affiliates, UPMC Health Plan, and CVS Health). In 125 counties, two firms are offering 10 or more plans, and in 50 counties, three firms are offering 10 or more plans.

In 2025, Humana is increasing the number of plan options available in 631 counties, while decreasing the number of plan options in 1,192 counties. UnitedHealthcare is increasing the number of plans in 381 counties but decreasing plan offerings in 693 counties. Blue Cross Blue Shield Affiliates are increasing the number of plans options in 698 counties, while decreasing plan options in 630 counties. CVS Health is increasing the number of plan options in 667 counties, while decreasing them in 775 counties. This also suggests that insurers evaluate local markets when making decisions about the number of plans to offer and different county characteristics may make the market more or less attractive in a given year to a particular insurer.

Plan Renewals and Terminations

In 2025, 5% of Medicare Advantage enrollees in MA-PDs or about 1.4 million people, are in a plan that has been terminated for the coming year and will not be automatically assigned to another plan. (This number includes people enrolled in SNPs but excludes people in MA-only plans or people with employer coverage). People in this group will be able to enroll in another Medicare Advantage plan if one is available or choose traditional Medicare. If they choose traditional Medicare, they will qualify for a special enrollment period for Medigap with guaranteed issue rights, meaning they can switch to traditional Medicare and will not be denied a Medigap policy due to a pre-existing condition.

Another 7% of Medicare Advantage enrollees in MA-PDs or about 1.8 million people, are in plans that have been affected by a consolidation. In this situation, some portion of this 1.8 million people will be moved into another plan under the same insurer automatically if the contract includes another plan of the same type (i.e., HMO or PPO) in the same county. (Some enrollees in consolidated renewal plans will not see changes in their plan because they were already in the plan that other enrollees are now being assigned to.) They may still enroll in another Medicare Advantage plan if one is available or choose traditional Medicare. However, they do not qualify for a special enrollment period under federal law for Medigap.

New Market Entrants and Exits

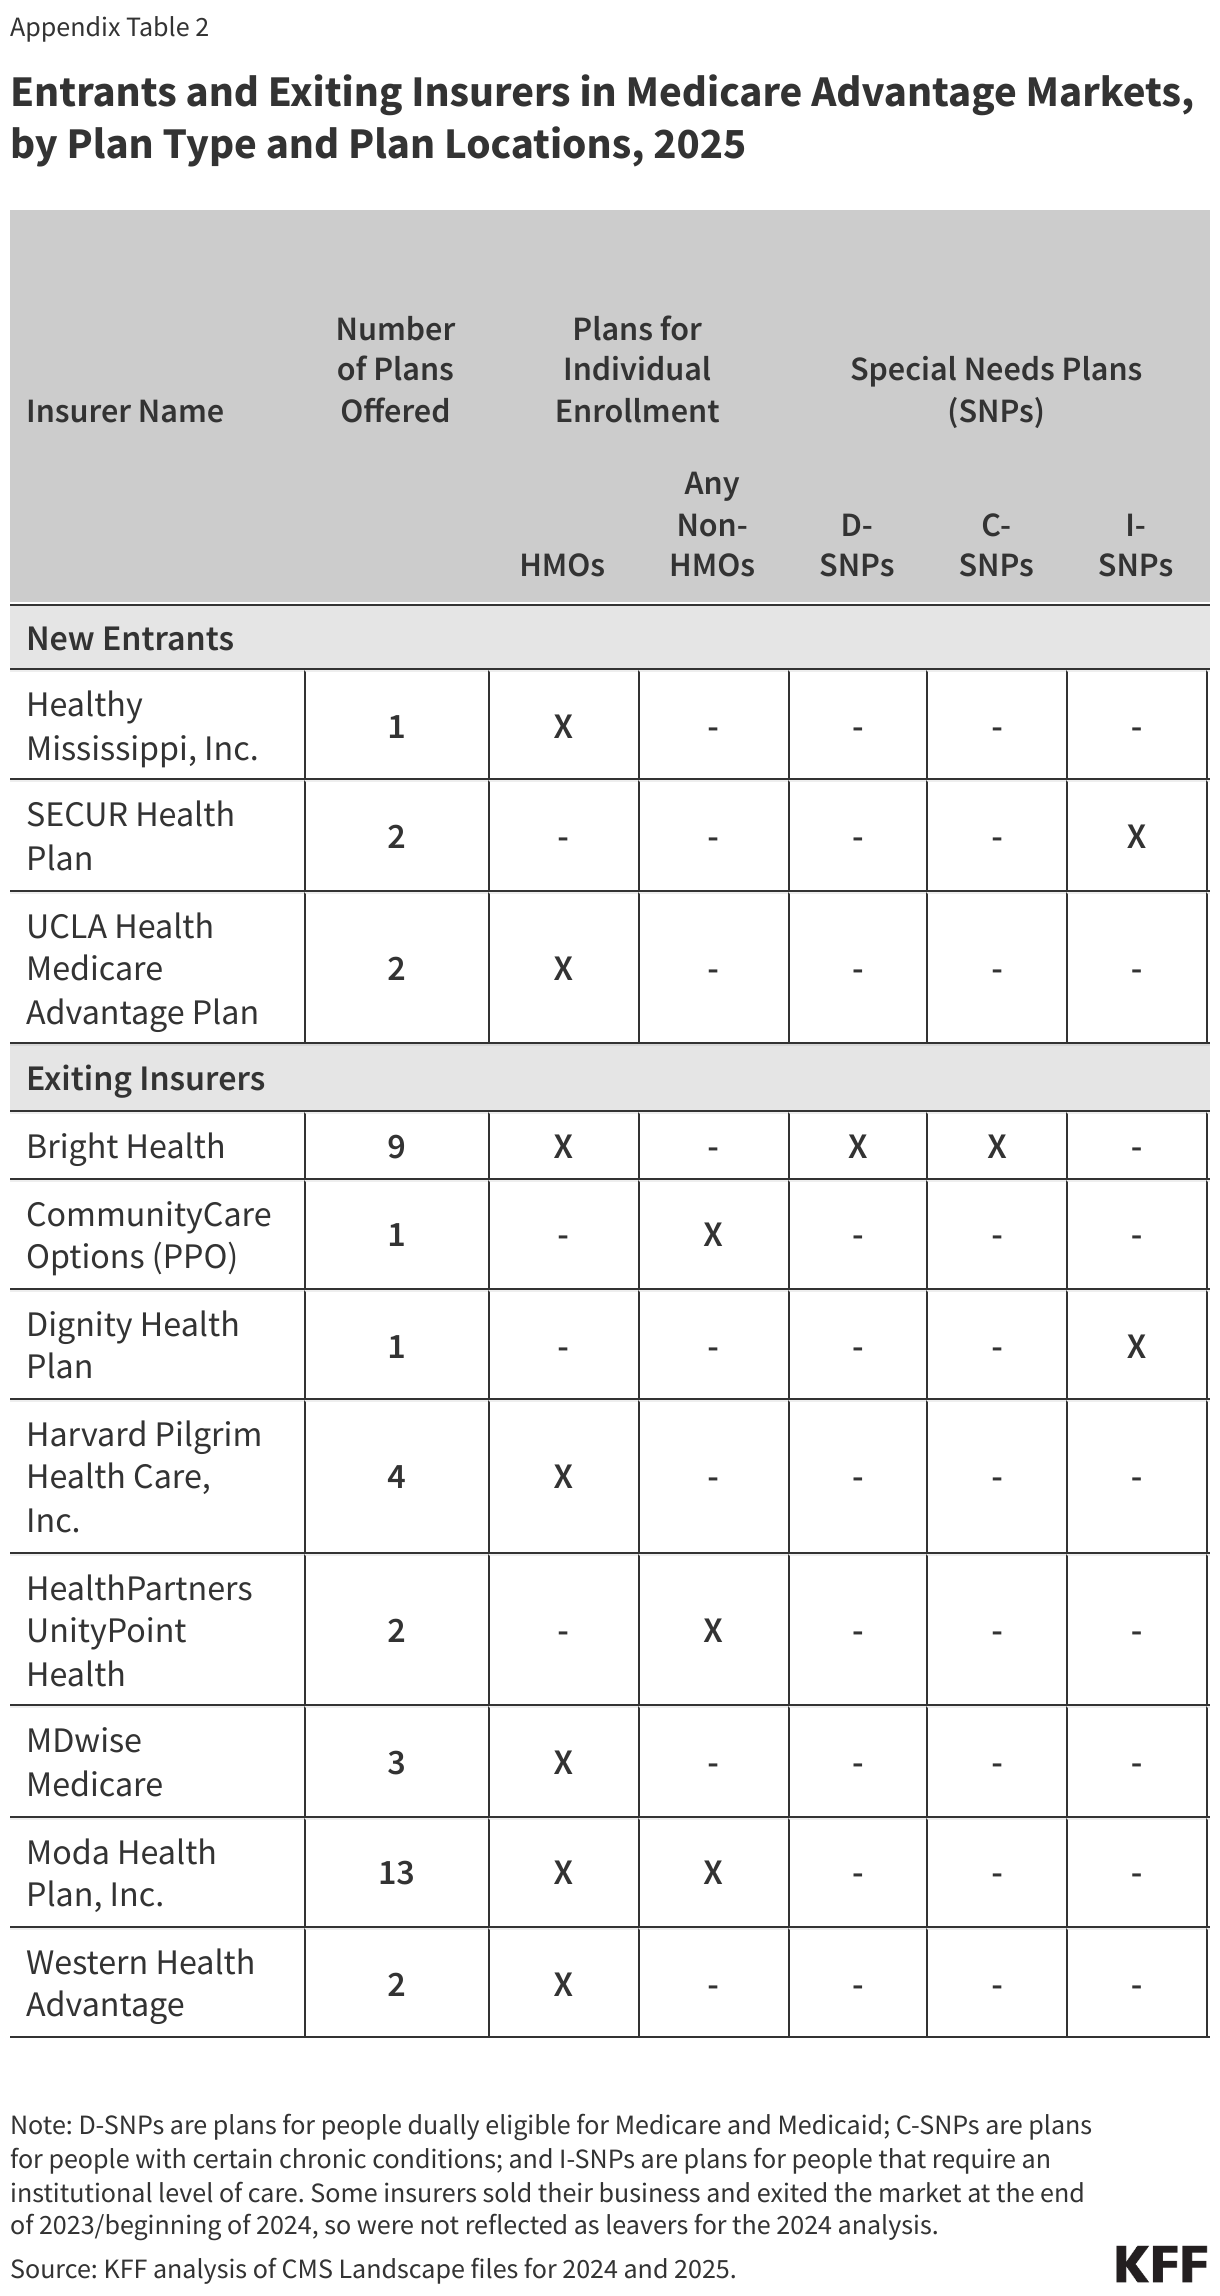
In 2025, three firms (Healthy Mississippi, SECUR Health Plan and UCLA Health Medicare Advantage plan) entered the market for the first time, while eight firms exited the market (Appendix Table 2). Healthy Mississippi has one new HMO plan available for general enrollment in Mississippi, while UCLA Health is offering two HMO plans available for general enrollment in California. SECUR Health Plan is offering two I-SNPs in Florida.

In the last few years, some firms have introduced plans that are either co-branded or are in partnership with another company. For example, in 2025, Alignment Health is offering three plans co-branded with Instacart in 7 counties in California and Nevada. These plans will offer groceries to qualifying beneficiaries with chronic conditions. Alignment Health also partners with Walgreens and Rite Aid. Other companies with a partnership that are offering plans in 2025 include Select Health and Kroger and Humana and USAA though this is not an exhaustive list.

Eight firms that participated in the Medicare Advantage market in 2024 are not offering plans in 2025. Six of the firms had low enrollment in 2024 (around 10,000 or fewer enrollees per firm). Two of the firms had contracts taken over by other insurers.

Meredith Freed, Jeannie Fuglesten Biniek, and Tricia Neuman are with KFF. Anthony Damico is an independent consultant.

Methods

This analysis focuses on the Medicare Advantage marketplace in 2025 and trends over time. The analysis of plan offerings, availability of plans by state, county, firm, and insurer are based on individual Medicare Advantage plans for general enrollment. In addition to the analysis of SNP availability, SNPs are also included in counts of plan terminations and renewals as well as entries and exits. Employer plans are excluded from this analysis.

Data on Medicare Advantage plan availability, enrollment, and premiums were collected from a set of data files released by the Centers for Medicare & Medicaid Services (CMS):

  • Medicare Advantage plan landscape files, released each fall prior to the annual enrollment period
  • Medicare Advantage contract/plan/state/county level enrollment files, released on a monthly basis
  • Medicare Advantage plan benefit package files, released quarterly
  • Medicare Enrollment Dashboard files, released on a monthly basis

Connecticut is excluded from the analysis of Medicare Advantage at the county level due to a change in FIPS codes that are in the Medicare Enrollment Dashboard data but are not yet reflected in the Medicare Advantage enrollment data. Some Alaskan counties are also excluded due to differences in FIPS codes.

In previous years, KFF had calculated the share of Medicare beneficiaries enrolled in Medicare Advantage by including Medicare beneficiaries with either Part A and/or B coverage. We modified our approach in 2022 to estimate the share enrolled among beneficiaries eligible for Medicare Advantage who have both Medicare Part A and Medicare B. These changes are reflected in all data displayed trending back to 2010.

Additionally, in previous years, KFF had used the term Medicare Advantage to refer to Medicare Advantage plans as well as other types of private plans, including cost plans, PACE plans, and HCPPs. However, cost plans, PACE plans, HCPPs are excluded from this analysis in addition to MMPs. These exclusions are reflected in all data displayed trending back to 2010.

KFF’s plan counts may be lower than those reported by CMS and others because KFF uses overall plan counts and not plan segments. Segments generally permit a Medicare Advantage organization to offer the “same” local plan, but may vary supplemental benefits, premium and cost sharing in different service areas (generally non-overlapping counties).

Appendix

Fewer Medicare Advantage Plans Are Available in 2025 Than in 2024
Availability of Medicare Advantage Plans and Insurers, by State, 2025
Entrants and Exiting Insurers in Medicare Advantage Markets, by Plan Type and Plan Locations, 2025

Medicare Advantage 2025 Spotlight: A First Look at Plan Premiums and Benefits

Authors: Meredith Freed, Jeannie Fuglesten Biniek, Anthony Damico, and Tricia Neuman
Published: Nov 15, 2024

Note: This analysis was updated on November 25th to reflect the October version of the 2025 CMS Landscape file.

Medicare Advantage plans, which enrolled nearly 33 million Medicare beneficiaries or 54% of the eligible Medicare population in 2024, because they typically offer extra benefits, such as dental, vision and hearing, often for no additional premium, as well as lower cost sharing compared to traditional Medicare without supplemental insurance, with the trade-off of more restrictive provider networks and greater use of cost management tools, such as prior authorization.

This brief provides an overview of premiums and benefits in Medicare Advantage plans that are available for 2025 and key trends over time. This brief uses data from the CMS Landscape and Benefit files. See methods for more details. In general, this brief refers to Medicare plans available for general enrollment, excludes Special Needs Plans (SNPs), except where noted, and excludes employer plans. A companion analysis describes trends in plan offerings.

Medicare Advantage Highlights for 2025

  • Two-thirds of all Medicare Advantage plans with Part D prescription drug coverage (MA-PDs) (67%) will charge no premium (other than the Part B premium) in 2025, similar to 2024 (66%).
  • Nearly one-third (32%) of Medicare Advantage plans will offer some reduction in the Medicare Part B premium in 2025, an increase compared to 2024 (19%).
  • Nearly all Medicare Advantage plans (97% or more) are offering vision, dental and hearing, as they have in previous years. However, the share of plans offering certain benefits has declined, such as over-the-counter benefits (85% in 2024 vs. 73% in 2025), remote access technologies (74% in 2024 vs. 53% in 2025), meal benefits (72% in 2024 vs. 65% in 2025) and transportation (36% in 2024 vs. 30% in 2025).
  • The share of Special Needs Plans (SNPs) offering transportation, remote access technologies and in-home support services declined slightly in 2025, while the share offering bathroom safety devices and the Part B rebate increased.
  • A larger share of SNPs than other Medicare Advantage plans are offering Special Supplemental Benefits for the Chronically Ill, which are extra benefits available to a subset of a plan’s enrollees, particularly food and produce (84% in SNPs; 15% in individual plans) and general supports for living, such as housing and utilities (67% in SNPs; 11% in individual plans).

Premiums

The vast majority of Medicare Advantage plans for individual enrollment (88%) will include prescription drug coverage (MA-PDs), similar to 2024 (89%), and the share of MA-PDs that charge no premium (other than the Part B premium of $185 per month) is 67% in 2025, similar to 2024 (66%). Nearly all beneficiaries (99%) have access to a MA-PD with no additional monthly premium in 2025, the same as in 2024 (99%).

In 2024, 75% of enrollees in MA-PD plans pay no premium other than the Medicare Part B premium. Based on enrollment in March 2024, 10% of enrollees pay at least $50 a month, including 3% who pay $100 or more. CMS estimates that the average monthly plan premium among all Medicare Advantage enrollees in 2025, including those who pay no premium for their Medicare Advantage plan, will be $17.00 a month. In 2024, 12 percent of Medicare Advantage enrollees are in a plan that offered some reduction in Medicare Part B premiums.

In 2025, 32% of Medicare Advantage plans will offer some reduction in the Part B premium, higher than the share in 2024 (19%) (Figure 1).

Among the 32% of Medicare Advantage Plans Offering a Reduction in the Part B Premium, More Than a Quarter (28%) Will Offer a Reduction of $100 a Month or More

Among plans that are offering a monthly reduction in the Part B premium ($185 per month in 2025), 28% are offering a monthly reduction of $100 or more, 25% are offering a reduction of $50.01 to $100, 17% are offering a reduction of $10.01 to $50, and 30% are offering a monthly reduction of $10 or less.

In previous years, a smaller share of Medicare Advantage enrollees has typically ended up in plans that reduced the Part B premium. For example, for the 2024 plan year, 19% of plans offered a reduction in the Part B premium, but ultimately only 12% of Medicare Advantage enrollees were enrolled in plans with this benefit.

While many employers and unions also offer Medicare Advantage plans to their retirees, no information about these 2025 plan offerings is made available by CMS to the public during the Medicare open enrollment period. Employer and union plans are administered separately and may have enrollment periods that do not align with the Medicare open enrollment period.

Extra Benefits

Medicare Advantage plans may provide extra benefits that are not available in traditional Medicare, are considered “primarily health related,” and can use rebate dollars (including bonus payments) to help cover the cost of these extra benefits. Beginning in 2019, CMS expanded the definition of “primarily health related” to allow Medicare Advantage plans to offer additional supplemental benefits. Medicare Advantage plans may also restrict the availability of these extra benefits to certain subgroups of beneficiaries, such as those with diabetes or congestive heart failure, making different benefits available to different enrollees.

Availability of Extra Benefits in Individual Plans for General Enrollment. In 2025, 97% or more individual plans offer some vision, dental or hearing benefits, similar to 2024 (Figure 2). Though these benefits are widely available, the scope of coverage for these services varies. For example, a dental benefit may include cleanings and preventive care or more comprehensive coverage, and often is subject to an annual dollar cap on the amount covered by the plan. From year to year, plans may change the parameters of this coverage, such as increasing or decreasing annual maximums the plan will pay toward the benefit or adjusting cost sharing for services. There is not yet data available about utilization of these benefits or associated costs, so it is not clear the extent to which supplemental benefits are used by enrollees.

The Share of Individual Medicare Advantage Plans Offering Vision, Hearing, and Dental Benefits Stayed Stable in 2025, But Declined for Some Benefits, Such as Over the Counter, Meal, Remote Access Technologies, and Transportation Benefits

As of 2020, Medicare Advantage plans have been allowed to include telehealth benefits as part of the basic benefit package – beyond what was allowed under traditional Medicare prior to the COVID-19 public health emergency, which was extended to December 2024. Therefore, these benefits are not included in the figure above because their cost is not covered by either rebates or supplemental premiums. Medicare Advantage plans may also offer supplemental telehealth benefits via remote access technologies and/or telemonitoring services, which can be used for those services that do not meet the requirements for coverage under traditional Medicare or the requirements for the telehealth benefits as part of the basic benefit package (such as the requirement of being covered by Medicare Part B when provided in-person). In 2025, 53% of plans are offering remote access technologies, a decline from 74% in 2024. A similar share of plans are offering telemonitoring services (2% in 2025 vs 3% in 2024).

Some benefits are being offered by a smaller share of plans in 2025 than in 2024. For example, 73% of plans are offering an allowance for over-the-counter items (vs. 85% in 2024), while 65% are offering meal benefits (vs. 72% in 2024), and 30% are offering transportation benefits for medical needs (vs. 36% in 2024). A similar share of plans is offering acupuncture (32% in 2025 vs. 34% in 2024), bathroom safety devices (24% in 2025 vs 22% in 2024), and support for caregivers of enrollees (5% in 2025 and 2024). A smaller share of plans are offering in-home support services (6% in 2025 vs 9% in 2024). This is not an exhaustive list of extra benefits that plans offer, and plans may provide other services such as home-based palliative care, therapeutic massage, and adult day health services, among others.

Access to Medicare Advantage Plans with Extra Benefits. Virtually all Medicare beneficiaries live in a county where at least one Medicare Advantage plan available for general enrollment (excluding SNPs) has some extra benefits not covered by traditional Medicare, with over 99% having access to at least one or more plans with dental, fitness, vision, and hearing benefits for 2025, the same as in 2024. The vast majority of beneficiaries also have access to one or more plans that offer an allowance for over-the-counter items (over 99%), a meal benefit (over 99%), remote access technologies (99%), acupuncture (98%), bathroom safety devices (96%), transportation assistance (94%) but fewer have access to one or more plans that offer in-home support services (60%), caregiver support (41%), or telemonitoring services (16%).  (Connecticut is not included in these estimates – see methods for more details.)

Availability of Extra Benefits in Special Needs Plans. SNPs are designed to serve a disproportionately high-need population, and a somewhat larger percentage of SNPs than plans for other Medicare beneficiaries provide their enrollees over-the-counter benefits (92%; similar to 2024 – 94%), transportation benefits for medical needs (81%; a decline from 88% in 2024), meals (73%, similar to 2024 – 75%), bathroom safety devices (54%; up from 34% in 2024), and in-home support services (17%; down from 25% in 2024) (Figure 3). Compared to individual plans, a smaller share of SNPs offer fitness benefits (83%, similar to 2024 – 84%), remote access technologies (50%; a decline from 66% in 2024), and the Part B rebate (29%; up from 7% in 2024). Similar to plans available for individual enrollment, a relatively small share of SNPs offer support for caregivers (5%) or telemonitoring services (2%).

The Share of Special Needs Plans (SNPs) Offering Vision, Hearing, and Dental Benefits Stayed Stable in 2025, But Declined for Some Benefits, Such as Transportation Benefits, Remote Access Technologies, and In-Home Support Services, And Increased For Others, Such as Bathroom Safety Devices and the Part B Rebate

Availability of Special Supplemental Benefits for the Chronically Ill (SSBCI). Beginning in 2020, Medicare Advantage plans have also been able to offer extra benefits to a subset of a plan’s enrollees, that are not primarily health related and are specifically for chronically ill beneficiaries, known as Special Supplemental Benefits for the Chronically Ill (SSBCI). In addition, Medicare Advantage plans participating in the Value-Based Insurance Design Model may also offer these non-primarily health related supplemental benefits to their enrollees, but can use different eligibility criteria than required for SSBCI, including offering them based on an enrollee’s socioeconomic status (e.g., LIS eligibility) or whether the enrollee lives in an underserved area.

Most individual and SNP Medicare Advantage plans still do not offer these benefits, though more SNP plans generally offer these benefits, particularly food and produce. SSBCI benefits offered in 2025 include food and produce (15%% for individual plans and 84% for SNPs), general supports for living (e.g., housing, utilities) (11% in individual plans and 67% for SNPs), transportation for non-medical needs (8% for individual plans and 46% for SNPs), and pest control (3% for individual plans and 23% for SNPs) (Figure 4).

Most Medicare Advantage Plans Are Not Offering Special Supplemental Benefits for the Chronically Ill (SSBCI) in 2025, Similar to Prior Years, Though More SNPs Generally Offer These Benefits

Like for other types of supplemental benefits, the scope of services for SSBCI benefits varies. For example, many plans offer a specified dollar amount that enrollees can use toward a variety of benefits, such as food and produce, utility bills, rent assistance, and transportation for non-medical needs, among others. This dollar amount is often loaded onto a flex card or spending card that can be used at participating stores and retailers, which can vary depending on the vendor administering the benefit. Depending on the plan, this may be a monthly allowance that expires at the end of each month or rolls over month to month until the end of the year, when any unused amount expires.

Meredith Freed, Jeannie Fuglesten Biniek, and Tricia Neuman are with KFF. Anthony Damico is an independent consultant.

Methods

This analysis focuses on the Medicare Advantage marketplace in 2025 and trends over time.Data on Medicare Advantage plan availability, enrollment, and premiums were collected from a set of data files released by the Centers for Medicare & Medicaid Services (CMS):

  • Medicare Advantage plan landscape files, released each fall prior to the annual enrollment period- Medicare Advantage plan crosswalk files, released each fall
  • Medicare Advantage contract/plan/state/county level enrollment files, released on a monthly basis
  • Medicare Advantage plan benefit package files, released quarterly
  • Medicare Enrollment Dashboard files, released on a monthly basis

Connecticut is excluded from the Access to Medicare Advantage Plans with Extra Benefits section of this analysis due to a change in FIPS codes that are in the Medicare Enrollment Dashboard data but are not yet reflected in the Medicare Advantage enrollment data. Some Alaskan counties are also excluded due to differences in FIPS codes.

In previous years, KFF had calculated the share of Medicare beneficiaries enrolled in Medicare Advantage by including Medicare beneficiaries with either Part A and/or B coverage. We modified our approach in 2022 to estimate the share enrolled among beneficiaries eligible for Medicare Advantage who have both Medicare Part A and Medicare B. These changes are reflected in all data displayed trending back to 2010.

Additionally, in previous years, KFF had used the term Medicare Advantage to refer to Medicare Advantage plans as well as other types of private plans, including cost plans, PACE plans, and HCPPs. However, cost plans, PACE plans, HCPPs are excluded from this analysis in addition to MMPs. These exclusions are reflected in all data displayed trending back to 2010.

KFF’s plan counts may be lower than those reported by CMS and others because KFF uses overall plan counts and not plan segments. Segments generally permit a Medicare Advantage organization to offer the “same” local plan, but may vary supplemental benefits, premium and cost sharing in different service areas (generally non-overlapping counties).


VOLUME 10

Distrust in Food Safety and Social Media Content Moderation

This is Irving Washington and Hagere Yilma. We direct KFF’s Health Misinformation and Trust Initiative and on behalf of all of our colleagues across KFF who work on misinformation and trust we are pleased to bring you this edition of our bi-weekly Monitor.


Summary

This volume addresses rising distrust in food safety, as concerns about food recalls after potential listeria outbreaks and artificial food dyes erode trust in the USDA and the FDA. We also examine shifts in social media content moderation, highlighting the tension between regulating harmful misinformation and protecting First Amendment rights in the recent elections, and the trend of self-diagnosis and treatment based on social media videos.


Recent Developments

A Growing Distrust in Food Safety May Give Rise to Misinformation

erierika / Getty Images

Concerns about artificial dyes in the food supply have recently gained traction, with growing public suspicion that these dyes contribute to health problems, such as ADHD in children and other chronic diseases into adulthood. Protests at Kellogg’s headquarters and the recent California law banning six of these dyes in school meals reflect increasing public concern, especially among parents. While some studies suggest that synthetic food dyes may be linked to adverse health effects, the FDA currently deems these dyes safe for consumption at the levels used in foods, leading some to question the agency’s standards. Robert F. Kennedy Jr.’s “Make America Healthy Again” campaign, which promised to “clean up” the FDA and other public health agencies, tapped into this distrust and may have resonated with those who feel the FDA is no longer a reliable authority on food safety.

Recent food recalls have also fueled misconceptions about food safety, with some social media posts falsely claiming that government agencies are intentionally “poisoning” the U.S. food supply to spread illness. This response followed the USDA’s October 9 recall of millions of pounds of ready-to-eat meat potentially contaminated with listeria. In the month following the recall, mentions of food safety concerns surged in news articles and on social media, with about 1 million mentions overall and 19,000 specific mentions of BrucePac. The most widely viewed post on X, posted on October 16 and receiving over 439,000 views, alleged that “elites” and the FDA are deliberately contaminating food with bacteria, GMOs, and heavy metals. Many commenters echoed the unsubstantiated claim that government agencies and corporations are “intentionally poisoning” the public, despite recalls being triggered by FDA safety violations. The reemergence of unverified claims about food safety underscores the challenge of addressing public concerns in an environment where misinformation can quickly spread and influence perceptions.

Unregulated Health Advice on Social Media Promotes Self-Diagnosis and Treatment of Health Conditions

RossHelen / Getty Images

Social media has increasingly become a platform for deceptive health and wellness advertisements, sometimes using deepfake technology to feature celebrities or scientists endorsing non-FDA-approved products. From over-the-counter hearing aid scams to fake insomnia pills, unregulated and potentially dangerous medical products misrepresented to the public can confuse consumers about the safety of these treatments. Unverified rumors about health and wellness can also come from social media users who share their personal experiences navigating health and wellness. These posts are often motivated by a desire to help or connect with others, but some influential users stand to financially benefit from promoting false or misleading information about health behaviors or wellness products. Regardless of intent, false, unverified, or misleading information shared in viral videos has led to an increase in self-diagnosis and treatment of health conditions.

One example is the growing trend of self-diagnosing mental health conditions on social media, particularly on platforms like TikTok. Some users claim to have been misdiagnosed or overlooked by healthcare providers, fueling their desire to share their experiences online. Influencers with large followings and personal brands often contribute to this trend, sometimes in pursuit of financial or social gain. This can create a cycle of content that encourages self-diagnosis and the use of non-FDA-approved or non-prescribed treatments. While social media content may be seen as quick and accessible advice when professional mental health care is difficult to access, research shows that many popular mental health videos contain misleading or oversimplified information, potentially leading users to misinterpret common symptoms as serious conditions such as ADHD or anxiety. Psychologists warn that self-diagnosis based on such content can overlook complex causes or lead to inappropriate treatment attempts. Some experts suggest that educational psychologists can combat misinformation in this area by working with young people and sharing evidence-based content on platforms like TikTok.

Polling Insights:

KFF’s May Health Information Tracking Poll found that most adults who use TikTok report seeing health-related content on the app. While four in ten TikTok users say they trust the information about health issues they see on TikTok at least “somewhat,” far fewer say they have ever talked to a doctor (13%) or sought mental health treatment (12%) because of something they saw on the app (Figure 1). Among adults who use TikTok, those who are younger, women, or daily users are more likely to say they’ve talked to a doctor or sought mental health treatment at least in part because of something they saw on the app. Nonetheless, across these demographics, most users say they have not followed up with a doctor or sought mental health treatment due to content they’ve seen on TikTok.

Four in Ten TikTok Users Say They Trust Information About Health Issues on TikTok, But Few Say They Have Ever Talked to a Doctor or Sought Mental Health Treatment Because of Something They Saw on the App

Elections Spark Ongoing Content Moderation Challenges for Social Media Companies

gorodenkoff / Getty Images

The way social media companies handled harmful information leading up to the recent election has had a lasting impact on debates about balancing content moderation with First Amendment rights. Social media companies have been under scrutiny for failing to remove false or misleading election-related posts, but efforts to take down potentially harmful content often lead to accusations of censorship. For example, Meta faced criticism from its oversight board for stifling political speech when it removed a post depicting Vice President Kamala Harris and former running mate Governor Tim Walz as characters from the movie Dumb and Dumber.

A broader Republican-led narrative suggesting that the federal government is being weaponized to censor conservative viewpoints has further politicized terms like “misinformation” and created distrust in government efforts to identify and reduce harmful information on social media. As a result, even government efforts to increase transparency around content moderation also face resistance from platforms. This was seen in California, where a lawsuit brought by Elon Musk claims that the state violated free speech by requiring social media companies to publicly disclose their content moderation policies. Concerns about restrictions on free speech on social media were central to several cases the Supreme Court considered this year, but the Court did not provide definitive guidance on how moderation affects First Amendment rights.

These ongoing tensions between platforms, politicians, and regulators suggest that finding the balance between free speech and content moderation will likely remain one of social media’s most contentious challenges, leaving a murky area for future policy efforts.


Research Insights

Equipping TikTok Influencers with Training Boosts Accurate Mental Health Communication

mapodile / Getty Images

A study published in Scientific Reports earlier this year explored how TikTok influencers can be encouraged to share evidence-based mental health information, with the aim of improving mental health communication on the platform. The researchers found that TikTok creators who were provided with digital toolkits and optional live training sessions were more likely to produce videos with accurate mental health information. Creators who used these resources also saw a boost in viewership of their mental-health related videos, suggesting that scalable training for influencers can combat misinformation in a manner acceptable to viewers.

Source: Motta, M., Liu, Y., & Yarnell, A. (2024). “Influencing the influencers:” a field experimental approach to promoting effective mental health communication on TikTok. Scientific Reports, 14(1), 5864.

Personal Role Models on Social Media Drive Stronger Health Motivation Through Relatability

A study in Health Communication examined how personal and entertainment role models influence people’s health motivation, particularly through social media. The researchers found that people who followed someone on social media that they consider a role model have stronger health motivations, with personal role models, like family and friends, having a greater impact on health goals than entertainment figures. Among the qualities that made role models effective in motivating health behaviors, the researchers found that perceived similarity was the strongest, as people felt more inspired by role models who seemed relatable. The findings suggest that health campaigns should leverage personal connections and relatable influencers to inspire healthier behaviors.

Source: O’Donnell, N. H., Erlichman, S., & Nickerson, C. G. (2024). Health Motivation in the Influencer Era: Analyzing Entertainment, Personal, and Social Media Role Models. Health Communication, 1-12.


AI and Emerging Technology

Study Finds Low Trust in AI for Health Information Among Older Adults

Laurence Dutton / Getty Images

While some have found beneficial uses for AI in health information, such as debunking conspiracy theories or providing quick, low-stakes health advice, a significant portion of the population remains skeptical. A University of Michigan National Poll on Healthy Aging found that nearly three-quarters of adults over 50 have little to no trust in AI-generated health information. This distrust is particularly pronounced among women, individuals with lower education or income, and those who haven’t recently seen a healthcare provider. Additionally, 20% of respondents reported low confidence in identifying health misinformation. Older adults in poorer physical or mental health faced even greater challenges in finding accurate information. The findings from this report suggest a gap in health literacy among older adults that can be addressed by health professionals.

About The Health Information and Trust Initiative: the Health Information and Trust Initiative is a KFF program aimed at tracking health misinformation in the U.S., analyzing its impact on the American people, and mobilizing media to address the problem. Our goal is to be of service to everyone working on health misinformation, strengthen efforts to counter misinformation, and build trust. 


View all KFF Monitors

The Monitor is a report from KFF’s Health Information and Trust initiative that focuses on recent developments in health information. It’s free and published twice a month.

Sign up to receive KFF Monitor
email updates


Support for the Health Information and Trust initiative is provided by the Robert Wood Johnson Foundation (RWJF). The views expressed do not necessarily reflect the views of RWJF and KFF maintains full editorial control over all of its policy analysis, polling, and journalism activities. The Public Good Projects (PGP) provides media monitoring data KFF uses in producing the Monitor.


What Administrative Changes Can Trump Make to Medicaid?

Published: Nov 8, 2024

With Donald Trump returning to the presidency, the future of Medicaid is uncertain. While Medicaid did not receive a lot of attention directly during the campaign, Trump’s first term can shed light on potential changes that could be implemented administratively without Congress.

1. Trump administration could encourage and approve Medicaid waivers to advance priorities, including work requirements.

The previous Trump administration’s Section 1115 waiver policy emphasized work requirements, other eligibility restrictions, and capped financing. The Trump administration approved 13 waivers that allowed states to condition Medicaid eligibility on meeting work and reporting requirements and also approved waivers that restricted eligibility, including by permitting states to charge premiums and lock out enrollees who are disenrolled for unpaid premiums. Although previous work requirements in Medicaid were challenged in court and the waivers imposing work requirements were rescinded by the Biden administration, a number of states continue to be interested in adopting them. Although CMS withdrew work and premium requirements in Georgia’s “Pathways” waiver, these provisions remain in place after a federal judge vacated the CMS rescission.

Trump also introduced a demonstration opportunity, the “Healthy Adult Opportunity” (HAO), that would have allowed states “extensive flexibility” to use Medicaid funds to cover certain adults – including those who qualify under the Affordable Care Act’s expansion — without being bound by federal standards related to eligibility, benefits, delivery systems, and oversight in exchange for annual limits on federal financing. While no state took up this option during the first administration, these waivers restructure Medicaid financing in ways similar to block grant and per capita cap proposals and promoting the waivers in a second administration would enable Trump to advance that policy even in the absence of Congressional action. However, unlike legislative proposals that would alter Medicaid financing and significantly cut federal spending, it is unlikely that states would opt for such deals if federal financing would be cut significantly.

The new Trump administration’s waiver priorities will differ significantly from those of the Biden administration and it is unclear how the Trump administration will treat certain waivers promoted and approved by the Biden administration, such as those focused on addressing health-related social needs, multi-year continuous eligibility, and leveraging Medicaid to help individuals leaving incarceration transition to the community. The Trump administration could choose not to approve waivers that remain pending, rescind existing waiver guidance, or withdraw approved waivers, although some of these waivers, particularly ones using Medicaid to assist with reentry from incarceration, have been pursued by both Republican and Democratic governors.

2. Trump administration could choose not to implement or rewrite recent regulations.

The Biden administration finalized a number of major Medicaid regulations designed to promote quality of care and advance access to care for Medicaid enrollees as well as to streamline eligibility and enrollment processes in Medicaid and the Children’s Health Insurance Program (CHIP).

  • The Access rule addresses several dimensions of access: increasing provider rate transparency and accountability, standardizing data and monitoring, and creating opportunities for states to promote active enrollee engagement in their Medicaid programs. The rule also included many provisions governing access to home care (also known as home- and community-based services or HCBS), which include ensuring that at least 80% of spending on certain services be spent on compensation for direct care workers and requiring states to report the number of people on waiting lists for care.
  • The Managed Care rule addresses Medicaid managed care access, financing, and quality, including strengthening standards for timely access to care and states’ monitoring and enforcement efforts.
  • The Long-Term Care Facility (LTC) Staffing rule requires minimum staffing standards for nursing facilities.
  • Two rules streamline Medicaid enrollment and renewal processes for the Medicare Savings Program (MSP) and for Medicaid, CHIP and the Basic Health Program. The first rule helps eligible Medicare beneficiaries more easily access Medicaid coverage of Medicare premiums and cost sharing through the MSP while the second rule simplifies application, enrollment, and renewal processes and removes access barriers for children in CHIP. Each rule is expected to increase Medicaid enrollment by about one million people.

These rules are complex and are set to be implemented over several years. The Trump administration could delay implementation of certain provisions, which would reduce regulation of managed care companies, nursing facilities, and other providers, while rolling back enrollee protections, payment transparency, and improved access. Alternatively, the Trump administration could issue new regulations that would undo these final regulations.

3. Trump administration could issue guidance and implement policy to make it more difficult for people to obtain and maintain coverage, reducing enrollment and spending.

The Trump administration could also issue sub-regulatory guidance to change eligibility or renewal policies to restrict coverage by tightening verification of eligibility. Previously, the Trump administration sought to reduce Medicaid enrollment by encouraging states to conduct eligibility verification processes in between annual renewal periods. While some states conduct these periodic data checks, the administration could encourage more states to adopt the policy as a program integrity strategy. The Trump administration could also eliminate flexibilities granted under the Biden administration that allow states to streamline renewal procedures. Getting rid of these flexibilities would likely make it harder for some enrollees to renew their Medicaid coverage, while providing greater certainty that people who are ineligible do not obtain coverage.

Beyond waivers, regulations, and enrollment policy, if the Republicans gain control of both the House and the Senate, Trump could work with Congress to enact legislation that would more fundamentally change the financing structure of Medicaid and make significant cuts to federal Medicaid spending, similar to policies Trump has supported in the past.

News Release

Abortion Was a Motivating Factor for Many Voters in Tuesday’s Election But Ranked Lower Than Concerns About the Economy

Dashboard Highlights Abortion and Health Costs Insights from AP VoteCast Survey, Including Data from Supplemental KFF Questions

Published: Nov 6, 2024

Abortion drove many voters to turn out for Tuesday’s election, but not always for Vice President Kamala Harris, while concerns about the economy weighed more heavily on voters’ minds, according to polling data from KFF and the Associated Press.

About a quarter of voters said abortion was the “single most important” factor in their vote, about 4 in10 said it had a major impact on their decision to turn out (similar to the shares who said so in the 2022 midterm elections), and over half said it had a major impact on which candidates they supported, according to the Associated Press’s VoteCast survey. In partnership with the AP, KFF added supplemental questions to the survey of the 2024 electorate to gauge how voters were weighing health care issues as they exited the polls.

But Vice President Harris’s strong advantage on abortion was not enough to override negative views of the economy and immigration, issues where President- Elect Donald Trump held the edge, the polling data shows. Forty percent of voters said high prices for gas, groceries and other goods was the single most important factor to their vote, including 51% of Republicans, 41% of independents, and 28% of Democrats.

KFF’s analysis shows that Trump did much better than Harris among the majorities of voters who reported being very concerned about the cost of groceries, gas, and housing. He also did better than Harris among the more than half of voters who said they were very concerned about the cost of health care.

Moreover, on the issue of abortion, Trump managed to garner small but important shares of votes among those who voted in favor of abortion ballot measures in their state, winning four states where voters also chose to expand or protect abortion access. Trump won support from about three in ten voters who voted in favor of abortion access in the battleground states of Nevada and Arizona, a similar share in Missouri, and about a quarter in Montana.

In an online interactive dashboard, KFF examines the role that abortion, the economy and health care costs played in the 2024 election, providing a deep dive into voters’ thinking on health care issues as they made their decisions about whether to vote and whom to vote for.

KFF provides data and analysis of the overall AP VoteCast survey and these supplemental questions at both the national and state level.

The dashboard includes:

  • An interactive map that provides a more detailed look at states with abortion-related ballot measures.
  • Analysis and charts examining the motivations of voters and the impact of concerns about abortion policy and health care costs nationally and across states, including some data breakouts by demographic groups and political party.
  • A curated set of charts providing key analysis among subgroups of voters on topics like abortion ballot measures, health care as an economic concern, and voters’ views of the most important issues facing the U.S.

The AP VoteCast is a national and 48 state surveys of more than 115,000 voters conducted by NORC at the University of Chicago for The Associated Press, Fox News, PBS NewsHour, and The Wall Street Journal beginning on Oct. 28 and concluding as polls closed on Nov. 5, 2024, in English and Spanish. The national survey was conducted using NORC’s probability-based AmeriSpeak panel, while the individual state surveys were conducted from a random sample of state voter files and from self-identified registered voters selected from non-probability online panels. More details are available about AP VoteCast’s methodology here.

KFF/AP VoteCast: Abortion and Other Health Care Issues in the 2024 Election

This interactive dashboard provides KFF’s insights from AP VoteCast election polling of the 2024 election, focusing on how abortion, including abortion-related ballot measures, and other health care issues have played into voters’ decisions.

KFF examined the role that abortion policy and abortion-related state ballot initiatives, as well as the economy and health care costs, played in the 2024 election. In partnership with The Associated Press (AP), KFF added supplemental questions to AP VoteCast, a survey of the 2024 electorate, providing a deep dive into how voters were weighing health care issues as they made their decisions. These questions and KFF’s analysis shed light on the role these issues played in shaping the concerns voters brought to the ballot box, as well as their decisions about whether to vote and whom to vote for.

For additional analysis, see KFF’s full report: The Role Health Care Issues Played in the 2024 Election: An Analysis of AP VoteCast

AP VoteCast is a survey of nearly 120,000 voters conducted nationally and in 48 states, fielded between Oct. 28 and concluding as the polls close on Nov. 5. Results have been adjusted to reflect preliminary vote totals as of 10 a.m. ET on Nov. 11, 2024. 

Updated: November 22, 2024 4:00PM ET

KFF Analysis of AP VoteCast

Abortion Ballot Initiatives

Copy link to Abortion Ballot Initiatives

In the 2024 election, 10 states voted on ballot measures aimed at protecting abortion rights, including one state (Nebraska) whose ballot also included a competing measure curtailing abortion rights. Voters in seven states voted to expand abortion access, while the ballot measures to expand abortion access failed in Florida, South Dakota, and Nebraska. More details about the different state ballot measures are available at this KFF Ballot Tracker.

About half of voters in each of these states said the outcome of the abortion ballot initiative was “very important” to them. In all 10 states, more than half of those who voted in favor of protecting abortion access said the outcome of the measure was “very important” to them. In most states, proponents of abortion access were more likely than opponents to say the outcome was very important.

Voters in South Dakota and Nebraska voted against expanding abortion access in their states. In both of those states, a majority of voters on both sides of the ballot measure viewed its outcome as “very important” – suggesting that supporters and opponents were similarly motivated by the measures’ results. In Florida, the ballot measure failed to reach the 60% threshold needed in order to pass. About six in ten Florida voters who voted in favor of expanding abortion access said the outcome of the ballot measure was important to them compared to about half of voters who opposed the measure.

Abortion-Related State Constitutional Amendment Measures in the 2024 General Election
A Majority of Voters Who Favored Protections for Abortion Access Said The Initiatives In Their States Were Important to Them; Fewer of Those Who Opposed Said They Were Important

In each of the states where abortion was on the ballot in 2024, about one in four voters said abortion was the single most important issue to their vote, similar to the share of voters nationally who said so. About four in ten voters in these states said abortion policy had a “major impact” on whether they voted, and more than half said it had a major impact on which candidates they supported this election.

Across States With Abortion on The Ballots, About One in Four Voters Said Abortion Was the Most Important Factor in Their Vote; At Least Half Said Abortion Had an Impact on Who They Supported

President-elect Donald Trump won key electoral victories in four states where voters also chose to expand or protect abortion access: Arizona, Nevada, Montana and Missouri. Across all ten states with abortion ballot measures, Trump garnered small but important shares of votes from those who voted in favor of ballot measures protecting abortion access, including support from about three in ten of those who voted in favor of abortion access in Missouri and Montana and in the battleground states of Nevada and Arizona.

In States With Abortion on the Ballot, Notable Share of Those Who Voted to Protect Abortion Rights Also Voted for Trump

Arizona and Nevada: Key Swing States with Abortion Ballot Initiatives

Arizona and Nevada are two battleground states where President-elect Trump won at the same time as a majority of voters passed ballot measures expanding abortion access.  

Arizona’s Proposition 139 passed with a majority of voters voting “Yes.” It proposed enshrining the right to abortion in the state constitution, allowing abortion until fetal viability or at any stage in cases where the pregnant person’s health or life is at risk. This ballot measure will codify protections similar to those under Roe v. Wade before it was overturned. Arizona law currently bans abortions after 15 weeks. This proposition was supported by a majority of voters in the state across age, gender, race, and ethnicity. The vast majority of Democratic Arizona voters and those who voted for Kamala Harris voted Yes on the proposition. Most Republicans and those who voted for Donald Trump voted against the proposition, yet about four in ten in both groups voted in favor of the measure.

AZ BALLOT1 + IMPTBALLOT
AZ imptabortion turnout cand

Nevada’s ballot featured the Right to Abortion Initiative, Question 6, which sought to affirm a constitutional right to abortion up to fetal viability and after viability in cases where the pregnant person’s life or health is endangered. The measure passed receiving support from over nine in ten Nevada Democrats and those who voted for Harris, as well as nearly half of Republicans and those who voted for Trump.

Ballot measures have to pass in two successive general elections in Nevada. This measure will have to appear on the ballot again in 2026 before the proposed amendment is added to the Nevada constitution.

NV BALLOT1 + IMPTBALLOT
NV imptabortion turnout cand

Many Arizona and Nevada Voters Voted to Expand Access to Abortion, While Supporting Republican Candidates for Senate and President

Roughly one quarter to one third of voters in Arizona and Nevada who voted “Yes” on their state’s ballot measures to protect access to abortion voted for Republican candidates for senate and Trump for president. The vast majority of those who voted “No” on these measures voted for Republican candidates as well.

AZ Vote Choice by Ballot Measure
AZ Vote Choice by Ballot Measure SEN
NV Vote Choice by Ballot Measure
NV Vote Choice by Ballot Measure SEN

Spotlight on Florida

Amendment 4, the “Florida Right to Abortion Initiative,” failed to meet the 60% vote threshold required to pass. It would have amended the state constitution to enshrine the right to abortion until the point of fetal viability, or to protect the mother’s health. Currently, Florida has a 6-week abortion ban. The passage of Amendment 4 in Florida would have provided a legal pathway to abortion for women in the region currently considered an abortion desert.

While the ballot measure failed to reach 60% support, large majorities of independent and Democratic voters in the state supported it, as did a majority of both men and women and voters across race and ethnicity. While most Republicans and Trump voters opposed the measure, about four in ten Republicans and about a third of those who voted for Trump voted in favor of the proposition.

FL BALLOT1 + IMPTBALLOT
FL imptabortion turnout cand

Spotlight on Nebraska

Nebraska was the only state in this election to have two competing abortion-related ballot measures. One would have established a fundamental right to abortion until fetal viability or when needed to protect the life or health of the pregnant person at any time during pregnancy/. The second measure, which passed, amended the constitution to ban abortions past the first trimester, except in medical emergencies or when the pregnancy is a result of rape or incest. Currently, abortions are legal in Nebraska up to 12 weeks of pregnancy.

Support for the two ballot measures was largely divided along partisan lines, with nine in ten Democrats supporting the Right to Abortion Initiative and about three-quarters of Republicans supporting the measure restricting abortion access. Among independent voters, a larger share supported the measure expanding abortion access than the one restricting abortion access.

NE BALLOT1 + IMPTBALLOT
NE imptabortion turnout cand

Abortion as a Voting Issue

Copy link to Abortion as a Voting Issue

As it was in the 2022 midterm election, abortion continued to be a motivating factor for a notable share of voters in 2024. Overall, about a quarter of voters said abortion was the “single most important” factor to their vote, similar to the share in 2022 who said the Supreme Court overturning Roe v. Wade was the most important factor. In addition, about four in ten voters in 2024 said abortion had a major impact on their decision about whether to turn out, and over half said it had a major impact on which candidates they supported.

For voters overall, abortion ranked behind democracy and inflation as a motivating factor but was on par with “the situation at the U.S.-Mexico border.” Democrats were more than twice as likely as Republicans to say abortion policy was the most important factor to their vote.

Abortion Remains a Motivating Factor Among Voters 
Three in Ten Voters Say Abortion Was the Single Most Important Factor to Their Vote, With Larger Shares Citing High Prices For Essential Goods and the Situation at the U.S.-Mexico Border

The impact of abortion policy on voters’ decisions stood out among certain groups of voters, namely Black voters, younger voters, Democrats, and women – all of whom cited abortion policy as a motivating factor in higher shares than their peers. Additionally, among women voters, large shares of those who are younger, Black, or Democrats cited abortion as the single most important factor to their vote or said it had a major impact on their decision to turnout or the candidate they voted for.

Larger Shares of Women and Black Voters Say Abortion Impacted Their Vote
A Majority of Women Under Age 50 Say Abortion Was the Single Most Important Factor to Their Vote and Had  a Major Impact on Their Decision to Vote and Whom They Voted For
About Three in Ten First Time Voters Say Abortion Was the Most Important Factor to Their Vote
Notable Shares of Republicans Who Voted Harris Say Abortion Policy Was The Most Important Factor Driving Their Vote

VP Harris achieved high levels of support among voters who said abortion was the single most important factor to their vote as well as those who prioritized the future of Democracy. President-elect Trump won a larger share of voters who cited high prices and the U.S.-Mexico border as the most important factors in their vote. While a large majority of voters who said they want abortion to be legal in “all cases” voted for Harris, Trump gained notable support among those who want abortion to be legal in “most cases.”

A Majority of Voters Who Say Abortion Was Their Top Issue Voted Harris, While Most Voters Citing High Prices of Essential Goods Went With Trump
One-Third of Voters Who Say Harris Has a Better Handle of Abortion Policy Nonetheless Voted for Trump

Health Care Costs and Other Issues

Copy link to Health Care Costs and Other Issues

When asked to choose the most important issue facing the country, about four in ten voters chose the economy and jobs, followed by about two in ten who chose immigration. Abortion and health care were next on the list, with about one in ten voters citing each respectively. The economy and jobs topped the list for both Trump voters and Harris voters, with immigration ranking second among Trump voters and abortion ranking second among Harris voters.

With the economy top of mind, health care costs were an integral part of voters’ economic concerns. About half said they were “very concerned” about their own health care costs, with an additional three in ten saying they were “somewhat concerned.” This is somewhat behind the two-thirds of voters who said they were “very concerned” about the cost of food and groceries, and similar to the shares who said they were “very concerned” about the cost of housing and gas. Regardless of partisanship, half or more voters said they were “very concerned” about the cost of these items, with the exception of gas, which generates almost twice as much concern among Republicans as among Democrats.

ISSUES2024option1
BUDGEToption1
BUDGEToption2

When it comes to who voters trust to handle different issues, President-elect Trump had a clear advantage over Vice President Harris on the economy, immigration, and crime with about half of voters favoring Trump on these issues compared to about four in ten choosing Harris. On the other hand, Harris had a clear advantage on abortion policy, health care, and climate change, with about half preferring Harris and between three and four in ten preferring Trump on these issues.

BETTERHAoption3

Despite the fact that Harris had an advantage on who voters trust to handle health care, Trump won a majority of votes among those with the greatest concern about their personal expenses, including half of voters who said they were “very worried” about their own health care costs. Trump also garnered majority support among voters who were very worried about the costs of gas, food, and housing.

Donald Trump Garners Majority Support Among Voters Who Were Most Worried About Personal Economic Expenses

 When asked about the role government should play on key health care issues going forward, the largest share said they want more government action on lowering the price of prescription drugs, with three in four saying the government should be “more involved.” About six in ten also support greater government involvement when it comes to ensuring Americans have health care coverage and forgiving medical debt. Half of voters said the government should be “more involved” in ensuring that children are vaccinated for childhood diseases. On each of these topics, one in five or fewer said the government should be “less involved,” and similar shares said the government’s current involvement is “about right.”

On these topics, there was some partisan agreement, with majorities of Democrats, Republicans, and independents saying the government should be “more involved” in lowering the cost of prescription drugs. However, on the other topics, there were stark partisan divides, with about four in ten or fewer Republicans saying the government should be “more involved” and large majorities of Democrats wanting more involvement.

HEALTHCAREGOVToption1
HEALTHCAREGOVToption2

As of 2024, 41 states (including DC) have adopted Medicaid expansion under the Affordable Care Act while 10 states have not. In three of these non-expansion states, Alabama, Kansas and Mississippi, voters were asked whether they would favor or oppose expanding the program in their state. In each of these states, seven in ten or more voters overall said they would favor expanding Medicaid in their state, including majorities of Democrats and Republicans.

MEDICAID

Methodology and Additional Resources

Copy link to Methodology and Additional Resources

AP VoteCast is a survey of nearly 120,000 voters conducted nationally and in 48 states by NORC at the University of Chicago for The Associated Press, Fox News, PBS NewsHour, and The Wall Street Journal beginning on Oct. 28 and concluding as polls close on Nov. 5, 2024. AP VoteCast conducts interviews with a random sample of registered voters drawn from state voter files and combines them with interviews from self-identified registered voters selected using nonprobability approaches. It also includes interviews with self-identified registered voters conducted using NORC’s probability-based AmeriSpeak panel, which is designed to be representative of the U.S. population. Interviews are conducted in English and Spanish.

Note: Party labels include partisan leaning independents.

Find more details about AP VoteCast’s methodology at https://www.ap.org/content/politics/elections/ap-votecast/about.

For media inquiries contact KFFMedia@kff.org

….

Medicaid Coverage of and Spending on GLP-1s

Published: Nov 4, 2024

GLP-1 (glucagon-like peptide-1) drugs have been used as a treatment for type 2 diabetes for over a decade, but newer forms of these drugs have gained widespread attention for their effectiveness as a treatment for obesity. While these drugs have provided new opportunities for obesity treatment, they have also raised questions about access to and affordability of these drugs. These drugs are expensive when purchased out of pocket, and coverage in Medicaid, ACA Marketplace plans, and most large employer firms remains limited, though a number of state Medicaid programs and other payers are re-evaluating their coverage policies. Expanding Medicaid coverage of these drugs could increase access for the almost 40% of adults and 26% of children with obesity in Medicaid. At the same time, expanded coverage could also increase Medicaid drug spending and put pressure on overall state budgets. In the longer term, however, reduced obesity rates among Medicaid enrollees could also result in reduced Medicaid spending on chronic diseases associated with obesity, such as heart disease, type 2 diabetes, and types of cancer. This brief discusses Medicaid coverage of GLP-1s, examines recent trends in Medicaid prescriptions and gross spending on GLP-1s, and explores the potential implications of expanding coverage obesity drugs for Medicaid programs.

Does Medicaid cover GLP-1s for obesity treatment?

States can decide whether to cover obesity drugs under Medicaid. Under the Medicaid Drug Rebate Program, Medicaid programs must cover nearly all of a participating manufacturer’s Food and Drug Administration (FDA)-approved drugs for medically accepted indications. However, weight-loss drugs are included in a small group of drugs that can be excluded from coverage1 . Though the statutory exception refers to agents used for “weight loss”, “obesity drugs” is used to refer to this group of medications in this analysis. The FDA has approved three GLP-1s for the treatment of obesity, Saxenda (liraglutide), Wegovy (semaglutide), and Zepbound (tirzepatide), and state Medicaid coverage of these is optional. However, Medicaid programs have to cover formulations to treat type 2 diabetes, including Ozempic (semaglutide), Rybelsus (semaglutide), Victoza (lirglutide), and Mounjaro (tirzepatide). Wegovy, as of March 2024, must also be covered for preventing heart attacks or strokes in adults with cardiovascular disease; however, this expanded label indication does not impact this analysis as it only includes data through 2023. Notably, all obesity drugs are covered for children under Medicaid’s Early and Periodic Screening, Diagnostic and Treatment (EPSDT) benefit, though it is less clear how states are implementing and covering in practice.

Obesity drug coverage in Medicaid remains limited, with 13 state Medicaid programs covering GLP-1s for obesity treatment as of August 2024 (Figure 1). Twelve states in KFF’s annual budget survey reported coverage of GLP-1s for obesity treatment under FFS as of July 1, 2024, and North Carolina reported adding coverage in August of 2024. All 12 states that reported coverage of GLP-1s as of July 1, 2024 also reported that utilization control(s) applied, with the most common being prior authorization (11 of 12 states) and/or BMI requirements (11 of 12 states). Eleven of the 12 states reported covering all three GLP-1s currently approved for the treatment of obesity (Saxenda, Wegovy, or Zepbound). While the survey only asked about FFS coverage, MCO drug coverage must be consistent with the amount, duration, and scope of FFS coverage. MCOs, however, may apply differing utilization controls and medical necessity criteria unless the state’s MCO contract specifies otherwise. Coverage among other payers also remains limited. Recent KFF analysis also found most large employer firms do not cover GLP-1 drugs for weight loss, coverage in ACA Marketplace plans remains limited, and coverage in Medicare is prohibited.

Thirteen States Covered GLP-1s for Obesity Treatment as of August 2024

How have Medicaid prescriptions and gross spending on GLP-1s changed in recent years?

The number of Medicaid prescriptions and gross spending on GLP-1s have increased rapidly in recent years, with both nearly doubling from 2022 to 2023. Overall, from 2019 to 2023, the number of GLP-1 prescriptions increased by more than 400%, while gross spending increased by over 500%. Spending per prescription before rebates reached more than $900 per prescription in 2023. Those prices and spending numbers do not account for rebates, and states are likely receiving substantial rebates on these brand drugs. While rebate data for specific drugs is not publicly available, Medicaid and CHIP Payment and Access Commission (MACPAC) analysis of FY 2020 data found statutory rebates accounted for 61.6% of gross Medicaid spending on brand drugs. Also, amid growing criticism of the cost of their drugs, Novo Nordisk, the company that creates Ozempic and Wegovy, has said that rebates and other fees (across all payers) account for about 40% of the cost of the two drugs. The GLP-1s in this analysis still account for relatively small shares of the total number of Medicaid prescriptions and spending before rebates, though the shares are growing. By 2023, these drugs accounted for 0.5% of all Medicaid prescriptions (up from 0.01% in 2019) and 3.7% of all gross Medicaid spending (up from 0.9% in 2019).

Medicaid Prescriptions and Gross Spending on GLP-1s has Increased Rapidly in Recent Years

Specifically, increased utilization of Ozempic, Wegovy, and Mounjaro have contributed substantially to recent growth. Prescriptions and spending on Ozempic, approved to help control blood sugar levels for adults with type 2 diabetes in 2017 (Table 1), have grown considerably from 2019 to 2023, nearly doubling every year since 2019. Looking from 2022 to 2023, the latest year of data available, Wegovy (first approved in 2021) and Mounjaro (approved in 2022) also saw substantial growth, with prescriptions and gross spending for both drugs increasing twelvefold or more. This analysis includes GLP-1 formulations approved for obesity treatment as well as the same formulations approved for type 2 diabetes (for more information on how GLP-1s are identified in this analysis, see Methods). From Medicaid data publicly available, there is no way yet to disentangle how much of the growing use of GLP-1s is related to treatment for diabetes versus obesity, or a combination of both. In addition, the popularity and increased demand for GLP-1s has led to drug shortages, sometimes causing people to switch products or ration doses or sometimes leaving individuals without access to needed prescriptions. This may have implications for drug trends, though the FDA recently reported that GLP-1 supplies are beginning to stabilize.

U.S. FDA Approvals of Select GLP-1s

How may the coverage landscape of GLP-1s for obesity treatment change?

Many state Medicaid programs are considering covering obesity drugs in the future but are concerned about the cost implications. KFF’s annual budget survey found that, among those states that do not currently cover obesity drugs, half reported they were considering adding coverage, with a few states reporting plans to add or expand coverage in FY 2025 or later. When asked about the key factors contributing to their obesity medication coverage decision, almost two-thirds of responding states mentioned cost, though states are also weighing a number of other factors including the need for legislative action, adherence concerns, clinical criteria development, and potential side effects. Conversely, 4 in 10 states noted that positive health outcomes and longer-term savings on chronic diseases associated with obesity were key factors in their decision to cover or consider covering in the future along with increasing enrollee access and health equity, recommendations from providers, and ability to negotiate supplemental rebate agreements. States are likely considering various cost containment strategies for these drugs and may even be re-evaluating their broader approach to obesity treatment, including the use of obesity medications along with other treatments such as nutritional counseling or behavioral therapy. Obesity is caused by a multitude of complex factors, and uptake of GLP-1s could improve health but would not address all of the underlying contributors to obesity.

Figure 3 is titled "State Medicaid Programs Reported Cost Was a Major Factor in Obesity Drug Coverage Decisions" and divides different parts of a rectangle into Reasons for Covering and Reasons for Not Covering.

Methods

Number of Prescriptions and Gross Spending Data: This analysis uses 2019 through 2023 State Drug Utilization Data (SDUD) (downloaded in October 2024). The SDUD is publicly available data provided as part of the Medicaid Drug Rebate Program (MDRP), and provides information on the number of prescriptions, Medicaid spending before rebates, and cost-sharing for rebate-eligible Medicaid outpatient drugs by NDC, quarter, managed care or fee-for-service, and state. It also provides this data summarized for the whole country. The data do not include information on the number of days supplied in each prescription. CMS has suppressed SDUD cells with fewer than 11 prescriptions, citing the Federal Privacy Act and the HIPAA Privacy Rule. This analysis used the national totals data because less data is suppressed at the national versus state level.

Identifying GLP-1s: GLP-1 agonists included in the analysis were approved for treatment of obesity, Saxenda (liraglutide), Wegovy (semaglutide), Zepbound (tirzepatide) and corresponding formulations that may potentially be used off-label for treatment of obesity, Mounjaro (tirzepatide), Ozempic (semaglutide), Rybelsus (semaglutide), Victoza (liraglutide), mirroring another recent KFF analysis. Other GLP-1 agonists with active ingredients only approved for treatment of diabetes that have less potential for off-label weight loss use (such as Bydureon BCise, Trulicity) were not included.

Limitations: There are a few limitations to the estimates of Medicaid prescriptions and gross spending found in this analysis, including:

  • This analysis examines the number of Medicaid prescriptions in the data and does not adjust for days supplied by each prescription.
  • Gross spending and spending per prescription numbers do not account for rebates.
  • The SDUD are updated quarterly; a new quarter of data is typically released, and the prior five years of data are also updated. This means utilization and gross spending totals can vary depending on when the data is downloaded, and totals may not match other outside sources or prior KFF analysis for this reason.
  1. Drugs that may be excluded from coverage under the MDRP include drugs used for: a) anorexia, weight loss, or weight gain, b) promoting fertility, c) cosmetic purposes or hair growth, d) symptomatic relief of cough and colds, e) prescription vitamins and mineral products except prenatal vitamins and fluoride preparations , f) nonprescription drugs, g) a manufacturer’s covered outpatient drug in which tests and monitoring services have to be purchased from that manufacturer, h) sexual or erectile dysfunction unless used to treat a condition. For more information see, 42 U.S.C. § 1396r-8. ↩︎

Understanding Racial and Ethnic Identity in Federal Data and Impacts for Health Disparities

Published: Nov 1, 2024

Introduction

How we ask for, analyze, and report information on race and ethnicity affects our ability to understand the racial and ethnic composition of our nation’s population and our ability to identify and address racial disparities in health and health care. The accuracy and precision of such data have important implications for identifying needs and directing resources and efforts to address those needs. Race, ethnicity, and national origin are distinct concepts that are social constructs, and how they have been defined, identified, and/or categorized have evolved over time. This brief provides an overview of how the concepts of race, ethnicity, and nationality have been defined and measured by the federal government through the U.S. Census Bureau and the Office of Management and Budget (OMB) over time and the implications for health disparities. We acknowledge that this brief does not cover all the nuances and complexities of the topic of racial and ethnic identity and that there is variation in how people think, talk, and relate to race, ethnicity, and national identity.

What do Race, Ethnicity, and National Origin Represent?

The concepts of race, ethnicity, and national origin and their fluidity are reflective of these identities being social constructs. While different, the two concepts of race and ethnicity are connected. Race is defined as a social political category primarily based on physical characteristics such as skin color, and ethnicity is a social category primarily defined by culture, language, and history. National origin is defined by the country or region that an individual or their ancestors originate from. In a 2024 update, federal standards for collecting and reporting racial and ethnic data combined previously separate questions about race and Hispanic ethnicity into a single question, and a new category was added for Middle Eastern or North African (MENA) people. The updated federal standards utilize seven racial and ethnic categories that are identified with the following terms (see Appendix for more details):

  • American Indian or Alaska Native (AIAN)
  • Asian
  • Black or African American
  • Hispanic or Latino
  • Middle Eastern or North African (MENA)
  • Native Hawaiian or Pacific Islander (NHPI)
  • White

There are distinctions in the meanings of and community preferences for different terms, such as Black and African American and Hispanic, Latino, or Latinx. Polling data over time show that half of those who trace their roots to Spanish-speaking Latin America and Spain have consistently said they have no preference for Hispanic or Latino, but that when asked to choose one term over another, Hispanic has been preferred to Latino. Surveys further show a preference for country-of-origin labels (such as Mexican, Cuban, or Ecuadorian) versus broader pan-ethnic terms. A 2023 survey of U.S. Hispanic adults found that 47% of U.S. adults who self-identify as Hispanic have heard of the term Latinx, and just 4% say they use it to describe themselves. A 2021 Gallup Poll similarly found that most people favor the use of the term Hispanic and few (4%) prefer Latinx. Polling data also show that most Black Americans do not have a preference between Black and African American when asked which term they would rather people use to describe their racial group.

A large and growing share of people identify with more than one of the previous federal racial and ethnic categories (which do not reflect the 2024 changes to the standards). KFF analysis of 2023 American Community Survey (ACS) data finds that about eight in ten (81%) AIAN and two thirds (66%) of NHPI people identify with more than one racial and/or ethnic group. About one in five Asian (20%), Black (18%), and White (21%) people also identify with more than one racial and/or ethnic group (Figure 1). Under previous standards which had separate questions for Hispanic ethnicity and race, people of Hispanic ethnicity may be of any race.

Majorities of AIAN and NHPI People Identify With More than One Race or Ethnicity

Racial identity is important to how people think about themselves, particularly for Black and Hispanic people. In a recent KFF survey, a majority of Black (83%) and Hispanic (70%) people said that their racial identity is very or extremely important to how they think about themselves. About half of Asian (51%) people say the same. Data were unavailable for other racial and ethnic groups (Figure 2).

A Majority of Black, Hispanic, and Asian Adults Say Their Racial Identity is Important to Them

How Have Measures of Race, Ethnicity, and National Origin Evolved Over Time?

Since its inception in 1790, the U.S. census has collected information on race and ethnicity that has informed policy, the allocation of resources, and scientific research on different groups within the country. The race and ethnicity data collected by the census is also used to evaluate the effectiveness of government programs and policies as well as to measure and ensure fairness, equity, and compliance with anti-discrimination laws and policies. In 1977, OMB established federal standards for race and ethnicity data through Statistical Policy Directive No. 15 to standardize how data are collected and reported at the federal level. The OMB standards guide not only the census but also other federal surveys, ensuring consistency across government data collection efforts. The census aligns its racial and ethnic categories with these standards, though it occasionally adjusts them to reflect evolving understandings of identity. The census recognizes that race is a social construct, stating that “The racial categories included in the census questionnaire generally reflect a social definition of race recognized in this country and not an attempt to define race biologically, anthropologically, or genetically. In addition, it is recognized that the categories of the race item include racial and national origin or sociocultural groups.”

How the census has collected and categorized information on race and ethnicity has evolved significantly over time, reflecting social and political shifts and the growing diversity of the U.S. population (Figure 3).

U.S. Census Collection of Racial and Ethnic Data Have Evolved Over Time
  • Between 1790 and the mid-20th century, race and ethnicity information was collected via enumerators who conducted an interview for each household. Enumerators identified individuals’ racial and ethnic identities through their observations based on criteria that included physical characteristics, social norms and principles, national origin, and Tribal affiliation. Between 1790 and 1860, the census collected information on White, Black (enslaved and free), and Other Free Persons.1 
  • Additional categories were added to the census in the 1800s, which were motivated by slavery and race science and maintaining rights and privileges for White people. The 1840 census introduced a new category, free colored people (including Black and mixed-race Black people). In the mid to late 1800s, mixed-race categories were added — “mulatto, quadroon, and octoroon”. The definitions of these categories evolved over time, but they were based on perceived shares of Black ancestry and are no longer used. American Indian people who renounced Tribal rule, exercised the rights of U.S. citizens, and paid taxes were counted in the census for the first time in 1860. Prior to that, the Constitution excluded American Indian people who lived on reservations, lived on unsettled land, or were not taxed from being enumerated. By the late 1800s, the census began collecting national origin information, coinciding with the entry of Chinese migrant workers.
  • Amid the rise of Jim Crow laws, the 1930 census dropped mixed-race categories and focused on the collection of single race data. Up until 1970, census enumerators classified people of mixed-race heritage based on specific rules: those with White ancestry and another racial group were classified as “non-White,” and people with two “non-White” ancestries were classified by the father’s race. If a person was Black or AIAN, their racial identity was instead based on blood quantum rules. Blood quantum measures the percentage of American Indian or Alaska Native ancestry or blood that an individual has and is used to determine Tribal affiliation. People who were both Black and White were categorized as Black under the one-drop rule, which meant that a person with any percentage of Black ancestry or blood would be counted as Black.
  • Also during this period, more disaggregated Asian national origin data were collected, and Mexican national origin data were collected for the first time. Before 1930, Mexican Americans were classified as White. There was an organized movement to remove the Mexican category and reclassify Mexican people as White. Mexican people were reclassified as White in the 1940 census until 1970 when the census added the Hispanic/Latin origin category to a version of the questionnaire that was sent to a small share of the U.S. population.
  • In the mid-20th century, the census shifted to allow respondents to self-identify their own race and/or ethnicity. Respondents were instructed to select the race that they most closely identified with from the single-race categories available or to use the father’s race if they were uncertain. Further, the addition of two new states in 1959, Alaska and Hawaii, prompted the addition of new categories to the census in 1960; Eskimo, Aleut, Hawaiian, and part-Hawaiian.
  • In 1980, the census added a separate question on Hispanic ethnicity, following lobbying efforts from Hispanic advocacy groups in the 1970s in response to undercounting of the Hispanic population in the census. The Asian Pacific Islander (API) category was also added at this time in response to lobbying by Asian American legislators and advocacy groups, who similarly found that Asian American and Pacific Islander people were being undercounted. The API indicator included nine detailed Asian and Pacific Islander origin categories.
  • In 1997, the OMB revised its race and ethnicity standards to allow individuals to select more than one racial category, reflecting a growing recognition of multiracial identities. This revision aimed to improve data accuracy and better capture the diversity of the U.S. population. Other open-ended questions on ancestry or ethnic origin were added that led to broader ethnic identification among American Indian people with a large share of the population claiming some Indian ancestry even if they didn’t identify racially as American Indian. This may have reflected increased American Indian pride movements that prompted people with multiracial American Indian heritage to identify with their American Indian ancestry.
  • The second major change that impacted people with mixed-race heritage occurred in 2000, when the census allowed people to select more than one racial category. This change was driven by the multiracial movement of the 1980s and 1990s. In 2000, the census combined the American Indian and Alaska Native categories to form the AIAN category to capture original peoples with origins in North, Central, and/or South America. It also asked respondents to provide the names of their enrolled or principal Tribes. Additionally, it began collecting information separately on NHPI people, which it defined as people having origins in any of the original peoples of Hawaii, Guam, Samoa, or other Pacific Islands.
  • The 2020 census allowed people to include detailed information about their race and/or ethnicity in addition to marking multiple race categories. The census now allows respondents to provide write-in responses describing their race and ethnicity, with clearer instructions and examples based on the largest population groups for each category. The multiracial population grew significantly between 2010 and 2020, with the U.S. Census Bureau indicating that changes in the design, data processing, and coding of the race and ethnicity questions over this time period (including the write-in responses) contributed to this growth, highlighting the impact of these decisions. This change also led to more people of MENA heritage providing detailed information about their ancestry, whereas before they were aggregated into the White category.
  • In 2024, OMB released revised Standards for Maintaining, Collecting, and Presenting Federal Data on Race and Ethnicity to better reflect the growing diversity of the U.S. population. The revisions include using a single combined question for race and ethnicity, adding MENA as a minimum category, clarifying instructions for individuals to select multiple racial and ethnic categories that represent their identity, and requiring collection of more detail beyond the minimum categories. In addition, the standards require that data tabulation procedures result in the production of as much information on race and/or ethnicity as possible, including data for people reporting multiple racial and/or ethnic categories. These changes will impact how race and ethnicity data are collected in the census, as the U.S. Census Bureau has to adhere to the OMB standards on race and ethnicity.

While the census and OMB standards have been the standard for measuring race and ethnicity in the U.S. government at the federal level, states, localities, and other organizations often differ in their measurement of racial and ethnic data. For example, states vary in the number of categories they use to collect race and ethnicity data, as well as how these variables are named and combined. In Oregon, as part of an effort to eliminate health inequities, Oregon’s Health Authority has taken steps to accurately and expansively report demographic data. This includes collecting detailed and more granular race, ethnicity, language, and disability data. Oregon collects data for 42 race and ethnicity groups, answers are self-reported, and respondents are given the opportunity to select more than one race and/or ethnicity. Some states have narrower race and ethnicity categories, combining groups such as Asian and Native Hawaiian or Pacific Islanders into one group, API.

How Do Measures of Race, Ethnicity, and National Origin Impact Policies and Health Disparities?

How race, ethnicity, and nationality have been defined and measured has important implications for health disparities. Historically, these measures affected who can access health care, social services, education, and employment opportunities and have reinforced racial misinformation that limit access to resources for marginalized groups. Narrow and inconsistent race and ethnicity categories have obscured inequities and made it more difficult to meet the diverse needs of different populations. Conversely, data on race and ethnicity have also been used to address disparities by informing policies and interventions and to ensure compliance with antidiscrimination laws.

There are historic examples of racial and ethnic data being used in ways that have worsened and perpetuated racism and disparities. For example, in 1840, an “insane or idiot” category was added to the census to identify the number of people with mental disabilities in the country. However, the census enumerators disproportionately overcounted free colored people as “insane” to support the inaccurate idea that “freedom drove Black people mad.” Advocates of slavery used the 1840 census data to justify that slavery was beneficial for the health and well-being of Black people. In 1850, scientists petitioned the addition of a new racial category, “Mulatto” (people with mixed Black ancestry),  to study the health of multiracial enslaved people. Census data from this period contributed greatly to scientific racism. Scientists used this data to suggest people of color were inferior to White people, test theories of polygenism, and codify racial hierarchies. As the multiracial population grew, so did ideologies surrounding the rules of hypodescent, under which multiracial individuals are assigned the race of the parent from the marginalized racial group. This included the one-drop rule, which required that anyone with a discernible trace of African ancestry be considered Black. This concept ensured that the children of enslaved Black people and their White enslavers would remain slaves. Blood quantum categorization eventually led to the codification of the one-drop rule in some states during the Jim Crow era as a means of supporting segregation. Similarly, the census began collecting information on American Indian blood quantum in 1930. Blood quantum was not only used to determine Tribal membership but was also used to study any perceived biological and intellectual differences between American Indian and White people.

In addition, race has historically and continues to play a role in medical teaching and clinical decision making within health care. Historically, the medical and scientific community used race to explain differences in disease prevalence and outcomes, contributing to misperceptions about biological differences by race that were used to justify mistreatment. Within U.S. medical curricula, the concept of race led to since disproven theories of biological inferiority of people of color and White supremacy, which fueled an array of atrocities in medicine including the forced sterilization efforts targeting Black and Native American women, the use of Henrietta Lacks’ cells for scientific research without consent, and the infamous U.S. Public Health Service Untreated Syphilis Study at Tuskegee, among others. Today, research suggests that provider and institutional bias and discrimination are drivers of disparities and health. Race also continues to be used as a factor in some clinical algorithms, although there is growing movement to eliminate the use of race and to ensure that disparities are not perpetuated amid the growing use of artificial intelligence and algorithms to guide clinical decision making.

Conversely, racial and ethnic measures have also been used to mitigate inequities in policies, employment, health care, and other sectors. For example, the Civil Rights Movement in the mid-20th century prompted the standardization of racial and ethnic classification as well as documentation of trends in racial and ethnic discrimination. This resulted in the establishment of the OMB Statistical Policy Directive No. 15 in 1977 that has since standardized the collection of race and ethnicity data at the federal level. The collection of standardized data facilitates the ability for policymakers and institutions to identify and address areas of inequality. For instance, racial and ethnic data can inform resource allocation, ensuring communities facing systemic disadvantages receive essential services, such as health care, education, and social programs. Additionally, it can help track and mitigate racial bias and discriminatory practices in health care, employment, housing, and other social and economic domains. These data also allow for the evaluation of the effectiveness of interventions designed to reduce disparities. For example, public health programs can measure the impact of vaccinations, screenings, or outreach efforts in marginalized communities, using racial and ethnic data to refine strategies and ensure more equitable access to care.

Availability of racial and ethnic data also has impacts on efforts to address health disparities. Missing or inconsistent data on race, ethnicity, and nationality can hinder effective resource allocation and policy decision-making, particularly in efforts to address health disparities. AIAN people were excluded in early versions of the census, beginning a trend of exclusion from national data inquiry that continues to the present day. This exclusion from data and analysis has contributed to limiting the visibility and understanding of challenges faced by AIAN people and other smaller racial and ethnic groups, including NHPI people. The negative impacts of missing or incomplete data were evidenced during the COVID-19 pandemic, when inconsistencies and limitations in how states reported their data limited the ability to understand racial and ethnic disparities in COVID-19 health impacts as well as take-up of COVID-19 vaccinations. Arab Americans and people with ancestry in the Middle East or North Africa have been invisible in key datasets, resulting in a limited understanding of their health outcomes, experiences accessing health care, and engagement with the health care system. Increasing the availability of disaggregated racial and ethnic data facilitates a greater understanding of disparities in health and health care and can help focus efforts to address them. For example, while aggregate data on Asian people suggest that they fare the same or better as compared to White people across most measures of health and health care, they mask underlying disparities among smaller subgroups within the Asian community. Having more disaggregated data allows for a more nuanced understanding of people’s experiences and can facilitate focused efforts to address disparities as well as to measure impacts of interventions to address them.

As the U.S. becomes more diverse, it will be increasingly important to consider how to identify people’s identities, particularly among multiracial people. The census projects that people of color will account for over half of the population by 2050 with the largest growth occurring among people who identify as Asian or Hispanic. This shift underscores the importance of refining racial and ethnic categories to capture the complexity of modern identities. Continued adaptation of data collection and reporting methods will be important for reflecting experiences among multiracial people.

Continued efforts to further disaggregate racial and ethnic data may be important for guiding efforts to address health and health disparities. Significant data gaps persist for smaller groups, including AIAN and NHPI people, with very limited information available for subgroups of these populations. Moreover, Asian and Hispanic people are often treated as monolithic in policy discussions, but the diversity in experiences among these groups is vast, encompassing differences in national origin, language, immigration status, and socioeconomic factors that all influence health. Disaggregating data by subgroup can allow for more nuanced understanding of the challenges faced by specific groups and facilitate tailored efforts to address them. For example, the health care experiences of Asian immigrants vary in meaningful ways due to the intersections of race and ethnicity, national origin, income, and other factors that may impact access to health care services. Moreover, data are often key for justifying allocation of resources toward specific communities or groups.

Increased recognition of the intersectional nature of people’s identities and other factors that may affect their health and health care experiences may also have important implications for efforts to address disparities. For example, the combination of race, ethnicity, and gender, highlights disproportionate discrimination for certain groups. Large federal surveys collect demographic and social data, including race and/or ethnicity, gender, educational attainment, and income that can allow researchers to examine how intersectional social and economic factors shape people’s health and experiences. However, in some cases, data are limited to examine experiences by multiple factors. Beyond an individual’s racial or ethnic identity, other factors that are less routinely collected in surveys, such as self-perceived skin color, can also influence their experiences. Socially-assigned race—that is the race that others perceive someone to be—may also be a factor. For example, studies have found that Hispanic or Latino individuals who are socially perceived as White report better health outcomes than those who are perceived as Hispanic or Latino. As efforts to address health disparities continue and evolve, it will be important to consider how these other factors influence people’s experiences and outcomes.

Appendix: Examples of Race and/or Ethnicity Questions Consistent with Revised OMB Standards

Representation of a questionnaire with prompt "What is your race and/or ethnicity? Select all that apply." The options are American Indian or Alaska Native, Asian, Black or African American, Hispanic or Latino, Middle Eastern or North African, Native Hawaiian or Pacific Islander, and White.

Source: Office of Management and Budget, Revisions to OMB’s Statistical Policy Directive No. 15: Standards for Maintaining, Collecting, and Presenting Federal Data on Race and Ethnicity

Representation of a questionnaire with prompt "What is your race and/or ethnicity? Select all that apply and ener additional details in the spaces below." The options are American Indian or Alaska Native, Asian, Black or African American, Hispanic or Latino, Middle Eastern or North African, Native Hawaiian or Pacific Islander, and White. Each option has a white box to provide further context.

Source: Office of Management and Budget, Revisions to OMB’s Statistical Policy Directive No. 15: Standards for Maintaining, Collecting, and Presenting Federal Data on Race and Ethnicity

  1. Between 1790 and 1840 only the heads of free households appeared in early census records, enslaved people were not recorded by name, age, sex, or origin. They only included additional demographic data on White people. ↩︎