Poll Finding

KFF Tracking Poll on Health Information and Trust: COVID-19 Vaccine Update

Published: Aug 1, 2025

Read the news release about these poll findings.

Findings

Key Findings

  • Amid ongoing news from federal agencies about changing COVID-19 vaccine recommendations, the replacement of the Centers for Disease Control and Prevention’s vaccine advisory committee members (ACIP), and re-examination of the federal childhood vaccine schedule, there is confusion among the public about U.S. vaccine policy. While half of the public thinks Department of Health and Human Services (HHS) Secretary Robert F. Kennedy Jr. has made “major” (26%) or “minor” (26%) changes to vaccine policy in the U.S., the other half either say they “don’t know enough to say” (40%) or say no changes have been made (7%). At least three in ten adults across demographic groups and party identification say they don’t know enough about the recent changes from Kennedy to vaccine policy to describe them. In addition, half (48%) of parents are not sure if federal health agencies are currently recommending that healthy children receive a COVID-19 vaccine this fall or not.
  • Once told about the changes to U.S. vaccine policy, the public is divided by partisanship in whether they think these changes will make people safer or less safe. About two in ten adults, including 41% of Republicans, think these changes will make people safer while about one-third of adults, including most Democrats (62%) and four in ten independents (41%) say they will make people less safe. Another third of adults (31%) say they “don’t know enough to say” as to whether the recent changes to U.S. vaccine policy will make people safer or not, and about one in ten say the changes won’t make a difference.
  • Most of the public (59%) say they will either “definitely not” or “probably not” get the COVID-19 vaccine this fall – including about six in ten Republicans who say they will “definitely not” get the vaccine. Older adults and Democrats are much more likely to report that they will get the COVID-19 vaccine. About four in ten Black adults and Hispanic adults say they plan to get the COVID-19 vaccine as do 37% of White adults.
  • With most of the public reporting that they will not get a COVID-19 vaccine this fall, few are worried about the availability of the vaccine or whether it will be covered by insurance. One-third (33%) of adults are concerned that COVID-19 vaccines won’t be available to them this fall, while a third (34%) of insured adults are also worried that their insurance won’t cover a shot. Concern about availability and coverage are tied to vaccine intention, with those who plan to get the vaccine much more likely to be concerned that it might not be available to them (66%), including specific demographic groups who are more likely to get vaccinated such as older adults and Democrats.
  • Personal doctors or health care providers remain the most trusted source for information about vaccines among asked sources, with eight in ten (83%) adults who say they trust their own doctor at least “a fair amount.” Smaller shares of the public, but still majorities trust their local public health department and the U.S. Centers for Disease Control and Prevention, or CDC, to provide information on vaccines, though the share who say so has been steadily in decline since September 2023. Fewer continue to say they trust HHS Secretary Robert F. Kennedy Jr. to provide information on vaccines, with about four in ten (37%) saying they trust him at least a fair amount, unchanged since his appointment in April of this year.
  • About half of the public have confidence in agencies like the CDC and Food and Drug Administration (FDA) to ensure the safety and effectiveness of vaccines approved for use in the U.S. (49%), while less than half say they have at least some confidence in the agencies to make decisions based on science rather than the personal views of agency officials (42%), or act independently, without interference from outside interests (37%). Democrats continue to be more confident in federal health agencies than Republicans to ensure the safety and effectiveness of vaccines.

Awareness of Changes to Vaccine Policy

Since his appointment as Secretary of Health and Human Services, Robert F. Kennedy Jr. has made several headlines about changing vaccine recommendations, leaving many confused about the scope of changes to U.S. vaccine policy and unsure of how these changes might affect people.

About half (52%) of the public are aware that RFK Jr. has made changes to U.S. vaccine policy, with about a quarter describing them as “major changes” (26%) or “minor changes” (26%). Four in ten adults say they don’t know enough about the changes to say whether they are “major” or “minor.” In addition, another 7% are unaware that changes have been made.

Whether the public views the changes as “major” or “minor” is largely partisan, with Democrats more likely to say they are “major” changes while Republicans describe them as “minor” changes. About four in ten (39%) Democrats say the changes that have been made to U.S. vaccine policy are “major,” compared to a quarter (25%) of independents and one in six (16%) Republicans. Nearly four in ten Republicans describe the changes as “minor,” compared to a quarter of independents and 18% of Democrats.

Young adults and those without a college degree are more likely to report that they don’t know enough about the issue to say whether or not the Secretary of HHS has made changes to vaccine policy. About half of those ages 18-29 (47%) and those without a college degree (45%) report that don’t know enough to say about changes to vaccine policy, compared to smaller shares of older adults and those with a college degree or higher.

With RFK, Jr. focusing attention on the childhood vaccine schedule, about half of parents are aware that changes have been made but the other half of parents are either unaware that changes have been made (9%) or report they don’t know enough to say (39%). Similar to all adults, how parents described the scope of the changes is largely partisan with Democratic-leaning parents describing them as major changes, and Republican-leaning parents describing them as minor changes.

Partisans Differ in How They View HHS's Changes to Vaccine Policy, Large Shares Across Groups Say They Don't Know Enough To Characterize the Scope of Changes

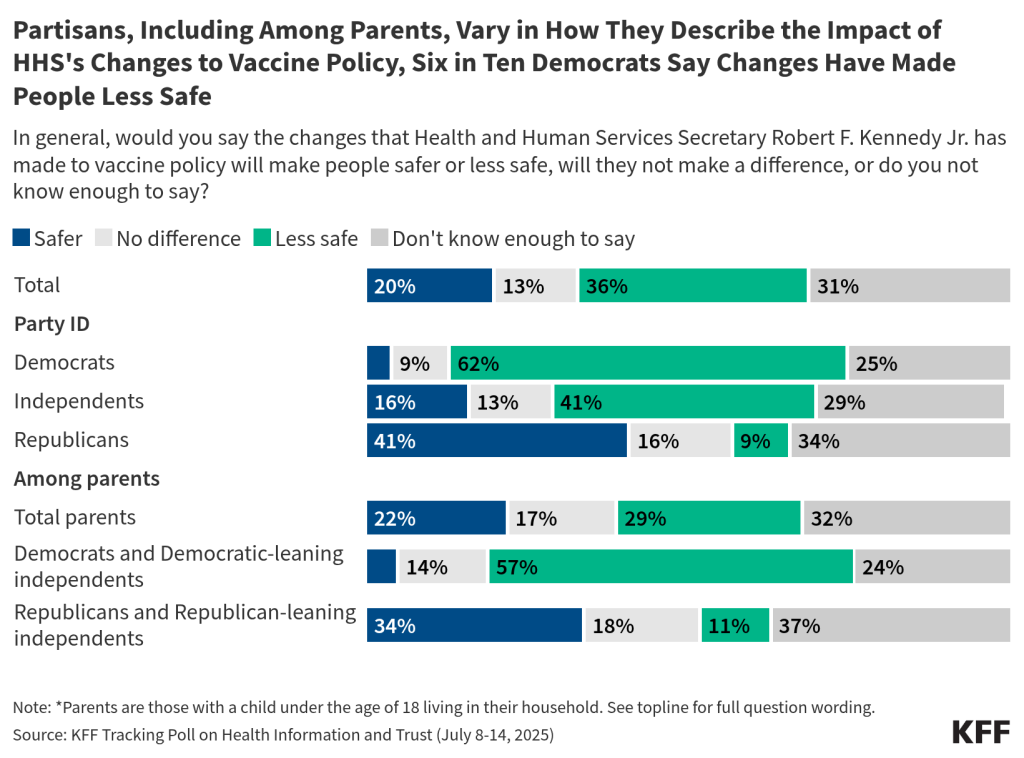
In light of the recent changes to policy, a third (36%) of the public say the changes that HHS Secretary Robert F. Kennedy Jr. has made to vaccine policy will make people less safe while a smaller share (20%) say the changes to vaccine policy will make people safer. Similar to overall awareness of the changes, a substantial share (31%) say they don’t know enough about the recent changes to say whether they will make people safer or less safe. An additional one in ten (13%) say the changes will not make any difference.

Once again, views are largely partisan, including among parents. Pluralities of Democrats and independents say the changes RFK Jr. has made to vaccine policy will make people less safe, including six in ten (62%) Democrats and four in ten (41%) independents. However, Republicans are split, with similar shares who say the policy makes people safer (41%) and that they don’t know enough to say (34%).

Parents are also split, with a third (32%) who don’t know enough to say and three in ten (29%) who say these changes will make people less safe. Another quarter (22%) of parents say it’ll make people safer, while one in six (17%) say it won’t make a difference. Parents who are Democrats or Democratic-leaning independents are more likely to say the changes will make people less safe, while Republican-leaning parents are more likely to say the changes will make people safer.

Partisans, Including Among Parents, Vary in How They Describe the  Impact of HHS's Changes to Vaccine Policy, Six in Ten Democrats Say Changes Have Made People Less Safe

The Fall 2025 COVID-19 Vaccines

Overall, most of the public (59%) say they will either “definitely not” or “probably not” get the COVID-19 vaccine this fall. KFF has been tracking uptake of the COVID-19 vaccine since early 2021. Older adults and Democrats are much more likely to report that they will get the COVID-19 vaccine, while six in ten Republicans (59%) say they will “definitely not” get the COVID-19 vaccine. Similar shares across race and ethnicity say they plan to get the vaccine this fall, but notably White adults are the most likely to be against getting the vaccine, with four in ten (42%) saying they will “definitely not” get the vaccine.

Interactive DataWrapper Embed

Views of the changes to U.S. vaccine policy also vary by vaccine intention. Those who say they will “definitely” or “probably” get the shot are more likely to say they think the changes to U.S. vaccine policy are “major changes” and these changes will make people less safe.

Few Are Worried About Availability of Vaccines

With the Trump administration instituting possible changes to vaccine recommendations, including the COVID-19 vaccine, and coverage of vaccines largely tied to recommendations from the Advisory Committee on Immunization Practice (ACIP) or the Centers for Disease Control and Prevention (CDC), those who want a COVID-19 vaccine are worried about being able to access the vaccine.

With less than half of adults saying they plan to get a COVID-19 vaccine this fall, just one-third (33%) of all adults are “very” or “somewhat” concerned that COVID-19 vaccines won’t be available to them this fall. Most adults (67%) say they’re “not too” or “not at all” concerned about the availability of the vaccine. Similarly, among those who have insurance, a third (34%) are “very” or “somewhat” concerned that their insurance won’t cover a COVID-19 vaccine this fall, while two-thirds (65%) are “not too” or “not at all” concerned.

Few People Are Concerned About Access and Coverage of COVID-19 Vaccines This Fall

Those who plan to get the vaccine are much more likely to be concerned that it might not be available to them. Among those who say they’ll “definitely” or “probably” get a COVID-19 vaccine this fall, two-thirds (66%) are concerned that the vaccine won’t be available to them, while six in ten (62%) of insured adults who will likely get a vaccine this fall are concerned their insurance won’t cover it. Predictably, just about one in ten of those who likely won’t get the vaccine are concerned about availability (11%) or insurance coverage (14%).

Groups that are more likely to say they plan on getting the COVID-19 vaccine are predictably more concerned about both the availability of the vaccine and whether their insurance would pay for it. Over half (56%) of Democrats are concerned about the availability of the COVID-19 vaccine or insurance coverage (53%), compared to under four in ten independents and one in ten Republicans worried about availability or coverage.

In addition, people who are ages 50 and older are more concerned than younger adults that the vaccine won’t be available to them, though majorities still report they are not concerned, with about four in ten of older adults who are concerned about both availability and insurance coverage, compared to about a quarter of those under the age of 50.

Black adults and Hispanic adults are among the most concerned about the availability and insurance coverage of the COVID-19 vaccine, with half of Black adults concerned about availability (48%) and insurance coverage (46%), and half (47%) of Hispanic adults concerned about insurance coverage, compared to smaller shares of White adults concerned about either item.

Older Adults, Black Adults, Hispanic Adults, and Democrats Are More Concerned About Access and Availability of COVID-19 Vaccines This Fall

Half (48%) of parents say they are not sure if federal health agencies are currently recommending that healthy children receive a COVID-19 vaccine this fall. Currently, the CDC is recommending that decisions around the COVID-19 vaccine for healthy children ages 6 months to 17 years should be between the health care provider and the patient or their parents, with no formal recommendation from the CDC. This comes after RFK, Jr. announced that the COVID-19 vaccine is not being recommended for this group.

Two in ten (21%) parents believe the COVID-19 vaccines are being recommended, while three in ten (31%) say COVID-19 vaccines are not being recommended for healthy children this fall. This is similar across partisans, with half of parents regardless of party identification saying they don’t know enough to say, and about three in ten Republican and Republican-leaning independent parents (31%) and Democratic and Democratic-leaning independent parents (35%) aware that the CDC is not recommending the COVID-19 vaccine for healthy children this fall.

Half of Parents Across Partisanship Are Unsure Whether Federal Health Agencies Are Recommending COVID-19 Vaccines for Healthy Children This Fall

Trust in Sources to Provide Vaccine Information

Personal doctors or health care providers remain the most trusted source for information about vaccines, with eight in ten (83%) adults saying they trust their doctor “a great deal” or “a fair amount” to provide reliable information about vaccines. Smaller shares of the public, but still majorities, trust their local public health department (62%) and the U.S. Centers for Disease Control and Prevention, or CDC (57%), to provide information on vaccines. Four in ten trust their state government officials (43%). HHS Secretary Robert F. Kennedy Jr. continues to be the least trusted source of information on vaccines with just over one-third of adults (37%) saying they trust him at least a fair amount.

Individuals’ doctors or health care providers also garner the highest shares of trust across partisans, with at least eight in ten Democrats (92%), independents (85%), and Republicans (80%) who trust them “a great deal” or “a fair amount” to provide vaccine information. Notably, Republicans’ next trusted source behind their own personal doctor is RFK Jr., with seven in ten Republicans saying they trust him to provide reliable information on vaccines, compared to three in ten independents and one in ten (11%) Democrats.

Democrats are more trusting of vaccine information from health agencies than independents or Republicans, with three-quarters (77%) of Democrats saying they trust their local public health department to provide reliable information on vaccines, compared to two-thirds (63%) of independents, and half (53%) of Republicans. Similarly, another seven in ten (72%) Democrats trust the CDC compared to six in ten (61%) independents and just under half (44%) of Republicans. These partisan divides in trust are consistent with findings from previous KFF polling.

Doctors Remain Most Trusted Source of Vaccine Information, Democrats Trust Government Health Agencies While Republicans Are More Trusting of RFK Jr.

Republicans or Republican-leaning independents who support the MAGA movement are consistently less trusting of sources of information about vaccines than non-MAGA Republicans and leaners, with significantly fewer who say they trust their local public health department, the CDC, and their state government officials. Similar shares say they trust their personal doctors “a great deal” or “a fair amount,” but larger shares of MAGA Republicans trust RFK Jr. to provide information on vaccines (77% vs. 48% of non-MAGA Republicans).

MAGA Supporters Trust Their Health Care Providers and RFK, Jr. on Vaccine Information, but Fewer Trust Other Government Agencies

The latest polling shows that overall trust in government agencies, like the CDC or people’s local public health departments, to provide reliable information on vaccines is continuing a downward trend since first asked in September 2023. The share of adults who say they trust either the CDC or their local public health department has dropped six percentage points, while the share who trust their own provider has stayed relatively stable.

Share Who Trust Health Agencies and CDC Continue Decline Since September,  While Trust in Doctors Remains High

Even as majorities of the public express trust in government health agencies, like the CDC, to provide information on vaccines, few have confidence in agencies like the CDC and FDA to carry out many of their responsibilities, including ensuring the safety and effectiveness of vaccines approved for use in the U.S. (49%), making decisions based on science rather than the personal views of agency officials (42%), or acting independently, without interference from outside interests (37%). Fewer than one in five adults say they have “a lot” of confidence in these agencies to fulfill each of these tasks.

Less Than Half of the Public Are Confident That Government Health Agencies Will Work To Act Independently or Make Decisions Based on Science

Despite the fact that Trump administration appointees lead these federal health agencies, larger shares of Democrats than Republicans have at least “some” confidence in government health agencies to ensure the safety and effectiveness of vaccines approved for use in the U.S. About six in ten (58%) Democrats say they are confident in these agencies to ensure the safety and effectiveness of vaccines, compared to less than half (45%) of Republicans who agree.

Similar shares of Democrats (41%), independents (42%), and Republicans (46%) have confidence in the government to make decisions based on science rather than personal views of agency officials, and similar shares of Democrats (41%) and Republicans (41%) are confident in the federal health agencies to act independently, without interference from outside interests. A smaller share of independents – about a third (32%) – say the same about agencies’ ability to act independently.

Across Partisanship, Less Than Half Are Confident in Government Health Agencies To Act Independently or To Make Decisions Based on Science

Methodology

This KFF Health Tracking Poll/KFF Tracking Poll on Health Information and Trust was designed and analyzed by public opinion researchers at KFF. The survey was conducted July 8-14, 2025, online and by telephone among a nationally representative sample of 1,283 U.S. adults in English (n=1,212) and in Spanish (n=71). The sample includes 1,004 adults (n=58 in Spanish) reached through the SSRS Opinion Panel either online (n=979) or over the phone (n=25). The SSRS Opinion Panel is a nationally representative probability-based panel where panel members are recruited randomly in one of two ways: (a) Through invitations mailed to respondents randomly sampled from an Address-Based Sample (ABS) provided by Marketing Systems Groups (MSG) through the U.S. Postal Service’s Computerized Delivery Sequence (CDS); (b) from a dual-frame random digit dial (RDD) sample provided by MSG. For the online panel component, invitations were sent to panel members by email followed by up to three reminder emails.

Another 279 (n=13 in Spanish) adults were reached through random digit dial telephone sample of prepaid cell phone numbers obtained through MSG. Phone numbers used for the prepaid cell phone component were randomly generated from a cell phone sampling frame with disproportionate stratification aimed at reaching Hispanic and non-Hispanic Black respondents. Stratification was based on incidence of the race/ethnicity groups within each frame. Among this prepaid cell phone component, 135 were interviewed by phone and 144 were invited to the web survey via short message service (SMS).

Respondents in the prepaid cell phone sample who were interviewed by phone received a $15 incentive via a check received by mail. Respondents in the prepaid cell phone sample reached via SMS received a $10 electronic gift card incentive. SSRS Opinion Panel respondents received a $5 electronic gift card incentive (some harder-to-reach groups received a $10 electronic gift card). In order to ensure data quality, cases were removed if they failed two or more quality checks: (1) attention check questions in the online version of the questionnaire, (2) had over 30% item non-response, or (3) had a length less than one quarter of the mean length by mode. Based on this criterion, 1 case was removed.

The combined cell phone and panel samples were weighted to match the sample’s demographics to the national U.S. adult population using data from the Census Bureau’s 2024 Current Population Survey (CPS), September 2023 Volunteering and Civic Life Supplement data from the CPS, and the 2025 KFF Benchmarking Survey with ABS and prepaid cell phone samples. The demographic variables included in weighting for the general population sample are gender, age, education, race/ethnicity, region, civic engagement, frequency of internet use, political party identification by race/ethnicity, and education. The weights account for differences in the probability of selection for each sample type (prepaid cell phone and panel). This includes adjustment for the sample design and geographic stratification of the cell phone sample, within household probability of selection, and the design of the panel-recruitment procedure.

The margin of sampling error including the design effect for the full sample is plus or minus 3 percentage points. Numbers of respondents and margins of sampling error for key subgroups are shown in the table below. For results based on other subgroups, the margin of sampling error may be higher. Sample sizes and margins of sampling error for other subgroups are available on request. Sampling error is only one of many potential sources of error and there may be other unmeasured error in this or any other public opinion poll. KFF public opinion and survey research is a charter member of the Transparency Initiative of the American Association for Public Opinion Research.

GroupN (unweighted)M.O.S.E.
Total1,283± 3 percentage points
Party ID
Democrats439± 6 percentage points
Independents387± 6 percentage points
Republicans344± 6 percentage points
MAGA Republicans308± 7 percentage points


News Release

Poll: While Most Adults Do Not Expect to Get a COVID-19 Shot This Fall, Those Who Want One Worry About Access and Insurance Coverage

Amid Changes to Federal Vaccine Policy, Many Parents Are Confused on Current Guidelines and Few Think Changes Will Make People Safer

Published: Aug 1, 2025

As federal vaccine policy changes, most (59%) adults do not expect to get a COVID-19 vaccine this fall, while four in 10 (40%) say that they will “definitely” or “probably” get the shot, a new KFF Tracking Poll on Health Information and Trust finds.

The groups most likely to say they will “probably” or “definitely” get the vaccine this fall include older adults (55%) and Democrats (70%). In contrast, most Republicans say they won’t get the shot, including 59% who say they will “definitely not” get the vaccine.

Among those who plan to get the shot, two-thirds (66%) say they are concerned the vaccine won’t be available to them, and a similar share of those with insurance (62%) are concerned their insurance won’t cover the cost. 

The poll comes after Health and Human Services Secretary Robert F. Kennedy Jr.’s announcement this spring that the Centers for Disease Control and Prevention (CDC) would no longer recommend the vaccine for healthy children or pregnant women, and the CDC subsequently recommended shared decision-making between parents and doctors.

The poll finds that many parents of children under age 18 are confused and uncertain about whether COVID-19 vaccines are recommended for healthy children this year. 

About half (48%) of parents say they don’t know whether or not federal agencies recommend healthy children get the vaccine this fall. More say the vaccine is not recommended (31%) than recommended (21%) for healthy children.

When asked about the impact of the changes that Secretary Kennedy is making to vaccine policy, one in five (20%) adults nationally say they are making people safer, while more than a third (36%) say they are making people less safe. Others say that they don’t know enough to say (31%) or that the changes won’t make a difference (13%).

Views on the impact of the changes split along partisan lines, with Republicans much more likely to say the changes are making people safer (41%) than less safe (9%), and Democrats much more likely to say less safe (62%) than safer (4%). Among independents, more than twice as many say the changes are making people less safe (41%) than safer (16%). At least a quarter of adults across partisans say they don’t know enough to say how the changes will impact people.

The poll also assesses the public’s trust and confidence in federal authorities around vaccine issues. Findings include:

  • More than half of people (57%) say they have at least “a fair amount” of trust in the CDC to provide reliable information on vaccines.
  • Fewer than four in 10 (37%) say they trust Secretary Kennedy to provide reliable information on vaccines. Republicans (70%) are far more likely than independents (30%) or Democrats (11%) to say they trust Secretary Kennedy to provide reliable vaccine information.
  • About half (49%) of the public says they have at least some confidence in federal agencies like the CDC and the Food and Drug Administration (FDA) to ensure the safety and effectiveness of vaccines, consistent with recent findings.

Designed and analyzed by public opinion researchers at KFF, this survey was conducted July 8-14, 2025, online and by telephone among a nationally representative sample of 1,283 U.S. adults in English and in Spanish. The margin of sampling error is plus or minus 3 percentage points for the full sample. For results based on other subgroups, the margin of sampling error may be higher.

A Closer Look at the Work Requirement Provisions in the 2025 Federal Budget Reconciliation Law

Published: Jul 30, 2025

Note: This analysis was updated to include the Congressional Budget Office’s (CBO) latest cost estimates for the reconciliation package that was enacted on July 4, 2025, as well as new provisions in the law.

On July 4, President Trump signed into law a budget reconciliation package once called the “One Big, Beautiful Bill” that includes significant changes to the Medicaid program. The Congressional Budget Office (CBO) estimates the Medicaid work requirement provisions in the passed budget reconciliation law will be the largest source of Medicaid savings, reducing federal spending by $326 billion over ten years and cause millions to become uninsured.

Implementing work requirements on a national scale, requiring states to verify individuals’ monthly work status (at least every 6 months) and implement a long list of exemptions are policies that proved challenging for Arkansas and Georgia to operationalize and led to 18,000 people losing coverage in Arkansas. KFF analysis shows most Medicaid adults under age 65 are working already (without a requirement) or face barriers to work. Many Medicaid adults who are working low-wage jobs are employed by small firms and in industries that have low employer-sponsored insurance offer rates. In previous analysis, CBO found that a Medicaid work requirement would not have any meaningful impact on the number of Medicaid enrollees working, and cited research from Arkansas indicating that “many participants were unaware of the work requirement or found it too onerous to demonstrate compliance,” resulting in coverage loss.

The law will require states to condition Medicaid eligibility for adults in the Affordable Care Act (ACA) Medicaid expansion group at application and following enrollment on meeting work requirements starting January 1, 2027, with the option for states to implement requirements earlier. Currently, 41 states (including DC) have expanded their Medicaid programs under the ACA to nearly all adults up to 138% FPL ($21,597 for an individual in 2025). As of June 2024, over 20 million people were enrolled through Medicaid expansion, representing nearly a quarter of total Medicaid enrollment across all states and 31% of total enrollment in expansion states. The Medicaid expansion population includes adults without dependents as well as many parents and people with disabilities or chronic conditions who do not receive SSI.

Key takeaways include:

  • CBO estimates. Of the Medicaid provisions included in the law, CBO estimates implementing work requirements will account for the largest share of federal Medicaid savings. Earlier CBO estimates found work requirements will cause the largest increase in the number of people without health insurance.
  • Verification requirements. The law requires states to verify at application and at renewal that individuals in the ACA expansion group meet work requirements (80 hours of work activities per month) or exemption criteria. States can also require verification more frequently.
  • Implementation timeline. The law requires HHS to release an interim final rule by June 2026 leaving states with limited time to develop or change implementation plans, protocols, and systems (and to test systems changes) before the January 2027 work requirement implementation deadline.
  • State implementation choices. State choices to impose more stringent requirements than the minimum federal requirements outlined in the law (e.g., requiring more frequent verification or imposing longer “look-back” periods when verifying coverage) as well as state effectiveness in using existing data to automate verification processes, will affect the number of individuals at risk of losing coverage.
  • Comparison to other waivers and proposals. The Medicaid work requirement policies included in the law are more stringent than previous policies considered by Congress and work requirements implemented under state Medicaid demonstration waivers; for example, the law makes it harder to gain coverage and to re-enroll and does not exempt older adults from requirements

What does CBO say?

Of the Medicaid provisions included in the enacted reconciliation package, CBO estimates implementing work requirements will account for the largest share of federal Medicaid savings; earlier CBO estimates also found work requirements will cause the largest increase in the number of people without health insurance. Over ten years, work requirements are estimated to reduce federal Medicaid spending by $326 billion, representing the largest share of the estimated $911 billion in total Medicaid cuts included in the law (Figure 1). (CBO also projects indirect effects from the work requirement provision will decrease federal revenues by $8.65 billion over a decade.) The savings will largely stem from coverage losses. CBO has not published updated estimates of the number of people who will lose Medicaid under the reconciliation package previously referred to as the “One Big, Beautiful Bill.” Earlier CBO analysis of the House-passed version of the reconciliation bill estimated 18.5 million people will be subject to the requirements each year and by 2034 federal Medicaid coverage will decrease by an estimated 5.2 million adults, with work requirements ultimately increasing the number of people without health insurance by 4.8 million in 2034. CBO expects few of those disenrolled to have access to employment-based coverage and that no one will be eligible for Marketplace premium tax credits (as the law makes those losing or denied Medicaid coverage due to work requirements ineligible for premium tax credits to purchase coverage through the ACA Marketplaces).

CBO Estimates of Federal Medicaid Cuts in the Enacted Reconciliation Package

What does the law require?

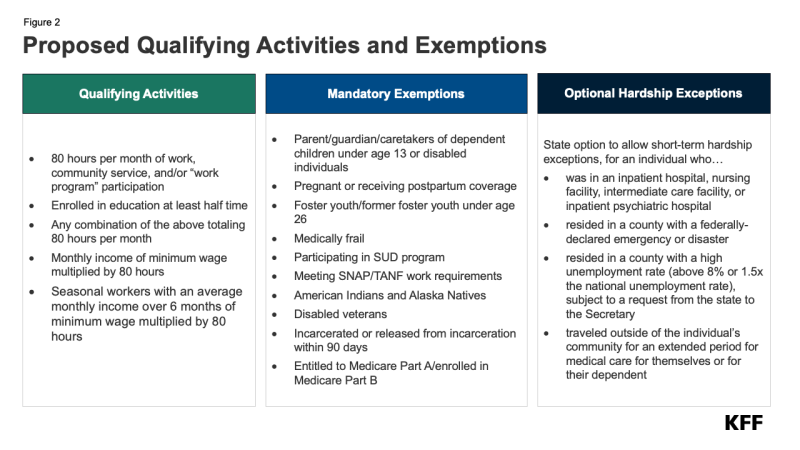
Expansion adults will be required to complete 80 hours of work or community service activities per month or meet exemption criteria to enroll in and maintain coverage (Figure 1). (Work requirements will also likely apply to states like Wisconsin and Georgia that have partial adult coverage expansions under 1115 waivers.) Individuals applying for coverage and those enrolled in coverage will need to work or engage in specified “qualifying activities” for at least 80 hours per month. States will be required to verify qualifying activities or exemptions in (at least) the month before application and (at least) one month between eligibility redeterminations (see Figure 2 and additional discussion below). The law specifies mandatory exemptions including parents and caretakers with children ages 13 and under, individuals who are “medically frail,” and individuals who are pregnant or postpartum, among others (Figure 1). The “medically frail” designation includes individuals who are blind or disabled, individuals with physical, intellectual, or developmental disabilities, individuals with substance use disorder or a “disabling” mental disorder, and those with “serious or complex” medical conditions. States may allow short-term hardship exceptions from work requirements, for enrollees (or applicants) experiencing certain extenuating circumstances (Figure 2).

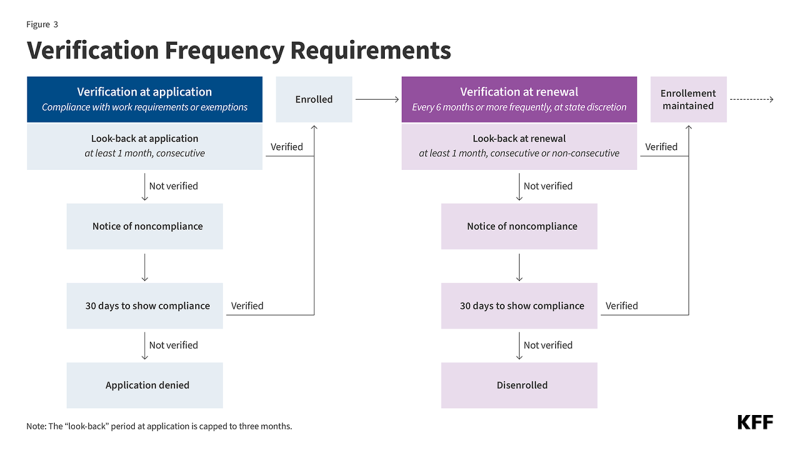
At a minimum, states will be required to verify individuals’ work or exemption status when individuals apply for coverage and at eligibility renewal (Figure 3). At application, states will be required to “look back” one or more consecutive months (immediately preceding the application month, up to three total months) to confirm compliance with the requirements. Every six months when eligibility is redetermined (or more frequently as determined by states), states will be required to “look back” one or more months (consecutive or non-consecutive) to verify compliance. In effect, states could require individuals to comply with work requirements for multiple months before they can enroll in coverage or for multiple months within any six-month eligibility period (or more frequently than every six months). The law directs states to use available information (e.g., payroll data) “where possible” to verify compliance with work activities or exemption status, without requiring additional documentation from individuals.

When a state is unable to verify compliance with the requirements or that an individual meets exemption criteria, it must issue a “notice of noncompliance” and deny the application or disenroll the individual from coverage if the individual is unable to show compliance (Figure 3). Individuals will have 30 days to show compliance (coverage will be maintained during this period if already enrolled). After 30 days, if an individual is unable to demonstrate compliance with the requirements or show they are exempt, the state will be required to deny the application or disenroll the individual from coverage (no later than the end of the month following the 30-day period). States will be required to follow standard Medicaid termination processes, including determining whether an individual qualifies for Medicaid coverage on another basis and provide written notice and opportunity for a fair hearing. To regain Medicaid coverage, individuals will need to reapply (triggering another compliance check at application). Individuals will also be barred from receiving subsidized Marketplace coverage, as the law makes those losing (or denied) Medicaid coverage due to work requirements ineligible for premium tax credits to purchase coverage through the ACA Marketplaces.


What is the timeline for implementation?

The law specifies key work requirement implementation and compliance dates (Figure 4). The law directs the Secretary of HHS to issue an interim final rule on implementing work requirements by June 1, 2026 (the law specifies the interim rule will not be subject to public notice or public comment). States will be required to condition Medicaid expansion eligibility and coverage on meeting work requirements by January 1, 2027, with an option to implement requirements sooner. States must begin outreach to notify individuals of the new requirements at least three months before the start of the first compliance “look-back” period and notify individuals “periodically thereafter.” The law allows the Secretary to exempt states from compliance with the new requirements until no later than December 31, 2028, if the state is demonstrating a “good faith” effort to comply.

Figure 4

timeline visualization

A forthcoming HHS interim rule may identify implementation parameters and additional state requirements; however, if the rule is slated to be released by June 2026, states will have limited time to develop or change implementation plans, protocols, and systems (and to test systems changes). The work requirement provisions outlined in the law raise many operational and implementation questions (Appendix Table 1). The law includes references to areas where additional HHS guidance may further define standards and processes for states (Table 1). Implementing work requirements will involve complex systems changes (e.g., developing or adapting eligibility and enrollment systems), enrollee outreach and education, staff training, and coordination with managed care plans, providers, and other stakeholders. The law allows states flexibility to impose more stringent requirements than the minimum requirements specified (e.g., requiring more frequent verification or imposing longer “look-back” periods when verifying coverage) and allows states to implement requirements sooner than January 2027.

Standards and Processes Expected To Be Further Defined by the HHS Secretary

How could implementation vary across states?

States will have flexibility to impose more stringent requirements than the minimum federal requirements outlined in the law. For example, states will have flexibility to determine how many months to “look back” at application (up to three months) and redetermination to verify compliance (and whether to verify compliance more frequently than at redetermination). In effect, states could choose to require compliance with work requirements for multiple months prior to the application month and for every month following enrollment (Box 1).

Box 1

The impact of choosing different “look-back” periods

John lost his job and was out of work in April and May. In June, he started in a new seasonal position and worked 80 hours during the month. In July, John applies for Medicaid in an expansion state, as he qualifies for Medicaid on the basis of his income.

  • State A uses a 1-month look-back period when determining compliance with work requirements at application. John would be able to enroll in Medicaid (provided he meets all other program requirements).
  • State B uses a 3-month look-back period when determining compliance with work requirements at application. John would not qualify for Medicaid, as he was out of work in two of the three months.

State data matching process decisions and how effective states are with data matching will affect how many individuals will need to submit proof of work hours or exemption status, and ultimately the number of individuals at risk of losing coverage. States with older or weaker systems or less integration (e.g., with SNAP or TANF) may be less effective. But even with effective systems, not all work can be verified through existing data sources, including, for example, community service and self-employment. As noted earlier, the law directs states (“where possible”) to data match work activities and automate the verification of exempted individuals/groups. Some exemptions may be easier to identify with existing data including parent/caretaker status, recent incarceration, and compliance with SNAP/TANF work requirements. Others may be more difficult such as participation in SUD program or meeting the “medically frail” definition (e.g., individuals with SUD, individuals with physical, intellectual, or developmental disabilities, those with “serious or complex” medical conditions).

How does this law compare to state waivers and previous proposals?

The Medicaid work requirement policies included in the law are more stringent than previous policies considered by Congress and work requirements implemented under state Medicaid demonstration waivers (Table 2). The law shares some similarities in structure to other federal legislative proposals and waivers, including requiring 80 hours per month of qualifying activities such as employment, community service, or work programs, and allowing exemptions for parents and individuals with certain health conditions (although Georgia’s waiver currently offers no exemptions). However, the law will condition eligibility at initial application and after enrollment on meeting work requirements, making it harder to gain coverage and to re-enroll (than in Arkansas or under the Limit, Save, Grow Act considered by Congress in 2023). Individuals lost coverage after three months of noncompliance in Arkansas and under the Limit, Save, Grow proposal, while under the law individuals could lose coverage more quickly (if the state chooses to verify monthly). The policy in the law will also extend to older age, through age 64 (unlike Arkansas’s waiver and the Limit, Save, Grow Act). In Georgia where the work requirement extends through age 64, the state’s interim evaluation found that work requirements have had a significant impact on lowering program enrollment, particularly for adults ages 50-64. For more on lessons learned from Arkansas’ and Georgia’s experience implementing work requirements (under demonstration waivers), see KFF’s previous explainers.

Work Requirement Proposals and Implemented Waivers

Appendix

Operational and Implementation Questions

Recent Policy Proposals Could Weaken the Reproductive Health Safety Net as More People Become Uninsured

Published: Jul 28, 2025

Key Takeaways

  • Multiple policy changes resulting from Congressional action, Trump administration efforts, and a Supreme Court decision will significantly weaken the family planning safety net at a time when there will be increasing demand for safety-net providers in every state due to growth in the number of uninsured Americans. The 2025 Federal Budget Reconciliation Law is projected to result in significant growth in the uninsured rate over the next decade through loss of Medicaid and Affordable Care Act (ACA) Marketplace coverage. Among women of reproductive age on Medicaid, 8 million (36%) are eligible through the ACA coverage expansion and could be at risk for losing their coverage due to the new work and eligibility verification requirements.
  • The 2025 Budget Reconciliation law also bans federal Medicaid payments to Planned Parenthood clinics for one year; however, this provision is currently blocked for all Planned Parenthood members by a federal district court order. The program is the largest source of public financing to Planned Parenthood and also affects a subset of other family planning clinics that also offer abortion services. Among women on Medicaid who obtained family planning services, 11% (about 1 million) got care at a Planned Parenthood in 2021 and the vast majority of them (85%) got contraceptive services.
  • The Supreme Court ruling in Medina v. Planned Parenthood has enabled states to exclude Planned Parenthood clinics from their Medicaid provider networks. In the past decade, at least 14 states have used state-level policies or sought federal permission to block the provider from participating in their state Medicaid programs, though they have often been blocked by court action, until this ruling.
  • The Trump Administration is currently withholding Title X family planning funds from close to 300 family planning clinics and proposed to eliminate the program altogether in their FY2026 budget. The federal Title X program provides grant funding to nearly 4,000 clinics to deliver free and low-cost family planning care to people with low incomes.
  • Combined, these actions could result in closures and cutbacks in contraceptive care and STI services when there will be a greater need for free or low-cost reproductive health care.

Introduction

Over the next few years, a confluence of policy changes at the federal level will significantly weaken and challenge the family planning safety net of publicly supported health centers and clinics. The clinics that currently serve millions of women with low incomes will simultaneously face greater demand for reproductive health care as a growing number of uninsured people turn to the safety net for free or reduced cost care. The reproductive health safety net includes Federally Qualified Health Centers, Title X clinics, Indian Health Service and Rural Health Clinics, state and local health departments, and Planned Parenthood clinics. The impact of the 2025 Federal Budget Reconciliation Law is projected by the Congressional Budget office to increase the number of people uninsured by 10 million over the next decade, and the sunsetting of supplemental ACA premium tax credits at the end of this year could lead to millions more uninsured. The new law would also eliminate Planned Parenthood’s eligibility to receive federal Medicaid funds provider for one year; however, this payment ban is temporarily blocked by court order. This change, combined with the withdrawals of Title X funds to several non-profit organizations and Planned Parenthood grantees, and the rise in uninsured will place additional pressure on an already fragile reproductive health safety net.

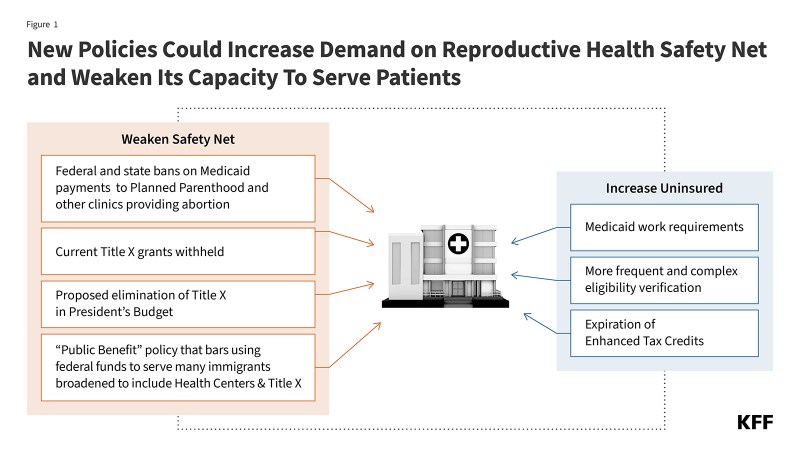
Each of these changes alone place considerable pressure on the family planning safety-net and taken together, could result in major access problems not just for low-income people seeking contraceptive care, STI screening and treatment, and other preventive services, but others who rely on this network in every state in the country. This brief details the likely impact of these different actions on the family planning safety net and its ability to provide reproductive health care to millions of people across the nation (Figure 1).

Figure 1 is titled "New Policies Could Increase Demand On Reproductive Health Safety Net and Weaken Its Capacity to Serve Patients"

The 2025 Budget Reconciliation Law

The 2025 Federal Budget Reconciliation Law, signed into law on July 4, 2025, will have major impacts on the uninsured rate, as well as the reproductive health safety net that was designed to serve individuals who have low incomes or who do not have health insurance.

Growth in Uninsured Patients

The 2025 Budget Reconciliation Law places additional requirements on Medicaid eligibility that are projected to lead to a major increase in the number of uninsured, a population that relies on the health care safety net for their reproductive health care. The Congressional Budget Office (CBO) estimates that over the course of 10 years, the new law will increase the number of people without health insurance by 10 million because of the law’s changes to Medicaid and the Affordable Care Act (ACA).

Medicaid expansion has provided an important eligibility pathway for low-income women of reproductive age. Today, 8.0 million women ages 19-49 (36% of reproductive age women enrolled in Medicaid) qualify through the expansion alone (Figure 2). The 2025 Federal Reconciliation Law would require Medicaid enrollees who qualify through ACA expansion to work or look for work, but exempts parents with dependent children under age 14. KFF research shows that most adult women covered by Medicaid meet work requirements or would qualify for an exemption, but many would be at risk of losing coverage because of the administrative burden related to reporting requirements. Although work requirements are the largest source of coverage loss, all states are estimated to experience reductions in Medicaid enrollment due to additional administrative hurdles related to eligibility determination, verification, and the frequency of renewals required by the new law.

Over One-Third of Women Ages 19 to 49 are Eligible as a Result of ACA Medicaid Expansion

This erosion in coverage could be compounded by the expiration of the enhanced premium tax credits for ACA Marketplace enrollees at the end of 2025 if Congress does not act to extend them.

Faced with higher costs or challenges getting reproductive care, uninsured women could decide to stop using contraception because they cannot afford it or switch to a less effective method, which could result in an increase of unwanted pregnancies and a loss of reproductive autonomy. The 2024 KFF Women’s Health Survey found one in five uninsured women of reproductive age has had to stop using a birth control method in the past 12 months because they couldn’t afford it, a rate that is four times greater than those with Medicaid (5%) or private insurance (2%).

Medicaid and Planned Parenthood

The most immediate impact of the 2025 Budget Reconciliation Law is the prohibition of federal payments for one year to certain family planning providers that receive at least $800,000 in Medicaid revenue and are affiliated with providers that also offer abortion services. This narrow definition affects all Planned Parenthood clinics as well as two other networks of clinics in Massachusetts and Maine and will be a major economic blow to these clinics that rely heavily on Medicaid as a source of financing for care as well as the over one million women on Medicaid who rely on them for their care. This provision is being challenged by Planned Parenthood and Maine Family Planning and is currently blocked for all Planned Parenthood members as the case moves through the courts.

The federal Medicaid program pays 90% of all family planning services and supplies, and states pay 10%. This is considerably higher than the federal match that states receive for most other services. If the cases challenging the payment ban do not ultimately succeed, it will be difficult if not impossible for states to fill the gap in the loss of funds.

The largest source of financing to Planned Parenthood is the Medicaid program, which reimburses clinics for services provided to enrollees in the same way that it pays private doctors and hospitals. In 2021, one in ten (11%) Medicaid enrollees received their family planning services at a Planned Parenthood clinic and 85% of them received contraceptive services. The share of Medicaid enrollees served by Planned Parenthood varies considerably from state to state (Figure 3).

Planned Parenthood Clinics Provide Family Planning Services to Medicaid Enrollees in Almost All States

Federal Medicaid funds do not pay for abortion care, except under very limited circumstances (rape, incest, life endangerment of the pregnant person), because of the Hyde Amendment. Nonetheless, over the last decade, many states have made efforts to ban Planned Parenthood from participating in Medicaid because they also offer abortion services. Federal Medicaid law permits any willing and qualified provider to participate in the program to serve enrollees. States have the right to determine who is a “qualified” provider and some have tried to disqualify Planned Parenthood because they provide abortion services. While Congress was voting on the 2025 Budget Reconciliation Law, the Supreme Court issued a ruling in Medina v. Planned Parenthood South Atlantic, and gave states that oppose abortion more latitude to disqualify Planned Parenthood clinics from their network of Medicaid participating providers. Regardless of the outcome of the cases challenging the provisions of the 2025 Budget Reconciliation Law, the Supreme Court’s ruling on Medina will mean that states will be able to act on their own to block their state from including Planned Parenthood as a Medicaid provider.

Over the past decade, at least 14 states have sought to ban Planned Parenthood clinics from qualifying for reimbursement in their Medicaid programs. When Texas excluded Planned Parenthood from participating in their state-funded family planning program in 2013, fewer people received contraception, there was a reduction in the rate of contraceptive continuation, and an increase in the share of childbirth covered by Medicaid. While Planned Parenthood clinics make up a relatively small share of the reproductive health safety net, they serve one third of all patients that obtain contraceptive care from publicly supported clinics (Figure 4). In some communities, this loss could leave residents without a source of reproductive care.

Planned Parenthood Clinics Make Up 6% of Clinic Network, But Serve One-Third of Contraceptive Patients

The loss of Planned Parenthood clinics through Medicaid means that there could be fewer providers available to serve women, especially in some rural or medically underserved communities. According to Planned Parenthood, 76% of their clinics are located in rural or medically underserved areas and excluding them from the Medicaid program could force clinic closures or cutbacks in care for these populations.

The Role of Title X

Over the last few years, the Title X program, which has been providing assistance with family planning costs to clinics that serve low-income individuals since 1970, has been the focus of significant restrictions that have made it difficult for many clinics to continue to participate in the program. Title X distributes grant funds to support family planning services to low-income and uninsured people through a network of participating clinics. These services include contraceptive care, STI screening, and preventive cancer screenings, like Pap smears and breast exams. The types of sites that rely on this support include Federally Qualified Health Centers, state and local health departments, school-based clinics, independent clinics, hospital outpatient departments, and currently some Planned Parenthood clinics.

During the first Trump Administration, HHS changed the Title X regulations so that clinics that offered abortion referrals or that had co-located abortion services were disqualified from participating in the program. Others left voluntarily because they felt that this policy violated their mission and values. Approximately 1,000 clinics, including over 400 Planned Parenthood clinics across the country, stopped receiving Federal Title X support as a result of this policy. Many of the clinics later rejoined the Title X program after the Biden Administration reversed the Trump Administration regulations, however, the Trump Administration is currently withholding Title X funds from 12 grantees since April 1, 2025, affecting close to 300 clinics (Figure 5).

The Trump Administration is Still Withholding Title X Funds from 250 Clinics

While the administration has not yet moved to change the Biden era regulations, they may still reinstate the restrictions of the first Trump Administration if the program continues to exist. This was a priority that was highlighted by the authors of Project 2025. Title X Clinics that lost their funding in 2025 have already had to make difficult decisions about reducing services, laying off staff, or potentially closing their doors. Planned Parenthood has already announced the closure of at least 32 clinics this year spread across California, Illinois, Indiana, Iowa, Michigan, Minnesota, New York, Ohio, Texas, Utah, and Vermont. Utah and Vermont’s entire Title X networks are comprised of exclusively Planned Parenthood clinics, so as these clinics close or lose Title X and Medicaid funding, women in Utah and Vermont may find it difficult to find another provider that offers the range of care they have been receiving at no or low cost. Two of Vermont’s Title X funded Planned Parenthood sites are in areas that do not have any other nearby publicly funded clinics. Many of these clinic closures are also occurring in the Midwest, impacting many rural communities, and leaving them with fewer options to obtain low or no cost sexual and reproductive health care.

President Trump’s FY 2026 Discretionary Budget Request would eliminate the $286 million appropriated for Title X for 2026. The Republican-sponsored House Appropriations FY 2025 Labor-HHS bill was approved by the Appropriations Committee in July 2024 and would have eliminated all support for the Title X program. There is uncertainty as to whether Congress will pass a budget this year or simply pass a continuing resolution that carries forward existing funding levels for government programs. In 2023, the Title X program administered funds to 3,744 clinics that served 2.8 million clients.

Federally Qualified Health Centers

As Planned Parenthood and Title X clinics are under threat and face closure or service reductions, a common argument by abortion opponents is that federally qualified health centers (FQHCs) will be able to fill in the gaps. FQHCs are funded under Section 330 of the Public Health Service Act and rely heavily on Medicaid payments for services. FQHCs comprise an extensive national network of more than 16,000 service sites across the U.S. They are located in medically underserved urban and rural communities and provide a range of medical, behavioral, and supportive services to all patients regardless of their ability to pay.

By law, FQHC networks are required to provide “voluntary family planning services,” as part of the broad range of primary care and related services they offer. This typically includes services such as contraceptive care, testing and treatment for STIs, and pregnancy options counseling. However, not all clinics within an FQHC network necessarily offer family planning services, and among those that do, many do not offer their patients the full range of contraceptive methods (Figure 6). It is unlikely that FQHCs could make up for the loss of services from Planned Parenthood and expand to serve more patients, especially in the face of significant revenue losses that will result from the reduction in the share of patients with Medicaid and the growth in uninsured that are spurred by the 2025 Budget Reconciliation Law.

Publicly-funded Clinics Vary in Capacity to Offer Best Practices in Family Planning Services

Additionally, the Trump Administration recently announced that programs that are deemed federal “public benefits” are barred from serving individuals who are undocumented. This includes Title X and health centers. As a result, clinics receiving Title X and Section 330 funds may be denied these funds if they do not verify immigration status for the patients they serve. This is in conflict with federal law that requires community health clinics to serve patients regardless of immigration status, so questions remain about how this new limitation will be implemented.

Indian Health Service and Rural Health Clinics

Indian Health Service (IHS) clinics and Rural Health Clinics are also part of the reproductive health safety net that provides contraceptives and will likely be affected by cuts to Medicaid. IHS, an agency under the Department of Health and Human Services, provides a wide range of federal health services to approximately 2.8 million American Indian and Alaska Native (AIAN) individuals via a network of hospitals, clinics and health stations. Federal regulations require IHS to cover health promotion and disease prevention services, which include family planning services and STI services. However, the availability of contraceptive methods varies by clinic. While services at IHS and tribal clinics are provided with no cost-sharing, services are generally only available to members or descendants of members of federally recognized Tribes who live on or near federal reservations. An estimated 70% of revenues generated by reimbursements come from Medicaid. Given projected growth in the uninsured due to the 2025 Budget Reconciliation Law, IHS facilities could have fewer resources to cover the costs of the reproductive health care they provide to Native American communities.

Clinics that are part of the Rural Health Clinic program are certified by the Centers for Medicare & Medicaid Services (CMS) because they are located in rural areas designated as shortage areas and are required to provide primary and preventive care and basic laboratory services. Rural Health Clinics consist of a network of about 4,500 clinics and receive enhanced reimbursement rates for services provided to Medicaid and Medicare patients. Rural Health Clinics can provide contraceptives, but like IHS clinics, the extent of contraceptive services that are provided varies by clinic and state. The ban on federal Medicaid payments to Planned Parenthood clinics could also put pressure on Rural Health Clinics in certain locations to provide additional reproductive health care services, particularly for women who live in rural communities that have been historically served by Planned Parenthood.

Measles Elimination Status: What It Is and How the U.S. Could Lose It

Author: Josh Michaud
Published: Jul 28, 2025

Measles has been officially “eliminated” from the U.S. since 2000, which means the country had not seen very large outbreaks and had not had 12 months or more of uncontrolled domestic transmission of the virus since before that time. However, in just the first half of 2025 the U.S. has reported more cases of measles – 1,309 confirmed cases as of July 15 – than in any year since 1992. In addition, state and local health departments, which have key responsibilities for measles prevention and response efforts across the country, are contending with reduced support from the federal government under the current administration and staffing and budget cuts in many jurisdictions. Further, the past few years have seen more skepticism among the public about the safety and effectiveness of measles vaccines and a decline in trust of health authorities in general, contributing to lower vaccination rates and complicating outreach and communication efforts to combat measles.

What does this mean for U.S. elimination status and control of the disease going forward? This policy watch provides an overview of measles elimination, including how this status is decided and declared, and its significance. Further, we assess how the current measles outbreak may threaten elimination status and what that might mean for control of measles in the U.S.

Measles and the Measles Vaccine

Measles is one of the most contagious human viruses. When spreading in a population with no prior immunity, it is estimated that on average one measles case can result in 12- 18 other cases (this is the basic “reproduction number” of measles). While most measles infections are not severe, health complications can occur in about 30% of measles cases, and around 1 in 1,000 measles infections lead to death. There is a higher risk of severe outcomes in young children and immunocompromised individuals. Among the 1,309 confirmed measles cases so far in 2025, 164 (13%) were hospitalized and three deaths have occurred. Besides the risk of the infection itself, measles can also have long-lasting negative impacts on the immune system more broadly, especially in children, leaving people more prone to serious outcomes from other infections. Those who recover from a measles infection usually develop long-term immunity to further measles infection.

Measles vaccines have been available in the U.S. since 1963 and are safe and effective at providing protection against illness and, importantly, against infection and onward transmission of the virus. It is estimated that two doses of a measles-containing vaccine are 97% effective in preventing infection. CDC recommends children get their first measles vaccine dose between 12 and 15 months of age, and the second dose between 4 and 6 years of age, before entering school. Currently, the most common measles-containing vaccine in the U.S. is the combination measles, mumps and rubella (MMR) vaccine. Epidemiologists estimate that when >95% of a population has immunity to measles, through previous infection or vaccination, then “herd immunity” is reached and measles transmission is interrupted and large outbreaks will not occur. Therefore, at least 95% coverage with two doses of the measles vaccine is a common goal for immunization campaigns and is the current Healthy People 2030 target in the U.S. However, it was estimated that national two-dose MMR coverage in the United States is for children entering kindergarten in 2023 was 92.7%, a figure that had declined from 94.7% in 2011. In addition, this coverage varied significantly across states, ranging from 79.6% in Idaho to 98.3% in West Virginia. Just 11 states had reported coverage levels at 95% or above in 2023-2024. So far in 2025, 92% of measles cases have occurred in unvaccinated individuals.

National, Regional, and Global Measles Elimination Goals and Prior U.S. Certifications

The first national goal to interrupt measles transmission in the U.S. was announced in 1966, just a few years after licensure of the first measles vaccine, and CDC announced further measles elimination goals in 1978 and 1993. In 1994, the member states of the Pan American Health Organization (PAHO, the Americas regional office of the World Health Organization (WHO) that includes the U.S.) set a goal of interrupting endemic measles virus transmission in the region by the year 2000 and in 2012, member states of the WHO endorsed a Global Vaccine Action Plan that included a measles elimination goal for all six WHO regions by 2020.

Despite setting multiple goals since 1966, the U.S. did not officially achieve measles elimination status until 2000. Verification of elimination was carried out first through internal CDC and external expert review of U.S. strategy and programs to address measles, and epidemiological data on cases and vaccinations, which were compared against predetermined benchmarks for success. In March 2000, the National Immunization Program at CDC convened an external panel of experts to review the available data, and the panel concluded that criteria for elimination had been met, and officially stated that measles had eliminated from the U.S. Subsequently, a process was undertaken to re-verify U.S. elimination status in 2011, when the CDC’s National Center for Immunization and Respiratory Diseases assembled panel of external experts to review available evidence on U.S. measles programs and epidemiology since 2000. The panel agreed that measles elimination had been maintained, issuing a final report in March 2012. The U.S. has continued to review measles elimination status over time, including through an external expert committee known as the U.S. National Sustainability Committee for the Elimination of Measles, Rubella, and Congenital Rubella Syndrome.

Given the region-wide goal set in 1994, PAHO has also reviewed and verified national measles elimination for countries of the Americas, including the U.S. In 2007, PAHO member states created an international committee to verify country-level interruption of measles transmission and called for the creation of national-level commissions to help compile and submit related documentation to PAHO for review by an expert committee. Subsequently, PAHO’s Measles and Rubella Elimination Regional Monitoring and Re-Verification Commission (MRE-RVC) has met regularly to review available evidence and issue reports on the status of elimination in PAHO member states with the U.S. consistently being designated as having “sustained elimination,” including in its most recent report from November 2024.

What Does it Mean to “Eliminate” Measles?

According to the guidelines developed by the U.S. and other PAHO member states, measles elimination has been defined at a basic level as: “Interruption of endemic measles virus transmission for a period greater than or equal to 12 months, in the presence of high-quality surveillance.” By contrast, measles is considered endemic in a given area if there is continuous transmission over a 12-month period.

In their review processes, CDC and external experts have used a variety of epidemiological and programmatic indicators, such as measles cases and transmission patterns, public health measures and response capabilities, and vaccination rates to help determine if endemic measles transmission has been “interrupted” and whether surveillance is “high-quality.” For example, when experts reviewed data for re-certification of measles elimination for the U.S. in 2011, the following primary lines of evidence were used (most covering the period 2001 to 2011) and the committee decided collectively that the data supported the conclusion that endemic measles virus transmission was interrupted in the presence of high-quality surveillance:

  • There were fewer than one reported measles case per 10 million population;
  • The great majority of measles cases were imported from areas outside the U.S. and most imported cases did not lead to further spread inside the U.S. – over the study period, 40% of cases were found to be imported;
  • The number and size of measles outbreaks over that period were small: a total of 64 outbreaks (median 4 outbreaks/year), with a median outbreak size of 6 cases. Only 16 outbreaks included 10 or more cases;
  • Measles vaccination rates among children had been sustained at high levels (>95%) over the study period, with no significant differences in coverage by race/ethnicity;
  • Data from national surveys indicated that population immunity to measles was above the “herd immunity” threshold; almost all age groups had seropositivity rates for measles antibodies over >95%, and;
  • Programmatic data on laboratory testing and case investigation performance indicated that U.S. surveillance adequately and quickly identified measles cases and transmission chains.

Prior to 2025, the largest outbreak of measles since U.S. elimination was declared occurred in 2018-2019. Imported measles cases in late 2018 had started a large outbreak centered in several close-knit communities with low vaccination rates in New York City and surrounding counties. As more measles cases came to be identified, state and local officials began to implement public health measures to combat the outbreak including declaring a public health emergency, mandating vaccinations and instituting fines for parents not vaccinating their children, which led to 60,000 MMR vaccine doses administered in affected areas in a few months. Authorities also closed schools where measles transmission occurred, prohibited unvaccinated children from attending school, and engaged in extensive communication and outreach efforts. At the time, federal agencies such as CDC provided technical assistance and other support and made clear statements about the importance of measles vaccinations, with then-CDC Director Robert Redfield stating “I encourage all Americans to adhere to CDC vaccine guidelines in order to protect themselves, their families, and their communities from measles” and pointing out that “organizations had been deliberately targeting these communities with inaccurate and misleading information about vaccines.” The White House also echoed this, with President Trump stating “vaccinations are so important” and encouraging parents to vaccinate their children against measles. These combined efforts were effective in containing the New York outbreak in under 12 months, as transmission was interrupted by August 2019.

Does the Current Outbreak Threaten U.S. Measles Elimination Status?

In the first half of 2025 alone the U.S. has had more measles cases, outbreaks, affected states, and deaths than in any year since 1992. In addition, although many of the U.S. outbreaks this year began with imported cases, a higher percentage of cases are due to local transmission vs. importation compared to previous years. Further, U.S. MMR vaccination rates have declined to levels below that needed for herd immunity. While the pace of reported measles cases has declined since a peak earlier this year, outbreaks are ongoing and more states are reporting outbreaks over time. According to CDC data, as of July 15, 2025 there have been:

  • 1,309 confirmed measles cases, or approximately 3.8 cases per million population
  • 40 states with confirmed measles cases, with 16 states reporting 10 or more cases
  • 29 outbreaks (defined as 3 or more related cases)
  • 12% of cases imported
  • 164 hospitalizations and 3 deaths from measles

Compared to the elimination period of 2001 to 2011 discussed above, each of these metrics is significantly worse. There were 64 measles outbreaks in total over ten years (2001 -2011) but in the first 6 months of 2025 there have already been 29 outbreaks. While 40% of measles cases were imported in the 2001-2011 period, in 2025 just 12% of cases were imported (meaning more local transmission chains). There was one measles death over ten years during the elimination period, while there have already been three already in 2025. Many data points this year are also worse than those from 2019, when U.S. measles elimination status was last threatened. For example, from January to October 1, 2019 (by which time the large outbreaks centered in New York had been contained), there had been 1,249 total measles cases, and 22 total outbreaks across 17 states; in 2025 those numbers have already been surpassed.

Primary responsibility for public health responses to measles sits with state and local health departments. At the moment, metrics on state and local capacities and response times for measles are not available, so gauging whether U.S. surveillance remains “high-quality” is challenging. However, in 2025, state and local public health departments have faced significant cuts in funding and support from the federal government compared to previous years, which may impact their ability to track and respond to measles outbreaks. In recent years, the federal government has provided over half of state and local health public health departments’ budgets. There is little evidence that states most affected by measles in 2025, such as Texas and New Mexico, have taken the kinds of measures that New York officials implemented to contain outbreaks in 2019: vaccination mandates, school restrictions and fines. While federal agencies such as CDC have been providing technical assistance and funding to affected areas in 2025, HHS Secretary Robert F. Kennedy, Jr. has downplayed the risks of measles and has provided mixed messages about the importance of vaccination compared to alternative treatments for measles.

Data also show that national measles vaccination levels declined over the past five years, with kindergarten and childhood measles coverage rates dipping well below the 95% goal. Measles vaccination rates for kindergarteners at the national level declined from 95.2% in 2019-2020 to 92.7% in 2023-2024 (the latest available data), and over three-quarters of states had MMR vaccination rates below the target rate of 95% in the latest data. Additional studies have found that 78% of U.S. counties reported a decline in two-dose measles vaccine coverage in children, with the average county-level measles vaccination rate falling from 93.9% in 2019 to 91.3% in 2024. In 2025, 8% of U.S. measles cases had history of MMR vaccination while 92% of cases were unvaccinated or had unknown vaccination status. These lower MMR vaccination rates have occurred in the context of broad declines in people’s trust in health authorities and in vaccinations in general. For example, KFF polling has found that parents are frequently exposed to misinformation about measles and the MMR vaccine, and in 2025 almost 20% of adults report they believe the false claim that “getting the measles vaccine is more dangerous than become infected with measles” is probably or definitely true.

Therefore, if current trends hold through the rest of the year there would appear to be grounds for the U.S. to lose measles elimination status, using prior definitions and benchmarks.

U.S. Measles Outbreaks in a Regional and Global Context

The U.S. is not alone in facing higher numbers of measles cases in 2025. There have also been large outbreaks in Canada (3,517 confirmed cases) and Mexico (2,597 reported cases). Similar to the U.S, these countries’ outbreaks are concentrated in communities with low vaccination rates. According to PAHO, in the region of the Americas a total of 7,132 confirmed cases of measles and 13 deaths from measles infections have been reported as of mid-June, with almost all coming from North America. WHO reports that through June of this year, there have been a total of 108,074 measles cases globally with large outbreaks occurring in the European and Eastern Mediterranean regions, in addition to the Americas. Outside of North America, the countries with the highest numbers of measles cases in 2025 include Yemen (15,683 cases), Pakistan (12,732), and India (10,299). More circulation of measles regionally and globally means a higher risk that U.S. residents traveling internationally can be exposed, which raises the risk of importing measles and sparking new domestic outbreaks.

Looking Ahead

The elimination of measles in the U.S. was a notable public health achievement made possible by sustained investments in prevention and response capacities, support of vaccination, and commitment to the goal of elimination. However, this status is currently at risk, as demonstrated by the many factors discussed above. Losing measles elimination status would signify that the same commitment to measles prevention and control may no longer be present in the U.S. It could signify a future where measles is endemic and continuously circulating, especially if vaccination rates continue to decline. That would bring more hospitalizations and more deaths, particularly among vulnerable children, from a very preventable disease. There could be broader implications for communities across the country, which may have to contend with more frequent decisions about whether and when to close day cares and schools in the face of transmission risks. The societal costs of measles outbreaks are high, so continuous outbreaks would place an additional burden on already weakened and depleted public health systems, and would raise questions about what the appropriate level of support and funding should be from the federal government for outbreak response at the state and local levels.

Medicaid Enrollment and Unwinding Tracker

Published: Jul 28, 2025

Enrollment Data

Note: The data presented below are updated monthly as new Medicaid/CHIP enrollment data become available.

The Medicaid Enrollment and Unwinding Tracker presents the most recent data on monthly Medicaid/CHIP enrollment reported by the Centers for Medicare & Medicaid Services (CMS) as part of the Performance Indicator Project as well as archived data on renewal outcomes reported by states during the unwinding of the Medicaid continuous enrollment provision. The unwinding data were pulled from state websites, where available, and from CMS.

Medicaid/CHIP enrollment trends generally use February 2020 as the baseline month because it was the month prior to the start of the COVID-19 pandemic and implementation of the continuous enrollment provision. During continuous enrollment, which was in place during the three years of the pandemic, states paused Medicaid disenrollments. As a result, when the continuous enrollment provision ended in March 2023, national Medicaid/CHIP enrollment had increased to a record high of 94 million enrollees. Beginning April 1, 2023, states could resume disenrolling people after conducting renewals to verify eligibility for the program, though some states delayed the start of their unwinding periods until May, June, or July 2023. Most states took 12 months to complete unwinding renewals and nearly all states completed renewals by August 2024.

The figures below show Medicaid and CHIP enrollment from February 2020 through the most current month of available data. Some figures also include enrollment for adults and children in Medicaid/CHIP. Key enrollment trends as of April 2025 include:

  • There are 78.4 million people enrolled in Medicaid/CHIP nationally (Figure 1). This represents a 17% decline from total Medicaid/CHIP enrollment in March 2023, but is still 10% higher than Medicaid/CHIP enrollment in February 2020, prior to the pandemic (Figure 2 and Table 1).
  • Several factors likely explain why national Medicaid/CHIP enrollment is higher than pre-pandemic enrollment. The pandemic may have encouraged some people who were previously eligible for Medicaid but not enrolled to newly enroll in the program. During the unwinding, many states took steps to improve their renewal processes, which reduced the number of people who were disenrolled despite remaining eligible. In addition, some states expanded eligibility for certain groups since the start of the pandemic, such as the Affordable Care Act’s (ACA) Medicaid expansion.
  • Medicaid/CHIP enrollment is higher than pre-pandemic levels in all but nine states (AR, CO, ID, IA, MT, NM, TN, TX, and WV). Enrollment changes from pre-pandemic baseline vary from a 16% decrease in Montana to a 54% increase in North Carolina (Figure 2). Many of the states with the largest increases in enrollment expanded eligibility since the start of the pandemic. For example, five states (NE, OK, MO, SD, and NC) implemented the Medicaid expansion between October 2020 and December 2023 and Maine increased the income limit for children to qualify for Medicaid.
  • In the 49 states and DC with complete enrollment data by age, there are 37.2 million children (48%) and 40.1 million adults (52%) enrolled, a change from pre-pandemic (February 2020) enrollment patterns when children made up a slight majority (51%) of Medicaid/CHIP enrollees (Figure 1).
  • Child enrollment in Medicaid/CHIP is below pre-pandemic enrollment in 15 states, while adult enrollment is below pre-pandemic levels in 7 states (Figure 2).
  • There are 71.1 million people enrolled in Medicaid and 7.3 million people enrolled in CHIP (Figure 1). More states report Medicaid enrollment above their pre-pandemic baselines compared to the number reporting CHIP enrollment above the baseline (Figure 2).
National Enrollment in Medicaid/CHIP, February 2020 to April 2025
Cumulative Percent Changes in Enrollment from February 2020 to April 2025
Total Medicaid/CHIP Enrollment, Selected Time Periods

Unwinding Data – Archived

Note: The data on unwinding renewal outcomes presented below were last updated on September 12, 2024; since most states have now completed the Medicaid unwinding, the information will not be updated again.

As of September 12, 2024 and with nearly complete unwinding data for most states: 

  • Over 25 million people were disenrolled (31% of completed renewals) and over 56 million people had their coverage renewed (69% of completed renewals).  
  • Disenrollment rates varied across states from 57% in Montana to 12% in North Carolina, driven by a variety of factors including differences in renewal policies and procedures as well as eligibility expansions in some states.  
  • Among those who were disenrolled, nearly seven in ten (69%) were disenrolled for paperwork or procedural reasons while three in ten (31%) were determined ineligible.  
  • Among those whose coverage was renewed during the unwinding, 61% were renewed on an ex parte, or automated, basis, meaning the individual did not have to take any action to maintain coverage. 

State Data on Renewal Outcomes

The data on unwinding-related renewal outcomes presented in this section rely primarily on monthly reports that states were required to submit to the Centers for Medicare & Medicaid Services (CMS) during the unwinding period. The data also reflect updates to the monthly reports that states submit three months after the original report submission to account for the resolution of pending cases and any other changes in renewal metrics. For 13 states, data were pulled from dashboards or reports published on state websites that provide more complete information, and for a few additional states, updated monthly reports were pulled from state websites because they were more timely than what is reported on the CMS website. 

To view archived data for specific states, click on the State Data – Archived tab.


As of August 1, 2024, States Have Reported Renewal Outcomes for Over Eight in Ten People who were Enrolled in Medicaid/CHIP Prior to the Start of the Unwinding


Medicaid Disenrollments

  • As of September 12, 2024, at least 25,198,000 Medicaid enrollees had been disenrolled during the unwinding of the continuous enrollment provision. Overall, 31% of people with a completed renewal were disenrolled in reporting states while 69%, or 56.4 million enrollees, had their coverage renewed.
  • There is wide variation in disenrollment rates across reporting states, ranging from 57% in Montana to 12% in North Carolina. A variety of factors contribute to these differences, including differences in renewal policies and system capacity. Some states adopted policies that promote continued coverage among those who remain eligible and/or have automated eligibility systems that can more easily and accurately process renewals while other states have adopted fewer of these policies and have more manually-driven systems. In addition, North Carolina and South Dakota adopted Medicaid expansion and other states increased eligibility levels for certain populations (e.g., children, parents, etc.) during the unwinding, which may have lowered disenrollment rates in these states.

At least <b>24,838,000</b> Medicaid enrollees have been disenrolled with publicly available unwinding data, as of August 1, 2024


  • Across all states with available data, 69% of all people disenrolled had their coverage terminated for procedural reasons. However, these rates vary based on how they are calculated (see note below). Procedural disenrollments are cases where people are disenrolled because they did not complete the renewal process and can occur when the state has outdated contact information or because the enrollee does not understand or otherwise does not complete renewal packets within a specific timeframe. High procedural disenrollment rates are concerning because many people who are disenrolled for these paperwork reasons may still be eligible for Medicaid coverage. 

(Note: The first tab in the figure below calculates procedural disenrollment rates using total disenrollments as the denominator. The second tab shows these rates using total completed renewals, which include people whose coverage was terminated as well as those whose coverage was renewed, as the denominator. And finally, the third tab calculates the rates as a share of all renewals due, which include completed renewals and pending cases.)

Of all people who were disenrolled, 69% were terminated for procedural reasons, as of August 1, 2024

Medicaid Renewals

  • Of the people whose coverage has been renewed as of September 12, 2024, 61% were renewed on an ex parte basis while 39% were renewed through a renewal form, though rates vary across states. Under federal rules, states are required to first try to complete administrative (or “ex parte”) renewals by verifying ongoing eligibility through available data sources, such as state wage databases, before sending a renewal form or requesting documentation from an enrollee. Ex parte renewal rates varied across states from 90% or more in Arizona, North Carolina, and Rhode Island to less than 20% in Pennsylvania and Texas. 

Overall, 61% of people who retained Medicaid coverage were renewed through ex parte processes, as of August 1, 2024

Federal Data on Renewal Outcomes

The data presented here are cumulative unwinding metrics published by CMS. These counts and percentages may differ from the above data, which present renewal metrics reported on state websites when state-reported data are more complete.  

Figure 1 below shows cumulative renewal data reported by CMS during states’ unwinding periods. Renewal data for the months after the end of states’ unwinding period are excluded. The data reflect updated unwinding data reported by states three months after the original monthly reports as they become available.   

Cumulative Medicaid Renewal Outcomes for Reporting States through April 2023

For questions about this tracker, please contact KFFTracker@kff.org

State Data – Archived

Note: The state data presented below were last updated on September 12, 2024; since most states have now completed the Medicaid unwinding, the information will not be updated again. 

The data presented here provide state-level data on enrollment trends and renewal outcomes during the unwinding period. Figure 1 shows total Medicaid enrollment by month starting in January 2023 and, once disenrollments resumed in a state, the cumulative percent change in Medicaid enrollment relative to the month before Medicaid disenrollments started (this baseline month will differ across states). Figure 2 shows renewal metrics for each month of a state’s unwinding period (or cumulative data for the unwinding period for some states). 

For total national Medicaid enrollment, click on the Enrollment Data tab.

Related Resources

Resources on unwinding data

Resources on state policies and preparations for the unwinding

Resources on pre-pandemic enrollment patterns and coverage transitions

KFF’s unwinding explainer

Medicare Advantage in 2025: Premiums, Out-of-Pocket Limits, Supplemental Benefits, and Prior Authorization

Published: Jul 28, 2025

People with Medicare have the option of receiving their Medicare benefits through the traditional Medicare program administered by the federal government or through a private Medicare Advantage plan, such as an HMO or PPO. In Medicare Advantage, the federal government contracts with private insurers to provide Medicare benefits to enrollees. Medicare pays insurers a set amount per enrollee per month, which varies depending on the county in which the plan is located, the health status of the plan’s enrollees, and the plan’s estimated costs of covering Medicare Part A and Part B services.

The plans use the payments from the federal government to pay for Medicare-covered services, and in most cases, to also pay for supplemental benefits, reduced cost sharing, and lower out-of-pocket limits, which are attractive to enrollees. Plans are able to offer these additional benefits, often without charging an additional premium for Part D prescription drugs or supplemental benefits, because in 2025, they receive an additional $2,255 per enrollee above their estimated costs of providing Medicare-covered services. This portion of plan payments, also called the rebate, has increased substantially in the last several years, more than doubling since 2018. At the same time, Medicare Advantage plans can use cost management tools, such as prior authorization requirements, which may impose barriers to receiving care. Medicare Advantage plans often have a limited network of providers, which can restrict beneficiary choice of physicians and hospitals. More than half of Medicare Advantage beneficiaries are enrolled in HMO plans that typically do not cover out-of-network services.

This brief provides information about Medicare Advantage plans in 2025, including premiums, out-of-pocket limits, supplemental benefits, and prior authorization, as well as trends over time. A companion analysis examines trends in Medicare Advantage enrollment.

Highlights for 2025:

  • In 2025, more than three quarters (76%) of enrollees in individual Medicare Advantage plans with prescription drug coverage pay no premium other than the Medicare Part B premium, which is a big selling point for beneficiaries, particularly those living on modest incomes and savings. Individual Medicare Advantage plans are available to all enrollees, unlike special needs plans (SNPs) or group plans offered to retirees by an employer or union.
  • Most Medicare Advantage enrollees are in plans that offer supplemental benefits not covered by traditional Medicare, such as vision, hearing and dental. From 2024 to 2025, access to supplemental benefits for Medicare Advantage enrollees remained relatively stable for most services. However, there were some exceptions, including a decrease in the share of individual plan enrollees in plans providing remote access technologies, over the counter benefits, and transportation benefits. The share of SNP enrollees in plans that offered bathroom safety devices increased, while the share of SNP enrollees in plans that offered transportation benefits, remote access technologies, and acupuncture decreased.
  • There was a sharp increase in the share of enrollees in plans offering a rebate against the Part B premium typically less than $10 a month. Among enrollees in individual Medicare Advantage plans, the share that received a Part B premium rebate increased from 12% in 2024 to 32% in 2025. However, among these enrollees, about half are in plans that offer rebates of less than $10 a month while fewer (36%) are in plans that offer rebates of $50 or more per month.
  • Nearly all Medicare Advantage enrollees (99%) are in plans that require prior authorization for some services, which is generally not used in traditional Medicare. Prior authorization is most often required for relatively expensive services, such as skilled nursing facility stays (99%), Part B drugs (98%), inpatient hospital stays (acute: 96%; psychiatric: 93%) and outpatient psychiatric services (80%) and is rarely required for preventive services (7%).

In 2025, more than three quarters of Medicare Advantage enrollees (76%) are in plans with no premium other than the Part B premium.

In 2025, most people (76%) enrolled in individual Medicare Advantage plans with prescription drug coverage (MA-PDs) pay no premium other than the Medicare Part B premium ($185.00 in 2025) (Figure 1). The MA-PD premium includes both the cost of Medicare-covered Part A and Part B benefits and Part D prescription drug coverage. In 2025, 96% of Medicare Advantage enrollees in individual plans open for general enrollment are in plans that offer prescription drug coverage.

Distribution of Medicare Advantage Prescription Drug Plan (MA-PD) Enrollees, by Premium, 2025

Altogether, including those who do not pay a premium, the average enrollment-weighted premium in 2025 is $13 per month, and averages $7 per month for just the Part D portion of covered benefits, substantially lower than the average premium of $39 for stand-alone prescription drug plans (PDP) in 2025. Higher average PDP premiums compared to the MA-PD drug portion of premiums is due in part to the ability of MA-PD sponsors to use rebate dollars from Medicare payments to lower their Part D premiums. When a plan’s estimated costs for Medicare-covered services are below the maximum amount the federal government will pay private plans in an area (known as the benchmark), the plan retains a portion of the difference, known as the “rebate”. According to the Medicare Payment Advisory Commission (MedPAC), rebates average over $2,250 per enrollee in 2025 for individual plans, with individual plans allocating 8% of these rebates for reduced Part D premiums and another 15% for enhanced Part D benefits.

For the remaining 24% of beneficiaries who are in plans with a MA-PD premium (4.9 million), the average premium is $53 per month, and averages $32 for the Part D portion of covered benefits.

Premiums paid by Medicare Advantage enrollees have declined since 2015.

Average MA-PD premiums have declined from $36 per month in 2015 to $13 per month in 2025, down slightly from $14 in 2024 (Figure 2). Average MA-PD premiums have declined markedly for local PPOs, declining from $65 per month in 2015 to $15 per month in 2025. Premiums for HMOs have also declined steadily from $28 per month in 2015 to $11 per month in 2025. Only regional PPOs, which represent a very small and declining share of enrollment, have seen an increase in plan premiums over this time from $36 per month in 2015 to $75 per month in 2025. Nearly 6 in 10 Medicare Advantage enrollees in Part D plans (MA-PDs) are in HMOs (54%), 45% are in local PPOs, and 1% are in regional PPOs in 2025. The reduction in premiums for nearly all plans is driven in part by the decline in premiums for local PPOs and HMOs, that account for a rising share of enrollment over this time period, as well as the increase in rebates paid by Medicare to these plans.

Since 2015, a rising share of plans estimate that their cost of providing Medicare Part A and Part B services (the “bid”) is below the maximum amount that CMS will pay in the area where the plan operates (the “benchmark”). The difference between bids and benchmarks enables plans to offer coverage that typically includes extra benefits without charging an additional premium. As plan bids have declined, the rebate portion of plan payments has increased. Additionally, because rebates are adjusted for the health status of enrollees, rebates have increased as risk scores have increased. (A risk score is a measure that reflects an enrollee’s expected health care costs based on their health status and demographic characteristics, with higher risk scores translating to higher payments to plans.) Plans are allocating some of these rebate dollars to lower the part D portion of the MA-PD premium. According to MedPAC, rebates for individual plans have increased from an average of about $924 per enrollee in 2015 to over $2,250 per enrollee in 2025. This trend contributes to greater availability of zero-premium plans, which brings down average premiums.

Average Monthly Medicare Advantage Prescription Drug Plan Premiums, Weighted by Plan Enrollment, 2010-2025

The average out-of-pocket limit for Medicare Advantage enrollees is $5,320 for in-network services and $9,547 for both in-network and out-of-network services (PPOs).

Since 2011, federal regulation has required Medicare Advantage plans to provide an out-of-pocket limit for services covered under Parts A and B. In contrast, traditional Medicare does not have an out-of-pocket limit for covered services.

In 2025, the out-of-pocket limit for Medicare Advantage plans may not exceed $9,350 for in-network services and $14,000 for in-network and out-of-network services combined. These out-of-pocket limits apply to Part A and B services only, and do not apply to Part D spending. Due to a provision in the Inflation Reduction Act, starting in 2025, Medicare beneficiaries are paying no more than $2,000 (indexed annually for growth in Part D costs) out of pocket for prescription drugs covered under Part D.

HMOs generally only cover services provided by in-network providers so typically do not have a limit for out-of-network services. However, about 6 million Medicare Advantage enrollees are in HMOs that are Point-of-Service plans (HMOPOS), which allow out-of-network care for certain services, though they typically cost more than services received in-network. PPOs also cover services delivered by out-of-network providers but charge enrollees higher cost sharing for this care. The size of Medicare Advantage provider networks for physicians and hospitals vary greatly both across counties and across plans in the same county.

In 2025, the enrollment-weighted average for out-of-pocket limits for Medicare Advantage enrollees is $5,320 for in-network services and $9,547 for in-network and out-of-network services combined. For enrollees in HMOs, the average out-of-pocket (in-network) limit is $4,091 (Figure 3). Enrollees in HMOs are generally responsible for 100% of costs incurred for out-of-network care. For local and regional PPO enrollees, the average out-of-pocket limit for both in-network and out-of-network services is $9,519, and $11,001, respectively.

Average Medicare Advantage Plan Out-of-Pocket Limits, Weighted by Plan Enrollment, 2025

The average out-of-pocket limit for in-network services has generally trended down from 2017 ($5,297), though increased slightly from $4,882 in 2024 to $5,320 to 2025. The average combined in- and out-of-network limit for PPOs slightly increased from $8,707 in 2024 to $9,547 in 2025.

Most Medicare Advantage enrollees, including enrollees in special needs plans (SNPs), are in plans that offer some benefits not covered by traditional Medicare in 2025.

Virtually all enrollees in individual Medicare Advantage plans (those generally available to Medicare beneficiaries) are in plans that offer primarily health related supplemental benefits including eye exams and/or glasses (more than 99%), dental care (98%) hearing exams and/or aids (95%), and a fitness benefit (94%) (Figure 4). Similarly, most enrollees in SNPs are in plans that offer these benefits. However, benefits such as in-home support services are less common for enrollees in both individual plans (7%) and SNPs (11%). This analysis excludes employer-group health plans because employer plans do not submit bids, and available data on supplemental benefits may not be reflective of what employer plans actually offer.

Though these benefits are widely available, the scope of specific services varies. For example, a dental benefit may include preventive services only, such as cleanings or x-rays, or more comprehensive coverage, such as crowns or dentures. Plans also vary in terms of cost sharing for various services and limits on the number of services covered per year, many impose an annual dollar cap on the amount the plan will pay toward covered service, and some have networks of dental providers that beneficiaries must choose from.

Enrollees in SNPs have greater access than other Medicare Advantage enrollees to transportation (80% vs 28%), meal benefits (82% vs 70%), bathroom safety devices (68% vs 32%), over the counter benefits (97% vs 79%), and in-home support services (11% vs 7%). However, as noted above, it is not known what share of enrollees have used these benefits because data are not yet available.

Share of Medicare Advantage Enrollees in Plans with Extra Benefits by Benefit and Plan Type, 2025

As of 2020, Medicare Advantage plans have been allowed to include telehealth benefits as part of the basic Medicare Part A and B benefit package – beyond what was allowed under traditional Medicare prior to the public health emergency, and was extended to September 2025. Therefore, these benefits are not included in the figure above because their cost is not covered by either rebates or supplemental premiums. Medicare Advantage plans may also offer supplemental telehealth benefits via remote access technologies and/or telemonitoring services, which can be used for those services that do not meet the requirements for coverage under traditional Medicare or the requirements for additional telehealth benefits (such as the requirement of being covered by Medicare Part B when provided in-person). Less than half of enrollees in both individual plans and SNPs are in plans that offer remote access technologies (49% and 46%, respectively), and just 3% of enrollees in individual plans and 1% of enrollees in SNPs have access to telemonitoring services.

Nearly all Medicare Advantage enrollees are in plans that offer vision, dental, and hearing benefits, similar to 2024, while fewer are offered remote access technologies, over-the-counter benefits, or transportation.

In 2025, there were modest changes to the share of enrollees in plans that offer specific benefits compared to 2024. Similar shares of enrollees in individual plans are in plans that offer eye exams and/or eyeglasses, dental benefits, and hearing exams and/or aids (Figure 5). Smaller shares of enrollees are in plans that offer over-the-counter benefits (88% in 2024 vs 79% in 2025), remote access technologies (72% in 2024 vs 49% in 2025), and transportation benefits (36% in 2024 vs 28% in 2025).

For those in Special Needs Plans (SNPs), similar shares of enrollees are in plans that offer eye exams and/or eyeglasses, dental benefits, and hearing exams and/or aids. Larger shares of SNP enrollees are in plans that offer bathroom safety devices (49% in 2024 vs 68% in 2025).

However, smaller shares of SNP enrollees are in plans that offer transportation benefits (91% in 2024 vs 80% in 2025), remote access technologies (78% in 2024 vs 46% in 2025), acupuncture (49% in 2024 vs 40% in 2025), and in-home support services (23% in 2024 vs 11% in 2025).

Despite concerns that recent changes to how Medicare Advantage payments are adjusted for enrollee health status, overall, Medicare Advantage enrollees have not experienced a substantial loss in access to supplemental benefits, and in some cases, access to certain benefits has increased. While the share enrolled in plans that offer benefits appears to have remained mostly stable from 2024 to 2025 and has increased substantially from 2015 for many benefits, this analysis does not account for any changes to the design of benefits, which could make benefits more or less generous, such as changes to eligibility for these benefits, prior authorization requirements, networks of providers, required cost-sharing, or the comprehensiveness coverage.

Additionally, while CMS collects data on the use and spending for supplemental benefits, these data are not currently available to researchers or consumers. Further, CMS does not collect data on prior authorization requests and denials for these benefits.

Share of Medicare Advantage Enrollees In Plans with Select Extra Benefits, by Benefit and Plan Type, 2015-2025

The share of enrollees in plans that offer a rebate against the Part B premium has increased substantially from 2024 to 2025, although the dollar values of the rebates are small.

In 2025, nearly a third (32%) of individual plan enrollees were in plans that offer a Part B rebate, a sharp increase since 2024, where 12% of enrollees were in plans with Part B rebates. Although the Part B rebate is often used in Medicare Advantage marketing (sometimes described as “money back in your Social Security check”), for most enrollees, the dollar value of the rebate is very small relative to the $185 standard Part B premium in 2025. Among the 6.8 million beneficiaries in an individual Medicare Advantage plan that provides a Part B rebate, more than half (3.4 million) are in plans that offer rebates of less than $10 a month (Figure 6). In contrast, 36% are in plans that offer rebates of $50 or more per month.

Similarly, 44% of SNP enrollees were in plans that offer a Part B rebate, up from just 7% in 2024. Among SNP enrollees, 36% are in plans with a rebate of less than $10 a month. Most SNP enrollees are dually eligible for Medicare and Medicaid, and Medicaid pays the Part B premiums on their behalf (except in Puerto Rico). When dually-eligible individuals enroll in a Medicare Advantage plan with a Part B rebate, the state Medicaid program receives the Part B premium rebate payment from the plan.

Distribution of Part B Rebate Amounts Among Medicare Advantage Enrollees

Enrollees in SNPs are more likely to be in plans that offer Special Supplemental Benefits for the Chronically Ill (SSBCI) than other Medicare Advantage enrollees.

Beginning in 2020, Medicare Advantage plans have also been able to offer supplemental benefits that are not primarily health related for chronically ill beneficiaries, known as Special Supplemental Benefits for the Chronically Ill (SSBCI). In addition, Medicare Advantage plans participating in the Value-Based Insurance Design Model (which will be discontinued at the end of 2025) may also offer these non-primarily health related supplemental benefits to their enrollees, but can use different eligibility criteria than required for SSBCI, including offering them based on an enrollee’s socioeconomic status (e.g., LIS eligibility) or whether the enrollee lives in an underserved area. While this analysis provides information on the share of Medicare Advantage enrollees in plans that offer these SSBCI benefits, data on how many beneficiaries use these benefits and how often they use them are not currently available.

The vast majority of individual plan enrollees and about half of SNP Medicare Advantage enrollees are in plans that do not offer these benefits. In 2025, the share of Medicare Advantage enrollees offered SSBCI is highest for food and produce—13% of individual plan enrollees (2.9 million), and the vast majority (94%) of SNP enrollees (6.8 million) are offered this benefit (Figure 7).

The other SSBCI benefits that are most commonly offered are general supports for living (e.g., housing, utilities) (10% in individual plans and 80% for SNPs) and transportation for non-medical needs (9% for individual plans and 41% for SNPs). About 4% of enrollees of enrollees in individual plans are offered pest control (vs 24% of enrollees in SNPs), and a similar share of enrollees in individual plans (3%) are offered meals beyond a limited basis, a social needs benefit (e.g., community programs), and indoor air quality equipment and services (e.g., air conditioning units), though the share of enrollees in SNPs who have access to these benefits is higher (13%, 18%, and 22%, respectively). Smaller shares of enrollees are in plans that offer services supporting self-direction (e.g., power of attorney for health services, financial literacy classes) (2% in individual plans and 5% for SNPs), complementary therapies (those offered alongside traditional medical treatment) (2% in individual plans and 5% for SNPs) and structural home modifications (0.5% for individual plans and 5% for SNPs).

Share of Medicare Advantage Enrollees in Plans with Special Supplemental Benefits for the Chronically Ill (SSBCI), by Benefit and Plan Type, 2025

In addition to the 10 initially enumerated examples of SSBCI provided by CMS, plans are also able to offer “other” extra benefits specified by the plan, including pet care/service animal supplies (3% in individual plans and 8% for SNPs) and personal care (3% in individual plans and 19% for SNPs) (Figure 7). About 5% of SNP enrollees are in plans that offer hairstyling and beauty care, 3% are in plans that offer memory care, and 2% are in plans that offer roadside and travel assistance, and home cleaning (for enrollees in individual plans, these shares are 2%, 1%, and less than 1%, respectively). However, this is not an exhaustive list of additional benefits plans may offer.

While the share of enrollees with plans that offer some SSBCI benefits has increased since 2021, such as food and produce, growth for other benefits has been much slower.

Though the share of SNP enrollees in plans with food and produce benefits, general supports for living benefits, and transportation for non-medical needs has grown considerably since 2021, the share of enrollment in plans for other SSBCI benefits has grown much more slowly, particularly for enrollees in individual plans (Figure 8). For example, the share of SNP Medicare Advantage enrollees with food and produce benefits has increased from 21% in 2021 to 94% in 2025—with the sharpest growth from 2024 (49%) to 2025 (94%)—while for individual plans, the share of enrollees with these benefits has nearly doubled, but only from 7% to 13%. For general supports for living benefits, the share of SNP Medicare Advantage enrollees with these benefits has also significantly increased from 10% to 80%—with the sharpest growth between 2024 and 2025—while for individual plans, the share has more than tripled, but only from 3% to 10%.

Like for other supplemental benefits, the scope of services for SSBCI benefits varies. For example, many plans offer a specified dollar amount that enrollees can use toward a variety of benefits, such as food and produce, utility bills, rent assistance, and transportation for non-medical needs, among others. This dollar amount is often loaded onto a flex card or spending card that can be used at participating stores and retailers, which can vary depending on the vendor administering the benefit. Depending on the plan, this may be a monthly allowance that expires at the end of each month or rolls over month to month until the end of the year, when any unused amount expires.

Share of Medicare Advantage Enrollees in Plans with Special Supplemental Benefits for the Chronically Ill (SSBCI), by Benefit and Plan Type, 2021-2025

Nearly all Medicare Advantage enrollees are in plans that require prior authorization for many higher-cost services.

Medicare Advantage plans can require enrollees to receive prior authorization before a service will be covered, and nearly all Medicare Advantage enrollees (99%) are in plans that require prior authorization for some services in 2025 (Figure 9). Prior authorization is most often required for relatively expensive services, such as skilled nursing facility stays (99%), Part B drugs (98%), inpatient hospital stays (acute: 96%; psychiatric: 93%) and outpatient psychiatric services (80%) and is rarely required for preventive services (7%). Prior authorization is also required for the majority of enrollees for some extra benefits (in plans that offer these benefits), including comprehensive dental services, and hearing and eye exams. The number of enrollees in plans that require prior authorization for one or more services stayed around the same from 2024 to 2025. In contrast to Medicare Advantage plans, traditional Medicare does not generally require prior authorization for services and does not require step therapy for Part B drugs.

While Medicare Advantage insurers are now required to publish some data on timeliness and use of prior authorization, information is not currently available on how prior authorization requests, denials, and appeals vary by type of service, plan, or enrollee characteristics because CMS does not collect or report this information.

Share of Medicare Advantage Enrollees Required to Receive Prior Authorization, by Service, 2025

Nancy Ochieng, Meredith Freed, Jeannie Fuglesten Biniek, and Tricia Neuman are with KFF. Anthony Damico is an independent consultant.

Methods

This analysis uses data from the Centers for Medicare & Medicaid Services (CMS) Medicare Advantage Enrollment, Benefit and Landscape files for the respective year.

In previous years, KFF had used the term Medicare Advantage to refer to Medicare Advantage plans as well as other types of private plans, including cost plans, PACE plans, and HCPPs. However, since 2022, KFF has excluded cost plans, PACE plans, HCPPs in addition to MMPs. We exclude these other plans as some may have different enrollment requirements than Medicare Advantage plans (e.g., may be available to beneficiaries with only Part B coverage) and in some cases, may be paid differently than Medicare Advantage plans. These exclusions are reflected in both current data as well as data displayed trending back to 2010.

Medicare Advantage in 2025: Enrollment Update and Key Trends

Published: Jul 28, 2025

Enrollment in Medicare Advantage, the private plan alternative to traditional Medicare, has increased steadily over the past two decades, with more than half of eligible beneficiaries enrolled in Medicare Advantage since 2023. The growth in enrollment has implications for federal spending, because according to the Medicare Payment Advisory Commission (MedPAC), Medicare payments to private plans are higher than spending for similar beneficiaries in traditional Medicare. In 2025, payments are 20% more per person, which translates into an additional $84 billion in federal spending this year, substantially larger than the $18 billion in higher spending a decade ago when about one-third of eligible beneficiaries were enrolled in a Medicare Advantage plan.

Given the enrollment and spending trends, policymakers have become increasingly focused on how Medicare pays private plans, though without broad agreement on how or when to move forward. In part, the difficulty stems from concerns about the effects of payment changes for beneficiaries’ choice among plans and access to supplemental benefits, such as coverage of dental, vision and hearing.

To better understand trends in the growth of the Medicare Advantage program, this brief provides current information about enrollment, including by plan type and firm. A second, companion analysis describes Medicare Advantage premiums, out-of-pocket limits, supplemental benefits offered, and prior authorization requirements in 2025.

Highlights for 2025:

  • More than half (54%) of eligible Medicare beneficiaries are enrolled in Medicare Advantage in 2025. While a growing share of Medicare beneficiaries are enrolled in a Medicare Advantage plan, the pace of the increase in enrollment slowed in 2025.
  • In 2025, one in five (21%) Medicare Advantage enrollees is in a special needs plan (SNP), reflecting a steady increase in recent years. Almost half (48%) of the total increase in Medicare Advantage enrollment between 2024 and 2025 was among SNPs, up from 43% in the prior year.
  • More than 80% of SNP enrollment is in plans designed for people who are dually eligible for Medicare and Medicaid (D-SNPs), though plans for people with certain chronic conditions (C-SNPs) saw a surge in enrollees in 2025. Enrollment in C-SNPS increased by more than 70% between 2024 and 2025, compared to 3% for D-SNPs and 0% for institutional-SNPs.
  • Medicare Advantage enrollment is highly concentrated among plans owned by a small number of parent organizations, with UnitedHealth Group leading the market, and, together with Humana, accounting for nearly half (46%) of all Medicare Advantage enrollees nationwide, consistent with the pattern in 2024. Since 2024, market shares for the leading parent organizations have remained roughly the same. However, in absolute numbers, UnitedHealth Group had the largest growth in enrollment, with 505,000 more enrollees in 2024 than in 2025, followed by Elevance Health, which gained 249,000 enrollees. In contrast, enrollment in Humana plans decreased by about 297,000 between 2024 to 2025.

More than half of eligible Medicare beneficiaries are enrolled in Medicare Advantage in 2025.

In 2025, more than half (54%) of eligible Medicare beneficiaries – 34.1 million out of about 62.8 million Medicare beneficiaries with both Medicare Parts A and B – are enrolled in Medicare Advantage plans. Medicare Advantage enrollment as a share of the eligible Medicare population has jumped from 19% in 2007 to 54% in 2025 (Figure 1).

Total Medicare Advantage Enrollment, 2007-2025

Between 2024 and 2025, total Medicare Advantage enrollment grew by about 1.3 million beneficiaries, or 4%– a somewhat smaller growth rate than the prior year (7%). The Congressional Budget Office (CBO) projects that the share of all Medicare beneficiaries enrolled in Medicare Advantage plans will rise to 64% by 2034 (Figure 2).

Medicare Advantage and Traditional Medicare Enrollment, Past and Projected

In 2025, nearly two-thirds of Medicare Advantage enrollees are in individual plans that are open for general enrollment.

More than 6 in 10 Medicare Advantage enrollees (62%), or 21.2 million people, are in plans generally available to all beneficiaries for individual enrollment (Figure 3). That is an increase of 0.7 million enrollees compared to 2024. While individual plans comprised a stable share of total Medicare Advantage enrollment in 2025 compared to 2024, their share of enrollment has declined since 2010 when they comprised 71% of all enrollees. The decline in the share of enrollment in individual plans is due to faster enrollment growth in special needs plans (SNPs), especially since 2018.

Distribution of Medicare Advantage Enrollment, 2010-2025

Special needs plans (SNPs) comprise a growing share of Medicare Advantage enrollment.

Nearly 7.3 million Medicare beneficiaries are enrolled in special needs plans (SNPs). SNPs restrict enrollment to beneficiaries with significant or relatively specialized care needs, or who qualify because they are eligible for both Medicare and Medicaid. SNPs comprise a growing share of Medicare Advantage enrollment, accounting for 21% of enrollees in 2025 compared with 14% of enrollees in 2020, reflecting small, but steadily year-over-year increases (Figure 3).

The increase in SNP enrollment is consistent with the increasing number of SNP plans available on average and more dual-eligible individuals having access to these plans since the Bipartisan Budget Act of 2018 made SNPs a permanent part of the Medicare Advantage programextra benefits

Most SNP enrollees (83%) are in plans for beneficiaries dually enrolled in both Medicare and Medicaid (D-SNPs), a decline from 88% in 2024 (Figure 4). Another 16 percent of SNP enrollees are in plans for people with severe chronic or disabling conditions (C-SNPs) – an increase from 10 percent in 2024 – and 2 percent are in plans for beneficiaries requiring a nursing home or institutional level of care (I-SNPs), the same as 2024.

While D-SNPs are designed specifically for dually-eligible individuals, among the 3.9 million dually-eligible enrollees with full benefits enrolled in Medicare Advantage plans in 2021, most (57%) were in D-SNPs while 28% were in Medicare Advantage plans that are generally available to all beneficiaries (not designed specifically for the dually-eligible population).

Number and Share of Beneficiaries in Special Needs Plans, 2010-2025

SNP enrollment varies across states. In the District of Columbia and Puerto Rico, SNP enrollees comprise about half of all Medicare Advantage enrollees (49% in DC and 51% in PR). In ten states, SNP enrollment accounts for at least a quarter of Medicare Advantage enrollment: 47% in MS, 38% in AR, 34% in LA and NY, 30% in FL, 29% in GA and SC, 27% in AL, 26% in CT, and 25% in Oklahoma. In the remaining 40 states, fewer than a quarter of Medicare Advantage enrollees are in SNPs.

C-SNP enrollment in 2025 (about 1.2 million people) is 71% higher than it was in 2024 – an increase of about 480,000 enrollees. Nearly all (97%) C-SNP enrollees are in plans for people with diabetes or cardiovascular conditions in 2025. Enrollment in I-SNPs has been generally unchanged with approximately 115,000 enrollees in 2025, the same as 2024.

Slightly less than one in five (17% or about 5.7 million) Medicare Advantage enrollees are in a group plan offered to retirees by an employer or union.

Group enrollment as a share of total Medicare Advantage enrollment has fluctuated between 17% and 20% since 2010, but the number of enrollees has increased from 1.8 million in 2010 to 5.7 million in 2025. The 2025 enrollment in group plans is essentially unchanged from 2024, the first time in about a decade that enrollment in this type of plan has been relatively flat year-to-year (Figure 5). With a group plan, an employer or union contracts with an insurer and Medicare pays the insurer a fixed amount per enrollee to provide benefits covered by Medicare. For example, 13 states provided health insurance benefits to their Medicare-eligible retirees exclusively through Medicare Advantage plans in 2024.

Number of Beneficiaries in Employer Group or Union-Sponsored Health Plans, 2010-2025

As with other Medicare Advantage plans, employer and union group plans may provide additional benefits and/or lower cost sharing than traditional Medicare and are eligible for bonus payments if they obtain required quality scores. The employer or union (and sometimes the retiree) may also pay an additional premium for these supplemental benefits. Group enrollees comprise a quarter or more of Medicare Advantage enrollees in eight states: Alaska (100%), Michigan (36%), New Jersey (32%), West Virginia and Maryland (29% for both), Vermont (28%), and Illinois and Kentucky (27% for both).

Medicare Advantage enrollment is highly concentrated among a small number of parent organizations.

The average Medicare beneficiary is able to choose from Medicare Advantage plans offered by 9 parent organizations in 2025, similar to 2024, and over one-third of beneficiaries (36%) can choose among Medicare Advantage plans offered by 10 or more parent organizations. (Note, these numbers are slightly different than what was reported in a previous KFF publication due to differences in how parent organizations are identified, see Methods for more details.)

UnitedHealth Group and Humana account for nearly half of all Medicare Advantage enrollees nationwide in 2025.

Despite most beneficiaries having access to plans operated by several parent organizations, Medicare Advantage enrollment is highly concentrated among a small number of parent organizations. UnitedHealth Group Inc. accounts for 29% of all Medicare Advantage enrollment in 2025, or 9.9 million enrollees. Together, UnitedHealth Group Inc. and Humana Inc. (17%) account for nearly half (46%) of all Medicare Advantage enrollees nationwide, nearly the same share as 2024. In more than a quarter of counties (26%; or 815 counties), these two organizations account for at least 75% of Medicare Advantage enrollment. These counties include East Baton Rouge (Baton Rouge), LA (81%), Clark County (Las Vegas), NV (75%), Travis County (Austin), TX (77%), and El Paso County (Colorado Springs), CO (72%).

Three other parent organizations comprise more than 5% of Medicare Advantage enrollment: CVS Health Corporation (12%), Elevance Health Inc, (7%), and Kaiser Foundation Health Plan Inc. (6%) (Figure 6). (In contrast, CVS Health and Centene Corporation dominate the market for stand-alone prescription drug plans (PDP) that supplement traditional Medicare, with both organizations accounting for just over half of enrollment in PDPs).

Medicare Advantage Enrollment by Parent Organization, 2025

In absolute numbers, UnitedHealth Group had the largest growth in enrollment, with 505,000 more beneficiaries enrolled in a plan sponsored by UnitedHealth Group in March 2025 than in March 2024 (Figure 7). Elevance Health had the second largest growth in enrollment, with an increase of about 249,000 beneficiaries between March 2024 and March 2025.

In contrast, enrollment in Humana plans declined, decreasing by about 297,000 between March 2024 and March 2025.

Medicare Advantage Enrollment by Parent Organization, 2024-2025

UnitedHealth Group has consistently accounted for a relatively large share of Medicare Advantage enrollment.

UnitedHealth Group has had the largest share of Medicare Advantage enrollment and largest growth in enrollment since 2010, increasing from 18% of all Medicare Advantage enrollment in 2010 to 29% in 2025. Humana has also had a relatively large share of Medicare Advantage enrollment, though it has been more stable, increasing only slightly from 16% in 2010 to 17% in 2025 (data for 2010 not shown).

Nancy Ochieng, Meredith Freed, Jeannie Fuglesten Biniek, and Tricia Neuman are with KFF. Anthony Damico is an independent consultant.

Methods

This analysis uses data from the Centers for Medicare & Medicaid Services (CMS) Medicare Advantage Enrollment, Benefit and Landscape files for the respective year. KFF uses the Medicare Enrollment Dashboard for enrollment data for March 2024 and March 2025, and the CMS Chronic Conditions Data Warehouse Master Beneficiary Summary File (MBSF) for March for earlier years. Trend analysis begins in 2007 because that was the earliest year of data that was based on March enrollment. Enrollment data is only provided for plan-county combinations that have at least 11 beneficiaries; thus, this analysis excludes approximately 400,000 individuals who reside in a county where county-wide plan enrollment does not meet this threshold.

KFF calculates the share of eligible Medicare beneficiaries enrolled in Medicare Advantage, meaning they must have both Part A and B coverage. The share of enrollees in Medicare Advantage would be somewhat smaller if based on the total Medicare population that includes 5.8 million beneficiaries with Part A only or Part B only (in 2025) who are not generally eligible to enroll in a Medicare Advantage plan.

In previous years, KFF calculated the share of Medicare beneficiaries enrolled in Medicare Advantage by including Medicare beneficiaries with either Part A and/or B coverage. We modified our approach in 2022 to estimate the share enrolled among beneficiaries eligible for Medicare Advantage who have both Medicare Part A and Medicare B. In the past, the number of beneficiaries enrolled in Medicare Advantage was smaller and therefore the difference between the share enrolled with Part A and/or B vs Part A and B was also smaller. For example, in 2010, 24% of all Medicare enrollees were enrolled in Medicare Advantage versus 25% with just Parts A and B. However, these shares have diverged over time: in 2024, 49% of all Medicare beneficiaries were enrolled in Medicare Advantage versus 54% with just Parts A and B. These changes are reflected in all data displayed trending back to 2007.

Additionally, in previous years, KFF had used the term Medicare Advantage to refer to Medicare Advantage plans as well as other types of private plans, including cost plans, PACE plans, and HCPPs. However, cost plans, PACE plans, and HCPPs are now excluded from this analysis in addition to MMPs. In this analysis, KFF excludes these other plans as some may have different enrollment requirements than Medicare Advantage plans (e.g., may be available to beneficiaries with only Part B coverage) and in some cases, may be paid differently than Medicare Advantage plans. These exclusions are reflected in all data displayed trending back to 2007.

Beginning with this analysis of 2025 Medicare Advantage enrollment, KFF relies on the parent organization field reported to CMS to identify plans sponsored by the same insurer. Previously, KFF had supplemented these data with publicly available information about acquisitions, mergers, and business relationships. The previous approach led to fewer total plan sponsors.

Medicare projections for 2026-2033 are from the June Congressional Budget Office (CBO) Medicare Baseline for 2024. Using the CBO baseline, Medicare enrollment is based on individuals who are enrolled in Part B, which is designed to include only individuals who are eligible for Medicare Advantage and exclude those who only have Part A only (~6 million people in 2026) and cannot enroll in Medicare Advantage. However, it may include some individuals who have Part B only and also are not eligible for Medicare Advantage.

Enrollment counts in publications by firms operating in the Medicare Advantage market, such as company financial statements, might differ from KFF estimates due to inclusion or exclusion of certain plan types, such as SNPs or employer group health plans.

Abortion in the United States Dashboard

On June 24, 2022, the Supreme Court overturned Roe v. Wade, eliminating the federal constitutional standard that had protected the right to abortion. Without any federal standard regarding abortion access, states will set their own policies to ban or protect abortion. The Abortion in the United States Dashboard is an ongoing research project tracking state abortion policies and litigation following the overturning of Roe v. Wade. Click on the buttons or scroll down to see all the content. It will be updated as new information is available.

Interactive DataWrapper Embed

NEW RELEASES

BALLOT MEASURES


What’s Next for State Abortion Ballot Initiatives?

This brief examines what the November election and prior efforts to enshrine abortion rights at the ballot box mean for those states and what’s next, including the future of abortion restrictions in states where voters enshrined abortion rights where abortion was banned or restricted, as well as those that do not have abortion bans.

The Opportunities and Realities of Citizen-Initiated State Ballot Abortion Measures

Presidential candidate Trump claims credit for SCOTUS’ Dobbs decision and says that as a result, the “states are voting.” States are making decisions on abortion policy, but it’s mostly been state legislatures, not voters. Few states with abortion bans have a process for citizen-initiated constitutional amendments. In those states, lawmakers and anti-abortion activists have attempted to block abortion measures from qualifying for the ballot or put roadblocks in their place.

KEY FACTS


Over four in ten (45%) abortions occur by six weeks of gestation, 36% are between seven and nine weeks, and 13% at 10-13 weeks. Just 7% of abortions occur after the first trimester.

The Vast Majority of Abortions in 2022 Occurred Prior to 10 Weeks of Gestation

MEDICATION Abortion


Availability of Telehealth for Medication Abortion in a Post-Dobbs United States, as of July 14, 2025

The Intersection of State and Federal Policies on Access to Medication Abortion Via Telehealth after Dobbs

This brief reviews current state and federal policies, ongoing litigation, and potential federal actions that may impact access to telehealth for medication abortion.

COVERAGE

Abortion Decision Renews Questions About Employer Access to Health Information

This Policy Watch takes a look at employers ability to access abortion information when their health plan covers abortion services. With some states criminalizing entities who assist in abortions, employers and providers face legal jeopardy and existing privacy laws such as HIPAA (the Health Insurance Portability and Accountability Act) may be limited in their privacy protections.


Employer Coverage of Travel Costs for Out-of-State Abortion

This Policy Watch gives an overview of employers offering to cover travel expenses for workers who need to go out of state for an abortion in the context of increasing restrictions on abortion around the country. We discuss who is offering these benefits, the implications for workers, and some of the legal and political concerns for employers.

Coverage of Abortion in Large Employer-Sponsored Plans in 2023

This brief presents findings from the 2023 KFF Employer Health Benefits Survey on coverage of abortion services in large employer-sponsored health plans, changes employers made to abortion coverage since the 2022 Supreme Court ruling, and employers’ provision of financial assistance for travel out of state to obtain an abortion.

RACIAL & ETHNIC DISPARITIES

Pregnancy-Related Mortality (per 100,000 births) by Race and Ethnicity, 2017-2019

Pregnancy-Related Mortality (per 100,000 births) by Race and Ethnicity, 2017-2019

Native Hawaiian or Pacific Islander, American Indian or Alaskan Native and Black people are more likely to die while pregnant or within a year of the end of pregnancy compared to White people

State Abortion Policies by Race and Ethnicity Among Women Ages 18-49, 2022

State Abortion Policies by Race and Ethnicity Among Women Ages 18-49, 2022

Six in ten of Black (60%) and AIAN (59%) women ages 18-49 live in states with abortion bans or restrictions. Just over half (53%) of White women ages 18-49 live in states with bans or restrictions, while less than half of Hispanic (45%) and about three in ten Asian (28%) and NHPI (29%) women ages 18-49 live in these states

Polling

KFF Health Tracking Poll March 2024: Abortion in the 2024 Election and Beyond

This poll finds 1 in 8 voters say abortion is the most important issue to their vote. They are younger, lean Democratic, and generally want abortion to be legal in all or most cases. The poll also gauges the public’s views on abortion-related policies, including a national 16-week abortion ban and allowing abortion for pregnancy-related emergencies.


Women and Abortion in Florida

This brief provides information about abortion experiences, awareness, and attitudes of Florida women ages 18 to 49, based on findings from the 2024 KFF Women’s Health Survey, a nationally representative survey on health care issues.

Women and Abortion in Arizona

This brief provides information about abortion experiences, awareness, and attitudes of Arizona women ages 18 to 49, based on findings from the 2024 KFF Women’s Health Survey, a nationally representative survey on health care issues.

STATE PROFILES FOR WOMEN'S HEALTH

Abortion Policies by State

State gestational limits, waiting periods & ultrasound requirements, insurance coverage and medication abortion restrictions

Poll Finding

KFF Health Tracking Poll: Public Finds Prior Authorization Process Difficult to Manage

Published: Jul 25, 2025

Topline-KFF-Health-Tracking-Poll-July-2025

Findings

Key Takeaways

  • A large majority of the public (73%) think that delays and denials of services and treatments by health insurance companies are a major problem. Majorities across demographic groups agree that denials and delays of care are a major problem, with at least two-thirds across income groups and majorities across partisanship. Six in ten (57%) Republicans, eight in ten (79%) independents, and over eight in ten (84%) Democrats consider delays and denials of services by health insurance companies to be a major problem.
  • In June, a group of health insurance companies, along with Secretary of Health and Human Services Robert F. Kennedy, Jr. and Administrator of the Centers for Medicare & Medicaid Services Dr. Mehmet Oz, announced a voluntary initiative to reduce the burden of prior authorizations for patients, but few people have heard of the initiative to reduce the burden of prior authorizations. Just two in ten (20%) adults say they’ve heard “a lot” or “some” about this new initiative. In addition, few people think it’s likely that health insurance companies will follow through on this pledge, with six in ten adults saying it is “not too likely” or “not at all likely” that health insurance companies will follow through on the voluntary initiative in a way that makes a difference for patients.
  • The process of getting prior authorizations feels burdensome for many. Among the half (51%) of insured adults who say they have had to get a prior authorization in the past 2 years, many report difficulty navigating the process. Almost half (47%) of those who were required to get a prior authorization in the past two years say it was “somewhat difficult” (34%) or “very difficult” (13%) to navigate the process of getting prior approval for a health care service, treatment, or needed medication.

Prior Authorizations

Recently, Secretary of Health and Human Services Robert F. Kennedy Jr. and Administrator of the Centers for Medicare & Medicaid Services Dr. Mehmet Oz joined with insurance companies to announce a new voluntary initiative in which dozens of health insurance companies pledged to reduce the burden of prior authorizations. The pledge included promises from health insurance companies to require prior authorization less often, speed up the review process, and use clear language when communicating with patients.

The pledge addresses an issue that most of the public views as a problem. Three-quarters (73%) of adults say that delays and denials of health care services by health insurance companies are “a major problem,” with another two in ten (21%) who say it’s “a minor problem.” Few adults (6%) don’t think delays or denials are a problem. Majorities across partisans agree, including large majorities of Democrats (84%) and independents (79%) and over half of Republicans (57%) saying delays or denials of care by insurance companies are a major problem.

In fact, agreement spans many demographic groups, with at least two-thirds across income groups and insurance type saying delays and denials of care by insurance providers are a major problem.

Large Majorities Across Partisanship, Income, and Insurance Type Consider Delays and Denials of Health Care Services by Insurance Companies a Major Problem

Very few adults have heard of the newly announced initiative to reduce the burden of prior authorizations, with two in ten saying they’ve heard “a lot” or “some” about it. Another quarter (23%) have heard “a little,” while more than half (56%) have heard “nothing at all” about the pledge.

Adults under age 65 who purchase their own insurance are more likely to say they have heard about the initiative, with a third (35%) saying so compared to one in seven (14%) of those who have employer-sponsored insurance. About two in ten of adults under age 65 with Medicaid (23%) and those ages 65 and older with Medicare (22%) say they’ve heard “a lot” or “some.”

Large Majorities Across Partisanship Have Not Heard of the Health Insurance Initiative To Reduce Burden of Prior Authorizations

Few people think it’s likely that health insurance companies will follow through on this pledge in a meaningful way. Six in ten adults say it is “not too likely” or “not at all likely” that health insurance companies will follow through on the voluntary initiative in a way that makes a difference for patients. Republicans are more likely than Democrats or independents to believe insurance companies will follow through, though still a very small share (9%) think it’s “very likely”, while about half (47%) think it’s “somewhat likely.” Two-thirds (67%) of independents and seven in ten (71%) Democrats think it is not likely insurance companies will follow through in a meaningful way.

Few Think It’s Likely That Health Insurance Companies Will Follow Through on Initiative To Reduce Burden of Prior Authorizations

Experiences with Prior Authorizations

One reason why most adults may see prior authorization as a problem may be because many people have had to deal with them and found them difficult to navigate.

Half (51%) of insured adults say that in the past two years, their health insurance company has required them or their health care provider to get prior authorization before they could receive a health care service, treatment, or medication that they needed.

There are no significant differences by insurance type in the share who report needing prior authorization, with about half across types of insurance saying they were required to get approval before they could get a service, treatment, or medication in the past two years. While traditional Medicare typically does not require prior authorizations for most services and medications, Medicare Advantage does require prior authorizations for enrollees seeking certain services.

Half of Insured Adults Have Been Required To Get Prior Authorization Before Receiving a Treatment or Service in the Past Two Years

Among those who face prior authorization, many report difficulty navigating the process. Almost half (47%) of those who experienced a need for prior authorization in the past two years say it was “somewhat difficult” (34%) or “very difficult” (13%) to navigate the process of getting prior approval for a health care service, treatment, or needed medication.

Half Say Process of Getting Prior Approval for Health Care Was Difficult

Many people also report experiencing delays or denials of services when they are subject to prior insurance authorization. Among all of those who reported needing prior authorization in the past two years, about half say their health insurance company has delayed their ability to get (48%, 24% of all insured adults) or denied coverage (43%, 22% of all insured adults) for a service, treatment, or medication that their doctor requested. Among all insured adults, three in ten (29%) say their health insurance company has delayed or denied their ability to get a service, treatment, or medication that they or their doctor requested in the past two years. These shares are similar across insurance types.

Three in Ten Had Their Insurance Company Deny or Delay Needed Care, Treatment, or Medication in the Past Two Years

While administrative data provides a lower instance of delays or denials in care than what individuals self-report in the latest KFF Tracking Poll, possibly due to misreporting or initial denial that was eventually approved, it is clear that many people feel like the process has delayed their care.

Some services are more often subject to prior authorization, including surgery, hospitalization, imaging services, specialty drugs, specialty medical equipment, care from a specialist, specialized lab testing, and mental health services. These individuals (69% of insured adults) report higher rates of prior authorization, delays, and denials of care.

Six in ten (62%) insured adults who say they needed at least one of these types of specialized care report that they were required to get prior authorization for a service, treatment, or medication in the past two years. More than half of this group (58%, 36% of all insured adults who needed specialized care) say their insurance delayed or denied their treatment, including 30% who experienced a delay, and 27% who experienced a denial.

Methodology

This KFF Health Tracking Poll/KFF Tracking Poll on Health Information and Trust was designed and analyzed by public opinion researchers at KFF. The survey was conducted July 8-14, 2025, online and by telephone among a nationally representative sample of 1,283 U.S. adults in English (n=1,212) and in Spanish (n=71). The sample includes 1,004 adults (n=58 in Spanish) reached through the SSRS Opinion Panel either online (n=979) or over the phone (n=25). The SSRS Opinion Panel is a nationally representative probability-based panel where panel members are recruited randomly in one of two ways: (a) Through invitations mailed to respondents randomly sampled from an Address-Based Sample (ABS) provided by Marketing Systems Groups (MSG) through the U.S. Postal Service’s Computerized Delivery Sequence (CDS); (b) from a dual-frame random digit dial (RDD) sample provided by MSG. For the online panel component, invitations were sent to panel members by email followed by up to three reminder emails.

Another 279 (n=13 in Spanish) adults were reached through random digit dial telephone sample of prepaid cell phone numbers obtained through MSG. Phone numbers used for the prepaid cell phone component were randomly generated from a cell phone sampling frame with disproportionate stratification aimed at reaching Hispanic and non-Hispanic Black respondents. Stratification was based on incidence of the race/ethnicity groups within each frame. Among this prepaid cell phone component, 135 were interviewed by phone and 144 were invited to the web survey via short message service (SMS).

Respondents in the prepaid cell phone sample who were interviewed by phone received a $15 incentive via a check received by mail. Respondents in the prepaid cell phone sample reached via SMS received a $10 electronic gift card incentive. SSRS Opinion Panel respondents received a $5 electronic gift card incentive (some harder-to-reach groups received a $10 electronic gift card). In order to ensure data quality, cases were removed if they failed two or more quality checks: (1) attention check questions in the online version of the questionnaire, (2) had over 30% item non-response, or (3) had a length less than one quarter of the mean length by mode. Based on this criterion, 1 case was removed.

The combined cell phone and panel samples were weighted to match the sample’s demographics to the national U.S. adult population using data from the Census Bureau’s 2024 Current Population Survey (CPS), September 2023 Volunteering and Civic Life Supplement data from the CPS, and the 2025 KFF Benchmarking Survey with ABS and prepaid cell phone samples. The demographic variables included in weighting for the general population sample are gender, age, education, race/ethnicity, region, civic engagement, frequency of internet use, political party identification by race/ethnicity, and education. The weights account for differences in the probability of selection for each sample type (prepaid cell phone and panel). This includes adjustment for the sample design and geographic stratification of the cell phone sample, within household probability of selection, and the design of the panel-recruitment procedure.

The margin of sampling error including the design effect for the full sample is plus or minus 3 percentage points. Numbers of respondents and margins of sampling error for key subgroups are shown in the table below. For results based on other subgroups, the margin of sampling error may be higher. Sample sizes and margins of sampling error for other subgroups are available on request. Sampling error is only one of many potential sources of error and there may be other unmeasured error in this or any other public opinion poll. KFF public opinion and survey research is a charter member of the Transparency Initiative of the American Association for Public Opinion Research.

GroupN (unweighted)M.O.S.E.
Total1,283± 3 percentage points
Party ID
Democrats439± 6 percentage points
Independents387± 6 percentage points
Republicans344± 6 percentage points
MAGA Republicans308± 7 percentage points