VOLUME 13

Myths About Raw Milk and Vaccines

This is Irving Washington and Hagere Yilma. We direct KFF’s Health Misinformation and Trust Initiative and on behalf of all of our colleagues across KFF who work on misinformation and trust we are pleased to bring you this edition of our bi-weekly Monitor.


Summary

This volume discusses politicized narratives linking vaccines to autism and misleading claims about the benefits of raw milk. It also examines the impact of perceived expertise and trust on misinformation beliefs and how AI in mental health care may unintentionally contribute to the spread of false information.


Recent Developments

False Claims Linking Vaccines to Autism May Further Hinder Vaccination Rates

LWA/Dann Tardif / Getty Images

The high number of pertussis (whooping cough) and measles cases reported in the U.S. this year compared to last year may reflect a shift in confidence in public health recommendations made by federal health officials. While vaccination remains the most effective way to prevent these diseases, a KFF analysis found a continued decline in routine immunization rates among U.S. kindergartners, with coverage for key vaccines such as MMR, DTaP, polio and varicella falling below pre-pandemic levels and, in the case of measles, below the threshold needed to prevent measles outbreaks. These trends, driven in part by vaccine misinformation and growing partisan divides over vaccine requirements, raise concerns about the potential for further declines under a Trump administration that has signaled skepticism towards vaccine effectiveness and safety.

On November 14, President-elect Donald Trump confirmed that he plans to nominate Robert F. Kennedy Jr., who has a history of sharing false or misleading claims about vaccine safety, to head the U.S. Department of Health and Human Services. During an interview on NBC’s Meet The Press, Trump suggested that Kennedy’s role would include investigating the debunked theory linking vaccines to autism, citing rising autism rates in the U.S., despite the scientific consensus that vaccines do not cause autism.

Kennedy’s claims about autism and vaccines often gain traction on social media, where other accounts amplify his message on their platform, particularly around the timing of high-profile events. For example, in the days before and after Trump announced his plan to nominate Kennedy, several X posts shared a video clip of Kennedy speaking at Hillsdale College in 2023, in which he falsely claimed that  “there’s no front-end safety testing” for routine vaccines and suggested that vaccines cause autism, as well as ADHD, sleep disorders, language delays, Tourette’s syndrome, and narcolepsy. Four X accounts with large followings and a history of spreading false claims about vaccines shared the video between November 12 and November 15, receiving hundreds of thousands to millions of views. The most popular post of the four garnered approximately 6.7 million views, 148,000 likes, 52,000 reposts, and 1,500 comments as of December 5. Top comments on the post reinforced the debunked myth that vaccines cause autism, further spreading misinformation.

False claims that vaccines cause autism have existed for years and have been repeatedly debunked. The theory that vaccines cause autism was first popularized in 1998 by a small study that was later retracted, and the study’s author lost his medical license due to falsified information. Since then, decades of credible studies have consistently shown that vaccines are not associated with autism. Still, the myth persists, and concerns about mRNA COVID-19 vaccines have led to an increase in false claims about vaccine safety, including false claims linking vaccines to autism.

Polling Insights:

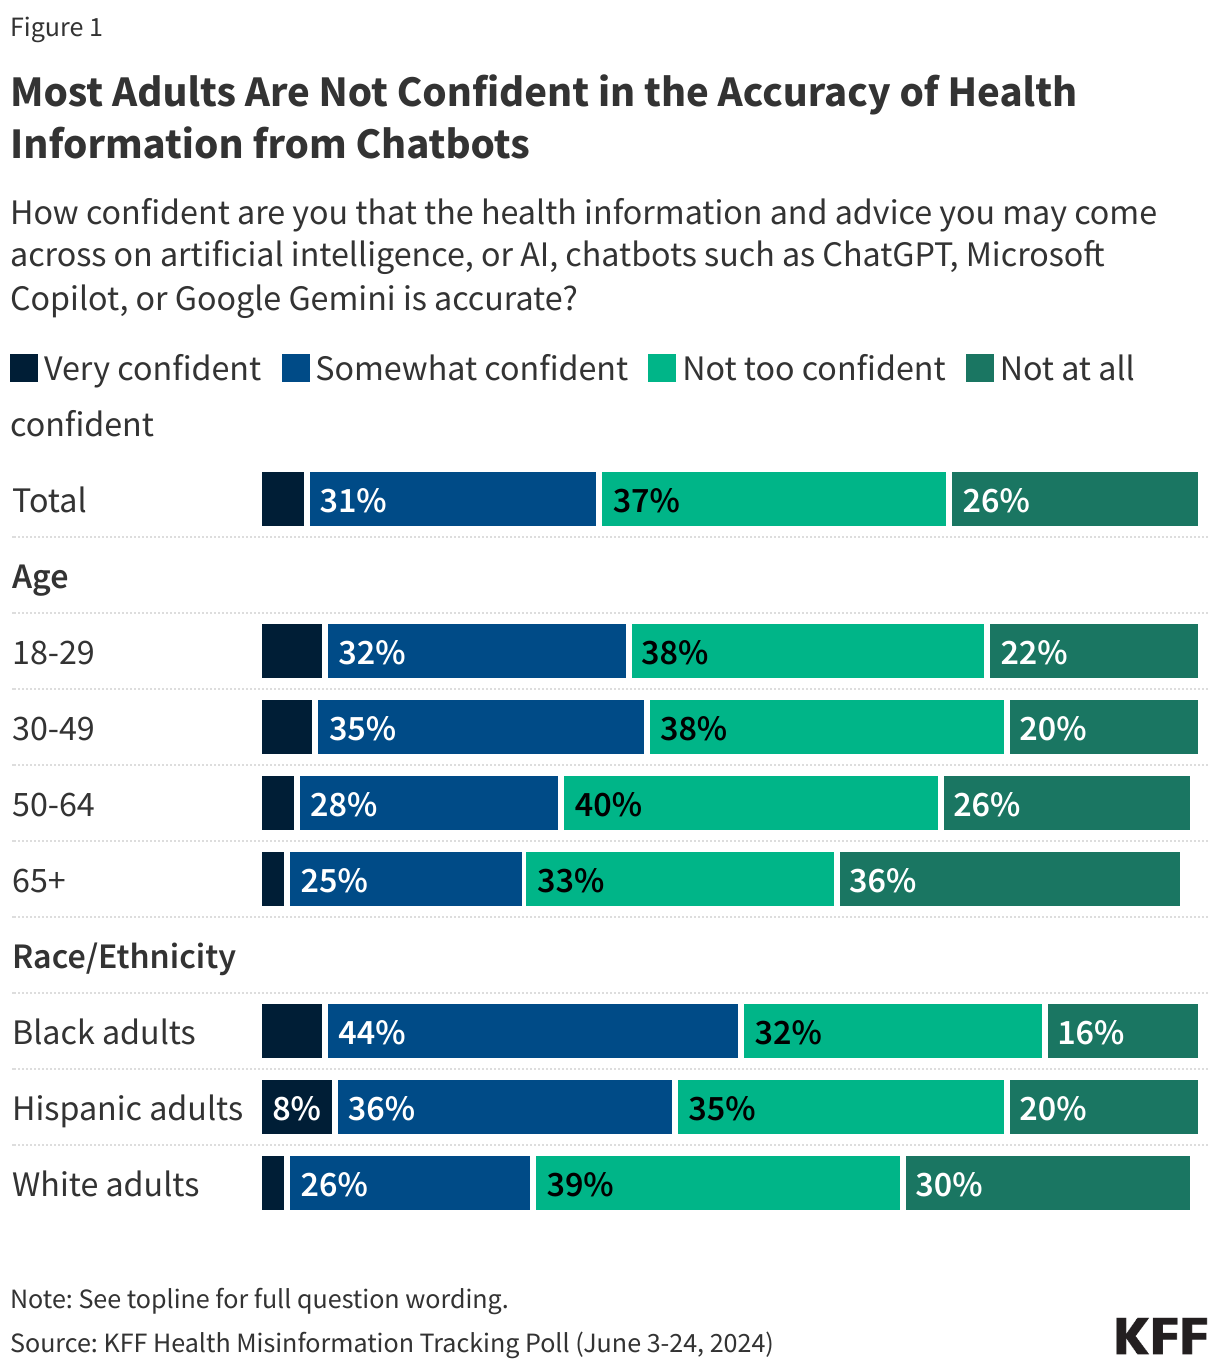
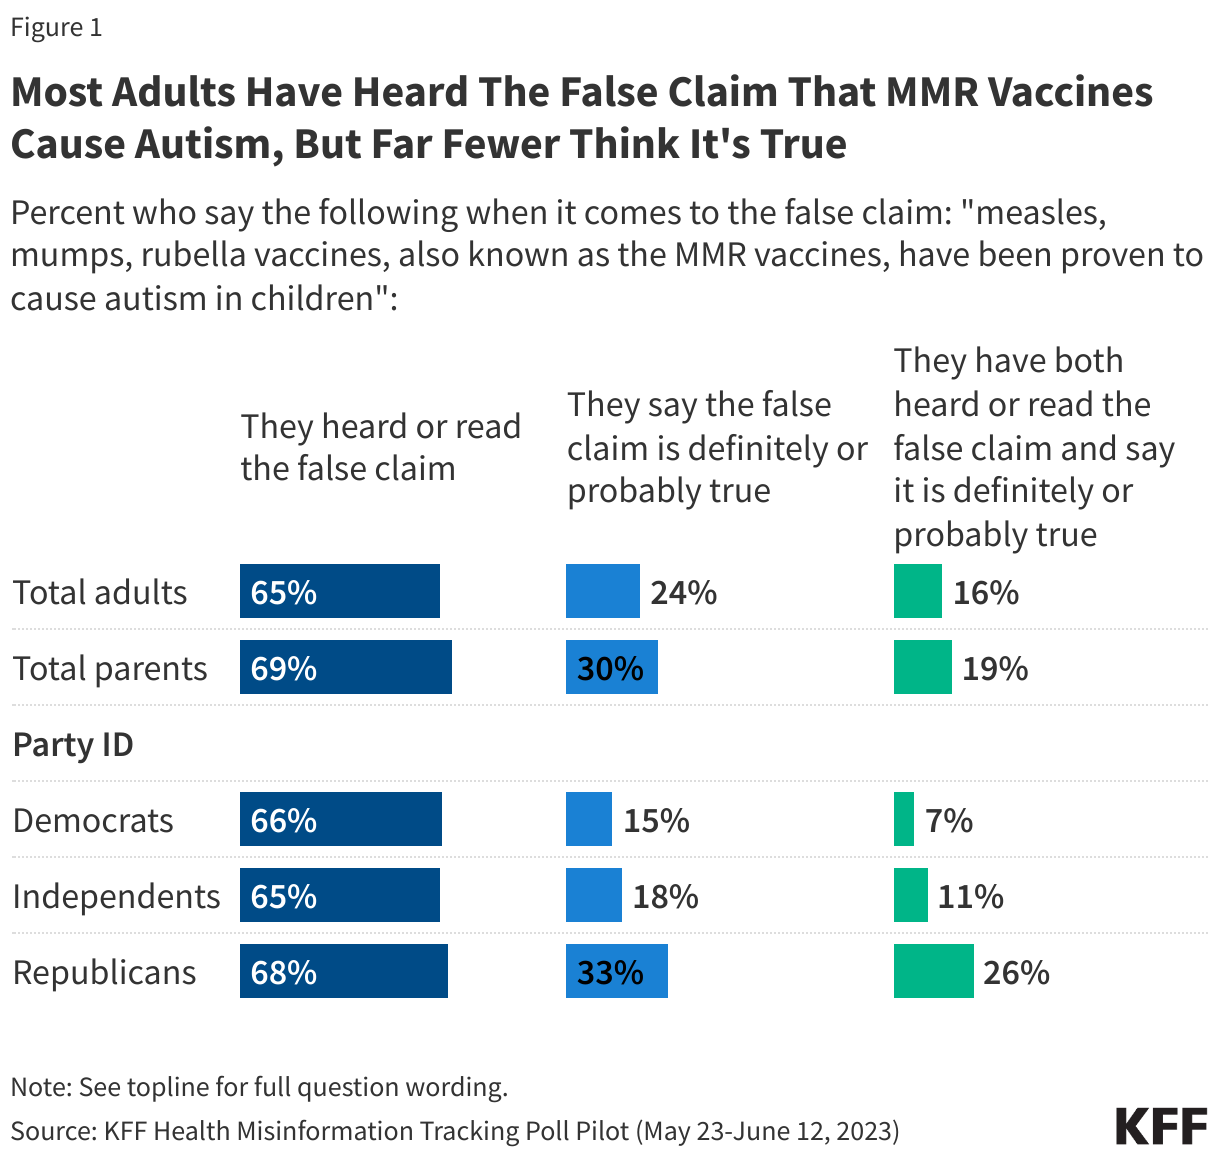
KFF polling has found that misinformation related to MMR vaccines causing autism in children was a widely-encountered piece of health misinformation, with 65% of adults, including a similar share of parents, saying they had read or heard the false claim that “MMR vaccines have been proven to cause autism in children” (Figure 1). Fewer adults overall, however, said they thought this claim was definitely or probably true (25% of adults and 30% of parents). Combining these two measures, about one in six adults (16%) and one in five parents (19%) said they both had heard that MMR vaccines cause autism and believe this is probably or definitely true.

While similar shares across partisan groups report having heard the false claim that MMR vaccines cause autism, a larger share of Republicans compared to Democrats and independents say this false claim is definitely or probably true. 

Notably, most of the public express some degree of uncertainty about the false claim that MMR vaccines have been proven to cause autism, with 43% saying it is “probably false” and 20% saying it is “probably true.”

Most Adults Have Heard The False Claim That MMR Vaccines Cause Autism, But Far Fewer Think It's True

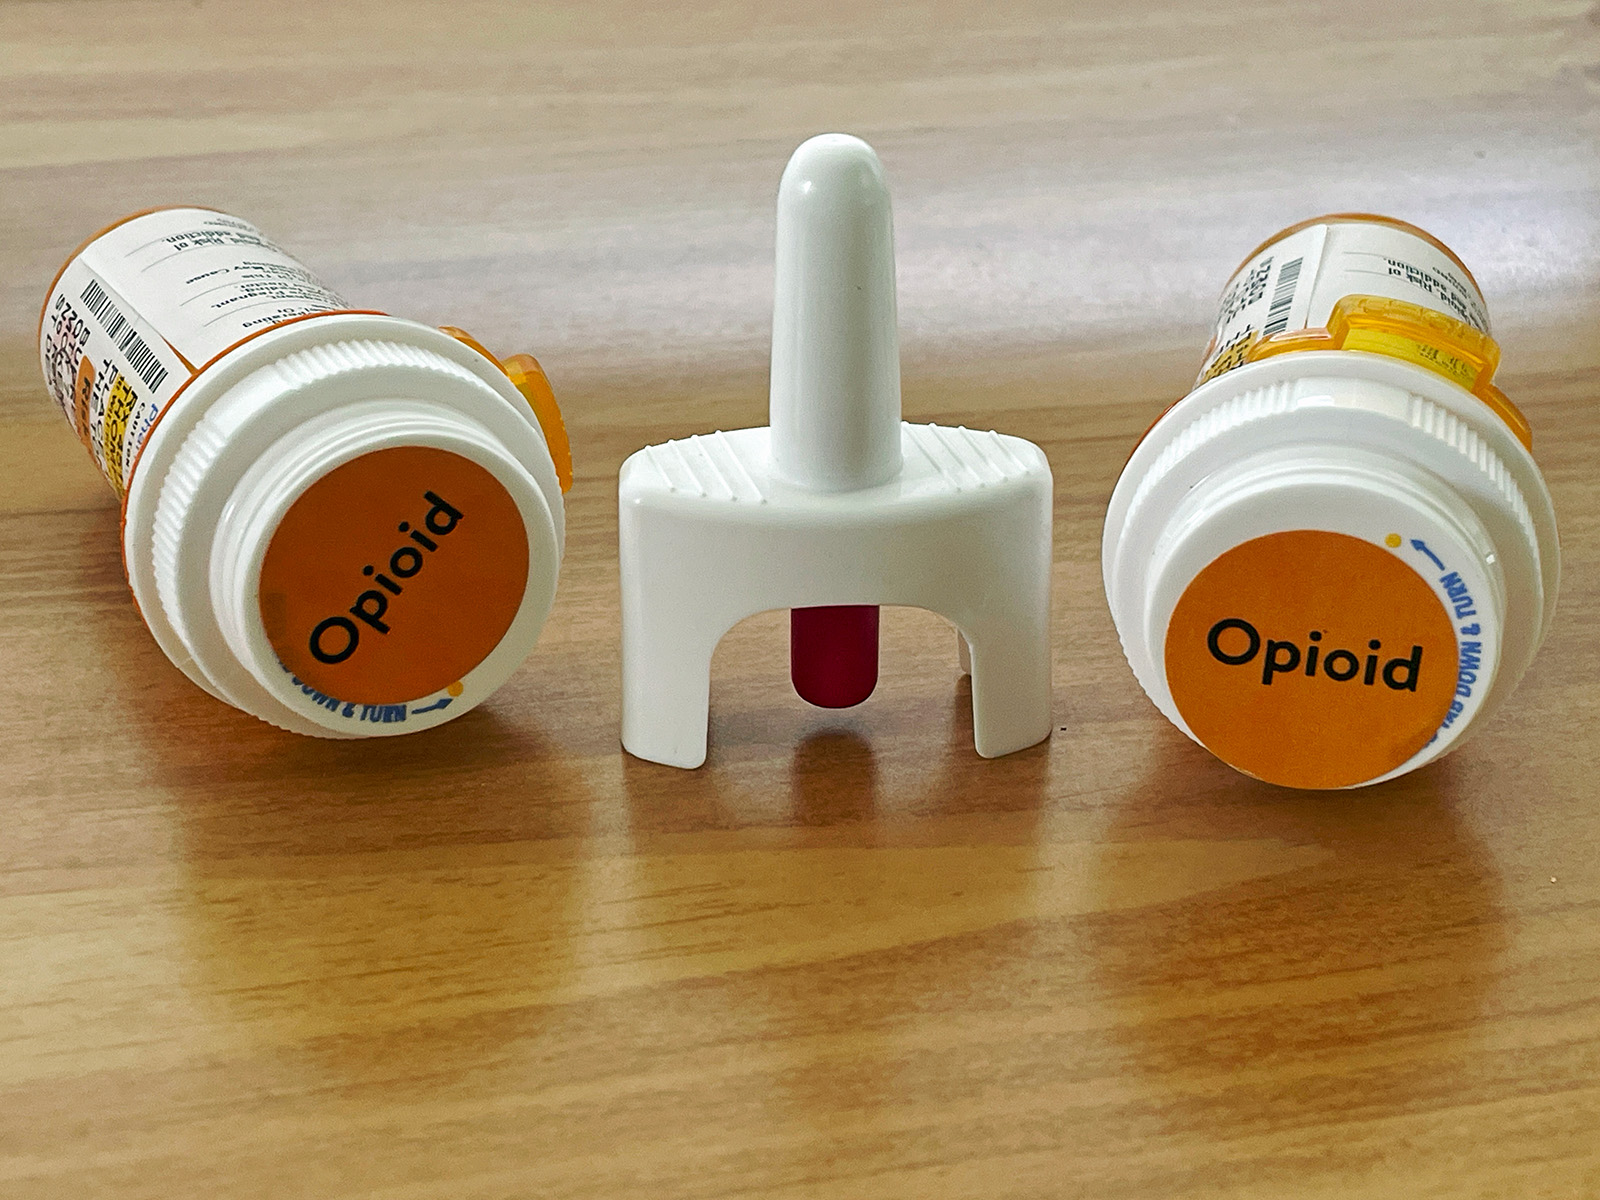
USDA Orders Bird Flu Testing for Milk Supply Amid Ongoing Raw Milk Misinformation

Nikola Stojadinovic / Getty Images

The U.S. Department of Agriculture (USDA) announced mandatory bird flu testing for the nation’s milk supply beginning December 16, after the H5N1 virus was first detected in U.S. dairy herds earlier this year. The FDA and CDC explain that pasteurization effectively neutralizes the virus, along with other germs such as E. coli and salmonella, but false claims about the health benefits of unpasteurized or raw milk may continue to motivate raw milk consumption. Social media platforms amplify the appeal of raw milk by promoting its perceived health and beauty benefits, while simultaneously claiming that federal regulatory bodies want to suppress consumption for potentially nefarious reasons.

Raw milk advocates often misrepresent the difference between pasteurized and unpasteurized milk to portray raw milk as more beneficial to health than pasteurized milk, claiming that the pasteurization process destroys healthy enzymes, probiotics, and vitamins. However, studies show that while pasteurization can reduce certain enzymes and vitamins, the levels in milk are generally too low to have a significant impact on health anyway. Advocates of raw milk also commonly cite a 2011 study to support claims that raw milk consumption reduces the risk of asthma in children. However, this study did not include a comparison group of people who consumed pasteurized milk, making it difficult to draw conclusions about the effect of pasteurization on asthma. Efforts to address these claims about raw milk should focus on clarifying these nuances rather than dismissing them as misinformation. Educating people about the science behind pasteurization and the actual nutritional content of milk can help counter misleading claims and provide a more informed perspective on raw milk.


Research Insights

Perceived Expertise Influences Trust in Nutrition Misinformation Among Youth

Klaus Vedfelt / Getty Images

A study published in the nutrition journal Appetite examined how young people process nutrition-related misinformation on social media, focusing on how perceived source expertise influences trust in the information. Researchers exposed 480 adolescents aged 16 to 22 to either accurate or misleading nutrition claims from social media profiles created for influencers, celebrities, and health journalists. They found that while adolescents did not change their beliefs or behavioral intentions after exposure to misinformation, they were more likely to trust information when it came from someone they perceived as an expert —even when that person was not a real expert and lacked health or nutrition credentials. In addition, participants struggled to identify false claims, suggesting gaps in media literacy that make young people more susceptible to misinformation from those they perceive as experts.

Source: Lissens, M., Harff, D., & Schmuck, D. (2024). Responses to (Un) healthy Advice: Processing and Acceptance of Health Content Creators’ Nutrition Misinformation by Youth. Appetite, 107812.

The Impact of Trust on Belief in Fake News, Conspiracy Theories, and Vaccine Hesitancy 

Tero Vesalainen / Getty Images

A study published in PLOS Global Health explored the relationship between people’s trust in information and their likelihood of believing fake news, conspiracy theories, and vaccine hesitancy. The researchers conducted two surveys in the United Kingdom to assess three trust-related traits, including credulity (trusting too easily), mistrust (excessive skepticism), and balanced trust. The study found that participants with high credulity were more likely to believe fake news and conspiracy theories, particularly those related to COVID-19. The study also linked childhood adversity to increased belief in fake news, conspiracy theories, and vaccine hesitancy. Mistrust and credulity were found to mediate this relationship, suggesting that disruptions in trust caused by childhood adversity may influence these beliefs and behaviors. These findings emphasize the importance of promoting balanced trust, encouraging critical thinking while avoiding excessive skepticism as a strategy for improving public health communication.

Source: Tanzer, M., Campbell, C., Saunders, R., Booker, T., Luyten, P., & Fonagy, P. (2024). The role of epistemic trust and epistemic disruption in vaccine hesitancy, conspiracy thinking and the capacity to identify fake news. PLOS Global Public Health, 4(12), e0003941. 


AI & Emerging Technology

AI Used for Mental Health Care Poses Risks of Sharing False Information

Ekaterina Goncharova / Getty Images

The growing use of AI in mental health care raises concerns about its potential to contribute to misinformation. As AI technologies like chatbots become more integrated into mental health support, there is a risk that they could provide incorrect or harmful advice, as seen with a chatbot from the National Eating Disorders Association that exacerbated eating disorders. AI’s inherent tendency to be overly confident, even when wrong, could further fuel misinformation if not properly regulated. This year, Utah enacted one of the first laws focused on addressing these risks by developing regulations to improve data privacy, protect against harmful practices, and clarify the roles of licensed professionals in using AI tools. Other states, such as Colorado and California have also introduced policies related to AI and health in other domains, but a state-by-state approach could create a confusing and inconsistent regulatory landscape.

About The Health Information and Trust Initiative: the Health Information and Trust Initiative is a KFF program aimed at tracking health misinformation in the U.S., analyzing its impact on the American people, and mobilizing media to address the problem. Our goal is to be of service to everyone working on health misinformation, strengthen efforts to counter misinformation, and build trust. 


View all KFF Monitors

The Monitor is a report from KFF’s Health Information and Trust initiative that focuses on recent developments in health information. It’s free and published twice a month.

Sign up to receive KFF Monitor
email updates


Support for the Health Information and Trust initiative is provided by the Robert Wood Johnson Foundation (RWJF). The views expressed do not necessarily reflect the views of RWJF and KFF maintains full editorial control over all of its policy analysis, polling, and journalism activities. The Public Good Projects (PGP) provides media monitoring data KFF uses in producing the Monitor.

Key Facts about the Uninsured Population

Authors: Jennifer Tolbert, Sammy Cervantes, Clea Bell, and Anthony Damico
Published: Dec 18, 2024

Issue Brief

The pandemic-era coverage policies, including the Medicaid continuous enrollment provision and the enhanced Marketplace subsidies, continued to impact health coverage in the U.S. in 2023. During the pandemic, the coverage expansions put in place by the Affordable Care Act (ACA), including Medicaid expansion and subsidized Marketplace coverage, served as a safety net for people who experienced economic and coverage disruptions. Gains in Medicaid and Marketplace coverage contributed to significant declines in the uninsured rate through 2022. Although states began the process of unwinding continuous enrollment in Medicaid in April 2023 and resumed disenrolling people from Medicaid, the full effect of Medicaid disenrollments were not felt in 2023. In addition, the enhanced Marketplace subsidies, which were extended through 2025, remained in place. Both these factors contributed to maintaining most of the coverage gains experienced during the pandemic period in 2023.

This issue brief describes trends in health coverage in 2023, examines the characteristics of the uninsured population ages 0-64, and summarizes the access and financial implications of not having coverage. Using data from the American Community Survey (ACS), this analysis examines changes in health coverage from 2022 to 2023 and compares data for 2023 to data for 2019 to report on coverage trends during the pandemic and through the start of the unwinding of the Medicaid continuous enrollment provision. Because of disruptions in data collection during the pandemic, the Census Bureau did not release 1-year ACS estimates in 2020. The analysis focuses on coverage among people ages 0-64 since Medicare offers near universal coverage for people ages 65 and older, with just 457,000, or less than 1%, of people over age 65 uninsured.

Key Takeaways

  • How many people are uninsured: Despite the unwinding of the Medicaid continuous enrollment provision that began in April 2023, the number of people ages 0-64 who were uninsured held steady at 25.3 million in 2023. However, the number of uninsured children increased from 3.8 million in 2022 to 4.0 million in 2023. Compared to 2019, the number of people who were uninsured declined by 3.6 million.
  • Who is uninsured: Most uninsured people are in low-income families and have at least one worker in the family. Reflecting the more limited availability of public coverage in some states, adults ages 19-64 are more likely to be uninsured than children. Despite gains across groups over time, racial and ethnic disparities in coverage persist.
  • Why are people uninsured: Many uninsured people cite the high cost of insurance as the main reason they lack coverage. In 2023, 63% of uninsured adults ages 18-64 said that they were uninsured because the cost of coverage was too high. Many uninsured people do not have access to coverage through a job, and some people, particularly poor adults in states that have not expanded Medicaid, remain ineligible for financial assistance for coverage. Although over half of people who are uninsured may be eligible for Medicaid or subsidized coverage in the Marketplaces, they may not be aware of these coverage options or may face barriers to enrolling. In some cases, even with subsidies, Marketplace coverage may not be affordable.
  • How does not having coverage affect health care access: People without insurance coverage are less likely to access care and more likely to delay or forgo care because of costs. Although difficult to establish direct causality, research has linked Medicaid expansion to improved health outcomes, including lower mortality rates from cancer, cardiovascular disease, liver disease, and maternal mortality.
  • What are the financial implications of being uninsured: Uninsured people often face unaffordable medical bills when they do seek care. Nearly half (49%) of uninsured adults say they have difficulty affording health care costs, more than double the share of those with private insurance (21%). These costs can quickly translate into medical debt since most people who are uninsured have low or moderate incomes and have little, if any, savings. More than six in ten (62%) uninsured adults report having health care debt compared to over four in ten (44%) insured adults.

Although coverage rates for the overall population ages 0-64 held steady in 2023, future changes to Medicaid and Marketplace coverage could have a significant impact on health coverage. Proposals that would alter how Medicaid is financed or that would impose work requirements on certain adults enrolled in the program would likely lead to a loss of Medicaid coverage. Moreover, the temporary enhanced Marketplace subsidies will expire after 2025 unless Congress acts. Without a permanent extension, the Congressional Budget Office estimates that the number of uninsured people will increase by 3.8 million, on average, in each year from 2026 to 2034. The combined Medicaid and Marketplace coverage losses could lead to a sizable increase in the number of people who are uninsured. In turn, the loss of coverage could have implications for access to care and financial stability associated with having health coverage and could lead to a worsening of disparities in health outcomes.

How many people are uninsured?

Among the population ages 0-64, both the number of uninsured (25.3 million) and the uninsured rate (9.5%) remained at historic lows in 2023. A continued decline in the number of uninsured adults ages 19-64 was offset by an increase in the number of uninsured children. Compared to 2019, prior to the start of the pandemic, the number of uninsured and the uninsured rate for the population ages 0-64 were both significantly lower in 2023. Nearly all groups experienced coverage gains, but American Indian or Alaska Native (AIAN) and Hispanic people had larger gains than their White counterparts and low-income individuals and those in working families had bigger gains than those at higher incomes and those without a worker in the family.

Key Details:

  • In 2023, 25.3 million people ages 0 to 64 were uninsured, and the uninsured rate for this population was 9.5%, both statistically unchanged from 2022. While the uninsured rate held steady from 2022, it was lower than in 2019 (10.9%) prior to the start of the coronavirus pandemic (Figure 1).
Number of the Uninsured Population 0-64, 2010-2023
  • From 2019-2023, the uninsured rate declined by 1.4%, driven primarily by gains in Medicaid and Marketplace coverage because of pandemic-era coverage protections. The Medicaid continuous enrollment provision required states to keep people enrolled in Medicaid during the pandemic in exchange for enhanced federal funding and enhanced ACA Marketplace subsidies, first enacted in the American Rescue Plan Act (ARPA) and renewed through 2025 in the Inflation Reduction Act of 2022 (IRA). Although the enhanced Marketplace subsidies remained in effect in 2023, Medicaid continuous enrollment ended on March 31, 2023, and states resumed disenrolling people from Medicaid, though the full effects of the disenrollments were not felt in 2023. During this time period, employer coverage declined by 0.5% (Figure 2).
  • While there was no change in the uninsured rate for the overall population ages 0 to 64 in 2023, the share of children 18 and younger without insurance increased from 5.1% in 2022 to 5.3% in 2023. At the same time, the uninsured rate for adults ages 19 to 64 decreased to 11.1% in 2023 from 11.3% the previous year (Figure 2). An increase in Medicaid coverage for adults 19-64 from 16.3% to 16.5% in 2023 drove the decline in the uninsured rate for this group. Despite the uptick in the uninsured rate for children in 2023, the share of children without health insurance coverage was still lower in 2023 compared to 2019.
Change in Insurance Coverage Rates Among the Population Ages 0-64, 2019-2023
  • Although nearly all groups experienced coverage gains during the pandemic-period, they were largest for AIAN and Hispanic people and individuals in low-income families. From 2019 to 2023, the uninsured rate for AIAN people fell 3.0 percentage points (from 21.7% to 18.7%) and the uninsured rate for Hispanic people decreased by 2.1 percentage points (from 20.0% to 17.9%), although these groups remain more likely to be uninsured than their White counterparts. Native Hawaiian or Pacific Islander (NHPI) people did not experience a significant decline in the uninsured rate during this period, which may, in part, reflect the smaller sample size for NHPI people, which limits the power to detect statistically significant differences. While the uninsured rate dropped for people at all income levels, individuals in low-income families1  experienced the largest declines. From 2019-2023, the uninsured rate for poor individuals dropped 2.2 percentage points (18.0% to 15.8%) and 2.7 percentage points for individuals with income 100-199% FPL (18.2% to 15.5%, Figure 3).
Change in Uninsured Rate Among the Population Ages 0-64 by Selected Characteristics, 2019-2023
  • From 2022 to 2023, the uninsured rate for the population ages 0 to 64 fell in six states (Florida, Hawaii, Illinois, Missouri, North Dakota, and Oregon) but increased in two states, Iowa and Idaho (Appendix Table A). At the same time, the uninsured rate for children increased in six states (Alabama, Idaho, New Mexico, South Carolina, Texas, and Washington). While these changes occurred in both expansion and non-expansion states, the uninsured rate was lower in expansion states (7.6%) compared to non-expansion states (14.1%) in 2023 (Figure 6).

Who is uninsured?

Most of the 25.3 million people ages 0-64 who are uninsured are adults, in working low-income families, and are people of color. Reflecting geographic variation in income and the availability of public coverage, most uninsured people live in the South or West. In addition, most who are uninsured have been without coverage for long periods of time. (See Appendix Table B for detailed data on characteristics of the uninsured population.)

Key Details:

  • In 2023, of the total uninsured population ages 0 to 64, nearly three in four (73.7%) had at least one full-time worker in their family, and 11.2% had a part-time worker in their family (Figure 4). More than eight in ten (80.9%) uninsured people were in families with incomes below 400% of the federal poverty level, and nearly half (46.6%) had incomes below 200% FPL. White people made up 37.1% of the uninsured, and the remaining 62.9% included Hispanic (41.1%), Black (12.5%), and Asian (3.7%) people and people of other racial or ethnic backgrounds (Figure 4). Most uninsured individuals (74.2%) were U.S. citizens, while 25.8% were noncitizens. Almost three-quarters (73.9%) of uninsured people lived in the South or West.
Interactive DataWrapper Embed
  • Adults ages 19 to 64 are more likely to be uninsured than children. In 2023, the uninsured rate for children was 5.3%, less than half the rate for adults at 11.1%.
  • Uninsured rates in the U.S. still show clear racial and ethnic disparities. In 2023, 17.9% of Hispanic people and 18.7% of AIAN people ages 0 to 64 were uninsured—more than two and a half times the rate for White people (6.5%). Asian individuals had the lowest uninsured rate at 5.8%.
Uninsured Rates Among Population Ages 0-64 by Selected Characteristics, 2023
  • Noncitizens are more likely than citizens to be uninsured. Nearly one-third of noncitizen immigrants were uninsured in 2023, while the uninsured rate for U.S.-born citizens was 7.5% and 8.9% for naturalized citizens. (Appendix Table B).
  • Uninsured rates vary by state and by region; individuals living in non-expansion states are more likely to be uninsured (Figure 6). Six of the ten states with the highest uninsured rates in 2023 were non-expansion states (Figure 5 and Appendix Table A).
Uninsured Rates Among Population Ages 0-64 by State, 2023
  • Nearly two-thirds (64%) of people who were uninsured in 2023 have been without coverage for more than a year.2  People who have been without coverage for long periods may be particularly hard to reach through outreach and enrollment efforts.

Why are people uninsured?

Lack of access to affordable health coverage is the main reason many people say they are uninsured. A majority of working age adults in the U.S. obtain health insurance through an employer; however, not all workers are offered employer-sponsored coverage or, if offered, can afford their share of the premiums. Medicaid covers many low-income individuals, especially children, but Medicaid eligibility for adults remains limited in most states that have not adopted the ACA expansion. Marketplace subsidies make coverage more affordable for many, but even subsidized Marketplace coverage can be unaffordable for some, and few people can afford to purchase private coverage without financial assistance.

Key Details:

  • Cost is the most commonly cited reason for being uninsured. In 2023, 63.2% of uninsured adults ages 18-64 said they were uninsured because coverage is not affordable (Figure 7). Other reasons included not being eligible for coverage (27.0%), not needing or wanting coverage (26.6%), and signing up being too difficult (23.9%).
Reasons for Being Uninsured Among Uninsured Adults Ages 18-64, 2023
  • Not all workers have access to coverage through their job. In 2023, 64.7% of uninsured workers worked for an employer that did not offer them health benefits.3  Among uninsured workers who are offered coverage by their employers, cost is often a barrier to taking up the offer. From 2014 to 2024, total premiums for family coverage increased by 52%, outpacing wage growth, and the worker’s share increased by 31%.4  Low-income families with employer-based coverage spend a significantly higher share of their income toward premiums and out-of-pocket medical expenses compared to those with income above 200% FPL.5  Particularly among people working for small employers , premium contributions for dependents can be unaffordable.
  • Medicaid eligibility varies across states and eligibility for adults is limited in states that have not expanded Medicaid. As of December 2024, 41 states including DC had adopted the ACA Medicaid expansion. Two states implemented the expansion in 2023—South Dakota in July and North Carolina in December. In states that have not expanded Medicaid, the median eligibility level for parents is just 34% FPL and adults without dependent children are ineligible in most cases. Additionally, in non-expansion states, millions of poor uninsured adults fall into a “coverage gap” because they earn too much to qualify for Medicaid but not enough to qualify for Marketplace premium tax credits.
  • Many lawfully present immigrants must meet a five-year waiting period after receiving qualified immigration status before they can qualify for Medicaid. States have the option to cover eligible children and pregnant people without a waiting period, and as of May 2024, 37 states have elected the option for children and 31 states have taken up the option for pregnant individuals. Lawfully present immigrants, including those who are not eligible for Medicaid because they have not met the five-year waiting period, are eligible for Marketplace tax credits. However, Some states have taken steps to provide fully state-funded coverage to some or all immigrants who are not eligible for federal coverage.
  • Though financial assistance is available under the ACA to many of the remaining uninsured, not everyone who is uninsured is eligible for free or subsidized coverage. Nearly six in ten (14.5 million) uninsured individuals in 2023 were eligible for financial assistance either through Medicaid or through subsidized Marketplace coverage (Figure 8). However, over four in ten uninsured (10.9 million) are outside the reach of the ACA because their state did not expand Medicaid, they have an ineligible immigration status, or they were deemed to have access to an affordable Marketplace plan or offer of employer coverage.
Eligibility for Coverage Among Uninsured Population Ages 0-64, 2023

How does not having coverage affect health care access?

Health insurance makes a difference in whether and when people get necessary medical care, where they get their care, and ultimately, how healthy they are. Uninsured adults are far more likely than those with insurance to postpone health care or forgo it altogether because of concerns over costs. The consequences can be severe, particularly when preventable conditions or chronic diseases go undetected.

Key Details:

  • Uninsured adults are more likely to forgo needed care than their insured counterparts. In 2023, nearly half (46.6%) of uninsured adults ages 18 to 64 reported not seeing a doctor or health care professional in the past 12 months compared to 15.6% with private insurance and 14.2% with public coverage. Part of the reason for not accessing care among uninsured individuals is that many (42.8%) do not have a regular place to go when they are sick or need medical advice (Figure 9). But cost also plays a role. Over one in five (22.6%) adults without coverage said that they went without needed care in the past year because of cost compared to 5.1% of adults with private coverage and 7.7% of adults with public coverage. A KFF survey that asks about cost barriers for individuals and their family members reports higher percentages of both uninsured and insured people delaying or forgoing needed care due to cost.
Interactive DataWrapper Embed
  • Uninsured children were also more likely than those with private insurance or public insurance to go without needed care due to cost in 2023 (9.5% compared to 0.7% and 1.0%, respectively). Furthermore, over a quarter (27.4%) of uninsured children had not seen a doctor in the past year, compared to 4.8% of children with public coverage and 3.7% of those with private coverage (Figure 9).
  • Studies repeatedly demonstrate that uninsured individuals are less likely than those with insurance to receive preventive care and services for major health conditions and chronic diseases.6 ,7 ,8 ,9  Because people without health coverage are less likely than those with insurance to have regular outpatient care, they are more likely to be hospitalized for avoidable health problems and to experience declines in their overall health. When they are hospitalized, uninsured people receive fewer diagnostic and therapeutic services and also have higher mortality rates than those with insurance.10 ,11 ,12 ,13 ,14 
  • Research demonstrates that gaining health insurance improves access to health care considerably and diminishes the adverse effects of having been uninsured. A review of research on the effects of the ACA Medicaid expansion finds that expansion led to positive effects on access to care, utilization of services, the affordability of care, and financial security among the low-income population.
  • More recent research generally shows Medicaid expansion is associated with improved health outcomes, although establishing direct causality between health insurance and health outcomes is complex. For example, Medicaid expansion is associated with increased early-stage diagnosis rates for cancer, lower rates of cardiovascular mortality, and increased odds of tobacco cessation.15 ,16  Medicaid expansion has also been linked to lower mortality rates, including those from cancer, cardiovascular disease, liver disease, and maternal mortality.17 ,18  Evidence suggests it also aids long-term recovery for substance use disorders and improves treatment management for conditions such as diabetes and HIV.
  • Public hospitals, community clinics and health centers, and local providers that serve underserved communities provide an important health care safety net for uninsured people. However, safety net providers have limited resources and service capacity, and not all uninsured people have geographic access to a safety net provider.19 ,20 ,21  High uninsured rates contribute to rural hospital closures and greater financial challenges for rural hospitals, leaving individuals living in rural areas at an even greater disadvantage to accessing care.22 ,23  Research indicates that Medicaid expansion is associated with reductions in uncompensated care costs and improved financial performance for rural hospitals and other providers.

What are the financial implications of being uninsured?

Uninsured individuals often face unaffordable medical bills when they do seek care. These bills can quickly translate into medical debt since most people who are uninsured have low or moderate incomes and have little, if any, savings.

Key Details:

  • Those without insurance for an entire calendar year pay for almost 40% of their care out-of-pocket.24  In addition, hospitals frequently charge uninsured patients higher rates than those paid by private health insurers and public programs.25 ,26 ,27 ,28 
  • Uninsured adults ages 18 to 64 are much more likely than their insured counterparts to lack confidence in their ability to afford usual medical costs. Nearly half (49%) of uninsured adults said they or a family member had problems paying for health care compared to 21% of insured adults, and over eight in ten (84%) uninsured adults said they worried that health care costs would put them in debt or increase their existing debt, compared to 71% of adults with insurance (Figure 10).
Problems Paying for Health Care and Worries About Health Care Debt by Insurance Status
  • Unaffordable medical bills can lead to medical debt, particularly for uninsured adults. More than six in ten (62%) uninsured adults report having health care debt compared to over four in ten (44%) insured adults. Uninsured adults are more likely to face negative consequences due to health care debt, such as using up savings, having difficulty paying other living expenses, or borrowing money.29 ,30 ,31 
  • While federal and state laws require certain hospitals to provide some level of charity care, not all eligible patients benefit from these programs. Consequently, charity care costs represent a small share of operating expenses at many hospitals.
  • Research suggests that gaining health coverage improves the affordability of care and financial security among the low-income population. Multiple studies of the ACA found declines in trouble paying medical bills and reductions in medical debt in expansion states relative to non-expansion states. More recent research found that Medicaid expansion decreased catastrophic health expenditures and was associated with greater increases in income among low-income individuals.

Appendix

Uninsured Rate Among the Population Ages 0-64 by State, 2019, 2022, 2023
Interactive DataWrapper Embed
Change in Selected Characteristics of Uninsured People Ages 0-64, 2019, 2022, and 2023

Supplemental Tables

Health Insurance Coverage of the Population Ages 0-64, 2023
Health Insurance Coverage of the Population Ages 0-64 under Poverty, 2023
Health Insurance Coverage of Workers Ages 19-64, 2023
Characteristics of Uninsured People 0-64 under Poverty (<100% of Poverty), 2023
Characteristics of Uninsured Adult Workers Ages 19-64, 2023

Endnotes

  1. The Federal Poverty Level was $ 24,526 for a family of three in 2023. ↩︎
  2. Cohen RA and Sohi IS. “Demographic Variation in Health Insurance Coverage: United States, 2023”, National Center for Health Statistics. October 2024. Available from: https://www.cdc.gov/nchs/health_policy/coverage_and_access.htm. ↩︎
  3. KFF analysis of the 2023 National Health Interview Survey. ↩︎
  4. 2023 Employer Health Benefits Survey (Washington, DC: KFF, October 2023), https://modern.kff.org/health-costs/report/2023-employer-health-benefits-survey/. ↩︎
  5. Gary Claxton, Matthew Rae, Nisha Kurani, and Jared Ortaliza, How affordability of employer coverage varies by family income, (Health System Tracker, Peterson-KFF, March 2022), https://www.healthsystemtracker.org/brief/how-affordability-of-health-care-varies-by-income-among-people-with-employer-coverage/. ↩︎
  6. Hailun Liang, May A. Beydoun, and Shaker M. Eid, Health Needs, “Utilization of Services and Access to Care Among Medicaid and Uninsured Patients with Chronic Disease in Health Centres,” Journal of Health Services Research & Policy 24, no. 3 (Jul 2019): 172-181. ↩︎
  7. Laura Hawks, et al, “Trends in Unmet Need for Physician and Preventive Services in the United States, 1998-2017,” JAMA Internal Medicine 180, no.3 (Jan. 2020): 439-448, https://jamanetwork.com/journals/jamainternalmedicine/fullarticle/2759743 . ↩︎
  8. Megan B. Cole, Amal N. Trivedi, Brad Wright, and Kathleen Carey, “Health Insurance Coverage and Access to Care for Community Health Center Patients: Evidence Following the Affordable Care Act,” Journal of General Internal Medicine 33, no. 9 (September 2018): 1444-1446. ↩︎
  9. Veri Seo, et al., “Access to Care Among Medicaid and Uninsured Patients in Community Health Centers After the Affordable Care Act,” BMC Health Services Research 19, no. 291 (May 2019). ↩︎
  10. Marco A Castaneda and Meryem Saygili, “The health conditions and the health care consumption of the uninsured,” Health Economics Review (2016). ↩︎
  11. Steffie Woolhandler, et al., “The Relationship of Health Insurance and Mortality: Is Lack of Insurance Deadly?” Annals of Internal Medicine 167 (June 2017): 424-431. ↩︎
  12. Travis Campbell, Alison P Galvani, Gerald Friedman, Meagan C Fitzpatrick, “Exacerbation of COVID-19 mortality by the fragmented United States healthcare system: A retrospective observational study” (Lancet Reg Health Am., May 2022) https://pmc.ncbi.nlm.nih.gov/articles/PMC9098098/ . ↩︎
  13. Andrea S. Christopher, et al., “Access to Care and Chronic Disease Outcomes Among Medicaid-Insured Persons Versus the Uninsured,” American Journal of Public Health 106, no. 1 (January 2016): 63-69. ↩︎
  14. Michael G. Usher, et al., “Insurance Coverage Predicts Mortality in Patients Transferred Between Hospitals: a Cross-Sectional Study,” Journal of General Internal Medicine 33, no. 12 (December 2018): 2078-2084. ↩︎
  15. Aparna Soni, Kosali Simon, John Cawley, and Lindsay Sabik, “Effect of Medicaid Expansions of 2014 on Overall and Early-Stage Cancer Diagnoses,” American Journal of Public Health epub ahead of print (December 2017), http://ajph.aphapublications.org/doi/abs/10.2105/AJPH.2017.304166. ↩︎
  16. Jonathan Koma et al., “Medicaid Coverage Expansions and Cigarette Smoking Cessation Among Low-Income Adults,” Medical Care 55, no. 12 (December 2017): 1023-1029. ↩︎
  17. Sameed Ahmed Khantana et al., “Association of Medicaid Expansion with Cardiovascular Mortality,” JAMA Cardiology epub ahead of print (June2019), https://jamanetwork.com/journals/jamacardiology/fullarticle/2734704. ↩︎
  18. Brian Lee, Jennifer Dodge, Norah Terrault, “Medicaid expansion and variability in mortality in the USA: a national, observational cohort study” (The Lancet Public Health, Volume 7, Issue 1, e48 – e55, January 2022) https://www.thelancet.com/journals/lanpub/article/PIIS2468-2667(21)00252-8/fulltext ↩︎
  19. Akash Pillai, Bradley Corallo, and Jennifer Tolbert, Community Health Center Patients, Financing, and Services, (Washington, DC: KFF, December 2024), ↩︎
  20. Allen Dobson, Joan DaVanzo, Randy Haught, and Phap-Hoa Luu, Comparing the Affordable Care Act’s Financial Impact on Safety-Net Hospitals in States That Expanded Medicaid and Those That Did Not, (New York, NY: The Commonweath Fund, November 2017), https://www.commonwealthfund.org/publications/issue-briefs/2017/nov/comparing-affordable-care-acts-financial-impact-safety-net. ↩︎
  21. Margaret B. Greenwood-Ericksen and Keith Kocher, “Trends in Emergency Department Use by Rural and Urban Populations in the United States,” JAMA Network Open, April 2019. ↩︎
  22. Jane Wishner, Patricia Solleveld, Robin Rudowitz, Julia Paradise, and Larisa Antonisse, A Look at Rural Hospital Closures and Implications for Access to Care: Three Case Studies, (Washington, DC: KFF, July 2016), https://modern.kff.org/report-section/a-look-at-rural-hospital-closures-and-implications-for-access-to-care-three-case-studies-issue-brief/. ↩︎
  23. Zachary Levinson, Jamie Godwin, and Scott Hulver, Rural Hospitals Face Renewed Financial Challenges, Especially in States That Have Not Expanded Medicaid, (Washington, DC: KFF, February 2023), https://modern.kff.org/health-costs/issue-brief/rural-hospitals-face-renewed-financial-challenges-especially-in-states-that-have-not-expanded-medicaid/ ↩︎
  24. “Total expenditures in millions by source of payment and insurance coverage, United States, 2022,” Center for Financing, Access and Cost Trends, Agency for Healthcare Research and Quality, Medical Expenditure Panel Survey, 2022, https://datatools.ahrq.gov/meps-hc. ↩︎
  25. Tim Xu, Angela Park, Ge Bai, Sarah Joo, Susan Hutfless, Ambar Mehta, Gerard Anderson, and Martin Makary, “Variation in Emergency Department vs Internal Medicine Excess Charges in the United States,” JAMA Intern Med. 177(8): 1130-1145 (June 2017), https://jamanetwork.com/journals/jamainternalmedicine/fullarticle/2629494%20. ↩︎
  26. Stacie Dusetzina, Ethan Basch, and Nancy Keating, “For Uninsured Cancer Patients, Outpatient Charges Can Be Costly, Putting Treatments out of Reach,” Health Affairs 34, no. 4 (April 2015): 584-591, http://content.healthaffairs.org/content/34/4/584.abstract. ↩︎
  27. Rebekah Davis Reed, “Costs and Benefits: Price Transparency in Health Care,” Journal of Health Care Finance (Spring 2019). ↩︎
  28. Yang Wang, Mark Katz Meiselbach, John S. Cox, Gerard F. Anderson, and Ge Bai, “The Relationships Among Cash Prices, Negotiated Rates, And Chargemaster Prices For Shoppable Hospital Services,” Health Affairs 42, no. 4, (April 2023) ↩︎
  29. Alex Montero, Audrey Kearney, Liz Hamel, and Mollyann Brodie, Data Note: American’s Challenges with Health Care Costs, (Washington, D.C.: KFF, July 2022), https://modern.kff.org/health-costs/issue-brief/data-note-americans-challenges-health-care-costs/. ↩︎
  30. Lunna lopes, Audrey Kearney, Alex Montero, Liz Hamel, and Mollyann Brodie, Health Care Debt In The U.S.: The Broad Consequences Of Medical And Dental Bills, (San Francisco, CA.: KFF, June 2022), https://modern.kff.org/report-section/kff-health-care-debt-survey-main-findings/ ↩︎
  31. Sara R. Collins, Shreya Roy, and Relebohile Masitha, Paying for It: How Health Care Costs and Medical Debt Are Making Americans Sicker and Poorer  (New York, NY: The Commonwealth Fund, October 2023), https://www.commonwealthfund.org/publications/surveys/2023/oct/paying-for-it-costs-debt-americans-sicker-poorer-2023-affordability-survey ↩︎

What’s Next for State Abortion Ballot Initiatives?

Authors: Mabel Felix, Laurie Sobel, and Alina Salganicoff
Published: Dec 18, 2024

Since the Supreme Court overturned Roe v Wade in June 2022, states have been able to set policy that defines abortion access across this nation. State actions have ranged from those that have effectively banned all abortions unless the pregnancy presents an imminent life threat to states that have enshrined the right to abortion in their state constitutions. This past November, voters in 10 states weighed in on constitutional amendment ballot measures to protect abortion rights.

The states that recently approved constitutional amendments protecting abortion rights in November (Arizona, Colorado, Maryland, Missouri, Montana, and New York) now join the states—California, Michigan, Ohio, and Vermont—that already had recently added these protections to their state constitutions (Figure 1). However, in Florida, Nebraska, and South Dakota, the abortion rights amendments failed to garner sufficient votes for passage. In Nebraska, voters approved a competing measure to ban abortion after the first trimester. Nevada voters approved their state amendment but will need to weigh in again in the general election in 2026, as the state rules require constitutional amendments to pass in two general elections. This brief examines what the November election and prior efforts to enshrine abortion rights at the ballot box mean for those states and what’s next, including the future of abortion restrictions in states where voters enshrined abortion rights where abortion was banned or restricted, as well as those that do not have abortion bans.

Outcome of Abortion-Related State Constitutional Amendment Measures on the November 2024 Ballot

Going forward, if law makers seek to restrict abortion in the states with new constitutional amendments protecting abortion rights, state courts will evaluate any abortion restrictions under the new amendment. Protections from restrictions beyond pre-viability bans will vary from state to state based on the language in their constitutional amendment and how their highest court interprets the language. After this general election, there are only two more states with abortion bans that allow citizens to propose new constitutional amendments and have not already attempted to do so.

What will be the fate of abortion restrictions?

Of the seven states that passed amendments protecting abortion rights, two (Arizona and Missouri) had pre-viability abortion bans. In these states, advocates have filed legal challenges to their abortion limits, alleging that they violate the newly established amendments. While the litigation in Arizona proceeds, the 15-week ban is not in effect and clinics are providing abortion care beyond this gestational limit.

The new constitutional amendments offer protections that prevent the state from burdening or interfering with someone’s right to abortion. This means that these constitutional amendments protecting a right to abortion may be used to do more than just challenge pre-viability gestational limits and may also be used to take on other abortion restrictions such as waiting periods, telehealth abortion restrictions, and physician only requirements. Additionally, because some of these constitutional protections go beyond the federal protections that existed under Roe and Casey, abortion restrictions such as waiting periods and the exclusion of abortion coverage in Medicaid programs, may be struck down by state courts.

This has already begun to happen in Michigan and Ohio where abortion rights advocates have challenged abortion restrictions on the basis that they violate their respective reproductive freedom amendments passed by voters in prior elections. Courts in Ohio have already blocked state laws prohibiting advanced practice clinicians from providing medication abortion, requiring in-person counseling, and a 24- hour waiting period after the counselling. Similarly, courts in Michigan have blocked laws limiting the provision of abortion to physicians and requiring a 24-hour waiting period. Michigan advocates have additionally asked a state court to rule that the ban on state funding of abortions for Medicaid enrollees is unconstitutional based on the amendment approved by Michigan voters.

Whether or not similar restrictions that have been in force in these states prior to the election (Table 1) will be blocked in Arizona and Missouri will depend on the wording of their respective abortion-related constitutional amendments and how state courts interpret these protections. While the removal of some of these restrictions is up to judicial interpretation, the Colorado ballot measure directly prevents the state from prohibiting health insurance coverage of abortion and repealed a section of the Colorado Constitution that explicitly prohibited the use of state funds to pay for abortion care, except when necessary to safeguard the life of the pregnant person. The passage of the Colorado measure removes these restrictions on state funds, which had previously prevented the state from using its own funds to provide coverage of abortion care for their Medicaid enrollees in circumstances other than the restrictions on federal funding outlined in the Hyde amendment—previously only allowing the state to cover abortions in cases of life endangerment and rape or incest. Other states, like Arizona and Missouri similarly restrict the use of state funds to provide coverage of abortion services for Medicaid recipients.

Abortion Restrictions in States with New Constitutional Amendments Protecting the Right to Abortion

Citing the newly passed constitutional amendment, advocates in Missouri have filed a lawsuit challenging the state’s abortion ban and many restrictions. They argue the abortion ban and restrictions, including a 72-hour waiting period, telemedicine ban, and physician only provision, impermissibly interfere with the right to reproductive freedom the Missouri constitution now protects. The language in the state’s new constitutional amendment prevents the state from denying, interfering with, delaying, or otherwise restricting the right to reproductive freedom unless the government can demonstrate that the restriction has the “effect of improving or maintaining the health of a person seeking care, is consistent with widely accepted clinical standards of practice and evidence-based medicine, and does not infringe on that person’s autonomous decision-making.” This is a high bar for the state to clear if anti-abortion advocates are seeking a path to apply limited restrictions, though the Missouri Supreme Court will be the final arbiter of which restrictions will be allowed to stand.

How will the abortion initiatives affect the states that did not have abortion bans?

While five of the states that approved citizen initiatives to enshrine abortion rights in November 2024 do not have abortion bans, these state constitutional amendments provide assurance that abortion rights will be protected in the future. Regardless of how the political winds may change in a state, a constitutional amendment explicitly enshrining abortion rights will mean that lawmakers and even judges cannot enact or interpret the laws to limit abortion access, even if the composition of the state’s high court changes or the state government moves in a different direction. These constitutional protections can only be undone by a subsequent initiative that amends the state’s constitution.

Looking to the future

After the November 2024 election, there are two states (Arkansas and Oklahoma) with current bans which allow for a citizen initiated constitutional amendments and have yet to vote on an abortion measure (Figure 2). There were efforts in Arkansas (where there is a near total abortion ban) to get an initiative on the ballot, but the Arkansas Secretary of State rejected the petition for the initiative on the grounds that the signatures were not properly gathered and thus did not make it to the ballot. The Arkansas Supreme Court upheld this decision. In Florida, there is a 6-week LMP abortion ban, but the 2024 initiative failed to garner the needed 60% approval needed for passage. It is unknown whether abortion rights supporters will try again to gain approval in a future election given that the popular vote fell just 3 percentage points short of approval in the last election.

Only Two Remaining States with Abortion Bans Allow Citizen Initiatives

It is also unclear if anti-abortion proponents will propose new ballot initiatives to remove the new constitutional amendments protecting the right to abortion in Missouri and Arizona. Thirteen states with abortion bans or earlier gestational limits do not have a citizen initiative process to amend their constitutions. These states will likely continue to have those laws on the books, unless a new federal law guaranteeing abortion rights is passed by Congress and signed by the president or a future Supreme Court ruling overturns the 2022 Dobbs decision.

Hospital Margins Rebounded in 2023, But Rural Hospitals and Those With High Medicaid Shares Were Struggling More Than Others

Published: Dec 18, 2024

Data Note

Hospitals account for 30% of total health care spending—$1.4 trillion in 2022—with expenditures projected to rise rapidly through 2032, contributing to higher costs for families, employers, Medicare, Medicaid, and other public payers. Policymakers have sought to reduce spending on hospital care as part of a broader effort to make health care more affordable and reduce the federal deficit. In recent years, for example, there has been bipartisan interest in site-neutral payment reforms, which would reduce Medicare program and beneficiary spending by aligning Medicare rates for certain outpatient services across care settings. The next Trump administration and Republicans in Congress may also seek to cut Medicaid spending, which could result in fewer dollars flowing to hospitals.

At the same time, there are ongoing questions about the effects of policies that reduce spending on hospital finances and access to care, with particular attention to the implications for rural and safety-net hospitals. For example, Senators Cassidy and Hassan recently released a framework for site-neutral payment reforms that would reinvest savings into rural and high-needs hospitals.

This analysis examines hospital margins for non-federal general short-term hospitals in the U.S from 2018 through 2023, the most recent year with virtually complete cost report data. The analysis is based on RAND Hospital Data, a cleaned version of Medicare cost reports. Total margins are defined as net income (revenues minus expenses) divided by revenues. This analysis focuses on operating margins (instead of total margins) to examine the extent to which hospitals profited or lost money on patient care and other operating activities, rather than on other sources, such as investments. Operating margins are approximated using the same calculation as for total margins after subtracting reported investment income and charitable contributions from revenues. Results for groups of hospitals reflect aggregate margins based on total relevant revenues and expenses, which is equivalent to the average margin after weighting hospitals by their revenue. A number of datasets provide information about hospital finances, though each has limitations, and cost reports are no exception. See Methods for additional information.

Key Takeaways

  • Aggregate hospital margins rebounded in 2023 following a large decrease in 2022. This is true for operating margins, which decreased from 8.9% in 2021 to 2.7% in 2022 before increasing to 5.2% in 2023. It is also true for total margins, which decreased from 10.8% in 2021 to 2.3% in 2022 before increasing to 6.4% in 2023. However, both aggregate operating margins and total margins remained below 2019 pre-pandemic levels in 2023.
  • Aggregate operating margins were positive in 2023 (5.2%), but about two in five hospitals (39%) had negative margins in that year. About one in five (22%) had operating margins less than -5%.
  • Operating margins were higher than average among for-profit hospitals, hospitals with a high share of commercial discharges, and system-affiliated hospitals in 2023. For-profit hospitals had higher operating margins than nonprofit and government hospitals (14.0% versus 4.4% and 3.4%, respectively). Hospitals with a relatively high commercial share of total discharges had higher operating margins than hospitals with low shares (7.5% versus 3.3% among the top versus bottom quarter based on commercial share, respectively) (quartiles are weighted by revenues throughout). System-affiliated hospitals had higher operating margins than independent hospitals (5.8% versus 2.5%).
  • Operating margins in 2023 were also higher than average among hospitals with relatively high commercial prices. Operating margins were relatively high among hospitals with commercial prices that were greater than 300% of Medicare rates, especially among hospitals with high commercial shares. In contrast, operating margins were relatively low among hospitals with high Medicaid shares (see below).
  • Operating margins were lower than average among hospitals with high Medicaid shares, which was true in both rural and urban areas. Operating margins were lower among hospitals with a relatively high Medicaid share (2.3% among the top quarter of hospitals based on Medicaid shares versus 7.0% among the bottom quarter). Operating margins were relatively low for hospitals with high Medicaid shares in both rural and urban areas (1.7% and 2.3%, respectively).
  • Operating margins were lower than average among rural hospitals in 2023. Operating margins were lower among hospitals in rural than urban areas (3.1% versus 5.4%, respectively) and were especially low among hospitals in rural areas that were not micropolitan areas (1.8%), i.e., that did not include and were not closely connected to any substantial population nucleus. However, operating margins were higher among for-profit than nonprofit rural hospitals (8.5% versus 3.5%, respectively). Operating margins were also lower among hospitals with Medicare rural designations, particularly among low-volume hospitals and Medicare dependent hospitals (1.7% and 1.8%, respectively).

Aggregate Hospital Margins Rebounded in 2023 Following a Large Decrease in 2022

Aggregate operating margins decreased from 8.9% in 2021 to 2.7% in 2022 before increasing to 5.2% in 2023 (Figure 1). Similarly, aggregate total margins decreased from 10.8% in 2021 to 2.3% in 2022 before increasing to 6.4% in 2023. While operating and total margins both increased in 2023, they remained below 2019 pre-pandemic levels (6.5% for operating margins and 7.6% for total margins). Operating margins were at a record high in 2021 for hospitals reimbursed under the inpatient prospective payment system (IPPS) but were lower in 2022 than they had been since 2008—i.e., during the Great Recession—according to related analyses from the Medicare Payment and Advisory Commission.

Decreases in operating margins in 2022 were likely due to the erosion of COVID funds, costs associated with labor shortages, and increased supply expenses due to high inflation rates, among other factors. Improvements in 2023 may have been due a number of factors, including stabilizing labor expenses, decreases in average length of stay, and increases in revenue.

Hospital Margins Rebounded in 2023 Following a Large Decrease in 2022

Some of the major credit rating agencies have reported relatively stable operating margins among rated not-for-profit health systems from 2022 to 2023 and have projected gradual improvements over time. These trends may differ from the main analysis here because, among other factors, they look at not-for-profit systems and report median (rather than aggregate or weighted average) operating margins. Industry reports, based on a non-representative sample of hospitals, indicate that finances have improved through October 2024 relative to 2022.

Aggregate Operating Margins Were Positive in 2023, But About Two in Five Hospitals (39%) Had Negative Margins

While aggregate operating margins were positive in 2023 (5.2%), operating margins varied substantially across hospitals. On one end of the spectrum, about one in seven hospitals (15%) had relatively high operating margins of at least 15%, while about one in five (22%) had positive but relatively modest margins of less than 5%, including about one in ten (11%) with positive margins of less than 2.5% (not shown). Having positive but modest margins may signal financial challenges for hospitals.

Aggregate Operating Margins Were Positive in 2023, But About Two in Five Hospitals (39%) Had Negative Margins

At the same time, about two in five hospitals (39%) had negative margins, and about one in five (22%) had margins of less than -5%. While some of these hospitals may be able to weather financial challenges for a period of time if they have sufficient days of cash on hand, those without sufficient days of cash on hand could be especially challenged to maintain current services or remain open. Based on a prior KFF analysis, the majority of nonprofit hospitals and health systems analyzed with negative operating margins had at least “strong” levels of days cash on hand in 2022, though that analysis was based on data that underrepresent entities likely to be more financially vulnerable.

Operating Margins Were Higher Than Average Among For-Profit Hospitals, Hospitals With High Commercial Discharge Shares, and System-Affiliated Hospitals and Were Lower Than Average Among Hospitals With Low Market Shares in 2023

For-profit hospitals—which accounted for 17% of facilities—had much higher operating margins than nonprofit and government hospitals (14.0% versus 4.4% and 3.4%, respectively) (see Figure 3). For-profit hospitals may have a greater motivation to operate more efficiently and engage in other strategic behaviors to increase their margins, such as focusing on relatively profitable services lines, dropping unprofitable service lines (like obstetrics), or locating in wealthier areas that have more residents with commercial insurance and fewer with public or no insurance. As is the case throughout this analysis, differences in operating margins across groups of hospitals could reflect a variety of factors.

Operating margins were also higher than average among hospitals where commercially-insured patients accounted for a relatively large share of discharges. For example, operating margins were 7.5% versus 3.3% when comparing hospitals in the top versus bottom quarter based on commercial shares (quartiles are weighted by revenues throughout). One factor that likely plays a role in these results is that commercial payers generally reimburse hospital care at higher rates than Medicare and Medicaid, the two other major payers. For instance, a KFF review found that commercial prices were nearly double Medicare rates for hospital services when averaging findings across studies, and one recent analysis found that commercial prices were 254% of Medicare rates for hospital services on average in 2022.

Operating margins were also higher among hospitals affiliated with a health system than independent hospitals (5.8% versus 2.5%). Higher operating margins among system-affiliated hospitals could reflect the effects of consolidation, among other factors. Consolidation might lead to higher margins, for example, to the extent that merging providers are able to reduce operating costs or—as suggested by a large body of evidence—charge higher prices by having greater market power.

Finally, operating margins were lower among hospitals that accounted for a relatively low share of hospital discharges in their market. For example, operating margins were 2.0% versus 7.3% when comparing the bottom versus top quarter of hospitals based on their market share (or the market share of the health system that they are a member of, as applicable). Hospitals with large market shares may be able to negotiate higher rates and, if part of a larger system, benefit from economies of scale, among other factors that could drive higher margins.

Operating Margins Were Higher Than Average Among For-Profit Hospitals, Hospitals With High Commercial Discharge Shares, and System-Affiliated Hospitals and Were Lower Than Average Among Hospitals With Low Market Shares in 2023

Operating Margins in 2023 Were Higher Than Average Among Hospitals With High Prices, Especially Among Those With a Relatively High Commercial Shares

Operating margins were relatively high among hospitals with commercial prices that were greater than 300% of Medicare rates (8.9%) and were even higher (10.5%) among those with a relatively high commercial share of total discharges (i.e., with at least a 25% commercial share) (see Figure 4). In contrast, operating margins were relatively low among hospitals with commercial prices below 200% of Medicare rates (1.0%) and were even lower (0.8%) among those with low commercial patient shares. This aligns with an analysis from researchers at the Urban Institute and Harvard that found that high commercial prices were associated with higher operating margins and more days of cash on hand.

Policymakers have explored a number of options to rein in commercial prices. This analysis suggests that hospitals with the highest prices and largest commercial shares as a group are in a better position to absorb any restraints on prices, though the impact would vary across hospitals.

Operating Margins in 2023 Were Higher Than Average Among Hospitals With High Prices, Especially Among Those With Relatively High Commercial Shares

While Operating Margins Were Higher Than Average Among Hospitals With High Commercial Shares in 2023, They Were Lower Than Average Among Hospitals With High Medicaid Shares, Which Was True in Both Urban and Rural Areas

Hospitals with high commercial shares had relatively high operating margins (e.g., 7.5% versus 3.3% when comparing the top versus bottom quarter of hospitals weighted by revenues based on commercial share) (see Figure 3 above) while hospitals with high Medicaid shares had relatively low operating margins (e.g., 2.3% versus 7.0% when comparing the top versus bottom quarter of hospitals weighted by revenues based on Medicaid share) (see Figure 5).

Operating margins in 2023 were relatively low among hospitals with high Medicaid shares in both rural and urban areas (1.7% and 2.3%, respectively) (see Figure 5). In comparison, the operating margin among all hospitals was 5.2% in 2023. While operating margins were lower among hospitals in rural than urban areas overall (3.1% versus 5.4%, respectively) (see Figure 7 below), hospitals with high Medicaid shares in urban areas stand out as another example of hospitals that were struggling more than others.

Some policymakers are especially attentive to the financial stability of safety-net hospitals given their role in providing access to patients with limited resources and other sources of vulnerability. The share of patients covered by Medicaid may signal the extent to which a given hospital cares for a disproportionate share of low-income patients (see Methods for more detail).

While Operating Margins Were Higher Than Average Among Hospitals With High Commercial Shares in 2023, They Were Lower Than Average Among Those With High Medicaid Shares, Which Was True in Both Rural and Urban Areas

Operating Margins Were Also Lower Than Average Among Hospitals With High Medicare Shares in 2023

Operating margins were 4.3% in 2023 among hospitals in the top quarter based on Medicare share of discharges compared to 5.8% among hospitals in the bottom quarter (see Figure 6). Part of this difference may reflect the fact that hospitals with high Medicare shares were more likely to be in rural areas (54% of hospitals in the top quarter of Medicare shares were in rural areas versus 23% of the hospitals in the bottom quarter). As described below, rural hospitals had lower than average operating margins in 2023.

While operating margins among hospitals in the top quarter of Medicare shares were lower than among hospitals overall, they were higher relative to hospitals in the top quarter of Medicaid shares (4.3% versus 2.3%, respectively).

Operating Margins Were Also Lower Than Average Among Hospitals With High Medicare Shares in 2023

Operating Margins Were Lower Than Average Among Rural Hospitals in 2023

Operating margins were lower among hospitals in rural versus urban (nonmetropolitan versus metropolitan) areas (3.1% versus 5.4%, respectively) and were especially low among hospitals in rural areas that were not micropolitan areas (1.8%) (Figure 7), i.e., that did not include and were not closely connected to any substantial population nucleus (see Methods for more about urban and rural definitions). While 48 states in this analysis had at least one rural hospital, rural hospitals were distributed unevenly across the country. For example, a quarter of rural hospitals were located in Iowa, Kansas, Minnesota, Nebraska, or Texas. Rural hospitals often face unique financial challenges, such as low patient volume, which may lead to higher costs on average and limit the ability to offer specialized services.

Operating margins varied across rural hospitals in 2023, as was the case when looking at hospitals overall. For example, more than four in ten (44%) rural hospitals had negative operating margins while more than half (56%) had positive operating margins, including one in ten (10%) with operating margins of at least 15%. Operating margins were higher among rural for-profit than rural non-profit hospitals (8.5% versus 3.5%) and lower (0.3%) among rural government hospitals. Operating margins were also higher among system-affiliated versus independent rural hospitals (4.8% versus 0.6%, respectively).

Operating margins were lower among hospitals with Medicare rural designations than other hospitals. Low-volume hospitals (hospitals with few discharges that are a minimum distance from other facilities) and Medicare dependent hospitals (small rural hospitals with high Medicare inpatient shares) had the lowest operating margins (1.7% and 1.8%, respectively) (Figure 7). Operating margins were also lower on average among critical access hospitals (rural hospitals with at most 25 beds that with some exceptions are a minimum distance from other facilities) and sole community hospitals (hospitals that are the only source of short-term, acute inpatient care in a region) relative to hospitals without a Medicare rural designation (4.1% and 4.2%, respectively, versus 5.7%). About half of low-volume, Medicare dependent and sole community hospitals had negative operating margins in 2023 (52%, 52%, and 49%, respectively), as did 40% of critical access hospitals. A smaller share (35%) of hospitals without a Medicare rural designation had negative operating margins.

Operating Margins Were Lower Than Average Among Rural Hospitals in 2023

Senators Cassidy and Hassan recently released a framework for site-neutral payment reforms that some of the savings be reinvested into sole community, low-volume, and Medicare dependent hospitals. As noted above, each of these groups had lower operating margins than did hospitals without a rural designation. The framework does not mention new funds for critical access hospitals, which would likely be exempt from site-neutral payment reforms.

Policymakers have had ongoing concerns about the financial health of rural hospitals and the implications for access to care and the local economy. At the same time, it may be difficult to sustain some rural hospitals—such as those in areas with shrinking populations—and some have argued that care in at least some scenarios should be moved towards other settings, including telehealth, outpatient facilities, and larger regional hospitals.

Operating Margins Were Higher Than Average Among Hospitals With a Large Number of Beds and Among Minor Teaching Hospitals in 2023

Hospitals with greater than 500 beds had higher operating margins (6.3%) than those with fewer beds (e.g., 3.9% among hospitals with 51 to 100 beds) (see Figure 8). Minor teaching hospitals had higher margins (6.2%) than major teaching (4.3%) and non-teaching (5.1%) hospitals. Minor teaching hospitals are defined as facilities with interns or residents but at most one full-time equivalent intern or resident for every four beds, and major teaching hospitals are defined as facilities with more.

Operating Margins Were Higher Than Average Among Hospitals With a Large Number of Beds and Among Minor Teaching Hospitals in 2023

Operating Margins Varied Across States in 2023

Aggregate operating margins were at least 10% in five states (Alaska, Florida, Texas, Utah, and Virginia) but negative in four states (Michigan, New Mexico, Washington, and Wyoming) (see Figure 9). Differences likely reflect a variety of unique state circumstances, such as demographics, hospital ownership and cost structure, commercial reimbursement rates, and state and local health and tax policy. For instance, operating margins may have been high in Texas in part because the state has a relatively large number of for-profit hospitals (which have higher operating margins on average), among other factors. The same is true of Florida, which may have also had high operating margins in part due to the relatively high commercial prices in the state. As an example of a state on the other end of the spectrum, margins may have been relatively low in Wyoming in part because the vast majority of hospitals are in rural areas (92% compared to 40% of all hospitals), among other factors. It is also possible that a small number of hospitals with large revenue could have a large impact on aggregate operating margins, especially in states with relatively few hospitals, like Alaska.

Operating Margins Varied Across States in 2023

This work was supported in part by Arnold Ventures. KFF maintains full editorial control over all of its policy analysis, polling, and journalism activities.

Methods

Methods

Hospital financial information was obtained from RAND Hospital Data, a cleaned and processed version of annual cost reports that Medicare-certified hospitals are required to submit to the federal government. Cost reports were assigned to fiscal years based on the mid-point of the reporting period. Most 2023 cost reports in this analysis had reporting periods that ran from January to December 2023 (41%), July 2022 to June 2023 (32%), or October 2022 to September 2023 (17%).

The analysis included a number of sample restrictions. All analyses focused on non-federal general short-term hospitals not in US territories. This left 4,471 hospitals in 2023. Dropping cost reports that were less than or longer than a year left 4,337 hospitals in 2023. Dropping hospitals in years with missing, questionable, or certain outlier values left 4,200 cost reports for 2023, which represents 94% of non-federal general short-term hospitals not in US territories in the data. Some analyses of hospital characteristics included fewer hospitals based on the data available (see counts in Appendix Table 2). For example, price data, which are discussed below, were only available for 2,779 hospitals.

Total margins for hospitals overall or a specific group of hospitals were defined as net income (revenues minus expenses) divided by revenues. Operating margins were approximated by calculating the same ratio as for total margins after removing reported investment income and charitable contributions from revenues, in line with the approach used by MedPAC. This approximation may include other nonoperating revenues (such as from the sales of assets) as well as nonoperating expenses for a given hospital. It is possible that this approach could understate or overstate operating margins and that it may do so to a different degree over time and across hospitals, which would affect observed trends and hospital comparisons.

Aggregate margins for hospitals overall or a specific group of hospitals were calculated based on total relevant revenues and expenses for the given set of hospitals. Aggregate margins are equivalent to the average margin after weighting hospitals by their revenue (i.e., they give more weight to hospitals with greater revenue). Aggregate operating margins were larger than unweighted average operating margins in 2023 (5.2% versus 2.9%) and exhibited a larger increase from 2022 and 2023 (from 2.7% in 2022 to 5.2% in 2023 versus from 2.3% in 2022 to 2.9% in 2023 when evaluating unweighted averages). This implies that operating margins and increases in margins were higher on average among hospitals with more revenue. The relationship between margins and hospital characteristics was generally in the same direction when looking at either aggregate or unweighted average margins, though the magnitude differed.

We relied on additional datasets for certain hospital characteristics. We obtained geographic classifications from Census Bureau data. Rural and urban were defined as nonmetropolitan and metropolitan areas, respectively. Metropolitan areas represent a county or group of counties that contains at least one urban area with a population of 50,000 or more. The analysis also describes margins in micropolitan areas, which represent a county or group of counties that contains at least one urban area with a population of at least 10,000 but less than 50,000. We obtained hospital facility price data (combined inpatient and outpatient) from Round 5.1 of the RAND Price Transparency Study, which uses 2020-2022 claims data from a large population of commercial patients. These data were available for 2,779 hospitals in this analysis. We also relied on the AHA Annual Survey Database to obtain 2023 data on payer mix, system membership, and hospital referral region (HRR) market shares. For HRR market shares, we focused on available admissions data for non-federal general, short-term hospitals that could be matched to an HRR.

As noted, the share of patients covered by Medicaid may signal the extent to which a given hospital cares for a disproportionate share of low-income patients. This is complicated by the fact that Medicare-Medicaid enrollees are likely categorized as Medicare (rather than Medicaid) admissions and that Medicaid eligibility requirements vary across states. However, differences in aggregate operating margins based on Medicaid shares were similar when looking at Medicaid as a share of patients who are not enrolled in Medicare and adjusting for differences across states (3.0% versus 7.4% among the top versus bottom quarter of Medicaid shares).

There are a number of data sources on hospital and health system finances, and each has limitations. For example, audited financial statements are considered the gold standard of financial data, but they often do not break out information about individual hospitals in the common scenario where facilities are part of a broader health system. They also are not easily accessible, and they typically require laborious, specialized expertise to standardize financial information across systems.

There are also tradeoffs when using cost report data. Cost reports are unique in that they provide facility-level information for the vast majority of community hospitals, which is why we relied on them for this analysis. However, they include less detailed and standardized data than audited financial statements for calculating margins. For example, cost reports do not fully separate out finances related to operating versus nonoperating activities, which requires that operating margins be approximated. Further, cost reports do not undergo the same rigorous auditing process as audited financial statements and do not include system-level data that may have a bearing on the finances of member hospitals.

Appendix

Appendix

Interactive DataWrapper Embed
Hospital counts and average operating margins in 2023, by characteristics
Hospital counts and average operating margins in 2023, by state

The Impact of HIV on Women in the United States

Published: Dec 16, 2024

Key Facts

  • Women have been affected by HIV since the beginning of the epidemic and face unique challenges in accessing optimal prevention, care, and treatment resources.1 
  • In 2022, women accounted for about 1 in 5 (19%) new HIV diagnoses in the U.S.2 
  • Women of color, particularly Black women, have been disproportionately impacted and represent the majority of women living with HIV, as well as the majority of new diagnoses among women.
  • Recent data indicates that HIV diagnoses among women fell 25% between 2010 and 2022, compared to a 12% decline across the population overall. Decreases in HIV diagnoses have occurred for nearly every racial/ethnic group besides White women (Figure 1). However, rates of HIV diagnoses among women of color are much higher.
HIV Diagnoses Among Women in the United States, Overall

Overview

  • Today, there are more than 1.2 million people estimated to be living with HIV in the U.S., including 268,800 (22%) who are women.
  • Women accounted for 19% of the 6,980 new HIV diagnoses in 2022 and are diagnosed with HIV at slightly older ages than men are.
  • Between 2010-2022, while HIV diagnoses decreased by 12% among the population overall, the decline was twice as large among women (25%). Decreases in HIV diagnoses have occurred for nearly every racial/ethnic group besides White women (Figure 1). However, rates of HIV diagnoses among women of color are much higher.
  • Of new HIV diagnoses among women in 2022, 83% were attributable to heterosexual sex, 17% were attributable to injection drug use, and 1% were attributed to other causes.
  • Women with and at risk for HIV face several challenges to getting the services and information they need, including socio-economic and structural barriers such as poverty, cultural inequities, and intimate partner violence (IPV).

Race/Ethnicity

  • Women of color, particularly Black women, are disproportionately affected by HIV, accounting for the majority of new HIV diagnoses, the majority of women living with HIV, and highest rates of HIV-related deaths among women with HIV in the U.S.
  • In 2022, Black women accounted for half (50%) of HIV diagnoses among women, while only accounting for 13% of the U.S. female population. White women accounted for 24% and Hispanic/Latina women accounted for 20% of HIV diagnoses among women (Figure 2).
  • HIV diagnoses decreased 58% among Multiracial women, 39% among Black women, 9% among Hispanic/Latina women, and 3% among Asian women between 2010 and 2022. In this same timeframe, HIV diagnoses increased 21% among White women.
  • Rates of new HIV diagnoses are much higher for Black, Multiracial, and Hispanic/Latina women than for White women. In 2022, the rate of new HIV diagnoses for Black women was 10 times higher than the rate for White women (19.2 per 100,000 compared to 1.9); the rate for Multiracial women (8.2) was 4 times higher; the rates for Hispanic/Latina women (5.5) and American Indian/Alaska Native women (5.5) were nearly 3 times higher; the rate for Native Hawaiian/Other Pacific Islander women (4.6) was more than 2 times higher. The rate of new HIV diagnoses among Asian women (1.1) was less than that of White women (1.9).
  • In 2021, HIV was the 9th leading cause of death for Black women ages 25-34, behind diabetes. Black women accounted for the greatest share of deaths (of any cause) among women with diagnosed HIV in 2022 (57%), followed by White women (20%), and Hispanic/Latina women (15%).
New HIV Diagnoses Among Women & U.S. Female Population, by Race/Ethnicity, 2022

Age

  • Women ages 25-34 accounted for the largest share (29%) of HIV diagnoses among women in 2022, followed by those ages 35-44 (26%). (Figure 2).
  • Women are diagnosed with HIV at slightly older ages than men are. Women 35 years old and older accounted for 58% of new diagnoses among women in 2022. Comparatively, men in this age group accounted for 41% of diagnoses among men.
New HIV Diagnoses Among Women & Girls, by Age and Transmission Category, 2022

Transmission

  • In 2022, HIV diagnoses among women were mostly attributed to heterosexual sex (83%), followed by injection drug use (17%), and 1% were attributed to other causes. Heterosexual transmission accounts for a greater share of HIV diagnoses among Black and Hispanic/Latina women (90% and 87%, respectively) compared to White women (64%). Among White women, injection drug use accounts for a greater share of diagnoses (36%), relative to Black and Hispanic/Latina women (9%, 12%). (See Figure 3.)
  • Mother-to-child transmission of HIV in the U.S. has decreased dramatically since its peak in 1991 due to antiretroviral therapy (ART), which significantly reduces the risk of transmission from a woman to her baby (to 1% or less). Still, some perinatal infections occur each year, the majority of which are among Black women, and there continues to be missed opportunities for preventing mother-to-child transmissions, such as testing late in pregnancy. Of the 42 infants born with HIV in 2022, two-thirds (67%) were Black.

Geography

  • Although HIV diagnoses among women have been reported throughout the country, the impact of the epidemic is not uniformly distributed.
  • Ten states account for two-thirds of women living with diagnosed HIV (67% in 2022); with 5 states accounting for nearly half (47%) (Figure 4). While the District of Columbia ranked 18th among states in terms of the number of women living with diagnosed HIV (3,629 in 2022), the rate per 100,000 women living with an HIV diagnosis was the highest, nearly 7 times the national rate for women (1,189 per 100,000 compared to 174 per 100,000 nationally), similar to the share in other high populous urban areas.
  • Thirty-five counties account for almost half (46%) of all women living with an HIV diagnosis in the U.S., with Bronx County, New York having the greatest number (9,454) and highest rate (1,552 per 100,000) of women living with an HIV diagnosis.
Top Ten States by Number of Women Living with Diagnosed HIV, 2022

Transgender Women

  • Transgender women are disproportionately affected by HIV and face stigma, discrimination, and exclusion in accessing testing, treatment, and health care, relative to other women.
  • Since the beginning of the HIV epidemic, national surveillance of and research on the impacts of HIV on transgender women, as well as transgender and gender-diverse people more broadly, has been limited.
  • Although transgender women account for a small share of people estimated to be living with HIV (1%) among transgender women, 14% are estimated to be living with HIV.
  • In 2022, transgender women accounted for 87% of 994 new HIV diagnoses among transgender and gender-diverse people. Among transgender women, looking across race/ethnicity, Black transgender women had the highest share of HIV diagnoses (41%), followed by Hispanic/Latina transgender women (39%), whereas White transgender women accounted for 13% of diagnoses. HIV diagnoses among transgender women were mostly attributed to sexual contact (89%).
  • Among transgender women, 83% received care for HIV, while 67% were virally suppressed, similar to the share in the overall population of people with HIV.

Sexual and Reproductive Health

  • HIV interacts with women’s reproductive health on many levels, impacting menstruation, reducing fertility, and predisposing pregnant people to greater risk of complications. In addition, antiretroviral therapy may impact contraceptive efficacy. During pregnancy, people with HIV can take additional measures to prevent mother-to-child-transmission of HIV such as adherence to antiretroviral regimens and labor and delivery procedures.
  • Mothers living with HIV can reduce the risk of transmission to their babies via breastfeeding to less than 1% through antiretroviral therapy.
  • Women with other sexually transmitted infections (STIs) are at increased risk for contracting HIV. Women with HIV are at increased risk for developing or contracting a range of conditions, including human papillomavirus (HPV), which can lead to cervical cancer, and severe pelvic inflammatory disease.
  • Sexual and reproductive health clinics provide an important entry point for reaching women at risk for and living with HIV. Nearly two-thirds (63%) of women receiving care at sexual and reproductive health clinics report it as their usual source of medical care.
  • Research efforts are exploring a number of new HIV prevention technologies which could be particularly beneficial for women, such as cervical barriers and microbicides. The long-acting injectable lenacapavir has also been shown to be highly effective in preventing HIV among women but is not yet approved in the U.S. Once approved, this will be an important addition to the prevention toolkit for women, particularly given its relatively low burden of twice annual injections.

Intimate Partner Violence (IPV) and HIV

  • Women living with HIV are disproportionately affected by intimate partner violence (IPV), including physical, sexual, and emotional abuse compared to the general population. Intimate partner violence (IPV), sometimes referred to as domestic violence, has been shown to be associated with increased risk for HIV among women, as well as poorer treatment outcomes for those who are already positive.
  • In the U.S., 35% of women living with HIV experienced physical (i.e. non-sexual) IPV in their lifetime, compared to 24% of men living with HIV.
  • In many cases, the factors that put women at risk for HIV are similar to those that make them vulnerable to experiencing trauma or IPV: women in violent relationships are at a greater risk for contracting STIs, including HIV, than women in non-violent relationships, and women who experience IPV are more likely to report risk factors for HIV. These experiences are interrelated and can become a cycle of violence, HIV risk, and HIV acquisition.
  • Women may also be at increased risk of experiencing violence upon disclosure of their HIV status to partners.

HIV Prevention

  • The CDC recommends routine HIV screening for all adults, including women, ages 13-64, in health care settings, as well as repeat screening at least annually for those at high risk. The CDC also separately recommends that all pregnant women be screened for HIV, and that those at high-risk for HIV have repeat HIV screening in the third trimester. Testing of newborns is also recommended if the mother’s HIV status is unknown.
  • Additionally, the United States Preventive Services Task Force (USPSTF) recommends HIV testing (including specifically for pregnant women), IPV screening, many STI screenings, and pre-exposure prophylaxis (PrEP) which means that most insurers are required to cover these services without cost-sharing.
  • Despite these recommendations, only 37% of women in the U.S. ages 18-64 report having been tested for HIV at some point. Black women are much more likely to report having been tested in the past year compared to White women (21% compared to 6%).
  • PrEP is a safe and highly effectivepreventive medication that reduces the risk of acquiring HIV through sex by 99%. Women have been underrepresented in PrEP uptake and use and not all forms of PrEP are approved for people assigned female at birth. Recent developments in PrEP research have shown lenacapavir to be highly effective in preventing HIV among cisgender and transgender women.

Access to Care & Treatment

  • As is the case for all people, there are several sources of care and treatment for women living with and at risk for HIV in the U.S., including government programs such as Medicaid, Medicare, and the Ryan White Program for those who are eligible.
  • Looking across the care continuum, women see progress but continue to face challenges related to diagnosis, linkage to care, and viral suppression. At the end of 2022, among all women living with HIV, 90% were diagnosed, 48% were retained in care, and 57% were virally suppressed, similar to the shares among men.
  • Among women with HIV, 21% were diagnosed late – that is, were diagnosed with AIDS within 3 months of testing positive for HIV, the same share as among men. This suggests that one in five women are not adequately being served by HIV testing services and are not getting into care within ideal timeframes.
  1. Unless otherwise noted, the term “women” in this factsheet refers to sex assigned at birth. ↩︎
  2. Unless otherwise noted, HIV data come from KFF analysis of the Centers for Disease Control and Prevention (CDC) data in the CDC’s National Center for HIV, Viral Hepatitis, STD, and Tuberculosis Prevention tool: Atlas Plus. https://www.cdc.gov/nchhstp/about/atlasplus.html ↩︎

Potential Health Policy Administrative Actions in the Second Trump Administration

President-elect Trump could exercise executive branch authority through administrative action to quickly move forward on some policy changes without congressional action.

Published: Dec 16, 2024

This is a quick guide to potential health policy administrative actions under the incoming Trump administration based on campaign positions and statements by President-elect Trump, President Trump’s record during his first administration, and expected actions that would reverse or modify regulations or guidance issued by the Biden administration. Click the + to expand for details of each potential action.

Note: This is not an exhaustive list of possible administrative actions by President-elect Trump and the guide may be updated as new information becomes available up until his inauguration on January 20, 2025.

Affordable Care Act


Abortion


Contraception


Medicaid


Immigration and Health


LGBTQ Health Policy

Public Health

Racial Health Equity and DEI Initiatives


Global Health


Prescription Drugs


Fentanyl


Long-term Care


Water Fluoridation in the U.S.: The Federal Role in Policy and Practice

Published: Dec 13, 2024

Introduction

Fluoridating water has been a long-standing public health practice in most communities across the U.S. and has been supported and recommended by the federal government for decades. Even so, ever since the first U.S. community began fluoridating its water in 1945 there have also been concerns raised about this practice and many communities choose not to fluoridate. In recent years, in fact, there has been growing scrutiny of the practice, and debates in many parts of the country about whether to continue fluoridation. President-elect Trump’s announced nomination of Robert F. Kennedy Jr. to be the Secretary of Health and Human Services has raised questions about the potential for the federal government to influence water fluoridation practices across the country. Kennedy has long been critical of water fluoridation and has said the incoming Trump administration will recommend that fluoride be removed from public water on day one. Meanwhile, key professional associations, public health experts, and many policymakers continue to support fluoridation as an important tool for improving dental health in the U.S., and perhaps one of the most important public health interventions ever implemented.

To help inform policy discussions about this topic, this brief provides an overview of the role of the federal government in water fluoridation decisions and the current status of water fluoridation in the U.S. While the federal government cannot require communities to fluoridate their water or remove fluoridation already in place, it does regulate maximum levels and provides guidance to state and local communities on optimal levels of fluoride. If guidance were to change – for example, suggesting that fluoride was not recommended — it could have ripple effects across the country.

The Federal Government’s Role and Current Recommendations for Water Fluoridation

The federal government does not have legal authority to require state and local communities to fluoridate their water, nor to remove fluoridation in areas where it is already policy. Instead, these decisions – just like many public health policy decisions in the U.S. – are made at the state and local levels. There are some states (for example: California, Delaware, Georgia, Illinois, Kentucky, Louisiana, Minnesota, Mississippi, Nebraska, Nevada, Ohio and South Dakota) that require water systems of a certain size within their state to provide fluoridated water, while others leave this decision to city, county, or other officials or leave the choice up to voters who decide via local referendums. At the same time, the federal government – specifically the Environmental Protection Agency (EPA) – does have the primary authority to set and regulate the maximum level of fluoridation in public water systems.

The federal government reviews data and other evidence about the safety and effectiveness of fluoridation and issues recommendations and guidance on best practices for state and local decision-makers to consider. The Department of Health and Human Services (HHS), in particular the Centers for Disease Control and Prevention (CDC), provides recommendations about best practices for achieving public health benefits from fluoridation. The first federal guidelines regarding fluoridation of water systems came from the U.S. Public Health Service (USPHS) in 1945, with a recommended maximum concentration level. Updated guidelines in 1962 revised this maximum, and included, for the first time, a recommended fluoride level, citing its ability to prevent dental caries; the most recent update to these federal guidelines was in 2015.

The federal government also sets and enforces nationwide standards for maximum allowable fluoridation levels. The EPA, acting via the authority provided through the Safe Drinking Water Act of 1974, is responsible for setting federal standards for maximum fluoridation levels in water systems to protect against risks from excessive exposure to fluoride. This includes setting a primary, legally enforceable standard for water fluoridation levels, and a secondary “non-enforceable” standard. If a water system’s fluoridation levels exceed the primary enforceable standard, legal action can be taken against the water provider; if levels exceed the secondary, non-enforceable standard, it does not trigger legal or federal action, but public notice of the exceedance must be provided to persons served by the system no later than 12 months after the levels were exceeded. EPA delegates this regulatory and enforcement authority to states that meet certain capacity requirements. States may also set their own maximum fluoride levels, as long as they are at least as stringent as federal standards.

Current HHS/USPHS guidelines (last updated in 2015) recommend an optimal fluoride concentration of 0.7 mg per liter (mg/L) in community water systems (CWS) while EPA regulations set the primary standard for the maximum level of fluoride in water systems at 4.0 mg/L and the secondary, non-enforceable standard at 2.0 mg/L. Both HHS/CDC and the EPA have discretion to update their guidance and recommendations and have done so in the past. Updating the USPHS guidelines involves a years-long, interagency and multi-stakeholder process that is likely to include review and input from external experts and a period for public comment and discussion. For example, following an internal process that developed its initial updated fluoridation recommendations, HHS published its proposed changes in 2011.  After further review and public comment periods, the final updated recommendations were published in 2015, and included a change to the recommended fluoride concentration in CWS, from 1.2 mg/L to 0.7 mg/L. The EPA set its 4.0 mg/L primary standard for fluoride in 1986, and by law the agency is required to review of drinking water standards (including fluoridation standards) at least every six years. The EPA’s most recent review of drinking water standards, released in July 2024, concluded that the current maximum fluoride level guideline is “not a candidate for revision at this time.” In the future, the EPA could decide to initiate a new review and assessment process for its fluoride guidelines.

Benefits and Risks from Water Fluoridation

Water fluoridation has been found to be effective in reducing the risk and severity of dental caries (tooth decay) in children (as well as adults). According to CDC, a review of the best available evidence shows water fluoridation reduces tooth decay by about 25% in children and adults, and evidence also shows that children living in communities where water is fluoridated have, on average, more than two fewer decayed teeth compared to similar children living in non-fluoridated communities. A comprehensive review of relevant studies, updated in 2024, concluded that evidence shows that initiation of water fluoridation reduces dental caries in children. A study from Juneau, Alaska found that cessation of fluoridation in that community was associated with increases in the number of dental caries, and the number of related procedures and treatments among Medicaid-eligible children.

At the same time, questions have been raised about health risks from exposure to high levels of fluoride concentrations, beyond current federal standards. Extended exposure to high levels of fluoride may have negative effects, such as contributing to dental fluorosis, a discoloration of teeth in young children. Recently, there have been more concerns raised about high levels of fluoride exposure and potential links to other conditions. For example, a 2024 U.S. National Toxicology Program (NTP) monograph suggests a potential link between high fluoride levels (above 1.5 mg per liter, more than double the USPHS recommended amounts for community water fluoridation) and lower IQ in children, but studies reviewed for that publication were from areas outside the U.S. with naturally high fluoride concentrations in their water. The monograph concludes that more studies are needed to fully understand the potential for lower levels (under 1.5 mg/L) of fluoride exposure to affect children’s IQ. Based in part on these findings, in September 2024, a US district judge ordered the EPA to take further regulatory action on fluoride, citing the potential risks to children’s neurological development; the EPA says it is reviewing the court decision, but no additional regulatory actions have been taken to date.

Status of Water Fluoridation in the U.S.

As of 2022, the CDC estimates that 72.3% of the U.S. population that is connected to community water systems (CWS) receives fluoridated water, or 62.8% of the U.S. population overall. Not all people are connected to CWS, as a proportion of the population accesses water through wells or other private sources. The overall percentage of the U.S. population with access to fluoridated water has barely changed over the last two decades: in 2006, CDC reported that 61.5% of the population was connected to fluoridated water, compared with 62.8% in 2022. Sometimes, naturally occurring fluoride exists in water systems, and in fact, can be higher than government benchmarks, including maximum recommended levels. According to CDC, as of 2020 about 1 million people in the U.S. (0.31% of the U.S. population) were connected to CWS that had naturally occurring fluoride levels equal to or greater than the EPA’s recommended limit of 2 mg/L.

The Majority of People in Most States Receive Fluoridated Water

Access to fluoridated water varies significantly across the country. As of 2022, data from 51 jurisdictions (50 states and Washington, D.C.) show there are seven jurisdictions where over 95% of the population is connected to fluoridated CWS (D.C., Kentucky, Minnesota, Illinois, North Dakota, Virginia, and Georgia) (Figure 1). However, in nine states less than 50% of the population is connected to fluoridated CWS (Hawaii, New Jersey, Oregon, Idaho, Montana, Louisiana, Alaska, Utah, New Hampshire, and Mississippi). These data largely reflect state and local statutes and regulations on fluoridation. Some states require fluoridation for communities above a certain population (including Kentucky, Minnesota, and Illinois), and have relatively high fluoridation rates as a result. Other states leave these decisions up to localities, many of which have decided not to fluoridate their water supplies. In Hawaii, the state with the lowest fluoridation coverage, no locality fluoridates their water systems (with the exception of military bases). Similarly, In New Jersey and Oregon, the states with the second and third lowest coverage rates, local fluoridation decisions have been contentious. More generally, localities are revisiting existing fluoridation policies and considering ending the practice, which typically has to be voted on by water supply recipients.

Rural areas and smaller communities are less likely to have access to fluoridated drinking water. People who live in rural areas are more likely to rely on private wells, which are not usually treated with fluoride, as opposed to public treated water systems. Additionally, smaller communities may face financial barriers that limit their ability to adequately treat their CWSs, decreasing access to fluoridated water for their residents.

Women’s Health Insurance Coverage

Published: Dec 12, 2024

Health insurance coverage is an important factor in making health care affordable and accessible to women.1  Women with health coverage are more likely to obtain needed preventive, primary, and specialty care services, and have better access to new advances in women’s health. Among the 97.5 million women ages 19 to 64 residing in the U.S., most had some form of coverage in 2023. Over the past decade, the Affordable Care Act (ACA) has expanded access to affordable coverage through a combination of Medicaid expansions, private insurance reforms, and premium tax credits. However, while the uninsured rate has declined significantly in the past decade, gaps in private sector coverage, enrollment and eligibility barriers in publicly-funded programs, and persistent affordability challenges have left one in ten women uninsured. This factsheet reviews major sources of coverage for women residing in the U.S. in 2023, discusses the impact of the ACA on women’s coverage, and the coverage challenges that many women continue to face.

Sources of Health Insurance Coverage

Employer-Sponsored Insurance

Approximately 58.6 million women ages 19-64 (60%) received their health coverage from employer-sponsored insurance in 2023 (Figure 1).2 

Women's Health Insurance Coverage, 2023
  • Women in families with at least one full-time worker are more likely to have job-based coverage (70%) than women in families with only part time workers (33%) or without any workers (17%).3 
  • In 2023, annual insurance premiums for employer sponsored insurance averaged $8,435 for individuals and $23,968 for families. Family premiums have increased 43% over the last decade. On average, workers paid 17% of premiums for individual coverage and 29% for family coverage with the employers picking up the balance.

Non-Group Insurance

The ACA expanded access to the non-group or individually purchased insurance market by offering premium tax credits to help individuals afford coverage purchase through state-based health insurance Marketplaces. It also included many insurance reforms to alleviate some of the long-standing barriers to coverage (such as gender rating, lack of maternity coverage, and pre-existing conditions having a disproportionate effect on women) in the non-group insurance market. In 2023, about 9% of women ages 19 to 64 (approximately 8.4 million women) and 8% of their male counterparts purchased insurance in the non-group market.4  This includes individuals who purchased private policies from the ACA Marketplace in their state, as well as those who purchased coverage from private insurers that operate outside of Marketplaces.

  • Most individuals who seek insurance policies in their state’s Marketplace qualify for assistance with the costs of coverage. Individuals with incomes below $58,320 (400% of the Federal Poverty Level in 2023) can qualify for assistance in the form of federal tax credits which lower premium costs. The American Rescue Act (ARPA) of 2021, and subsequently the Inflation Reduction Act of 2022, have provided a temporary extension of Marketplace subsidies to people with higher income levels and led to record high enrollments in the ACA marketplace. These subsidies are set to expire at the end of 2025 and if they are not renewed, it would lead to a steep increase in insurance premium payments for ACA Marketplace enrollees. It is unclear whether the incoming Trump Administration plans to extend these subsidies or let them expire.
  • The ACA set new standards for all individually purchased plans, including plans available through the Marketplace as well as those that existed prior to the ACA. The ACA bars plans from charging women higher premiums than men for the same level of coverage (gender rating) or from disqualifying women from coverage because they had certain pre-existing medical conditions, including pregnancy. All direct purchase plans must also cover certain “essential health benefits” (EHBs) that fall under 10 different categories, including maternity and newborn care, mental health, and preventive care.

Medicaid

The state-federal program for individuals with low-incomes, Medicaid, covered 19% of adult women ages 19 to 64 in 2023, compared to 14% of men. Historically, to qualify for Medicaid, women had to have very low incomes and be in one of Medicaid’s eligibility categories: pregnant, mothers of children 18 and younger, a person with a disability, or over 65. Women who didn’t fall into these categories typically were not eligible regardless of how poor they were. The ACA allowed states to broaden Medicaid eligibility to most individuals with incomes less than 138% of the FPL regardless of their family or disability status, effective January 2014. As of December 2024, 40 states and DC have expanded their Medicaid programs under the ACA.

  • Medicaid covers the poorest population of women. Forty-four percent of women with low-incomes (below 200% FPL) and 52% of women living below the federal poverty level have Medicaid coverage.5 
  • By federal law, all states must provide Medicaid coverage to pregnant women with incomes up to 133% of the federal poverty level (FPL) through 60 days postpartum. However, in recent years, there has been a growing interest in expanding the length of the postpartum coverage period, and to date, all but two states have taken steps to extend postpartum Medicaid coverage to 12 months.
  • During the COVID-19 public health emergency (PHE), states provided continuous coverage to all Medicaid enrollees who had been enrolled in the program since March 18, 2020. This requirement ended on March 31, 2023, and states have gone through the process of redeterminations for Medicaid eligibility. In total, over 25 million Medicaid enrollees were disenrolled from the Medicaid program. Disenrollment rates varied across states and despite millions being disenrolled during the unwinding process, currently there are over 10 million more people enrolled in Medicaid than there were at the start of the pandemic.
  • Medicaid financed 41% of births in the U.S. in 2022, accounts for 75% of all publicly-funded family planning services and over half (61%) of all long-term care spending, which is critical for many frail elderly women.
  • Over half of the states have established programs that use Medicaid funds to cover the costs of family planning services for women with lower incomes who remain uninsured, and most states have limited scope Medicaid programs to pay for breast and cervical cancer treatment for certain low-income uninsured women.
  • Under federal law Medicaid coverage of abortion is very limited. The federal Hyde Amendment prohibits federal spending on abortions, except when the pregnancy is a result of rape or incest, or when it jeopardizes the life of the pregnant person. Twenty states use their own unmatched funds to pay for abortions for Medicaid enrollees who seek abortion in other circumstances. On June 24, 2022, the Supreme Court overturned Roe v. Wade, eliminating the federal Constitutional standard that had protected the right to abortion. Absent any federal standard addressing a right to abortion, states may set their own policies banning or protecting abortion. Among the 37 states and DC where abortion remains legal, 17 states and DC follow the Hyde restrictions, greatly limiting coverage for people who seek abortion care in those states.

Uninsured

On average, women have lower incomes and have been more likely to qualify for Medicaid than men under one of Medicaid’s eligibility categories; pregnant, parent of children under 18, disabled, or over 65. As a result, women are more likely than men to qualify for Medicaid and less likely to be uninsured. In 2023, 13% of men ages 19-64 were uninsured compared to approximately 10% of women in the same age bracket (9.3 million women).

Uninsured women often have inadequate access to care, get a lower standard of care when they are in the health system, and have poorer health outcomes. Compared to women with insurance, uninsured women have lower use of important preventive services such as mammograms, Pap tests, and timely blood pressure checks. They are also less likely to report having a regular doctor.

  • Women with lower incomes, women of color, and women who are non-citizens are at greater risk of being uninsured (Figure 2). One in five (17%) women with incomes under 200% of the FPL ($31,700 for an individual in 2023) are uninsured (Table 2), compared to 7% of women with incomes at or above 200% FPL. One in five Hispanic (20%) and American Indian and Alaska Native (19%) women are uninsured. A higher share of women in single parent households are uninsured (10%) than women in two-parent households (7%) (data not shown).6 
Health Insurance Coverage Among Non-Elderly Women by Selected Characteristics, 2023
  • The majority of women who are uninsured live in a household where someone is working: 69% are in families with at least one adult working full-time and 82% are in families with at least one part-time or full-time worker.7 
  • There is considerable state-level variation in uninsured rates across the nation, ranging from 20% of women in Texas to 3% of women in Hawaii, DC, Massachusetts, and Vermont (Figure 3). Of the 16 states with uninsured rates above the national average (10%), eight have not adopted the ACA Medicaid expansion.
Uninsured Rates Among Women Ages 19 to 64, by State, 2023
  • Many women who are uninsured are potentially eligible for financial assistance with coverage. Some are likely eligible for Medicaid but are not enrolled, while others qualify for subsidized Marketplace plans but may not be aware of coverage options or may face barriers to enrollment. However, in states that have not adopted the ACA Medicaid expansion, some women who are poor and uninsured fall into a “coverage gap” because they earn too much to qualify for Medicaid but not enough to qualify for Marketplace premium tax credits. Other uninsured women are not eligible for any assistance with health coverage due to their immigration status, their income, or because they have an offer from an employer.

Scope of Coverage and Affordability

The ACA set national standards for the scope of benefits offered in private plans. In addition to the broad categories of essential health benefits (EHBs) offered by marketplace plans, all privately purchased plans must cover maternity care which had been historically excluded from most individually purchased plans. In addition, most private plans must cover preventive services without co-payments or other cost sharing. This includes screenings for breast and cervical cancers, well woman visits (including prenatal visits), prescribed contraceptives, breastfeeding supplies and supports such as breast pumps, and several STI services. There have been several legal challenges over elements of the preventive services policy, including in the pending case, Braidwood Management Inc. v. Becerra, which could affect whether the preventive services requirement remains intact in the future. Twenty-five states have laws banning coverage of most abortions from the plans available through the state Marketplaces. These restrictions were in place prior to the Supreme Court’s decision to overturn Roe v Wade.

Affordability of coverage continues to be a significant concern for many women, both for those who are uninsured as well as those with coverage. The leading reason why uninsured adults report that they haven’t obtained coverage is that it is too expensive. Under employer-sponsored insurance, the major source of coverage for women, 60% of all covered workers with a general annual deductible have deductibles of at least $1,000 for single coverage. Thirty-seven percent of women with employer sponsored coverage report that it is difficult to meet their deductibles.8 

Health Insurance Coverage of Women Ages 19-64 in 2023, by State

Health Insurance Coverage of Women Ages 19-64 With Lower Incomes in 2023, by State
Health Insurance Coverage of Reproductive Age Adult Women Ages 18 to 49 in 2023, by State
  1. This factsheet is based on KFF analysis of data from the American Community Survey (ACS), which stratifies data by an individual’s sex as male or female. Throughout this brief we refer to “women” but recognize that not all people who are born as females identify as “women.” ↩︎
  2. KFF estimates based on 2023 American Community Survey, 1-Year Estimates. ↩︎
  3. Ibid. ↩︎
  4. Ibid. ↩︎
  5. Ibid. ↩︎
  6.  KFF estimates based on 2023 American Community Survey, 1-Year Estimates. ↩︎
  7. Ibid. ↩︎
  8. KFF June 2019 Health Tracking Poll. ↩︎

VOLUME 12

News Influencers, Opioid Disparities, and AI Bias in Healthcare

This is Irving Washington and Hagere Yilma. We direct KFF’s Health Misinformation and Trust Initiative and on behalf of all of our colleagues across KFF who work on misinformation and trust we are pleased to bring you this edition of our bi-weekly Monitor.


Summary

This volume examines the role of news influencers in spreading misinformation to younger and polarized audiences, as well as misleading narratives about harm reduction amid disparities in opioid overdose rates affecting Black and Indigenous Americans. It also explores biases in artificial intelligence (AI) in healthcare and considerations for improving engagement with health information among marginalized communities and older adults.


Recent Developments

Generational and Political Differences in Accessing Reliable Health News: The Role of News Influencers

izusek / Getty Images

A Pew Research Center poll found a shift in how Americans consume news, with 21% regularly turning to social media influencers for updates. These news influencers are primarily independent content creators with large followings, some of whom are journalists, who post about current events and civic issues on social media platforms. However, this shift toward influencer-based news may raise serious questions about the quality and accuracy of health information reaching the public. While some influencers provide credible insights, others spread false or misleading health claims. Even some influencers with medical credentials included in the sample study by Pew have spread false information about health topics like COVID-19. Other news influencers also contributed to the spread of health misinformation. For example, Joe Rogan, included in Pew’s sample of news influencers, has been criticized for using his platform to amplify false or misleading health information, including AIDS denialism and false claims about vaccine safety.

News influencers’ social media profiles can also be tied to their political ideologies, further complicating the landscape of health information. The Pew analysis found that most news influencers identify with certain political leanings, with right-leaning influencers outnumbering left-leaning influencers on most platforms. Among those who get news from influencers, conservative Republicans and liberal Democrats are more likely than moderate Republicans and Democrats to feel that the content they receive from influencers aligns with their own views. This dynamic can lead to a reinforced echo chamber, where followers consume information that supports their existing beliefs. Political figures who become influencers further complicate the landscape by blending their personal brands with their political roles, and using social media to promote their ideologies. Pew’s sample of news influencers included Mike Huckabee, former Arkansas Governor and nomination for U.S. Ambassador to Israel under the new Trump administration. Huckabee has used his social media platform to comment on health policy, including sharing misleading claims, such as equating abortions later in pregnancy with infanticide.

Addressing Misinformation About Naloxone as Opioid Overdose Remains High Among Black and Indigenous Americans 

Grace Cary / Getty Images

Although opioid deaths declined in 2023, a KFF analysis found disparities across race and ethnicity, with American Indian/Alaska Native (AIAN) and Black communities experiencing the highest rates of drug overdose deaths. Although opioid death rates began to show signs of decline across several demographic groups by 2023, the high vulnerability of AIAN and Black populations persists, reflecting broader systemic challenges, including limited access to treatment and harm reduction resources. Prior to naloxone becoming more widely available, research suggested that compared to White people, Black people had limited access to naloxone, a lifesaving drug that reverses opioid overdoses. Misinformation and stigma about naloxone may contribute to this disparity, such as the incorrect belief that naloxone leads to increased substance use. Fear of police harassment for carrying naloxone or being accused of drug possession can also deter people from accessing or using the drug, especially given the intersection of criminalization and substance use. Some public health campaigns aim to raise awareness about naloxone, but it is unclear whether these efforts are reaching or being received by Black and Indigenous communities. Addressing these issues along with affordability concerns may help address the lack of equitable access to naloxone.

Unsubstantiated Claims About Harm Reduction Programs Fuel Stigma

Cappi Thompson / Getty Images

False claims that harm reduction strategies promote drug use continue to surface in response to news about these programs, even when the news is positive. Harm reduction for opioids can involve various strategies to mitigate risks among users, such as syringe needle distribution and distribution of opioid overdose medications. For example, on November 14, NPR published an article about vending machines that provide free harm reduction tools like naloxone to anyone and sterile syringes to harm reduction clinic clients with a special code, explaining how these tools can help prevent overdose deaths and reduce the spread of infectious diseases. The article also prebunked false claims that harm reduction strategies may increase drug use and crime. Despite sharing this encouraging evidence, several Facebook users responded to NPR’s article with the false claim that harm reduction strategies promote drug use.

Recent misleading claims about harm reduction strategies have also come from public health officials. On October 16, two former top officials at the Department of Health and Human Services published an op-ed on Fox News claiming that the current administration’s harm-reduction strategies have “produced more harm, not less.” The authors claimed that harm reduction strategies promote “acceptance of a drug-using lifestyle.” On the day the article was published, Robert F. Kennedy Jr. shared it on X, stating, “Agreed. To end the opioid crisis we need common sense solutions not ‘harm reduction.’” Most comments agreed with the op-ed, with some falsely claiming that harm reduction strategies provide people with illegal drugs. The article continued to spread on social media platforms, where many posts and comments advocated against harm reduction, falsely claiming that harm reduction can “promote” drug use and discourage treatment.

Despite research showing that harm reduction strategies can prevent overdose deaths, reduce the spread of infectious diseases, and do not increase drug use or crime, the false claim that harm reduction promotes drug use persists. This may reveal public confusion about the goals and functions of harm reduction principles and programs, which aim to reduce the negative effects of drug use and link people to treatment if and when they are ready. Stigmatizing attitudes toward people who use drugs also suggest that the public may not understand that substance use disorder (SUD) is a chronic health condition and although some people are more at risk for it, SUD is fairly common, as nearly three in 10 U.S. adults say they or someone in their family has experienced opioid addiction.


AI & Emerging Technology

Addressing Racial Bias in AI used for Health Care

everythingpossible / Getty Images

Artificial intelligence (AI) is increasingly used in U.S. healthcare, but algorithms often embed racial and ethnic biases that perpetuate disparities in health outcomes. For example, algorithms used to predict health outcomes may inaccurately assess risks for minority groups due to underrepresentation in the training data. Research shows that AI systems often rely on data that overlooks factors such as a patient’s socioeconomic conditions (e.g., access to transportation or healthy food), leading to inaccurate treatment recommendations or misunderstandings about a patient’s ability to follow medical advice. Studies have also found that AI chatbots can share false medical myths about patients of color. Biases in AI systems are further exacerbated by historical inequities and a lack of transparency. Researchers suggest that reforms should focus on increasing diversity in clinical trials, incorporating socio-environmental factors into health care, and improving equity in algorithm development.

Polling Insight:

When it comes to health information, the public is not yet convinced that AI chatbots can provide accurate information. KFF’s June Health Misinformation Tracking Poll found that just one in three adults say they are “very confident” (5%) or “somewhat confident (31%) that the health information and advice they may come across on AI chatbot platforms is accurate (Figure 1). About six in ten adults say they are “not too confident” or “not at all confident.”

Notably, adults under age 50 and Black and Hispanic adults are somewhat more likely than those over age 50 and White adults, respectively, to say they have confidence in the accuracy of health information from AI chatbots, though about half or more across age and racial and ethnic groups say they are not confident.

Most Adults Are Not Confident in the Accuracy of Health Information from Chatbots 

Research Insights

Systemic Inequities and Resulting Distrust Make It Difficult for Marginalized Communities to Navigate Science Misinformation

FG Trade / Getty Images

A study published last year in Science Communication conducted focus groups of Black and Latino adults in Boston, MA to understand how historically excluded and marginalized populations perceive science-related issues and engage with misinformation. Participants expressed distrust of authority figures, celebrity endorsements, and fact-checking efforts. Many cited challenges in accessing accurate information due to institutional biases and systemic inequalities, such as discriminatory media algorithms and lack of representation in traditional newsrooms. Participants resonated most with health and wellness topics, especially messages that used storytelling, cultural figures, or social media as a guide. The findings suggest a need for culturally sensitive strategies, including leveraging trusted local leaders and improving access to multilingual, community-specific information to combat misinformation effectively.

Source: Amazeen, M. A., Vasquez, R. A., Krishna, A., Ji, Y. G., Su, C. C., & Cummings, J. J. (2024). Missing voices: examining how misinformation-susceptible individuals from underrepresented communities engage, perceive, and combat science misinformation. Science Communication46(1), 3-35.

Sharing Diverse Health Information and Mindfulness Techniques May Combat Information Fatigue in Older Adults

The Good Brigade / Getty Images

A study in Frontiers in Psychology examined how algorithm-driven content may contribute to information overload and avoidance in older adults. Because algorithms often prioritize similar or excessive information, older adults may become fatigued and avoid engaging with health content. The study suggests that mindfulness, the practice of staying focused and non-judgmental, may help mitigate this effect. While mindfulness does not directly reduce fatigue from information overload, it helps individuals engage more effectively with health information. The findings highlight the importance of providing diverse, accessible health content and incorporating mindfulness techniques to improve how older adults process and respond to health-related information.

Source: Zhong, F., & Gu, C. (2024). The impact of health information echo chambers on older adults avoidance behavior: the mediating role of information fatigue and the moderating role of trait mindfulness. Frontiers in Psychology15, 1412515.

About The Health Information and Trust Initiative: the Health Information and Trust Initiative is a KFF program aimed at tracking health misinformation in the U.S., analyzing its impact on the American people, and mobilizing media to address the problem. Our goal is to be of service to everyone working on health misinformation, strengthen efforts to counter misinformation, and build trust. 


View all KFF Monitors

The Monitor is a report from KFF’s Health Information and Trust initiative that focuses on recent developments in health information. It’s free and published twice a month.

Sign up to receive KFF Monitor
email updates


Support for the Health Information and Trust initiative is provided by the Robert Wood Johnson Foundation (RWJF). The views expressed do not necessarily reflect the views of RWJF and KFF maintains full editorial control over all of its policy analysis, polling, and journalism activities. The Public Good Projects (PGP) provides media monitoring data KFF uses in producing the Monitor.

Donor Government Funding for Family Planning in 2023

Authors: Adam Wexler, Jennifer Kates, Stephanie Oum, and Eric Lief
Published: Dec 12, 2024

Key Findings

This report provides an analysis of donor government funding for family planning in low- and middle-income countries in 2023, the most recent year available, as well as trends over time. It includes both bilateral funding from donor governments and their contributions to the United Nations Population Fund (UNFPA). It is part of an effort by KFF to track such funding that began after the London Summit on Family Planning in 2012. Overall, donor government funding for family planning increased in 2023, returning to prior year levels, but still below its peak in 2019.

Key findings include the following:

  • Family planning funding from donor governments was US$1.47 billion in 2023. Most funding is provided bilaterally (US$1.4 billion or 95%). The remainder – US$69.6 million (5%) – is for multilateral contributions to UNFPA’s core resources, adjusted for an estimated family planning share.
  • This represents an increase of 7% (US$101.1 million) in 2023 compared to US$1.37 billion in 2022 and is a return to prior year levels, but still below its peak reached in 2019 (US$1.58 billion).1 
  • The overall increase was due to increased bilateral funding from most donor governments; multilateral funding (contributions to UNFPA’s core resources) declined slightly largely due to decreases by Germany, Sweden, and the U.S.2 
  • Total funding increased from five donor governments in 2023 (Canada, Germany, the Netherlands, Norway, and the U.K.).3  Funding from the U.S. remained flat, and three countries decreased – Australia, Denmark, and Sweden.4  These trends were the same after accounting for exchange rate fluctuations, except for Sweden, which increased in currency of origin.5 
  • The U.S. continued to be the largest donor to family planning in 2023, accounting for 40% (US$582.5 million) of total funding from governments, followed by the Netherlands (US$246.5 million, 17%), the U.K. (US$198.6 million, 13%), Sweden (US$124.5 million, 8%) and Canada (US$112.2 million, 8%). However, when family planning funding is standardized by the size of donor economies, the Netherlands ranked first, followed by Sweden, and Norway; the U.S. ranked 7th.

The future of donor government support for family planning, however, is uncertain. A second Trump administration will almost certainly see an end to U.S. support for UNFPA, and proposed cuts to bilateral funding, as was seen in his first term. Moreover, the extent to which other donors will fill in any gaps created by the U.S. is unclear, as they face their own financial pressures and changes in leadership. Such uncertainties, and potential funding reductions, would create new challenges for reaching people in low- and middle-income countries with family planning services.

Report

Introduction

This report provides data on donor government funding for family planning activities in low- and middle-income countries in 2023, the most recent year available, as well as trends over time. It is part of an effort by KFF that began after the London Summit on Family Planning in 2012 and includes data from all 32 members of the Organisation for Economic Co-operation and Development (OECD)’s Development Assistance Committee (DAC). Data are collected directly from the largest donors and supplemented with data from the DAC. Direct data collection was carried out for nine donor governments that account for 97% of total funding for family planning. Both bilateral assistance and core contributions to UNFPA, adjusted for a family planning share, are included. For more detail, see methodology.

Findings

Total Funding

In 2023, donor government funding for family planning through bilateral and multilateral channels totaled US$1.47 billion, an increase of US$101.1 million, or 7%, compared to 2022 (US$1.37 billion). While this marks a return to prior year levels, it is below the peak level reached in 2019 (US$1.58 billion) (see Figure 1 & Table 1). The increase was entirely due to increased bilateral support from the majority of donor governments; multilateral funding decreased slightly (see “Bilateral Funding” and “Multilateral Funding” sections below).

Donor Government Funding for Family Planning, 2012-2023 (in billions)

Total funding increased from five donor governments in 2023 (Canada, Germany, the Netherlands, Norway, and the U.K.).6  Funding from the U.S. remained flat, and three countries decreased – Australia, Denmark, and Sweden.7 ,8  These trends were the same after accounting for exchange rate fluctuations, except for Sweden, which increased in currency of origin.9  There were, however, some differences among the donor governments in the amount of bilateral and multilateral funding provided between 2022 and 2023 (see Bilateral and Multilateral sections below).

Donor Government Funding for Family Planning, 2012-2023 (in current US$, millions)

The vast majority of donor government funding for family planning is provided bilaterally (95%). The remainder (5%) is for multilateral contributions to UNFPA’s core resources, adjusted based on the share used to support family planning activities. All donor governments provided a larger share of their family planning funding bilaterally (see Figure 2).

Family Planning Funding from Donor Governments by Funding Channel, 2023

The U.S. continued to be the largest government donor to family planning in 2023, accounting for 40% (US$582.5 million) of total donor government funding (see Figure 3). The Netherlands was the second largest donor (US$246.5 million or 17%), followed by the U.K. (US$198.6 million or 13%), and Sweden (US$124.5 million or 8%).

Donor Government Funding as Share of Total Disbursements for Family Planning, 2023

Bilateral Funding

Bilateral disbursements for family planning from donor governments – that is, funding disbursed by a donor on behalf of a recipient country or region – totaled US$1.40 billion in 2023, an increase of US$111.2 million, or 9%, compared to 2022 (US$1.29 billion) (see Appendix Table 1).

Bilateral funding from six donor governments (Canada, Germany, the Netherlands, Norway, Sweden, and the U.K.) increased in 2023 (see Figure 4).10  Two donor governments (Australia and Denmark) decreased funding in 2023, while the U.S. remained flat. These trends were the same after accounting for exchange rate fluctuations.

Changes in Donor Government Bilateral Funding for Family Planning (2022-2023)

The U.S. and U.K. have been the top two donors over the entire period since the London Summit (2012-2023). However, U.S. funding has been relatively flat while funding from the U.K., which fluctuated over the period, has declined in recent years. When these two are removed, bilateral funding from the other donor governments has generally increased over the period; although, there have been fluctuations (see Figure 5).

Trends in Bilateral Family Planning Funding from Donor Governments, 2012-2023 (in millions)

Multilateral Funding

While the majority of donor government assistance for family planning is provided bilaterally, donors also provide support for family planning activities through core contributions to the United Nations Population Fund (UNFPA) (where donors direct or earmark funding for specific family planning activities, such as for UNFPA Supplies, these are included as part of bilateral funding). In 2023, UNFPA estimates that 18% of its core funding was directed to family planning activities.11 

These totaled US$69.6 million in 2023, a decrease of US$10.1 million compared to 2022 (US$79.7 million) (see Appendix Table 2). The decrease was entirely due to a decline in total contributions to UNFPA’s core resources – largely from Germany, Sweden, and the U.S, rather than a change in the share of core resources UNFPA directed to family planning activities.12 ,13  Norway was the largest donor government to UNFPA’s core resources, followed by Germany, Sweden, and the Netherlands.

Fair Share

We looked at two different measures to assess the relative contributions of donor governments, or “fair share”, to family planning (see Table 2) as follows: rank by share of total donor government disbursements for family planning, and rank by funding for family planning per US$1 million in gross domestic product (GDP).

  • Rank by share of total donor government funding for family planning: By this measure, the U.S. ranked first in 2022, followed by the Netherlands, the U.K., Sweden, and Canada. The U.S. has consistently ranked #1 in absolute funding amounts over the entire period since the London Summit (2012-2023).
  • Rank by funding for family planning per US$1 million GDP: When funding for family planning is standardized by the size of donor economies (GDP per US$1 million), the Netherlands ranks at the top, followed by Sweden, Norway, and the U.K. (Figure 6); the U.S. ranks 7th.
Assessing Fair Share Across Donors, 2023
Donor Government Ranking by Funding for Family Planning per US$1 Million GDP, 2023

This work was supported in part by the Bill & Melinda Gates Foundation. KFF maintains full editorial control over all of its policy analysis, polling, and journalism activities.

Adam Wexler, Jen Kates, and Stephanie Oum are with KFF. Eric Lief is an independent consultant.

Methods

Totals presented in this analysis include both bilateral funding for family planning in low- and middle-income countries as well as the estimated share of donor government contributions to UNFPA’s core resources that are used for family planning. Amounts are based on analysis of data from the 32 donor government members of the Organisation for Economic Co-operation and Development (OECD) Development Assistance Committee (DAC) in 2023 who had reported Official Development Assistance (ODA). Bilateral and multilateral data were collected from multiple sources.

Bilateral Funding:

Bilateral funding is defined as any earmarked (family planning designated) amount and includes family planning-specific contributions to multilateral organizations (e.g., non-core contributions to UNFPA Supplies). For purposes of this analysis, funding was counted as family planning if it met the OECD CRS purpose code definition: “Family planning services including counselling; information, education and communication (IEC) activities; delivery of contraceptives; capacity building and training.”

The research team collected the latest bilateral funding data directly from nine governments: Australia, Canada, Denmark, Germany, the Netherlands, Norway, Sweden, the United Kingdom, and the United States during 2023 (see Appendix Table 3). Direct data collection from these donors was desirable because they represent the preponderance of donor government assistance for family planning and the latest official statistics – from the Organisation for Economic Co-operation and Development (OECD) Creditor Reporting System (CRS) (see: http://www.oecd.org/dac/stats/data) – do not include all forms of international assistance (e.g., funding to countries such as Russia and the Baltic States that are no longer included in the CRS database). In addition, the CRS data may not include certain funding streams, such as family planning components of mixed-purpose grants to non-governmental organizations, provided by donors. Data for all other OECD DAC member governments – Austria, Belgium, Czech Republic, the European Union, Estonia, Finland, France, Greece, Hungary, Iceland, Ireland, Italy, Japan, Korea, Lithuania, Luxembourg, New Zealand, Poland, Portugal, the Slovak Republic, Slovenia, Spain, and Switzerland – which collectively accounted for approximately 3 percent of bilateral family planning disbursements, were obtained from the OECD CRS database and are from 2022 calendar year.

For some donor governments, it was difficult to disaggregate bilateral family planning funding from broader population, reproductive and maternal health totals, as the two are sometimes represented as integrated totals. In other cases, funding for family-planning-related activities provided in the context of other official development assistance sectors (e.g., humanitarian assistance, education, civil society) was included if identifiable (e.g., if donors indicate specific family planning percentages for mixed-purpose projects, or if it was possible to identify family planning specific funding based on project titles and/or descriptions).

With some exceptions, bilateral assistance data represent disbursements. A disbursement is the actual release of funds to, or the purchase of goods or services for, a recipient. Disbursements in any given year may include disbursements of funds committed in prior years and in some cases, not all funds committed during a government fiscal year are disbursed in that year. In addition, a disbursement by a government does not necessarily mean that the funds were provided to a country or other intended end-user. Enacted amounts represent budgetary decisions that funding will be provided, regardless of the time at which actual outlays, or disbursements, occur. In recent years, most governments have converted to cash accounting frameworks, and presented budgets for legislative approval accordingly; in such cases, disbursements were used as a proxy for enacted amounts.

Amounts presented are for the fiscal year period, which vary by country. The U.S. fiscal year runs from October 1-September 30. The Australian fiscal year runs from July 1-June 30. The fiscal years for Canada and the U.K. are April 1-March 31. Denmark, Germany, the Netherlands, Norway, and Sweden use the calendar year. The OECD uses the calendar year, so data collected from the CRS for other donor governments reflect January 1-December 31. Most UN agencies use the calendar year, and their budgets are biennial.

All data are expressed in US dollars (USD). Where data were provided by governments in their currencies, they were adjusted by average daily exchange rates to obtain a USD equivalent, based on foreign exchange rate historical data available from the U.S. Federal Reserve (see: http://www.federalreserve.gov/) or in some cases from the OECD. Funding totals presented in this analysis should be considered preliminary estimates based on data provided and validated by representatives of the donor governments who were contacted directly.

Specific notes pertaining to the donor governments where direct data collection was conducted are as follows:

  • Project-level data were reviewed for Canada, Denmark, Germany, the Netherlands, Norway, and Sweden to determine whether all or a portion of the funding could be counted as family planning.
  • Project-level data were also reviewed for France for 2012-2020, but comparable data were not available for 2021-2023, so totals for these years are based on the OECD DAC CRS database. Totals for 2021-2023 will be updated once comparable data become available. Starting with the report presenting 2022 funding amounts, totals for France were included under the amounts presented for all other DAC members; prior reports presented totals for France separately.
  • Funding attributed to Australia and the United Kingdom is based on a revised Muskoka methodology as agreed upon by donors at the London Summit on Family Planning in 2012.
  • For the U.S., funding represents final, Congressional appropriations (firm commitments that will be spent) to the U.S. Agency for International Development (USAID), rather than disbursements, which can fluctuate from year-to-year due to the unique nature of the U.S. budget process (unlike most other donors, U.S. foreign assistance funding may be disbursed over a multi-year period). U.S. totals for 2017-2020 also include some funding originally appropriated by Congress for UNFPA that was transferred to the USAID family planning & reproductive health (FP/RH) account due to specific provisions in U.S. law including the Kemp-Kasten amendment (see KFF “UNFPA Funding & Kemp-Kasten: An Explainer”).

Multilateral Funding:

UNFPA core contributions were obtained from United Nations Executive Board documents and correspond to amounts received during the 2023 calendar year, regardless of which contributor’s fiscal year such disbursements pertain to. Data were already adjusted by UNFPA to represent a USD equivalent based on date of receipts. UNFPA estimates of total family planning funding provided from core resources were obtained through direct communications with UNFPA representatives for 2012-2021; family planning funding estimates from UNFPA’s core resources for 2022-2023 are based on amounts reported on UNFPA’s Transparency Portal and designated as for “Ending the Unmet Need for Family Planning”.

UNFPA’s core resources are meant to be used for both programmatic activities (family planning, population and development, HIV/AIDS, gender, and sexual and reproductive health and rights) as well as operational support. Donor government contributions to UNFPA’s core resources were adjusted to reflect the share of core resources supporting family planning activities in a given year based on information from UNFPA. For instance, in 2023, UNFPA reported expenditures totaling US$500 million from core resources including US$92 million for family planning activities, which results in an estimated 18% of a donor government’s core contribution in 2023 being included in its total funding for family planning.14 ,15 

Other than core contributions provided by governments to UNFPA, un-earmarked core contributions to United Nations entities, most of which are membership contributions set by treaty or other formal agreement (e.g., United Nations country membership assessments), are not identified as part of a donor government’s family planning assistance even if the multilateral organization in turn directs some of these funds to family planning. Rather, these would be considered as family planning funding provided by the multilateral organization and are not included in this report.

Appendices

Donor Government Bilateral Funding for Family Planning, 2012-2023 (in millions)
Donor Government Core Contributions to UNFPA, Total & FP-Share (in millions)
Donor Government Disbursements for Family Planning - Explanatory Notes, 2023 (in current US$, millions)

Endnotes

  1. Family planning totals are different from those reported last year due to updated data received after the 2023 report was published. Donor amounts do not exactly sum up to total amounts due to rounding. ↩︎
  2. The U.S. decline in its core contribution to UNFPA in 2023 was due to a one-time increase that occurred in the previous year. In 2022, the U.S. core contribution to UNFPA included the direct appropriation (US$30.6 million) provided by Congress as well as a one-time US$20 million contribution provided by the Biden administration through available funding from the American Rescue Plan Act of 2021 (P.L. 117-2). ↩︎
  3. In 2023, the U.K. Foreign, Commonwealth and Development Office (FCDO) undertook an update of its family planning funding data including a move from reporting disbursements by fiscal year to calendar year. Updated data for the entire period were not at the time of publication. As such, U.K. totals for 2021-2023 are based on the calendar year; totals for 2012-2020 are still based on the U.K. fiscal year and will be updated in the next report (overall trends are not expected to change as a result of the forthcoming update). The 2021 and 2022 totals previously reported were considered preliminary estimates and have been revised. All U.K. totals are based on the revised-Muskoka methodology. ↩︎
  4. The assessment that total U.S. family planning funding was flat in 2023 compared to 2022 is based on the amounts specified by the U.S. Congress in annual appropriations bills. The family planning amounts specified by Congress were the same in 2022 and 2023. The U.S. family planning total for 2022 as presented in this report is slightly higher than 2023 due to a one-time additional contribution to UNFPA’s core resources provided by the Biden administration (see Multilateral section). ↩︎
  5. In most cases, donor governments provide funding data in their currency of origin, which are converted to U.S. dollars for this report (see Methods). ↩︎
  6. In 2023, the U.K. Foreign, Commonwealth and Development Office (FCDO) undertook an update of its family planning funding data including a move from reporting disbursements by fiscal year to calendar year. Updated data for the entire period were not at the time of publication. As such, U.K. totals for 2021-2023 are based on the calendar year; totals for 2012-2020 are still based on the U.K. fiscal year and will be updated in the next report (overall trends are not expected to change as a result of the forthcoming update). The 2021 and 2022 totals previously reported were considered preliminary estimates and have been revised. All U.K. totals are based on the revised-Muskoka methodology. ↩︎
  7. The assessment that total U.S. family planning funding was flat in 2023 compared to 2022 is based on the amounts specified by the U.S. Congress in annual appropriations bills. The family planning amounts specified by Congress were the same in 2022 and 2023. The U.S. family planning total for 2022 as presented in this report is slightly higher than 2023 due to a one-time additional contribution to UNFPA’s core resources provided by the Biden administration (see Multilateral section). ↩︎
  8. “Other DAC Countries”, which includes: Austria, Belgium, Czech Republic, European Union, Finland, France, Greece, Hungary, Iceland, Ireland, Italy, Japan, Korea, Luxembourg, New Zealand, Poland, Portugal, the Slovak Republic, Slovenia, Spain, and Switzerland, is not listed under any assessment of increasing, decreasing, or remaining flat because there may be differences among the donor governments included. ↩︎
  9. In most cases, donor governments provide funding data in their currency of origin, which are converted to U.S. dollars for this report (see Methods). ↩︎
  10. “Other DAC Countries”, which includes: Austria, Belgium, Czech Republic, European Union, Finland, France, Greece, Hungary, Iceland, Ireland, Italy, Japan, Korea, Luxembourg, New Zealand, Poland, Portugal, the Slovak Republic, Slovenia, Spain, and Switzerland, is not listed under any assessment of increasing, decreasing, or remaining flat because there may be differences among the donor governments included. ↩︎
  11. The family planning share of UNFPA’s core resources is based on several sources including: expenditure totals as reported in UNFPA’s annual report; family planning expenditure totals as presented on UNFPA’s Programme Expenses Portal (see here), and direct communication with UNFPA (see Methods). ↩︎
  12. The U.S. decline in its core contribution to UNFPA in 2023 was due to a one-time increase that occurred in the previous year. In 2022, the U.S. core contribution to UNFPA included the direct appropriation (US$30.6 million) provided by Congress as well as a one-time US$20 million contribution provided by the Biden administration through available funding from the American Rescue Plan Act of 2021 (P.L. 117-2). ↩︎
  13. “Other DAC Countries”, which includes: Austria, Belgium, Czech Republic, European Union, Finland, France, Greece, Hungary, Iceland, Ireland, Italy, Japan, Korea, Luxembourg, New Zealand, Poland, Portugal, the Slovak Republic, Slovenia, Spain, and Switzerland, is not listed under any assessment of increasing, decreasing, or remaining flat because there may be differences among the donor governments included. ↩︎
  14. UNFPA, “United Nations Population Fund, Statistical and financial review, 2023 – Annexes, Report of the Executive Director”; April, 2024. ↩︎
  15. UNFPA, Transparency Portal (see here); accessed November 2024. ↩︎