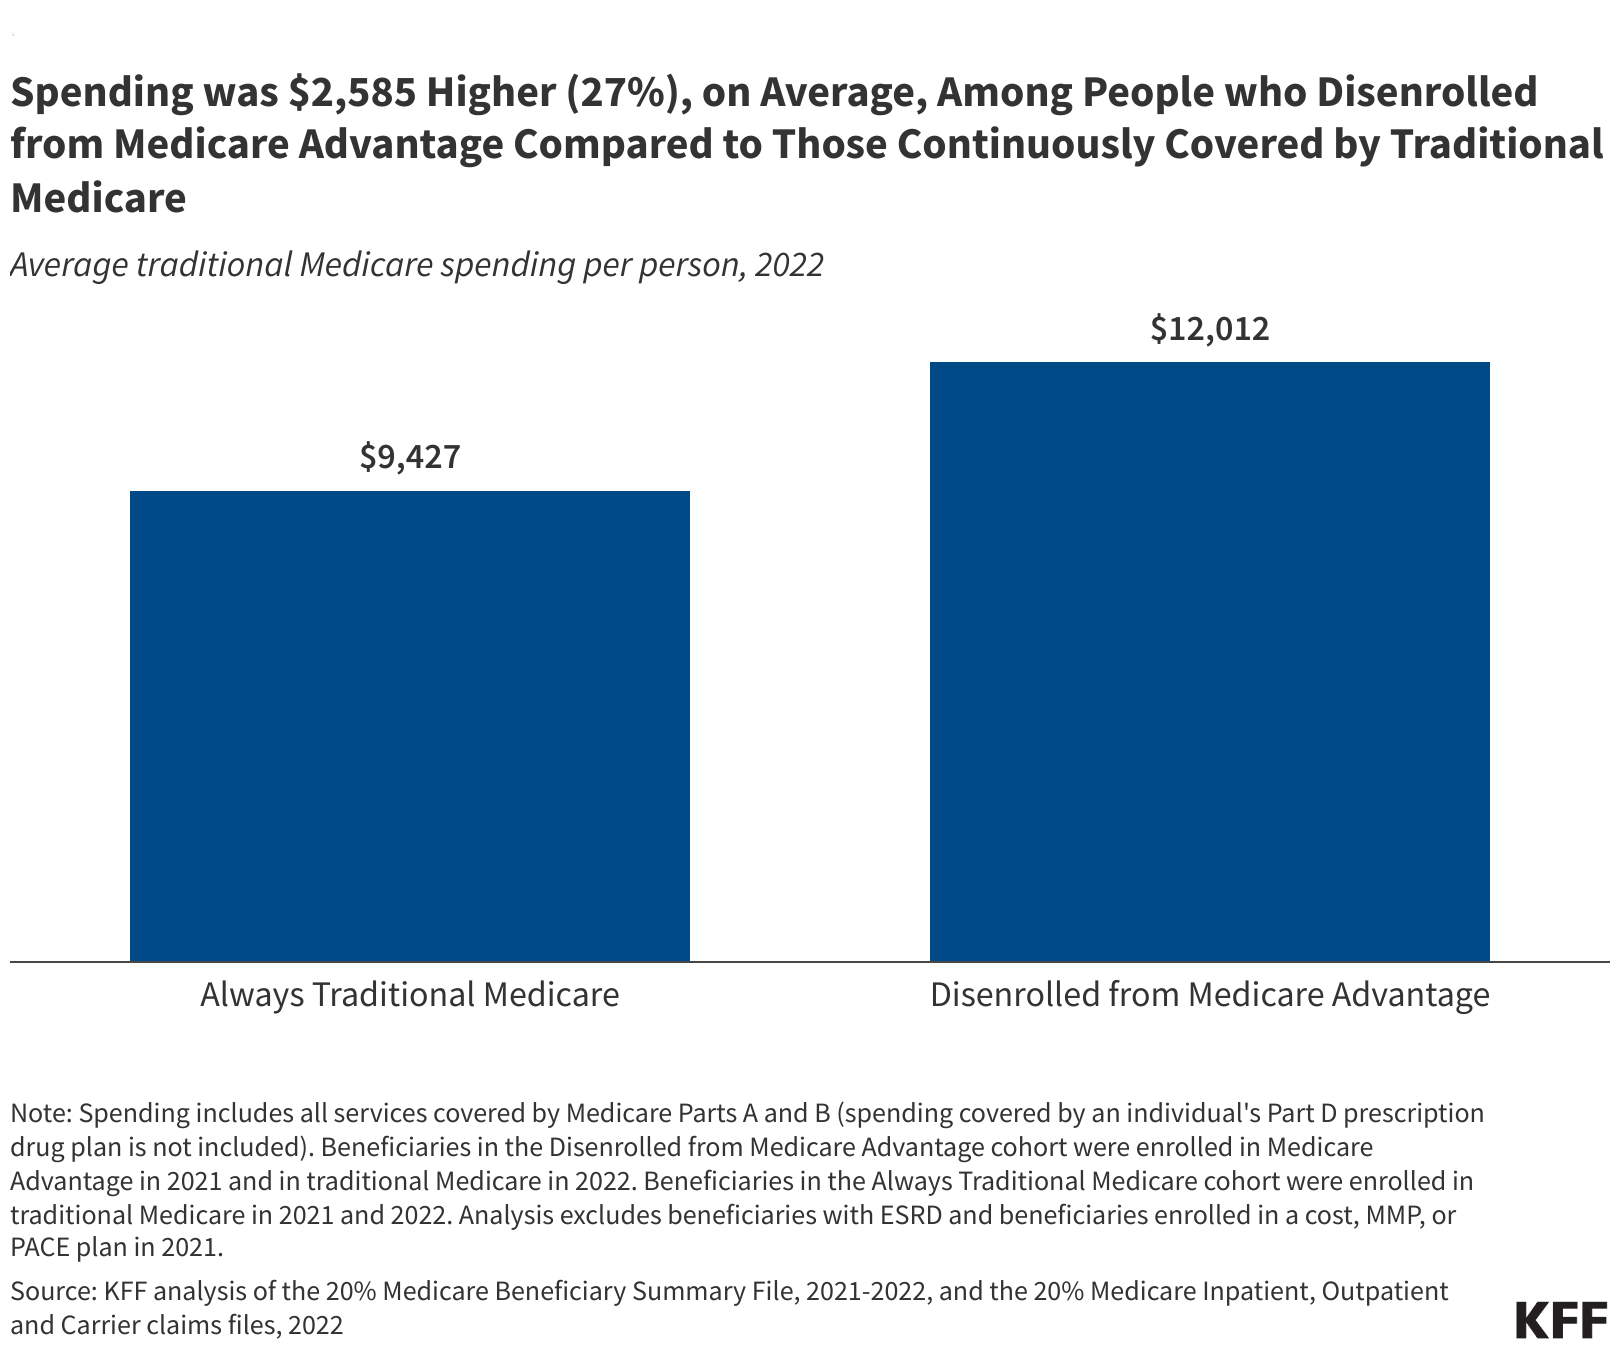
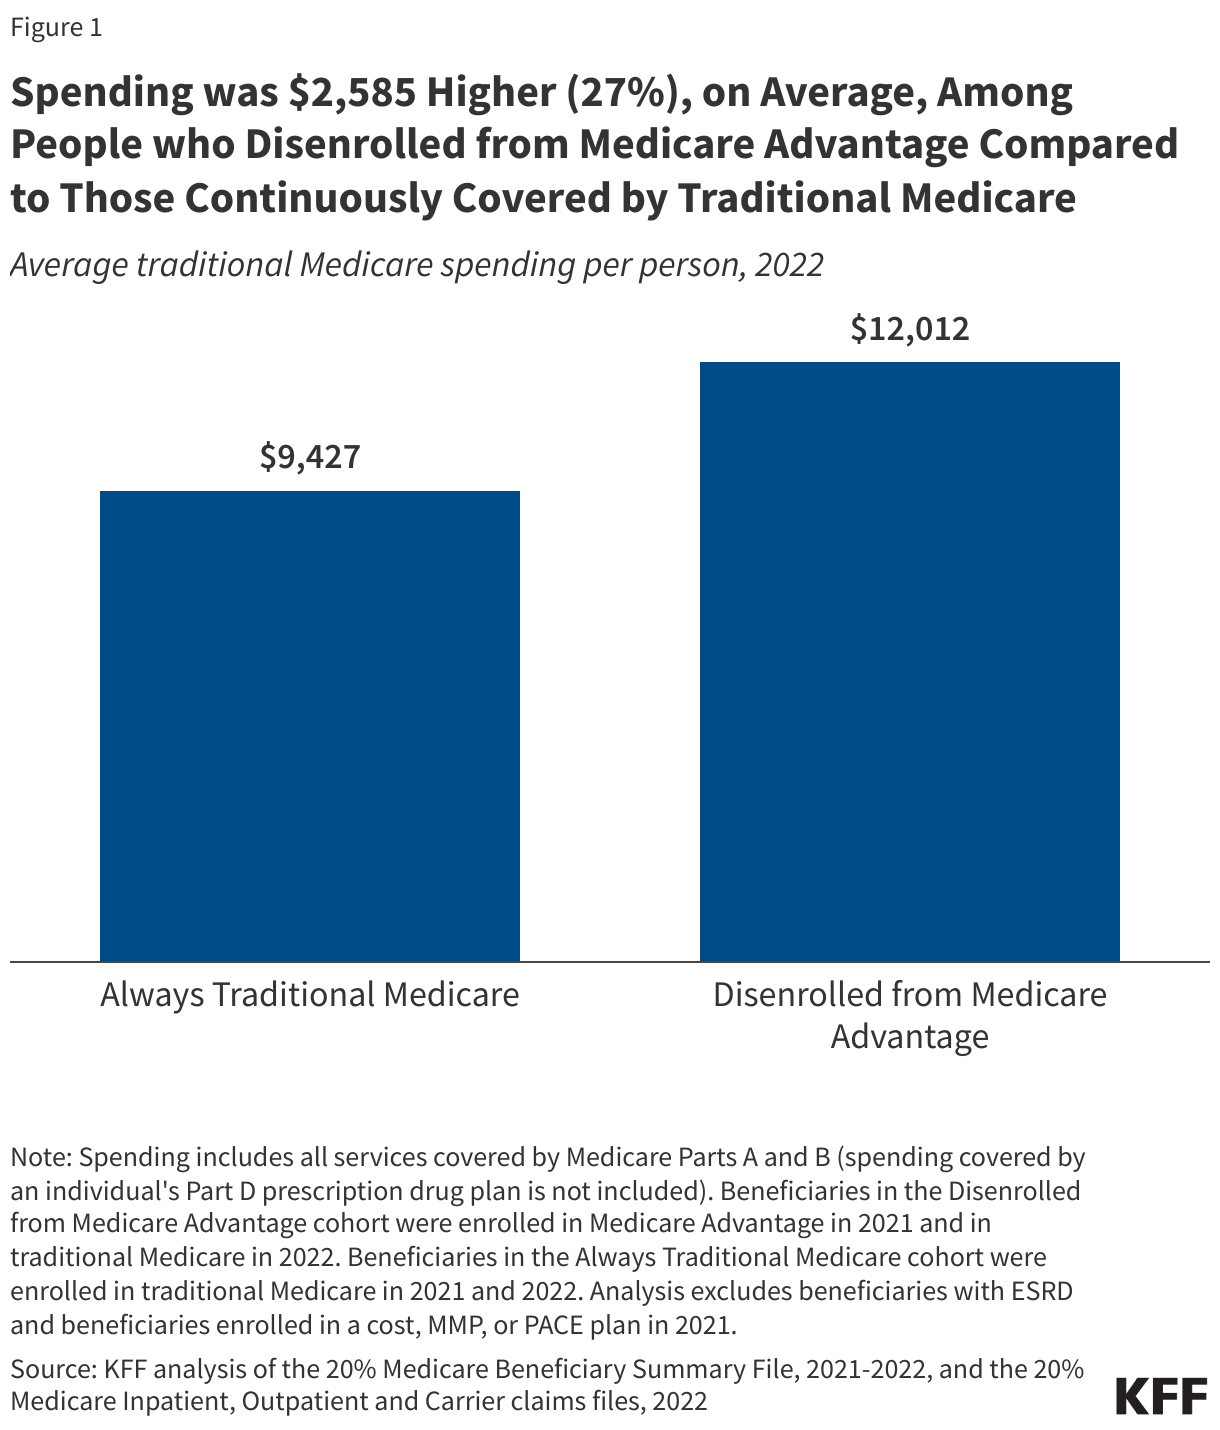
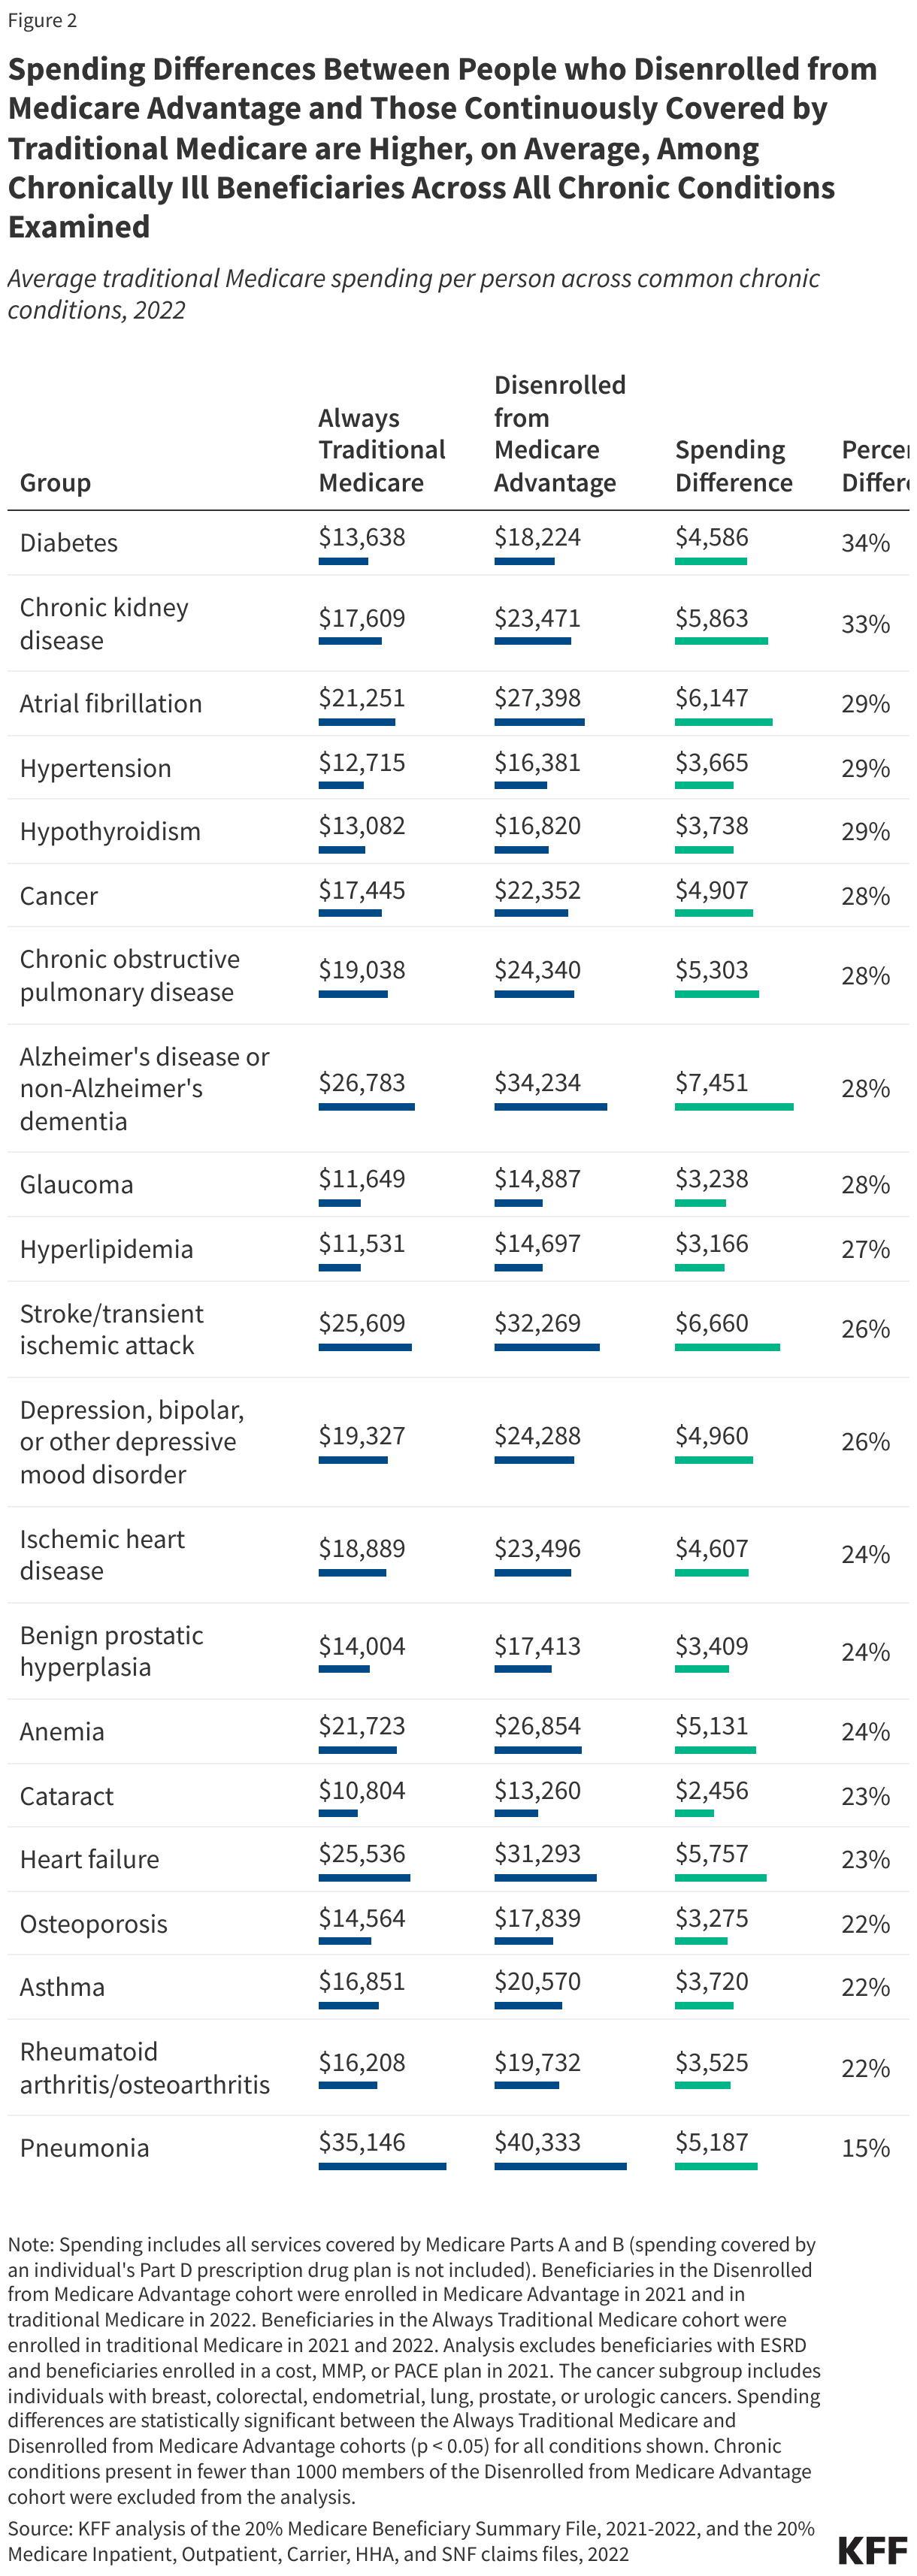
Donor Government Funding for Family Planning Reports

Published: Dec 12, 2024

These reports provide data on donor government funding for family planning activities in low- and middle-income countries. It is part of an effort by KFF that began after the London Summit on Family Planning in 2012 and includes data from all 30 members of the Organisation for Economic Co-operation and Development (OECD)’s Development Assistance Committee (DAC), as well as non-DAC members where data are available. Collectively, these donor governments provide the bulk of international assistance for family planning activities. Both bilateral assistance and core contributions to UNFPA are included.

Latest version:

December 2024

Previous versions by publish date:

A Look at Nursing Facility Characteristics Between 2015 and 2024

Published: Dec 6, 2024

Nursing facilities provide medical and personal care services for nearly 1.2 million Americans. In response to high mortality rates during the COVID-19 pandemic and long-standing staffing shortages, the Centers for Medicare and Medicaid Services (CMS) released a highly-anticipated final rule that established minimum staffing standards for nursing facilities. These standards were part of the Biden Administration’s broader strategy to increase the quality of and access to Medicaid services and long-term care. Several lawsuits have been filed in opposition to the final rule, including lawsuits filed by nursing home industry groups, Texas’ attorney general, and a group of Republican state attorneys general. With President-elect Trump returning to the presidency, the staffing rule’s future is unknown. It is not clear whether the incoming Administration will defend the nursing home staffing final rule in court, support the litigation in opposition to the rule, or issue new regulations to scale back the provisions in the staffing rule. Additionally, during President Trump’s first term, the Administration issued regulations to relax oversight for nursing facilities, which included reducing the frequency of facility assessments, removing the requirement that an infection preventionist work at a facility part-time, and removing the 14-day prescription limit for psychotropic drugs.

This data note examines the characteristics of nursing facilities and the people living in them with data from Nursing Home Compare, a publicly available dataset that provides a snapshot of information on quality of care in each nursing facility, and CASPER (Certification and Survey Provider Enhanced Reports), a dataset that includes detailed metrics collected by surveyors during nursing facility inspections. State-level data are also available on State Health Facts, KFF’s data repository with downloadable health indicators. Key takeaways include:

  • The number of nursing facilities certified by CMS decreased by 5% between July 2015 and July 2024.
  • Over that same period, the average number of hours of nursing care that residents receive per day declined by 8% (from 4.13 to 3.80), despite generally increasing health needs of nursing facility residents.
  • The average number of deficiencies per facility increased during this time period as did the share of facilities with serious deficiencies, from 17% to 28%.

The number of nursing facilities certified by CMS decreased by 5% between July 2015 and July 2024 (Figure 1). In order to receive payment under the Medicare and/or Medicaid programs, nursing facilities are required to follow certain regulations and be certified by CMS. The decreased number of nursing facilities reflects the net change in the number of certified facilities after accounting for newly-certified facilities and facilities that are no longer certified, including facilities that closed. Between 2015 and 2024, the number of residents living in nursing facilities decreased by 10%, with a steep decline between 2020 and 2021 reflecting the effects of the COVID-19 pandemic (Figure 1). Since the steep drop in 2021, resident counts have slowly started to rise but are still well below pre-pandemic levels. Prior to the pandemic, the number of residents was declining more slowly, which reflects a longer-term trend of people increasingly receiving care in home and community-based settings (HCBS) rather than institutional settings. COVID-19 exacerbated the decrease in nursing facility residents—in part because nursing facility residents and staff incurred so many deaths during the pandemic.

The Number of Certified Nursing Facilities and Residents Is Lower Than in 2015

Between July 2015 and July 2024, the average hours of care from registered nurses, licensed practical nurses, and nurse aides that nursing facility residents received declined by 8%, from 4.13 hours to 3.80 hours per resident each day (Figure 2). The decrease was driven by a 21% decline in registered nurse (RN) hours and an 8% decline in nurse aide hours. Licensed practical nurse (LPN) hours increased by 6% in this same time period. The 2024 rule on nursing facility staffing requires nursing facilities to meet minimum standards in staff hours for RNs and nurse aides but does not include any requirements for LPNs. The growing use of LPNs and declining number of RNs and nurse aide hours is one reason that fewer than 1 in 5 nursing facilities had staffing levels sufficient to meet the rule’s requirements as of April 2024, according to KFF analysis. The total hours from nursing staff decreased between 2015 and 2024, but the number of hours of care per resident rose briefly in 2021. The relatively higher staffing hours in 2021 reflected the fact that the number of residents declined more quickly than the number of staff hours did between 2020 and 2021. In 2021, the number of staffing hours was 12% lower than in 2020 (data not shown). These lower staffing levels in the last several years align with data as of March 2024 showing that the number of workers employed at long-term care facilities continues to remain below pre-pandemic levels.

The Average Hours of Care Nursing Facility Residents Receive Per Day Is Lower Than in 2015

Box 1: Direct Care Staff in Nursing Facilities

Registered Nurse (RN): Registered nurses (RNs) are responsible for the overall delivery of care to the residents and assess needs of nursing facility residents. RNs are typically required to have between two and six years of education.

Licensed Practical Nurse (LPN) and Licensed Vocational Nurse (LVN): LPNs/LVNs provide care under the direction of an RN. Together, RNs and LPNs/LVNs make sure each resident’s plan of care is being followed and their needs are being met. LPNs/LVNs typically have one year of training.

Certified Nurse Aides/Assistants (CNAs): CNAs work under the direction of a licensed nurse to assist residents with activities of daily living such as eating, bathing, dressing, assisting with walking/exercise, and using the bathroom. All CNAs must have completed a nurse aide training and competency evaluation program within 4 months of their employment. They must also pursue continuing education each year.

Both the average number of deficiencies and the share of facilities with serious deficiencies has increased over time, which could reflect increased oversight and lower staffing levels (Figure 3, Box 2). Between 2015 and 2024, the average count of deficiencies increased from 6.8 to 9.5, an increase of 40%. The increase was generally steady overtime, except for a stable period between 2020 and 2022. The share of facilities reporting serious deficiencies between 2015 and 2024 increased from 17% to 28%. The Nursing Home Staffing Study report by Abt Associates from June 2023 found that better-staffed nursing homes are typically cited for fewer deficiencies or violations of federal regulations, suggesting there may be a relationship between the increase in deficiencies and the decrease in staffing levels over the same time period.

Box 2: Deficiencies in Nursing Facilities

Nursing facilities receive deficiencies when they fail to meet the requirements necessary to receive federal funding. Deficiencies are often given for problems which may have negative effects on the health and safety of residents. Commonly cited deficiencies include a failure to provide necessary care, failure to report abuse or neglect, and violation of infection control requirements. Each of these categories has specific regulations that state surveyors review to determine whether or not facilities have met the standards.

Deficiencies are characterized by their level of severity: Deficiencies for “actual harm” or “immediate jeopardy” are the most severe and are grouped together under the term, “serious deficiencies.” CMS defines “actual harm” as a “deficiency that results in a negative outcome that has negatively affected the resident’s ability to achieve the individual’s highest functional status.” “Immediate jeopardy” is defined as a deficiency that “has caused (or is likely to cause) serious injury, harm, impairment, or death to a resident receiving care in the nursing facility.”

Deficiency Counts and Severity Are Higher Than in 2015

The share of residents by primary payer stayed relatively stable over time (Figure 4). As of July 2024, Medicaid was the primary payer for 63% of nursing facility residents; Medicare for 13% of residents; and the remaining 24% of residents had another primary payer (ex. private insurance, out-of-pocket, etc.) (Figure 4). Medicare does not generally cover long-term care but does cover up to 100 days of skilled nursing facility care following a qualifying hospital stay. KFF polling shows that four in ten adults overall incorrectly believe that Medicare is the primary source of insurance coverage for low-income people who need nursing facility care.

The share of facilities by ownership type also stayed relatively stable over time (Figure 4), but there was increasing scrutiny over the 72% of facilities that are for profit during the prior Administration. Despite little change in the type of ownership, there have been reports of private equity firms purchasing nursing facilities and changing operations to increase profits, resulting in lower-quality care. Currently available data do not reliably identify whether facilities are owned by a private equity company, though the GAO estimates that about 5% of nursing facilities had private equity ownership in 2022. The Biden Administration issued a final rule (effective as of January 2024) that requires nursing homes enrolled in Medicare or Medicaid to disclose detailed information regarding their owners, operators, and management, including:

  • Anyone who exercises any financial control over the facility;
  • Anyone who leases or subleases property to the facility, including anyone who owns 5% or more of the total value of the property; and
  • Anyone who provides administrative services, clinical consulting services, accounting or financial services, policies or procedures on operations, or cash management services for the facilities.

Facilities must also disclose whether any of the owning or managing entities are a private equity company or real estate investment trust. It is unknown whether the income Administration will eliminate, strengthen, or maintain those requirements.

Medicaid Is the Primary Payer For Over 6 in 10 Residents in Nursing Facilities
News Release

Medicare Spent an Average of 27% More on People Who Switched from Medicare Advantage to Traditional Medicare Compared to Those Who Were Only in Traditional Medicare

Published: Dec 6, 2024

A new KFF analysis finds higher Medicare spending among people who switched from Medicare Advantage to traditional Medicare than for similar beneficiaries who were in traditional Medicare all along.

Medicare spent an average of 27% more on such beneficiaries, according to the analysis, which examined health costs in traditional Medicare for both groups in the year following the switch, after adjusting for differences in health status and other characteristics. This amounts to a difference of $2,585 in Medicare spending per person, on average, between the two groups in 2022. The difference in spending among people with certain health conditions varied from 15% for those with pneumonia to 34% for people with diabetes.  

The higher Medicare spending among beneficiaries who disenrolled from Medicare Advantage compared to similar beneficiaries in traditional Medicare was due to skilled nursing facility spending (34%), followed by outpatient hospital spending (23%), and inpatient hospital spending (20%), with some variation by chronic conditions and other beneficiary characteristics. 

In 2024, more than half of all eligible Medicare beneficiaries were enrolled in a Medicare Advantage plan. Other research has found that people who use relatively more health care services are less likely to sign up for one of the private plans and more likely to choose traditional Medicare.  

The higher Medicare spending among people who disenrolled from Medicare Advantage for traditional Medicare raises several questions, including whether such switchers were unable to get the medical care they felt they needed while enrolled in a Medicare Advantage plan; whether more Medicare Advantage enrollees would make the switch if people with pre-existing conditions did not face barriers to purchasing Medicare supplemental insurance (Medigap); and whether the disenrollments reduce costs and increase profits for Medicare Advantage insurers, and increase Medicare spending. 

The analysis also drills down to examine differences in Medicare spending between switchers and those who were continuously covered by traditional Medicare by health condition, age, race and ethnicity, and dual eligible status.For the full analysis and other data and analyses about Medicare Advantage, visit kff.org.

Medicare Spending was 27% More for People who Disenrolled from Medicare Advantage than for Similar People in Traditional Medicare

Published: Dec 6, 2024

Issue Brief

More than half (54%) of eligible Medicare beneficiaries are enrolled in a private Medicare Advantage plan in 2024. People are drawn to Medicare Advantage because most plans offer extra benefits and lower cost sharing compared to traditional Medicare without supplemental insurance, usually for no additional premium (other than the Part B premium). Medicare Advantage is also popular among lawmakers in Congress, both Republicans and Democrats, as well as President-elect Trump, whose previous administration generally supported policies that provided increased flexibilities to insurers when designing and administering these private plans.

Though Medicare Advantage is a popular choice for Medicare beneficiaries, there is some evidence that people who use relatively more health care services are less likely to choose a private plan and more likely to choose traditional Medicare. Previous analyses from KFF and the Medicare Payment Advisory Commission (MedPAC) found that people who enroll in Medicare Advantage have lower Medicare spending in the years before they enroll than similar people who remain in traditional Medicare, even after controlling for health status. This pattern may be partly attributable to concerns about the tools Medicare Advantage plans typically use to manage utilization and costs, such as prior authorization requirements and provider network restrictions.

This analysis looks at traditional Medicare spending among people who choose to disenroll from Medicare Advantage and obtain coverage under traditional Medicare during the annual Medicare open enrollment period. It compares their traditional Medicare spending (Parts A and B) in the year following disenrollment to similar people who were continuously covered by traditional Medicare (see Appendix for characteristics of each group), using data from the Medicare Master Beneficiary Summary File (MBSF) for 2021 and 2022 (see Methods).

Key Takeaways

  • Medicare spent 27% more, on average, for people who were covered by traditional Medicare after disenrolling from Medicare Advantage than for people who were continuously covered by traditional Medicare, after adjusting for differences in health status and other characteristics. This is a difference of $2,585 in Medicare spending per person, on average, between the two groups in 2022.
  • Differences in Medicare spending between people who disenrolled from Medicare Advantage and beneficiaries continuously in traditional Medicare varied by health condition, ranging from 15% for people with pneumonia to 34% for people with diabetes. For example, among people with certain cancers, Medicare spending was 28% ($4,907) higher, on average, among those who disenrolled from Medicare Advantage than among people continuously covered by traditional Medicare.
  • Differences in Medicare spending between people who disenrolled from Medicare Advantage and those continuously in traditional Medicare increased with age for Medicare beneficiaries ages 65 and over. For example, among people ages 85 and over the difference was 46% ($7,113) compared to 25% among people ages 65 to 69 ($1,843).
  • Differences in Medicare spending between people who disenrolled from Medicare Advantage and beneficiaries continuously in traditional Medicare were larger among Black (55%, $5,203) and Hispanic (54%, $4,434) beneficiaries than White beneficiaries (25%, $2,464).
  • People dually-eligible for Medicare and full Medicaid benefits who disenrolled from Medicare Advantage had spending that was 61% ($9,435) higher than their counterparts who were continuously in traditional Medicare, while the difference in spending for Medicare beneficiaries who do not receive Medicaid was 20% ($1,684).
  • Skilled nursing facility spending accounted for the largest share of the difference in average Medicare spending per person between people who disenrolled from Medicare Advantage and those continuously in traditional Medicare (34%), followed by outpatient hospital spending (23%), and inpatient hospital spending (20%), with some variation by chronic conditions and other beneficiary characteristics.

The substantially higher Medicare spending among people who disenrolled from Medicare Advantage, on average, compared to similar people who were continuously covered by traditional Medicare raises several questions. First, why are some Medicare Advantage enrollees choosing to disenroll from Medicare Advantage rather than get the medical care they need from their plan, and why are they receiving more medical care in the year following disenrollment than similar people who have been continuously covered by traditional Medicare?

Second, given how challenging it can be for people with pre-existing conditions to purchase Medicare supplemental insurance (Medigap) if they switch to traditional Medicare, and concerns about potentially high out-of-pocket costs under traditional Medicare without supplemental coverage, what share of Medicare Advantage enrollees would want to switch to traditional Medicare, but feel they cannot afford to do so?

Third, does the current payment system adequately account for adverse selection into traditional Medicare, which leads to higher Medicare Advantage benchmarks and higher payments to Medicare Advantage plans? Additionally, to what extent does the pattern of higher utilization and spending among people who disenroll from Medicare Advantage, reduce the costs incurred by insurers, increasing their profits and contributing to their ability to offer supplemental benefits? Finally, how does higher Medicare spending among people who disenroll from Medicare Advantage impact Medicare spending, and to what extent does it place added strain on the Medicare Hospital Insurance Trust Fund and increase beneficiary premiums?

People who disenrolled from Medicare Advantage had Medicare spending that was 27% more, on average, than spending for similar people continuously covered by traditional Medicare

Overall, people who disenrolled from Medicare Advantage had Medicare spending that was 27% ($2,585) higher, on average, than those continuously covered by traditional Medicare, after adjusting for differences in health risk factors (Figure 1).

Spending was $2,585 Higher (27%), on Average, Among People who Disenrolled from Medicare Advantage Compared to Those Continuously Covered by Traditional Medicare

Several studies have found that certain groups of Medicare Advantage enrollees switch to traditional Medicare at higher rates, including beneficiaries in their last year of life, those with higher health needs, and those dually eligible for Medicare and Medicaid. Furthermore, some groups with high disenrollment rates, such as beneficiaries in their last year of life, have higher health care spending after they disenroll compared to similar beneficiaries who are long-time recipients of traditional Medicare.

This analysis shows that spending differences are not limited to those particularly high-need groups because the spending differences persist after controlling for health risk, though the magnitude of the difference is greater, on average, for high-cost beneficiaries. While prior research finds lower health care spending among people who enroll in Medicare Advantage, in the year prior to enrollment, this analysis shows that people who disenroll from Medicare Advantage use more services and incur higher Medicare costs in the year following disenrollment than similar beneficiaries who were continuously covered under traditional Medicare.

People who disenrolled from Medicare Advantage had higher spending, on average, than those continuously covered by traditional Medicare across all chronic health conditions examined

People who disenrolled from Medicare Advantage had higher Medicare spending, on average, across all chronic health conditions examined, after adjusting for other health risk factors, than those continuously covered by traditional Medicare (Figure 2, Appendix Table 2). Differences in average per person spending varied by condition, ranging from 15% ($5,187) for people with pneumonia to 34% ($4,586) for people with diabetes. The largest difference in Medicare spending per person in dollar terms between people who disenrolled from Medicare Advantage and those continuously in traditional Medicare was among people with Alzheimer’s disease or other dementias ($7,451), followed by stroke ($6,660), and atrial fibrillation ($6,147). Among people with certain cancers, including breast, colorectal, endometrial, lung, prostate, and urologic cancers, spending for people who disenrolled from Medicare Advantage was 28% ($4,907) higher than for people continuously covered by traditional Medicare.

Spending Differences Between People who Disenrolled from Medicare Advantage and Those Continuously Covered by Traditional Medicare are Higher, on Average, Among Chronically Ill Beneficiaries Across All Chronic Conditions Examined

People with greater health needs may see multiple health care providers and require numerous specialty services, resulting in a greater burden from the limited provider networks, prior authorization, and referral requirements Medicare Advantage plans often employ. Prior authorization is most often required for high-cost services, such as chemotherapy and other Part B drugs, inpatient hospital stays, and stays in skilled nursing facilities. In addition, narrow provider networks may limit available options for treatment of certain conditions. For instance, prior studies have found that Medicare Advantage enrollees are less likely than traditional Medicare beneficiaries to receive care from the highest rated hospitals for treatment of cancer or cancer-related surgical procedures.

Average differences in Medicare spending between people who disenrolled from Medicare Advantage and those continuously covered by traditional Medicare increased with age among beneficiaries ages 65 and older

Across all age groups, people who disenrolled form Medicare Advantage had higher Medicare spending, on average, than those continuously covered by traditional Medicare. Average differences in per person spending increased with age among older beneficiaries, from 25% ($1,843) among those ages 65-69 to 46% ($7,113) among those ages 85 and older. People under the age of 65, who qualify for Medicare due to long-term disability, have somewhat higher average spending per person than Medicare beneficiaries between the ages of 65 and 74, and the differences in spending among this group between those who disenrolled from Medicare Advantage and those continuously covered by traditional Medicare were also somewhat larger (39%, $3,348) (Figure 3).

Spending Differences Between People who Disenrolled from Medicare Advantage and Those Continuously Covered by Traditional Medicare Increased with Age, on Average, Among Beneficiaries Ages 65 and Older

Average differences in Medicare spending between people who disenrolled from Medicare Advantage and those continuously covered by traditional Medicare were higher among Black and Hispanic than White beneficiaries

Across all racial and ethnic groups examined, people who disenrolled from Medicare Advantage had higher Medicare spending, on average, than those continuously covered by traditional Medicare. Average differences in per person spending were approximately two times higher among Black (55%, $5,203) and Hispanic (54%, $4,434) beneficiaries than among White beneficiaries (25%, $2,464) (Figure 4).

Spending Differences Between People who Disenrolled from Medicare Advantage and Those Continuously Covered by Traditional Medicare are Higher, on Average, Among Black and Hispanic Beneficiaries, Compared to White Beneficiaries

Average differences in Medicare spending between people who disenrolled from Medicare Advantage and those continuously covered by traditional Medicare were higher among people dually eligible for Medicare and full Medicaid benefits

Among dual-eligible beneficiaries who qualified for full Medicaid benefits, those who disenrolled from Medicare Advantage had spending that was 61% ($9,435) higher, on average, than those continuously covered by traditional Medicare. Average differences in per person spending were smaller among beneficiaries who were not dual-eligible (20%, $1,684) and among dual-eligible beneficiaries who qualified for assistance with Medicare premiums, and in some cases cost sharing, but not full Medicaid benefits (partial-benefit dual-eligible beneficiaries) (49%, $4,114) (Figure 5).

Spending Differences Between People who Disenrolled from Medicare Advantage and Those Continuously Covered by Traditional Medicare are Higher, on Average, Among People Dually Eligible for Medicare and Full Medicaid Benefits, Compared to Those with Partial or No Medicaid Benefits

Skilled nursing facility and hospital care accounted for more than three-quarters of the average difference in Medicare spending between people who disenrolled from Medicare Advantage and those continuously covered by traditional Medicare

Skilled nursing facility services accounted for the largest share (34%, $877) of the average difference in per person spending between people who disenrolled from Medicare Advantage and those continuously covered by traditional Medicare, followed by outpatient hospital services (23%, $596) and inpatient hospital services (20%, $505) (Figure 6).

Skilled Nursing Facility Care Accounted for One-Third of the Average Difference in Spending Between People who Disenrolled from Medicare Advantage and those Continuously Covered by Traditional Medicare

For certain groups, the total difference in average per person spending between people who disenrolled from Medicare Advantage and those continuously covered by Medicare Advantage was largely driven by skilled nursing facility services. These included dual-eligible beneficiaries with full Medicaid benefits (62%), beneficiaries ages 80 to 84 (59%) and ages 85 and older (55%), and beneficiaries with pneumonia (85%), Alzheimer’s disease or other dementias (74%), stroke (74%), and heart failure (73%) (Appendix Table 3). By contrast, skilled nursing facility services made up a smaller share of the total difference in average spending among people under age 65 (20%) and those ages 65 to 69 (14%).

Among other groups, inpatient hospital services made up a larger share of the difference in average spending, including among beneficiaries under age 65 with long-term disabilities (48%), as well as among beneficiaries with asthma (47%), glaucoma (33%), and chronic obstructive pulmonary disease (33%). Beneficiaries with certain cancers had among the highest share of the total difference in average spending attributed to outpatient hospital services (34%), a similar share attributed to skilled nursing facility services (30%) and a relatively modest share of the difference attributed to spending on inpatient hospital services (18%).

Consistent with this analysis, a recent report by the majority staff of the Senate Permanent Subcommittee on Investigations found that Medicare Advantage plans are more likely to deny prior authorization requests for coverage of post-acute care, such as skilled nursing facility stays, than for other types of services.

This work was supported in part by Arnold Ventures. KFF maintains full editorial control over all of its policy analysis, polling, and journalism activities.

Appendix

Selected Demographic Characteristics of Beneficiaries who Disenrolled from Medicare Advantage, Compared to Those Continuously Covered by Traditional Medicare
Average Spending Per Person Among Beneficiaries who Disenrolled from Medicare Advantage, Compared to Those Continuously Covered by Traditional Medicare
Average Difference in Spending Per Person by Service Category Among Beneficiaries who Disenrolled from Medicare Advantage, Compared to Those Continuously Covered by Traditional Medicare

Methods

This analysis uses data from the 20% Medicare Master Beneficiary Summary File (MBSF) and Medicare claims files to compare Medicare spending (across Parts A and B) for beneficiaries who were previously enrolled in Medicare Advantage (Disenrolled from Medicare Advantage) to beneficiaries who have been continuously covered by traditional Medicare (Always Traditional Medicare). The Disenrolled from Medicare Advantage cohort includes people who were enrolled in Medicare Advantage in 2021 and in traditional Medicare in 2022. The Always Traditional Medicare cohort of beneficiaries were enrolled in traditional Medicare in both 2021 and 2022.

To be included in either cohort, beneficiaries had to have 12 months of coverage under Medicare Part A and Part B in 2021, as well as coverage in Parts A and B in all months in 2022 they were enrolled in Medicare (i.e., not deceased). The analysis includes all 50 states and DC. People with ESRD are excluded because 2021 was the first year people with ESRD were broadly eligible to enroll in a Medicare Advantage plan. For the Disenrolled from Medicare Advantage cohort, the analysis excludes people who were enrolled in a cost plan, Medicare Medicaid plan, or PACE plan in 2021.

Compared to the Always Traditional Medicare cohort, a somewhat larger share of the Disenrolled from Medicare Advantage cohort were ages 65 to 69 (24% vs. 17%), Black (10% vs. 7%) or Hispanic (7% vs. 5%), or dually eligible for Medicare and full Medicaid benefits (16% vs. 12%). There were also differences in the share of beneficiaries with certain health conditions (Appendix Table 1). To account for differences in age, dual eligibility, and health status, the risk score for each person was calculated using the CMS-HCC Risk Adjustment model based on diagnoses present in 2022. Note that the risk model is used to adjust payments to Medicare Advantage plans and does not account for race. Thus our approach also does not control for race and ethnicity.

Compared to all people enrolled in Medicare Advantage in 2021, those who disenrolled were more likely to have been covered by traditional Medicare in 2020 than those who stayed enrolled in Medicare Advantage. Specifically, among people who disenrolled from Medicare Advantage, 31% were covered by traditional Medicare in 2020; among people who stayed in Medicare Advantage, 11% were in traditional Medicare in 2020. These differences may be driven by the ability for people to return to the same Medigap policy within 12-months after switching to Medicare Advantage for the first time (note, Medicare beneficiaries are limited to a single “trial period”), relieving concerns about Medigap underwriting or cost sharing without a supplemental policy for some subset of people who disenrolled. We are unable to determine what share of the people who disenrolled from Medicare Advantage were in their “trial period” because it was the first time they had tried Medicare Advantage.

Our approach to analyzing spending follows the approach used by MedPAC in calculating average spending for people who switch from traditional Medicare to Medicare Advantage compared to those who remain in traditional Medicare. First, all Medicare payments, beneficiary liability, and other primary payer payments for all Part A and Part B services were summed for each person in the sample for Calendar Year 2022. Next, each person’s total spending is divided by their risk score (calculated using the CMS-HCC Risk Adjustment model and 2022 diagnoses) to derive risk-standardized spending, which allows for comparisons on an apple-to-apple basis for people with differences in health risk (such as differences in diagnosed health conditions). Within each county, the risk-standardized spending for each cohort is then averaged. To estimate spending given the health risk of the population of people who disenrolled from Medicare Advantage, the risk-standardized spending is then multiplied by the average risk score of people who disenrolled from Medicare Advantage. The national average spending for each cohort is then calculated as a weighted average of each county spending, using the number of people who disenrolled from Medicare Advantage as the weight. Counties in which no beneficiaries disenrolled from Medicare Advantage are excluded from the analysis. For each subgroup analysis a similar approach is followed, limiting the sample to people with the specific characteristic.

The Medicare Chronic Conditions Warehouse definitions for chronic conditions were used as a basis for identifying people with specific chronic conditions. To maintain consistency across the cohorts, only the 2022 claims were used. At least 1,000 members of the Disenrolled from Medicare Advantage cohort had to have a chronic condition for it to be included in the list.

Additionally, to test the sensitivity of the analysis, spending was modeled using a regression that controlled for risk score and county. The regression was specified using both a general linear model with a log link and a probit model. The average difference in each case was similar to those presented in this brief.

Overview of Medicare Advantage Payments

Medicare pays Medicare Advantage plans, in part, based on county-level spending for similar people in traditional Medicare, though payments may be higher or lower depending on a range of factors, such as a plan’s quality star rating, the county in which it operates, and the amount requested annually by the plan (referred to as a plan’s “bid”).

Plans that bid above traditional Medicare spending must charge enrollees an additional premium to make up the difference in cost. A growing number of plans choose to bid below traditional Medicare spending, which allows them to recoup a portion of the savings as a “rebate.” Rebates must be put towards certain plan features, such as lower cost-sharing, reductions to enrollees’ Part B or Part D premiums, or extra benefits (such as dental, vision, and hearing) not included in traditional Medicare. Payments are further adjusted to reflect the health status of enrollees, as well as certain other characteristics, such as age, sex, and Medicaid enrollment. Plans whose enrollees are expected to incur larger health costs receive larger payments (a process referred to as “risk adjustment”).

The Medicare Payment Advisory Commission estimates that payment to Medicare Advantage insurers is 122% of Medicare spending for similar beneficiaries covered by traditional Medicare. The higher payments are driven by favorable selection into Medicare Advantage and more intense coding of diagnoses among these plans. Those higher payments allow Medicare Advantage insurers to offer additional benefits and lower out-of-pocket spending, but place pressure on the hospital insurance trust fund and raise Medicare Part B premiums for all beneficiaries, including those in traditional Medicare.

With or Without ACA Repeal, ACA and Medicaid Cuts are Looming

Author: Larry Levitt
Published: Dec 5, 2024

In this JAMA Health Forum column, KFF Executive Vice President Larry Levitt explores why the incoming Trump administration and Republican majorities in Congress are likely to pursue budget cuts in Medicaid and the Affordable Care Act and why such efforts are likely to boost the number of uninsured Americans while shifting financial responsibility and decision-making to the states.

The U.S. & The Global Fund to Fight AIDS, Tuberculosis and Malaria

Published: Dec 3, 2024

This fact sheet does not reflect recent changes that have been implemented by the Trump administration, including a foreign aid review and restructuring. For more information, see KFF’s Overview of President Trump’s Executive Actions on Global Health.

Key Facts

  • The Global Fund to Fight AIDS, Tuberculosis and Malaria (Global Fund), founded in 2002, is an independent, multilateral financing entity designed to raise significant resources and accelerate efforts to end the HIV, tuberculosis (TB), and malaria epidemics.
  • The U.S. government (U.S.), which provided the Global Fund with its founding contribution, is its largest single donor; between FY 2001 and FY 2024 regular Congressional appropriations to the Global Fund totaled approximately $26 billion. In FY 2021, an additional $3.5 billion was provided by Congress as emergency funding to respond to the COVID-19 pandemic.
  • The U.S. also plays a key role in the organization’s governance and oversight, having its own Board seat and sitting on two of the Board’s committees.
  • As of October 2024, the Global Fund had approved more than $78 billion in funding to almost 130 countries for its core HIV, TB, and malaria programs; the Global Fund estimates these investments have helped to save 65 million lives. In addition to its core programmatic activities, the Global Fund played a major role in COVID-19 response efforts, awarding over $5 billion to respond to COVID-19 as of July 2024, and continues to support countries as they shift from emergency pandemic response to longer-term health systems strengthening and pandemic preparedness efforts.
  • The Global Fund’s eighth replenishment cycle, where it will mobilize resources from donors for its next funding cycle, will take place in 2025.

What is the Global Fund?

Overview

The Global Fund is an independent, multilateral financing entity designed to raise significant new resources to combat HIV, tuberculosis (TB), and malaria in low- and middle- income countries. First proposed in 2001, the Global Fund began operations in January 2002 and receives funding from both public and private donors to finance programs developed and implemented by recipient countries. The Global Fund uses a “country-defined” and “results-based financing” model that focuses on country ownership and is supported by investments from both donors and implementing countries (by contrast, bilateral support is provided from donors directly to recipient country governments, non-governmental organizations, and other entities and often reflects donor-defined priorities). To date, approximately $89 billion1  has been pledged by all donors (governments, the private sector, and private foundations) to the Global Fund, including $15.7 billion at the latest replenishment conference for the 2023-2025 funding cycle. Using these resources, the Global Fund has approved more than $78 billion in grants to almost 130 countries2  for its core HIV, TB, and malaria programs, and awarded over $5 billion in funding to respond to the COVID-19 pandemic’s impact on efforts related to these three epidemics.3  The Global Fund’s eighth replenishment cycle, where it will mobilize resources from donors for its next funding cycle, will take place in 2025.

The U.S. has played an integral role in the Global Fund since its inception. Under the George W. Bush administration, the U.S. provided the Global Fund with its founding contribution and was involved in the initial negotiations on the multilateral organization’s design. Under the Obama administration, the U.S. pledged $12.3 billion to the Global Fund over three replenishment periods.4  The Trump administration had proposed funding cuts to the Global Fund and a reduced pledge amount, although Congress rejected these proposals.5  The Biden administration signaled increased support for the Global Fund, particularly given its direct role in responding to the COVID-19 pandemic (see the Global Fund & COVID-19 section below), and pledged $6 billion over a three-year period6  at the latest replenishment conference in September 2022. The U.S. also provided an additional $3.5 billion in FY 2021 emergency funding to the Global Fund to address the impact of COVID-19 on HIV, TB, and malaria programs.

In addition to being the Global Fund’s single largest donor (see Table 1), the U.S. has a permanent seat on the Board of the Global Fund, giving it a key role in governance and oversight.7  The Global Fund has been called the “multilateral component” of the U.S. President’s Emergency Plan for AIDS Relief (PEPFAR), the U.S. government’s global effort to combat HIV (see the KFF fact sheet on PEPFAR), serving as a significant part of the U.S. government’s global health response, expanding its reach to more countries, and leveraging additional donor resources.

Still, long-ongoing discussions include the appropriate balance of U.S. funding between the Global Fund and U.S. bilateral programs, how to ensure the Global Fund’s sustainability and ability to provide the needed level of support (particularly given continued high demand for its support from countries, even amid a shortfall in available resources), and more broadly, the role of multilateralism in U.S. global health policy.8  Further, the appropriate shape of its role in strengthening health and community systems and, more broadly, pandemic preparedness and response, (its latest strategy includes a new pandemic preparedness and response objective) is also the subject of discussion.9 

Global Fund Pledges and Contributions, as of October 2024

Funding Model & Organizational Structure10 

The Global Fund was established as an independent foundation under Swiss law and operates as a multilateral financing entity. Funding is pooled from multiple sources, including from donor governments, the private sector, and private foundations. Countries submit proposals to the Global Fund, and if approved, funding is provided using a performance-based system where a grant is regularly monitored and evaluated to determine if it should be extended or discontinued based on the effectiveness of the program. Eligibility for funding is based on a country’s income classification and disease burden.11  Also, in order to incentivize recipient countries to increase their domestic investments and increase country ownership (ultimately preparing countries for graduation from Global Fund support), the Global Fund includes a policy that at least 15% of funding is conditional upon increases in co-financing (see KFF brief on co-financing for more).12 

The Global Fund’s organizational structure includes a broad set of stakeholders, and the U.S. government is involved in many of its core structures:

  • Board. The Board guides policy and strategic decisions and approves all funding. There are 20 voting members (10 implementers and 10 donors) and 8 non-voting members as follows:
    • Implementers:
      • Developing countries: seven members, one from each of the six WHO regions and an additional member from Africa.
      • Civil Society: three members, one from a developing country non-governmental organization (NGO), one from a developed country NGO, and one representative from an NGO who is a person living with HIV/AIDS or from a community living with TB or malaria.
    • Donors:
      • Government: eight members, including the U.S., which has a permanent Board seat. The U.S. also sits on the Audit & Finance and Ethics & Governance Committees.
      • Private Sector: one member.
      • Private Foundation: one member.
    • Non-voting: eight members, including the Global Fund Executive Director, the Board Chair and Vice-Chair, one representative from Global Fund partner organizations, one representative each from WHO, UNAIDS, and the World Bank, and one representative from certain public donors that are not part of a voting donor constituency.
  • Secretariat. Based in Geneva, the Secretariat manages day-to-day operations. Because the Global Fund finances but does not implement programs, it does not maintain any in-country staff.
  • Office of the Inspector General. An independent body of the Global Fund that reports directly to the Board through its Audit and Finance Committee, the Office of the Inspector General provides the Board with audits and investigations of the Fund’s activities, in an effort to promote good practices, reduce funding risks, and report on potential abuse.
  • Technical Review Panel (TRP). An independent body of global health and development experts (which has included U.S. government experts) appointed by the Board to evaluate the merits of all proposals and make funding recommendations to the Board.
  • Independent Evaluation & Learning. An independent body consisting of an Evaluation & Learning Office and Independent Evaluation Panel (IEP) that provides advisory services and oversight on the Fund’s evaluation efforts, including progress toward achieving the goals laid out in its strategy.13 
  • Country Coordinating Mechanisms (CCMs). The country-level entity comprised of public and private sector representatives, such as governments, businesses, and NGOs, that submits proposals to the Global Fund and oversees funded grants within a country. U.S. representatives sit on CCMs in almost all PEPFAR focus countries and often help with proposal development. The U.S. has also entered into a memorandum of understanding (MOU) in several countries to bring together PEPFAR with Ministries of Health and the Global Fund to clarify collaboration and partnership activities, particularly in the area of antiretroviral drug procurement.
  • Principal Recipients (PR). The legal entity chosen by the CCM to receive Global Fund disbursements, implement programs or contract with sub-recipients, and provide regular reports and progress updates to the Secretariat.
  • Local Funding Agents (LFA). Since it does not have an in-country presence, the Global Fund contracts with a local entity (usually an accounting firm) to monitor program implementation, ensure financial accountability, and provide funding recommendations to the Secretariat.

Results

The Global Fund, which was the second largest donor to global health programs in 2022 (the U.S. was the largest),14  estimates that, since 2002, its grants have helped save the lives of 65 million people who would have otherwise died due to complications from AIDS, TB, or malaria and reduced the combined death rate from these three diseases by 61%. As of October 2024, the Global Fund had approved more than $78 billion in funding for its core HIV, TB, and malaria activities and, as of July 2024, awarded over $5 billion in funding to respond to COVID-19 (see the Global Fund & COVID-19 section below).15  Funding supports a wide range of prevention, treatment, and care activities and health systems development and strengthening. Most approved funding has supported HIV programs, followed by malaria and TB (see Table 2). This funding has reached almost 130 countries,16  including not only countries that also have received U.S. bilateral support for HIV, TB, and/or malaria but also many others that have not.17  The African region has received the largest share of approved funding (68%), followed by South-East Asia (11%).18 

Global Fund Portfolio Status, as of October 2024

U.S. Engagement with the Global Fund

In addition to U.S. engagement in governance and oversight of the Global Fund, U.S. financial support has been significant and is a key component of U.S. involvement (see figure).19  The U.S. first contributed to the Global Fund in FY 2001, and then upon the creation of PEPFAR in 2003, Congress incorporated all U.S. support for the Global Fund under the PEPFAR umbrella. At that time, Congress authorized up to $1 billion for the Global Fund for FY 2004 and “such sums as may be necessary” for FY 2005-FY 2008. In the 2008 reauthorization of PEPFAR, Congress authorized up to $2 billion in FY 2009 and “such sums as may be necessary” for FY 2010-FY 2013.” In 2013, 2018, and 2024, Congress again reauthorized PEPFAR, and while those reauthorizations included provisions related to U.S. support for the Global Fund (see below), they did not include specific funding authorization amounts. Since the 2024 reauthorization was a short-term extension (through March 2025), discussions about the next reauthorization of PEPFAR, including expiring provisions related to the Global Fund, are ongoing. See the KFF policy watch on PEPFAR reauthorization key issues as well as the KFF brief on PEPFAR legislation over time.

U.S. Funding for The Global Fund, FY 2016 - FY 2025

Congress specifies support for the Global Fund each year as part of PEPFAR appropriations, and funding is typically provided through the Department of State, although funding has also been provided through USAID and NIH in past years. Between FY 2001 and FY 2024, regular Congressional appropriations to the Global Fund totaled approximately $26 billion.20  In FY 2021, an additional $3.5 billion was provided as emergency funding to respond to the COVID-19 pandemic.21  Congress has historically matched or provided more to the Global Fund each year than the President has requested. (See the KFF budget tracker and the KFF fact sheet on the U.S. Global Health Budget: Global Fund for details on historical appropriations for the Global Fund.)

While Congress has provided strong funding support for the Global Fund, it has also regularly passed provisions that placed restrictions on U.S. contributions:22 

  • Requiring that total U.S. contributions do not exceed 33% of total contributions from all donors, a provision that was part of the original PEPFAR authorization and maintained in the reauthorizations. Designed to leverage U.S. contributions to increase support from other donors and to limit the U.S. from becoming the predominant donor to the Global Fund, it was invoked only once, in FY 2004 when appropriated funds were held back until the following fiscal year when the 33% cap would not be exceeded.
  • Setting aside 5% of U.S. contributions to cover the cost of technical assistance to Global Fund grantees, a provision first included in foreign operations appropriations bill language in 2005 and in subsequent years.
  • Authorizing the Secretary of State to withhold a percentage of the U.S. contribution until the Global Fund could demonstrate improved oversight and accountability in grant disbursement.
  • Requiring, as part of the FY 2012 through FY 2024 appropriations bills, that the administration consult with Congress prior to making multi-year funding pledges.

The Global Fund & Emergency Responses

COVID-19

Since the beginning of the COVID-19 pandemic, the Global Fund acted to support countries in their efforts to address COVID-19’s impact on HIV, TB, and malaria programs. The Global Fund established a “COVID-19 Response Mechanism” (C19RM) in April 2020, and also allowed for grant flexibilities that gave countries the ability to use a certain percentage of their current grants for COVID-19 response activities. As of July 2024, the Global Fund had awarded over $5 billion in funding to more than 100 countries to support countries’ responses to COVID-19.23  Support from the Global Fund to countries was used to:

  1. support national COVID-19 response efforts, including purchasing tests, treatments, and medical supplies;
  2. mitigate COVID-19’s impact on Global Fund-supported programs; and
  3. improve health and community-led response systems.

As countries shifted from emergency pandemic response to longer-term efforts, the Global Fund allowed countries to reprogram their C19RM funds for health systems strengthening and pandemic preparedness activities. Today, the Global Fund reports that its partner countries have made a full recovery from the impacts of the COVID-19 pandemic and that service delivery metrics have surpassed pre-COVID-19 levels.

Mpox

Since Mpox was first declared a public health emergency of international concern in 2022, the Global Fund has worked to strengthen partner countries’ response to Mpox outbreaks by allowing grant flexibilities and repurposing of funds from HIV grants and C19RM funding. Specifically, countries may request support from Global Fund grants for activities such as disease surveillance, laboratory system strengthening, strengthening the workforce, as well as community engagement.

  1. Includes pledges through 2025. Includes COVID-specific emergency contributions. ↩︎
  2. Does not include countries that may have received funding through multi-country or regional programs. Additional countries may be reached through multi-country or regional programs. ↩︎
  3. Core activities represent HIV, TB, HIV/TB, malaria, multi-purpose, and Resilient & Sustainable Systems for Health (RSSH) funding only; the more than $78 million in approved funding does not include a breakdown of COVID-specific amounts as they cannot be attributed to a specific area, such as HIV, TB, or malaria. KFF analysis of The Global Fund Data Service: https://data-service.theglobalfund.org/downloads; accessed October 2024. The Global Fund, Dataset: Funding Approved for COVID-19 Response; July 2024. ↩︎
  4. The U.S. pledged $4 billion in both the FY11-FY13 and FY14-16 replenishment cycles and $4.3 billion in the FY17-FY19 replenishment cycle. U.S. State Department, Obama Administration’s Pledge to Global Fund to Fight HIV/AIDS, Malaria and Tuberculosis, October 5, 2010. The Global Fund, Fourth Voluntary Global Fund Replenishment Pledges, December 2013. White House, Office of the Press Secretary. Statement by National Security Advisor Susan E. Rice on the United States’ Global Fund Pledge; August 31, 2016. ↩︎
  5. Fulfillment of a pledge is dependent on annual Congressional appropriations. The Trump administration proposed reducing U.S. contributions to the Global Fund in each of its annual budget requests to Congress. In addition, the Trump administration proposed a pledge of $3.3 billion, matching $1 for every $3 contributed by other donors for the next replenishment period, a decline of more than $1.0 billion compared to the U.S. pledge during the prior replenishment period under the Obama administration (up to $4.3 billion, matching $1 for every $2 provided by other donors). See U.S. Department of State, FY2021 Congressional Budget Justification – Department of State, Foreign Operations, and Related Programs, February 2020. ↩︎
  6. The pledge period for the Global Fund’s seventh replenishment is 2023-2025. ↩︎
  7. Global Fund: http://www.theglobalfund.org/; as of September 2024. KFF analysis. White House, President Announces Proposal for Global Fund to Fight HIV/AIDS, Malaria and Tuberculosis; May 11, 2001. ↩︎
  8. Global Fund, The Global Fund Strategy 2023-2028, November 2021. The Global Fund, Thematic Report: Pandemic Preparedness and Response, May 2022. ↩︎
  9. Global Fund, Results Report 2024, September 2024. ↩︎
  10. Center for Global Development, Overview of the Global Fund to Fight AIDS, Tuberculosis and Malaria. ↩︎
  11. All low- and lower-middle-income countries are eligible for Global Fund grants regardless of disease burden; disease burden criteria only apply to upper-middle-income countries to determine their eligibility. ↩︎
  12. The Global Fund funding model includes a co-financing requirement for countries to show progressive government spending on health and progressive up-take of recurrent costs associated with key programs, as well as a co-financing incentive that at least 15% of a country’s allocation is withheld until the country has committed to additional investments over and above previous levels of spending. Global Fund, Website: Funding Model: Throughout the Cycle: Co-financing, available at: https://www.theglobalfund.org/en/funding-model/throughout-the-cycle/co-financing/. ↩︎
  13. The Independent Evaluation & Learning function replaces the Technical Evaluation Reference Group (TERG). Global Fund, Website: Independent Evaluation & Learning, available at: https://www.theglobalfund.org/en/iel/; accessed September 2024. ↩︎
  14. KFF analysis of OECD DAC CRS database, June 2024. ↩︎
  15. KFF analysis of the Global Fund Data Explorer: https://data.theglobalfund.org/home; accessed September 2024. The Global Fund, Dataset: Funding Approved for the COVID-19 Response; July 2024. ↩︎
  16. Does not include countries that may have received funding through multi-country or regional programs. Additional countries may be reached through multi-country or regional programs. ↩︎
  17. KFF analysis of the Global Fund Data Explorer: https://data.theglobalfund.org/home; accessed October 2024. ↩︎
  18.  KFF analysis of the Global Fund Data Explorer: https://data.theglobalfund.org/home; accessed October 2024. Regions based on WHO regional classifications. ↩︎
  19. KFF analysis of data from the Office of Management and Budget, Agency Congressional Budget Justifications, Congressional Appropriations Bills, and U.S. Foreign Assistance Dashboard [website], available at: www.foreignassistance.gov. ↩︎
  20. This amount ($26 billion) represents the total amount of funding specified by Congress through FY 2024. However, the $32 billion pledged by the U.S. (seen in Table 1) includes the latest replenishment which runs through 2025, so the amounts will not match. ↩︎
  21. KFF analysis. The American Rescue Plan Act of 2021 included $3.75 billion “to support programs for the prevention, treatment, and control of HIV/AIDS in order to prevent, prepare for, and respond to coronavirus, including to mitigate the impact on such programs from coronavirus and support recovery from the impacts of the coronavirus,” of which not less than $3.5 billion was for the Global Fund. U.S. Congress, Public Law No: 117-2; March 11, 2021. KFF, Global Funding Across U.S. COVID-19 Supplemental Funding Bills, March 2021. ↩︎
  22. KFF analysis. U.S. Congress, Public Law No: 110-293; July 30, 2008. U.S. Senate Committee on Foreign Relations (Minority Staff Report), Fraud and Abuse of Global Fund Investments at Risk without Greater Transparency; April 5, 2011. U.S. Congress, Public Law No: 112-74; December 23, 2011. KFF, PEPFAR Reauthorization: Side-by-Side of Legislation Over Time, August 18, 2022. ↩︎
  23. Global Fund, Dataset: Funding Approved for COVID-19 Response; July 2024. ↩︎

Health Care Experiences of Native Hawaiian or Pacific Islander Adults

Published: Dec 3, 2024

Issue Brief

Introduction

There are about 1.5 million people in the U.S. who identify as Native Hawaiian or Pacific Islander (NHPI) alone or in combination with another race or ethnicity, but their experiences are often missing from analyses or conflated with Asian American adults. NHPI adults face persistent disparities in health and health care, which, in part, reflect specific challenges such as geographic isolation, limited access to linguistically accessible and culturally competent care, and social and economic inequities.

To help address gaps in data and information on NHPI people’s experiences, KFF conducted seven virtual focus groups between June-August 2024 to learn about NHPI peoples’ experiences with racism, discrimination, and health. The groups were conducted by NHPI moderators and informed by representatives from several organizations serving NHPI people (see Methodology for more details). This work complements KFF’s 2023 Survey on Racism, Discrimination, and Health which was part of a major effort to document the extent and implications of people’s experiences with racism and discrimination, particularly with respect to interactions with the health care system. A companion issue brief provides key data on NHPI peoples’ health and health care use.

The themes that emerged in the focus groups were often a reflection of disparities identified in analysis of existing federal and state data, and in many cases were consistent with findings about the health care experiences of other groups of color from the Survey on Racism, Discrimination, and Health. Highlights include:

  • While many focus group participants were satisfied overall with their ability to access care when needed, others mentioned barriers including, geographic isolation and limited system capacity, and lack of language access for family members with limited English proficiency. Participants in Hawaiʻi spoke about the lack of resources on the islands and shared stories of being flown to Oʻahu or the continental U.S. to receive specialized or emergency treatment such as chemotherapy or surgery. Some participants described having to translate for family members during health care visits because an interpreter was not available or being provided with interpreters who did not speak their dialect or were unable to fully and accurately interpret information.
  • All the participants in the groups shared that they have sought care from Western medical providers, but some also said they sometimes use family or traditional practices either in place of, or in addition to seeking care from Western medical providers. Participants identified a variety of reasons for seeking traditional care including cultural connections and family traditions, mistrust of Western health care practices and providers, and/or a belief that the practices offer a more holistic approach to well-being.
  • Participants described how longstanding relationships, connections to the community, and respect for their preferences and traditions contributed to positive experiences with providers, while interactions with providers who lacked these qualities were often viewed negatively. Some participants described negative experiences such as providers assuming things about them, blaming them for a problem, dismissing or ignoring their concerns or cultural traditions. Participants attributed these negative experiences to various factors including their NHPI identity, skin color, appearance, and their health insurance status. Some participants spoke about the consequences of these negative experiences, such as reluctance to seek future care or having their health get worse.
  • Participants identified suicide, substance use, and overdose deaths as concerns in their communities, and spoke about how stigma, cultural expectations of strength, and a lack of resources are barriers to seeking mental health care. Some participants also highlighted the difficulty of finding a mental health care provider who understands their cultural background and experiences. Across the groups, participants discussed making efforts to increase communication, reduce stigma, and improve mental health for the next generation.
  • Participants suggested a number of ways to improve the health care system for themselves and their families. Some suggestions included enhancing educational resources for patients, training providers to offer culturally competent care, and increased integration of traditional and cultural practices with Western medicine.

Access to and Use of Health Care

Overall, available data show that NHPI adults under age 65 are somewhat more likely than their White counterparts to be uninsured (9% vs. 7%), and uninsured rates range widely within the population from less than one in ten of Chamorro (8%), Samoan (9%), and Native Hawaiian (9%) adults to nearly one in four (24%) Marshallese people. Data also show that NHPI adults face increased barriers to accessing health care, including not having a usual doctor or provider or going without care due to cost, with about one in four (24%) NHPI adults saying they went without a routine checkup in the past 12 months, and one in five (18%) saying they have not seen a provider due to concerns about costs. Some NHPI people also face language barriers, with about one in ten (8%) of NHPI adults reporting that they speak English less than very well, rising to about one in five Tongan (17%) and Fijian (21%) adults and one in three (32%) Marshallese adults. Focus group participants described both positive and negative health care experiences that are consistent with these data.

Insurance Coverage

Most participants had health insurance, but some identified periods of being uninsured and some described difficulties understanding or using their insurance. Participants in the groups were selected to reflect a mix of those with private insurance, Medicaid, and Medicare, as well as some who were uninsured. Reasons participants cited for being uninsured included aging out of their parents’ coverage, facing difficulties with renewing or maintaining their Medicaid eligibility, or difficulty affording the cost of insurance. Among participants who were insured, some said they found it difficult to understand what their health insurance covered, and some expressed concerns about the costs of care even when covered by health insurance. Other participants described experiences in which they or a family member struggled to understand how the U.S. health insurance system works, including lacking familiarity with the concept of paying for health care services. These experiences were mostly described by participants who were themselves or had family members from Micronesia, the Marshall Islands, or Palau, likely reflecting the fact that health care services for people living on these islands are low-cost or free given that they have largely public health care systems that receive funding from the U.S. through the COFA (Compacts of Free Association).

For the first, I think last year, six months I didn’t have insurance, but because I turned 26, so I got off my dad’s health insurance. – Samoan woman, Age 27, Oʻahu

Well, we had Med-QUEST [Medicaid] and then Med-QUEST canceled us because they said our income was too high. My husband is on home dialysis … Every month we had to pay [$930] just to keep him alive. Then Med-QUEST went back into effect because I had the emergency proclamation for the wildfire, and then we got all those bills caught up. – Native Hawaiian woman, Age 54, Hawaiʻi

My grandparents [from Micronesia] don’t understand what insurance is. … Us family members can help out in the home with trying to further break down what are these terms? What is an application? What is insurance? What does it mean to renew your application or to reapply for something? – Micronesian man, Age 29, Oʻahu

Use of Health Care

Participants described using an array of providers including private providers, community clinics, urgent care centers, the emergency room and traditional medicine practitioners to obtain health care. Some participants talked about first trying a home remedy or doing an internet search to assess the importance of seeking care before seeing a provider. While all the participants in the groups shared that they have sought care from Western medical providers, some participants also said they sometimes use family or traditional practices either in place of, or in addition to seeking care from Western medical providers. Participants identified a variety of reasons for seeking traditional care including cultural connections and family traditions, mistrust of Western health care practices and providers, and/or a belief that the practices offer a more holistic approach to well-being. Some participants expressed a desire for Western medicine to integrate more traditional practices within its range of services.

I would say the same just from things that we grew up with, like my grandmother or my aunties, for small stuff. But serious stuff, obviously if one of my kids broke an arm or something like that, then definitely [I would take them to the doctor], but for just common colds and stuff like that, there’s lots of just natural herbs of teas and stuff that I have always used in our family that are better than anything over the counter. – Samoan woman, Age 41, Oregon

If it’s something like a cut or cough or something just basic, I’ll go to the doctor. But if it’s something that I don’t know, Western medicine cannot fully explain, then I’ll try to seek out some of those things… So I would say it’s probably 80% go doctor and then 20% lāʻau lapaʻau (translation: traditional Hawaiian healing practice/medicine). I’m very glad to have that option because you cannot trust the Western medical system completely. There’s always these holistic things about us that can’t be explained by pure science. – Native Hawaiian man, Age 52, Hawaiʻi

For me, I would, most of the time, ask family members that are in the medical field. And then, sometimes, I would also ask my mom, like the older generation people, on home remedies to help with that, because I would rather do that than actually go to a hospital and get a bill, and especially when you don’t have medical [insurance]. – Samoan woman, Age 41, Utah

… in between (PCP and specialist visits) my grandpa would seek out people from our own community who can do traditional practices. If he was experiencing pain, then he would seek out somebody who could do traditional massage. – Micronesian man, Age 29, Oʻahu

Access to Providers

While many focus group participants were satisfied overall with their ability to access care when needed, some discussed difficulties navigating the health care system and getting access to providers. Participants who were satisfied with their access to care noted things like the ease of getting an appointment, quickly communicating with a provider on MyChart or through telehealth and encountering few problems with their coverage. However, many participants identified challenges with accessing health care for themselves and/or family members, such as understanding how to navigate seeing different types of providers and specialists, including getting referrals as needed. Participants shared that these challenges were especially pronounced among elders in their communities. For example, some participants discussed how elders in their communities didn’t understand that they had to see someone other than their primary care provider (PCP) to receive certain kinds of treatment, or that they had to get a referral from their PCP to see a specialist who could treat them.

We have a family doctor, and we’re always connected on MyChart. And she’s very honest too. Once you shoot a question, and then she’s going to ask what the symptoms are, and then you tell the symptoms, and then she’ll be like, “ER, now.” Or she’s going to be like, “Okay, no, let’s do this, do this,” and then try to deal with it at home before we even connect with that big bill. – Samoan man, Age 41, Alaska

Well, I feel the good thing with [private health system] is it’s so accessible. It’s very easy to navigate. On the other hand, I feel sometimes it’s a revolving door … I’ve had two different PCPs in the last, I don’t know, four years. I never met them because when I’m sick, and I call for an appointment, their next appointment is three weeks from that day. You know what I mean? No, I’m sick now. I’m not sick in three weeks. – Native Hawaiian woman, Age 47, Maui

… if you need something special, you got to call your primary care person, then they got to refer you to the specialist, and then you got to call them to make an appointment. – Native Hawaiian woman, Age 54, Maui

Geographic Isolation and Limited System Capacity

Another challenge to obtaining health care that participants identified was lack of health care system capacity and resources, particularly for those living in Hawaiʻi. Some participants across groups identified concerns about health care system capacity, noting long wait times to get appointments; long wait times at urgent care centers and/or emergency rooms; and difficulty finding available health care providers, including primary care providers. Some also felt that their interactions with providers were often rushed and impersonal due to capacity limitations. Participants in Hawaiʻi also identified challenges related to limited health care resources, including specialty or advanced care, especially on islands other than Oʻahu. Reflecting this and the relative geographic isolation of the islands, some participants described situations in which they or a family member had to be flown to Oʻahu or to the continental U.S. to receive specialized treatment or care that was not available on their island, such as chemotherapy treatment or surgery. Some participants in Hawaiʻi also described long travel times to reach providers, particularly those living in more remote areas of the islands.

For me, I go to urgent care. Only reason is because I’ve been trying to get a primary doctor up in Washington, but I can’t find one. They either aren’t accepting new patients or they don’t take my insurance. – Native Hawaiian woman, Age 57, Washington

And also it was a really big struggle to even get an appointment with your PCP; it was months. By the time I got my insurance and I got my first appointment, was five and a half months later. So this is just to establish care. So it was really bad.– Native Hawaiian woman, Age 54, Hawaiʻi

I recently broke my ankle in January and had to have surgery, and I had to fly to Oʻahu. With a broken leg, fly on the plane, get surgery, fly home same day. He didn’t put me up in the hospital. … And even with my daughter getting her chemo, we’d have to fly her to Kapiʻolani. – Native Hawaiian woman, Age 47, Hawaiʻi

In our hospital on Kauaʻi that they don’t have the staffing. They don’t have the equipment. They don’t have the stuff that we need, so we have to get medevacked out of here. And it is a blessing. … So if we got to take that 45- minute helicopter ride in order to survive, to live, so that we can see our mom tomorrow, we are going to 100% jump on that little helicopter. – Native Hawaiian woman, Age 37, Kauaʻi

Yeah, I definitely have had experiences where I’ve gone and it’s just such a long wait, I end up in the car, and then I’m like, “Let’s just go. There’s no point of us just waiting.” It’s like maybe I’ll just get better soon. I can just treat this at home with some rest. – Samoan woman, Age 27, Oʻahu

Language Access Challenges

Some participants, especially those with older relatives from Micronesia or the Marshall Islands, noted issues with access to and quality of interpreters while seeking health care for family members. Some participants described instances of having to translate for their older family members during their health care visits because an interpreter was not available or provided.1  Some also said they experienced dealing with interpreters who did not speak their dialect or mixed English terms into conversations. One participant highlighted that his grandfather’s Chuukese dialect lacked words for concepts like “insurance” and “application,” illustrating the challenges of language access.

I would have to go with my grandpa is because he didn’t speak any English. So I had to be the interpreter between him and his PCP… Even though I could do it and it was an honor for me to do that for my grandfather, it was extremely difficult for me because I wasn’t born and raised in the island… it was a huge relief when there was somebody there from our background who speaks our dialect and can interpret articulately… We have some Chuukese interpreters who are not fully interpreting everything in our language. They’re mixing in English terms. And for people or the generation of my grandparents, sometimes that’s still confusing even if you’re speaking Chuukese with them … How do you explain an application to them because there’s no word for application in our language. – Micronesian man, Age 29, Oʻahu

… one of my relatives … was going through this health checkup and she doesn’t really know a lot of things. So when she was telling the story of how this incident happened to her, my mom kind of got mad and was like … “Where was your interpreter?” And then she told us that her interpreter didn’t show up. – Micronesian woman, Age 18, Oʻahu

Postponing or Delaying Care

Many participants described instances of themselves or a family member waiting to seek care until a health condition became severe. Participants noted that putting off or avoiding care was particularly common among elders in their communities. In some cases, these delays reflected concerns about cost or difficulty navigating the system, but participants also said it sometimes reflected past negative experiences or mistrust of the health care system. Some reflected on historical mistreatment and abuses of their communities and discussed stark divides between priorities and approaches of Western medicine vs. traditional healing practices. Many participants also talked about a sense of pride and the tendency within their communities to downplay health issues and how this can further contribute to delays in seeking care.

So our people tend not to seek healthcare… If you don’t know about it, then it’s not a problem. … I think maybe it could be a multitude of reasons, not trusting the system. It’s a product of colonization, not wanting to go and seek out Western methods. And then our access to native healing is so limited. It’s not like there’s a clinic down the road that you can go for native healing. – Native Hawaiian woman, Age 47, Maui

We pay insurance, but we don’t want to go to the hospital until we really feel that we have to see a doctor. – Micronesian man, Age 48, Oʻahu

I think me and my family’s relationship with healthcare, especially my dad, would never go to the doctor. He would put it off for as long as possible, whether it’s not believing in them or too expensive or this or that. And so that’s kind of how I grew up trying to avoid the doctor. – Tongan man, Age 29, California

If it’s something more serious, I’ll go to the hospital, but it’s very rare. But with my whole family, the hospital’s usually last resort, insurance or no insurance. It’s just a last resort. Only go when you really need to. – Chamorro woman, Age 26, Washington

I just feel like the older Samoans, they believe that God’s going to cure them if they ask… I strongly believe in prayer, but prayers don’t have X-rays and CAT scans to see what’s really going on inside. God, he hears us, but the doctors are the ones that are going to tell us, “Oh, your liver is on 3%.” – Samoan/Tongan woman, Age 33, Oʻahu

My husband, he works a very strenuous job and he’s always in pain, mostly sore muscles and whatnot, because he does repetitive movement every day. And so he would do stuff at home, for example, stretching, yoga exercises and just basically having our kids step on his back when he’s in pain, just to avoid going to the doctor because he says he can hack it and whatnot. But honestly, how can we afford it if we have to literally meet the deductible before actually our benefits are applied? – Chamorro woman, Age 37, Washington

Experiences in Health Care Settings

Previous KFF research (the 2023 KFF Survey on Racism, Discrimination, and Health) finds that while most adults across racial and ethnic groups report having positive and respectful interactions with their health care providers most of the time, most groups of color report having these experiences less often than White adults. The research further finds that these groups report higher levels of unfair treatment when seeking health care than their White counterparts, and that this leads many to say they prepare for possible insults or feel they must be very careful about their appearance to be treated fairly during health care visits. These negative experiences often lead to reports of worse health, being less likely to seek care, and/or switching providers. The research also highlights the importance of having providers with a shared background, as those who have more visits with providers of the same racial or ethnic background report more positive and respectful interactions.

NHPI focus group participants described having both positive and negative experiences in health care settings, which in many cases were similar to the findings of the survey for adults with other racial and ethnic backgrounds. Positive experiences participants described included having a trusted provider, feeling like they could talk to a provider without judgement, feeling heard and respected, and receiving culturally competent care. Negative experiences were often the opposite: feeling like providers rushed and did not take the time to build trust, not feeling heard or feeling judged, and receiving care that was not culturally competent.

The Role of Trusted Providers

Participants described how longstanding relationships and connections to the community contributed to trusted relationships with providers, while interactions with providers who lacked these qualities garnered lower levels of trust. Several participants who felt their provider interactions were generally positive described having long-term relationships with their or their children’s provider, including seeing the same provider from childhood to adulthood or their children having the same pediatrician they did as a child. Participants expressed that maintaining the same provider over the years made them feel understood on a personal level, beyond just their symptoms and medical history. Participants noted that they felt it easier to build trust when their provider shared their racial and ethnic background and/or had spent time in their community, or when a provider took the time to get to know them and understand their family situation. Some participants expressed challenges communicating with and trusting providers who were not familiar with their local culture or those that did not take time to get to know them and their family beyond their medical symptoms. For example, among participants living in Hawaiʻi, some said they received better care from providers who had lived in Hawaiʻi for some time, rather than newer providers, such as travel nurses, who participants felt were unfamiliar with the local culture. On the continent, participants noted that having a provider from Hawaiʻi or another Pacific Island made them feel more at ease, but that they also felt they could trust providers who took time to listen to them and understand their needs.

So my kids’ doctor is my pediatrician or my family’s pediatrician when we were younger. So she knows the history of what we went through as kids, so she already knows what my kids are potentially looking for. – Samoan woman, Age 24, Oʻahu

Same doctor, same dentist, and they’ve been going ever since they were born. It just goes smooth every time. – Marshallese man, Age 36, Oʻahu

I think with the traveling nurses and the doctors, this is not their home, so they’re just doing their job. They don’t care about your thoughts. They don’t care about your … I think we should do this or can we do that or can you look into this? It’s like I feel they just want to tell you and leave. –

Native Hawaiian woman, Age 54, Hawaiʻi

We had a family doctor, and it was different times though. I get it. But they knew our whole family, and it was just more on a personal level, and we talk story and stuff like that. But nowadays, it’s like clinics, community clinics, or even [health system], it’s like… Or even my daughter’s dentist, it’s just people in and out and they don’t really have a chance to really get to know them. – Native Hawaiian woman, Age 47, Hawaiʻi

My mom, she’s full Samoan, right? And so she just had an episode of COVID, and we went to the ER, and the people that were not from here treated her really bad and ordered her around. And she has Alzheimer’s, so she can’t understand, and it was the folks that come and clean up beds, and then they do the smaller stuff that really made her feel welcome, like, “Auntie, lay down. Oh, just put your arm …” They really showed aloha to my mom. – Native Hawaiian man, Age 52, Hawaiʻi

Feeling Heard and Respected

Participants discussed how trusting their provider allowed them to feel like they could talk freely and share their concerns without judgement. Participants described a range of positive experiences with providers, including feeling like their provider understood them and their family background, that their provider listened to their concerns, that their provider involved them in decision-making about their care, and that their provider respected their family needs and preferences. For example, some participants spoke about how their providers listened to and respected their birth plans when they were in the hospital to give birth. Other positive experiences participants spoke about included having doctors order the labs or tests they thought they needed and not feeling like they were rushed in their interactions with their provider.

… just being heard by her [primary care provider] made me leave there feeling good, feeling hopeful that somebody cares. – Native Hawaiian woman, Age 39, Washington

I just went to the doctors today, my son had a checkup today. They talk story, they’re pretty friendly. They talk about where we live and what kind of stuff we do. And I guess for me, the doctor we have, he tries to relate and he tries to be approachable with us. And for us, it works out. We’re comfortable with our doctor right now. – Native Hawaiian man, Age 31, Oʻahu

… my kids’ pediatrician, she’s a Haole girl (translation: foreigner, not from Hawaiʻi), and she is amazing. She knows my story every time I come back. She knows I adopted my kids from Child Welfare … so she’ll ask those kind of questions when I’m there or when I bring them. She’s like, “Oh, how’s the adoption process going?” And I’m like, “Oh, we’re almost there.” You know what I mean? – Native Hawaiian woman, Age 47, Maui

In contrast to these positive interactions, many participants also described negative experiences in which they felt judged or ignored by a provider. These experiences included feeling judged or blamed for their health issues, not receiving medications they believed they needed, or feeling dismissed and rushed during visits. Others shared experiences of not getting the labs or tests they think they needed and not having information explained to them in an understandable way.

So when I had my third child, I had gestational diabetes. But why is it like that now? That’s the question I asked my doctor, “Why, when the rest of my two was perfectly fine?” She didn’t have an answer, but that’s what made me stop going to the doctors just recently was because everything I’ve told her, she kind of rebelled against it and was like, “No.” – Samoan woman, Age 24, Oʻahu

I feel like because I’m a bigger person, I get overlooked so much because I’m on the bigger side of the spectrum and nobody in where I go to the hospital is a person of color. So I feel like that’s a big thing too. And we kind of just get pushed to the side in the medical field. That’s how I feel in some of the instances where I just have to be really firm on what I want but not do it in a way where I don’t seem that I’m being aggressive too. – Samoan woman, Age 36, California

For me, it was just being dismissive, automatically assuming that I speak Spanish. If I had a dollar every time somebody spoke Spanish to me. – Samoan woman, Age 41, Oregon

Culturally Competent Care

Across the groups, participants said that they valued providers who showed cultural understanding and respect, regardless of the ethnic or cultural background of the provider. Examples of culturally competent care participants discussed included avoiding assumptions based on racial or ethnic background, considering factors beyond just diet and exercise when addressing health concerns, and recognizing the importance of extended family. Some participants also discussed how they appreciated health care providers who respected and didn’t judge participants for turning to family or traditional practices before seeking care when dealing with a health issue.

The positive experience I had with that was just the culturally competent staff members … while my grandma was in the ER, because us Micronesians, we are people of community. So, it’s not just the kids and grandkids who show up, but it’s our extended relatives who show up and they want to know what’s going on and know if she’s okay. And the staff members, I think some of them kind of had a hard time, because they’re like, “Why is there so many people here?” Some of the [other] staff members, they were like, “Oh yeah, come in. Come and check in on her,” and they were wanting to make sure the family was updated on everything that’s going on. And one of the doctors that was in the ER, … he came to our family and said, “I understand that you guys have a big family, but if we could have one point of contact to make sure we can just be in contact with that one person in the family,” which was me because I’m the English-speaking person in my family. … It is comforting to have people who understand your culture and they’re flexible with meeting us halfway to make sure our questions are answered and our needs are being met from my grandma. – Micronesian man, Age 29, Oʻahu

I did find a primary care physician and she’s a Filipina. So right away when I met her, she made me feel really comfortable. And she asked us where we’re from and she found out that we’re from Guam. She related to us, made us feel connected pretty much… She understood what foods we eat and everything. So versus a nurse practitioner that I’ve also seen at that same clinic and he was American. So right away, he was just like, “Well, your blood pressure is really high. We got to put you on medicine, dah, dah, dah, really quick.” That’s it. – Chamorro woman, Age 37, Washington

But it did make a difference just having people that look like you, can relate to you… More just reciprocation. So if I have something to talk about, it’s just a little bit more relevant with somebody who shares that same cultural experiences, whether it be food, what’s good to eat around here … So it just facilitates for me a more trusting, more comfortable environment. – Chamorro/Guamanian man, Age 35, Oklahoma

Many participants also described negative health care experiences due to lack of culturally competent care. As an example, participants discussed how health care providers often blamed their health issues, such as diabetes, on their weight or body type. Many participants spoke about how health care providers focused only on their weight and how losing weight would be a panacea for their health problems—often leaving participants wanting to hear more about other ways to treat chronic conditions, such as taking medication. Other examples included feeling like they were judged by a provider for using traditional practices such as using home remedies.

So the only doctor I have is an OB, and so I’m PCOS, because I’m trying to have kids, and they basically were telling me, “Oh, you just got to lose weight.” And I was like, “Oh, okay.” So I lost like 15 pounds, and I went back and I was like, “Okay, so where are we at now?” And they were like, “You need to lose more weight.” And I was like, “Okay.” – Samoan woman, Age 27, Oʻahu

I mean, I don’t want to sound racist or anything, but the White ones who don’t really understand local, you know, how we do. When we take the kids and they’re like, “Oh, the Vicks is not good for babies,” but it’s like, I’m 34 years old and I’m fine. I’ve used this my whole life. How is it going to only hurt the baby now? – Samoan/Tongan woman, 33, Oʻahu

Reasons for and Consequences of Negative Experiences

Participants attributed negative experiences to various factors, including their skin color, appearance, NHPI identity, how they spoke, and health insurance status. Some participants said they felt they were treated differently or were unable to get tests or labs they thought they needed because they have Medicaid (QUEST in Hawaiʻi) as their insurance. Some participants shared how they felt they had to be careful with their interactions in health care settings due to a fear of being perceived as aggressive or problematic. Several participants told stories about how these negative encounters with providers resulted in poorer health outcomes, reluctance to seek care, switching providers, and/or heightened emotional distress.

And so I definitely feel they treat you a little bit different when you have QUEST [Medicaid] insurance rather than somebody who pays for insurance, and so I definitely see that happening here… It’s like, “Oh, because you get it from the state, and you’re not working. You’re not paying for it,” so they just treat you differently. – Native Hawaiian woman, Age 35, Oʻahu

And this doctor was White, and I know as soon as he walked in the room, of course, he instantly judged me because I look crazy. And my husband didn’t really say a word, and I felt like he totally ignored what I said, and it was too difficult for him to take two seconds out of his time to tell the nurse, “Please swab this, and let’s culture it.” So, my husband lost his toe because of the ignorance of the doctor. So, to me, I feel it’s really bad. We were judged instantly. – Native Hawaiian woman, Age 54, Hawaiʻi

We get pushed to the side a lot. And to me personally, I felt like, is it because I have Medi-Cal [Medicaid]? Is that why I’m just being pushed to the side? It made me feel some type of way. – Samoan woman, Age 36, California

Yeah, I overheard a nurse actually complaining one time about patients having QUEST and how she pays her taxes and how we paying for their medical. I didn’t say, I thought in my own head, I was like, “Oh wow, if she only knew my kid on QUEST,” she didn’t know that… Obviously, after she said that, I didn’t want to tell her. – Native Hawaiian woman, Age 47, Hawaiʻi

They just assume when you have darker skin like, “Oh, you’re just going to be trouble. You’re just going to like this, that, or the others.” Yeah, I felt it in that and other pieces as well. – Native Hawaiian man, Age 52, Hawaiʻi

Mental Health

Overall, data show that about one quarter of NHPI adults (23%) report experiencing any mental illness in the past year, similar to their White counterparts (27%). However, research suggests that a lack of culturally sensitive screening tools that detect mental illness, coupled with structural barriers could contribute to underdiagnosis of mental illness among people of color. Moreover, NHPI people are less likely to receive mental health treatment compared with White people, with 16% of NHPI people reporting receiving treatment in the past year compared to over one in four White people (26%). Previous KFF research found that cost concerns and scheduling difficulties are major barriers to accessing mental health services across racial and ethnic groups. Consistent with these data, focus group participants identified mental health needs among their communities and discussed some of the barriers to accessing care, including stigma, limited resources, and cost.

Participants identified mental health needs and concerns in their communities, including suicide, substance use, and overdose deaths, and described longstanding stigma associated with discussing mental health needs in their communities, describing the topic as “taboo” or “swept under the rug.” Several participants, both in Hawaiʻi and on the continent, shared personal stories of themselves or family members facing mental health issues and the struggles they faced in finding quality care close to where they lived. Participants also emphasized that cultural expectations of strength, especially among men in NHPI communities, create a barrier to recognizing and seeking help for mental health concerns. Some participants noted that mental health issues are often misunderstood by elders, who sometimes tie mental illness to religious beliefs.

I think the topic of mental health awareness is neglected, and I think there’s an area for opportunity there. My biological father, he came here, he came to Hawaiʻi from Pohnpei, but unfortunately he became a victim to suicide because the mental health wasn’t there… I think the topic of mental health awareness is neglected, and I think there’s an area for opportunity there… I think that we need to come up with a way to educate our community about all these mental health sicknesses because that’s not talked about. And if it is talked about in our communities… They don’t really understand the whole idea of it. And prior to Western contact, a lot of our islands were very into spirituality. So that’s another thing that it plays a component in this mental health awareness. – Micronesian man, Age 29, Oʻahu

It’s hard, and I want to say that I found a kanaka (translation: Hawaiian) psychiatrist … and he’s so amazing, Native Hawaiian, he understands the stuff that we go through, and he helped save my life. So, I think there’s a lot of good things, behavioral health, if you can find it… Putting resources into that for our Native Hawaiian and Pacific Islander providers and mental health. It helps saves lives. – Native Hawaiian man, Age 52, Hawaiʻi

… we had this small epidemic that happened on Maui, and it was like every month you had these young boys killing themselves… And it terrified me having, one, a boy. To this day, it terrifies me to see them and some of them I know, and to just be like, “What was so bad? Or did you not have somebody to talk to?” … And I think it goes back to colonization, it goes back to all of that generational trauma that our men are feeling that in this Western world. … – Native Hawaiian woman, Age 47, Maui

Participants noted that, beyond stigma, a lack of resources for mental health support has left many—both themselves, their family members, and friends—without access to mental health care. Participants identified cost concerns and scheduling difficulties as barriers to accessing mental health services and highlighted the difficulty of finding a provider who understands their cultural background and experiences. In the Hawaiʻi groups, participants expressed uncertainty about where to seek help for mental health issues, other than calling a crisis helpline like 988. Some participants said that they felt people in their communities would be hesitant to use crisis hotlines due to stigma or a preference for in-person connections when discussing sensitive topics. In the Hawaiʻi groups, participants pointed out that there is a limited number of mental health care providers on the islands and highlighted logistical difficulties of seeing someone in person due to transportation challenges, particularly in rural areas.

I don’t know, coming from a native perspective, I don’t know if Natives can call a crisis hotline. … We need a human to share that space, I don’t know, to share their spirit, to share their breath. That’s what heals us. – Native Hawaiian woman, Age 47, Maui

One, treat us like we’re your favorite family members and open more mental health clinics because mental health gets swept under the carpet so much, but we don’t have anywhere to focus on it either. – Samoan woman, Age 36, California

… I’ve been trying to tell my PCP, “Well, I’ve been trying to get a hold of the Behavioral Health to see a new counselor and nobody ever calls me back.” So, I think that’s pretty bad. I just came out of a domestic violence situation and sometimes I need somebody to talk to. So, I think that’s pretty rough. – Native Hawaiian woman, Age 54, Nevada

Across the groups, participants discussed the efforts they are taking to increase awareness and understanding of mental health issues within their communities. In the groups, many participants shared the difficulty of conveying mental health issues to their elders and in other languages, noting for example that there are not exact translations available for some terms or conditions in their languages. One participant shared a story of the importance of trusted community leaders in bridging the communication gap between elders and younger community members with a different understanding and approach to mental health. Participants across groups discussed the ways in which they were educating older generations and working to break the cycle of stigma among the next generation by encouraging their children to be more open and communicate their mental health needs.

Yeah, mental health, I feel like it’s not talked about a lot in the Polynesian culture, because old-fashioned, how our parents are, we were told to keep our mouths shut or whatever because it brings shame to the family or whatever the case is. So now, mental health, it’s a very common thing now, because now everybody, all the Polynesians that had childhood trauma, it’s affecting them as an adult now, and now they’re able to speak up. But the majority of them are afraid to speak up, because they’re afraid to upset their old-fashioned parents and don’t want to bring shame to the family or whatever the case might be. – Samoan woman, Age 41, Utah

I think our people are having a hard time accepting the fact that all these things are real. We’re the kind of people that, we tend to think that, “Oh, nope, it’s just faalii (translation: annoyance in Samoan).” When the child is acting up and then we automatically say they’re throwing a temper tantrum or without even knowing that they’re going through something and there’s imbalance with something. It’s either with their thought process or… So, I think acceptance should be the first thing with our people. We need to know that this is real, the feelings and the mental health are real… It’s the same thing with mental health. We don’t think it’s real. We just sugar coat stuff and shove it under the carpet, but once we have acceptance that it’s real, now we can have conversation – Samoan man, Age 41, Alaska

I think especially for men and especially for boys, it is really, really hard to talk about not being okay… I mean, their generation, a lot of them are struggling and they don’t know how to talk about it. So I feel like if we make it less taboo, maybe that’s not so much a cultural thing. But for me, I think that it’s normal to talk about depression and anxiety. I think that we have to start normalizing it because they experience stuff that – Samoan woman, Age 41, Oregon

I have a cousin who recently got diagnosed with schizophrenia and I think he was in critical condition… and there’s no term for schizophrenia in Chuukese… If you tell somebody in our Chuukese community that you’re hearing voices in your head, they’re going to tie that into, there’s a demonic force following you around or you need to go to the church more because there’s demons in your house or something like that… I contacted one of our community leaders … and I asked her, how do I explain schizophrenia in Chuukese because I need to call our aunties and tell them what’s going on with my cousin… So she explained to me how to, there’s no word for it, but she explained how I can interpret the symptoms… then I immediately called up our aunties to explain that to them and they had no clue what was going on. So that’s a lucky thing. That’s a success story for us because we were able to get him help and he is able to get medications now and I think he’s stable. – Micronesian man, Age 29, Oʻahu

Well, in my family, we just talk. I teach my kids, “There’s nothing you can’t tell me.” Always try to approach it with being open. So, it is hard because we have a big ʻohana (translation: family), so my mom, my brother, me, my kids, we all live in the same household… I had a hard time talking to my mom, and she had a hard time talking to her mom, and so I didn’t want that for my kids. I tried to break that cycle where I was open. I told them, “You want to ask me anything?” I always ask them, “How are you feeling?” I always tried not to put a stigma on how you’re feeling. – Native Hawaiian woman, Age 47, Maui

Social Support Networks and Connection to Culture

Participants described varying levels of feelings of connection to their culture and levels of social support, which, in part, reflected where they live. Participants in the Hawaiʻi groups largely said they felt connected to their communities and emphasized connections to the land, food, ocean, and family members living nearby. However, in the continent groups, many participants said they felt disconnected from their culture, especially those who did not live in areas where other Pacific Islanders live. Some participants spoke about how there were fewer opportunities to be connected to their culture living away from the islands, but some also identified ways they maintained connections, including through churches, extended family, sports, and community groups and organizations. In the groups both in Hawaiʻi and on the continent, some participants discussed enrolling in classes on topics like Hawaiian language or hula to learn more about their culture and maintain cultural knowledge and traditions. Across the groups, many participants discussed concerns about passing on their culture and heritage to their children, especially when they felt geographically disconnected from their community. Some participants living in areas without a large Pacific Islander community discussed the importance connecting with other racial and ethnic groups (such as with Black adults or American Indian adults) in creating a sense of belonging.

And I do attend church every Sunday, and church is a big part of our life, especially the Samoan church, but that’s how I stay connected. – Native Hawaiian woman, Age 38, California

After we left Hawaiʻi, it just wasn’t as significantly a part of our life as I wish it had been, and then when my parents split, it was even less then. I was really separated from all of my Samoan family. So I miss that. I miss a lot of that. Some of my happiest memories from my childhood are when I was surrounded by my family, just more familiar with the language and more familiar with the practices. But we all have such a cultural disconnect. A lot of us feel like a lot of hesitation because we don’t speak the language, we don’t understand the practices or what does that entail, what would we have to do? – Samoan woman, Age 41, Oregon

So I’m over here taking online classes for ʻōlelo (translation: Hawaiian language) just so I can raise my son and expose him to it, because my father’s already passed, and so with him being a kumu hula (translation: Hawaiian dance instructor), I grew up very involved in the culture, and I feel like I can only provide so much, because I’m not a kumu hula… That’s where a lot of the history came from that I was taught, and I want my son to be involved, but, like I said, the access is very limited for those of, I would say, Pacific Islander Polynesian descent. – Native Hawaiian woman, Age 43, Washington

Recommendations to Improve Care

Participants offered several suggestions to improve health care experiences in their communities. In Hawaiʻi, many participants emphasized the importance of recruiting and training doctors from the islands, highlighting the value of having providers who are part of the local community. In the groups on the continent, participants discussed the importance of cultural competency training for health care providers and efforts to increase the racial diversity of providers. Participants also expressed support for integrating traditional practices with Western medicine to facilitate a more holistic approach to care. Participants suggested that more education on how to navigate the health care and health insurance systems within their communities could help improve access to care. Participants also said they would like to see health care services become more centralized to help alleviate the logistical burden of seeking specialized care.  They also emphasized that increased availability and quality of interpreter services for people with limited English proficiency is important for increasing access to care as well as improve health care experiences.

My magic wand would be recommending that cultural intelligence communications class be mandatory for medical personnel’s education. – Native Hawaiian woman, Age 43, Washington

If the doctor wasn’t from here or the providers aren’t from here to take a culture class on getting used to the culture here so they can be better practitioners. I’ve had experiences where the bedside manner of providers are fantastic. And it ranges, it doesn’t matter the race. And then it ranges all the way to completely awful. – Samoan man, Age 37, Hawaiʻi

More Micronesian staff, more Micronesian nurses and doctors so that they can help be the liaison for all of this complex information that’s being communicated to the patients and their families. – Micronesian man, Age 29, Oʻahu

Well, one thing I would address is more opportunity for doctor’s appointments. Because there’s so many patients and not enough space. I was supposed to see a specialist for my hearing and she said, “Well, we’re already booked out to May of 2025.” – Native Hawaiian woman, Age 54, Nevada

Methodology

For this project, seven focus groups were conducted between June-August 2024 virtually among a total of 45 adults who self-identified as having a Native Hawaiian or Pacific Islander (NHPI) background. Three groups (Native Hawaiian, Samoan, Marshallese/Micronesian adults) were conducted among participants living in Hawaiʻi. Participants lived on the islands of Hawaiʻi, Maui, Oʻahu, and Kauaʻi (outreach to adults living on all islands was conducted). In the continental U.S., four groups were conducted among adults who identified as NHPI living in (1) California, (2) Pacific Northwest (AK, WA, NV, UT), (3) Washington or Oregon, and (4) other states in the continental U.S. Groups were mixed gender, lasted between 90 minutes and two hours, and were conducted in English with 5-8 participants each.

For each group, participants were chosen based on the following criteria: Must be at least 18 years of age and self-identify as having an NHPI background. Groups included multiracial (“in combination”) and single-race (“alone”) adults of Native Hawaiian or Pacific Islander ethnicity who indicated that their ethnicity was “extremely” or “very” important to how they think about themselves. All participants said they had seen a health care provider within the past three years. In addition, groups were chosen to represent a mix of household composition, including at least some participants who are parents; a mix of health statuses, including those living with a chronic condition; a mix of household income levels, with a preference for recruiting lower income participants; and a mix of health insurance types.

PerryUndem recruited the focus groups and Ward Research hosted the focus groups, using NHPI moderators who live in Hawaiʻi. The screener questionnaire and discussion guides were developed by researchers at KFF in consultation with the firms who recruited and hosted the groups as well as community representatives from Association of Asian Pacific Community Health Organizations, the National Association of Pasifika Organizations, and Papa Ola Lokahi. Groups were audio and video recorded with participants’ permission. Each participant was given an incentive between $100-$175 after participating.

Participant Characteristics
NHPI Identity Number
Native Hawaiian17
Samoan17
Tongan3
Micronesian6
Marshallese2
Chamorro3
Fijian1
Note: Values exceed number of total participants because some participants identified with multiple NHPI backgrounds.
Gender 
Men17
Woman26
Other2
Age
18-299
30-4925
50-6410
65+1
Insurance Type
Private22
Medicaid19
Uninsured3
Medicare1
States 
Hawaiʻi21
California6
Washington6
Oregon2
Nevada2
Utah2
Alaska1
Ohio1
Oklahoma1
Illinois1
Arizona1
New Mexico1


Endnotes

  1. All groups were all conducted in English, so while we heard about some of these problems related to family members, the challenges are likely even more pronounced among those who themselves lack English proficiency. ↩︎

Key Data on Health and Health Care for Native Hawaiian or Pacific Islander People

Published: Dec 3, 2024

Introduction

Native Hawaiian or Pacific Islander (NHPI) people experience substantial and enduring disparities in health and health care. These, in part, reflect specific challenges in accessing health care such as geographic isolation, economic challenges, and limited availability of culturally appropriate care. Furthermore, NHPI communities are often excluded from data and analysis due to their smaller population sizes. This limits the visibility and understanding of their health outcomes and experiences accessing health care, impeding efforts to address their health care needs and eliminate disparities.

Given the importance of increasing the understanding of experiences among these groups as part of advancing equity, this brief provides an overview of NHPI experiences across key measures of health, health access, and social and economic factors that influence health. It is based on KFF analysis of data from multiple datasets including the 2018-2022 American Community Survey, the 2022 Behavioral Risk Factor Surveillance System, and the Centers for Disease Control and Prevention (CDC) WONDER online database. This report also incorporates analysis from Key Data on Health and Health Care by Race and Ethnicity, which examines how people of color fare compared to White people across 64 measures of health, health care, and social determinants of health. Racial and ethnic groupings for each measure vary depending on the data source. Data reported by ethnic identity are limited to people who identify as NHPI alone. Data reported for the continental U.S. refers to the 48 contiguous states, District of Columbia (DC), and Alaska. Data for many health outcome measures are not available by ethnic subgroup. Data are limited to NHPI people residing within the 50 states and DC1 .

Key takeaways include:

NHPI people represent people from diverse backgrounds. The majority of NHPI people identify with more than one race and ethnicity. NHPI people have ethnic origins tracing back to several islands in the Pacific Ocean that have varying relationships with the U.S. Among NHPI people residing in the 50 states and DC, most live in Hawaii and California.

NHPI people fare worse than White people across the majority of examined measures of health, health care, and social determinants of health. Reflective of lower rates of private coverage, NHPI (9%) people under age 65 are somewhat more likely to be uninsured than White people (7%). Roughly a quarter of NHPI adults (24%) under age 65 report not having a personal provider compared to 17% of White adults. Additionally, similar shares of NHPI adults (20%) report fair or poor health status as White adults (16%). NHPI people have higher birth risks and worse birth outcomes compared to White people. This may in part reflect limited access to prenatal care, as NHPI women (22%) are over four times more likely to receive late or no prenatal care than White women (5%). NHPI people also have higher rates of pregnancy-related mortality (62.8 per 100,000) and infant mortality (8.5 per 100,000) compared to their White counterparts (14.1 per 100,000 and 4.5 per 100,000, respectively). Although the majority of NHPI people under age 65 are in working families, they have higher rates of poverty than White people (15% vs. 10%). Roughly half of NHPI people (54%) own a home compared to about three quarters of their White counterparts (76%). NHPI people have similar or better health outcomes compared to White people across a few health measures. NHPI people (both at 20%) have a similar likelihood of reporting fair or poor health and 14+ mentally unhealthy days compared to White people (16% and 15%, respectively). NHPI adults (6%) are less likely to have a heart attack or heart disease than White people (8%) yet have similar rates of heart disease-related mortality (173.2 per 100,000 vs. 173.1 per 100,000, respectively).

Among NHPI people, there is significant variation in key factors that influence health, including health coverage, income, and homeownership, with Marshallese people faring the worst across all examined measures. Among NHPI people under age 65, uninsured rates range from less than one in ten of Chamorro (8%), Samoan (9%), and Native Hawaiian (9%) people to nearly one in four (24%) Marshallese people. Homeownership rates also vary from roughly two-thirds of Fijian people (65%) to 14% of Marshallese people.

Data gaps prevent the ability to fully identify and understand health disparities for NHPI people. Data are insufficient or not disaggregated for NHPI people for many health and health care measures. Among available data, NHPI people fare worse than White people for the majority of measures. For some measures there is no significant difference, but this sometimes may reflect the smaller sample size for NHPI people in many datasets, which limits the power to detect statistically significant differences.

These data highlight the importance of continued efforts to address disparities in health and health care for NHPI people in ways that account for the diversity of the population and their experiences. Continued efforts to increase the availability of disaggregated data for NHPI people overall and by ethnicity, such as oversampling to generate adequate sample sizes to produce reliable estimates and changes to the collection and reporting of data on race and ethnicity, will also be important for improving the ability to identify and understand the disparities they face and assessing the impact of interventions to address them.

Overview of NHPI People in the U.S.

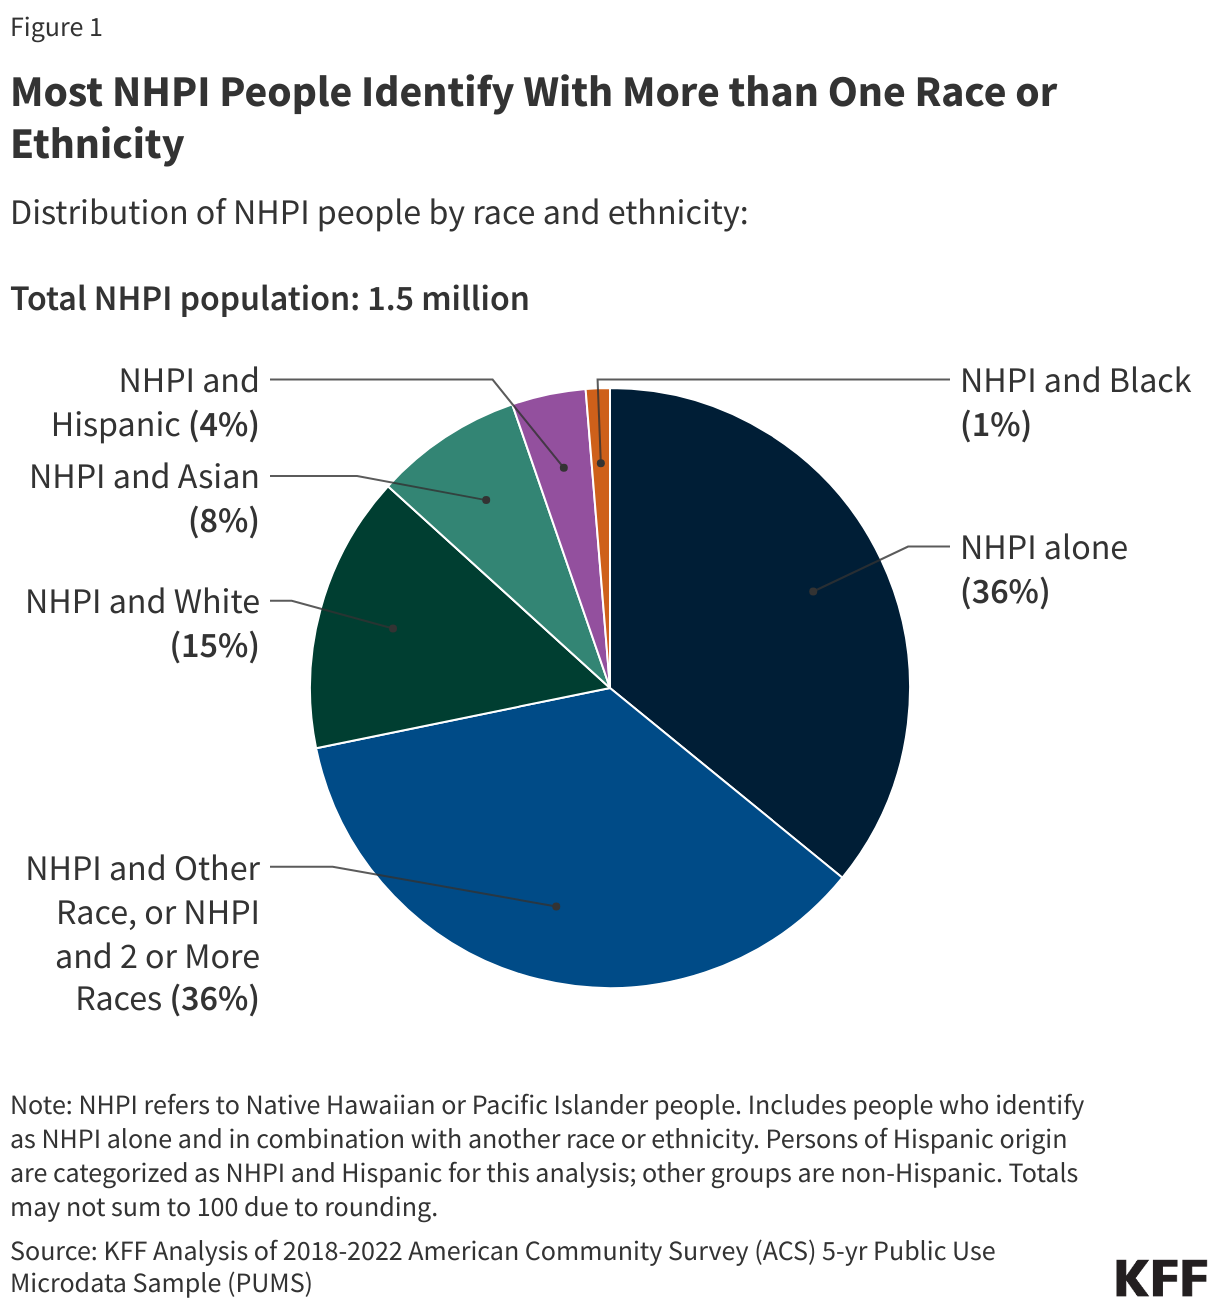
The NHPI population has grown and become more diverse over time. As of 2022, there were roughly 1.5 million people in the U.S. who identify as NHPI alone or in combination with another racial or ethnic group. The majority of NHPI people identify as NHPI and at least one other race, while just about one in three NHPI people identify as NHPI alone (36%) (Figure 1).

Most NHPI People Identify With More than One Race or Ethnicity

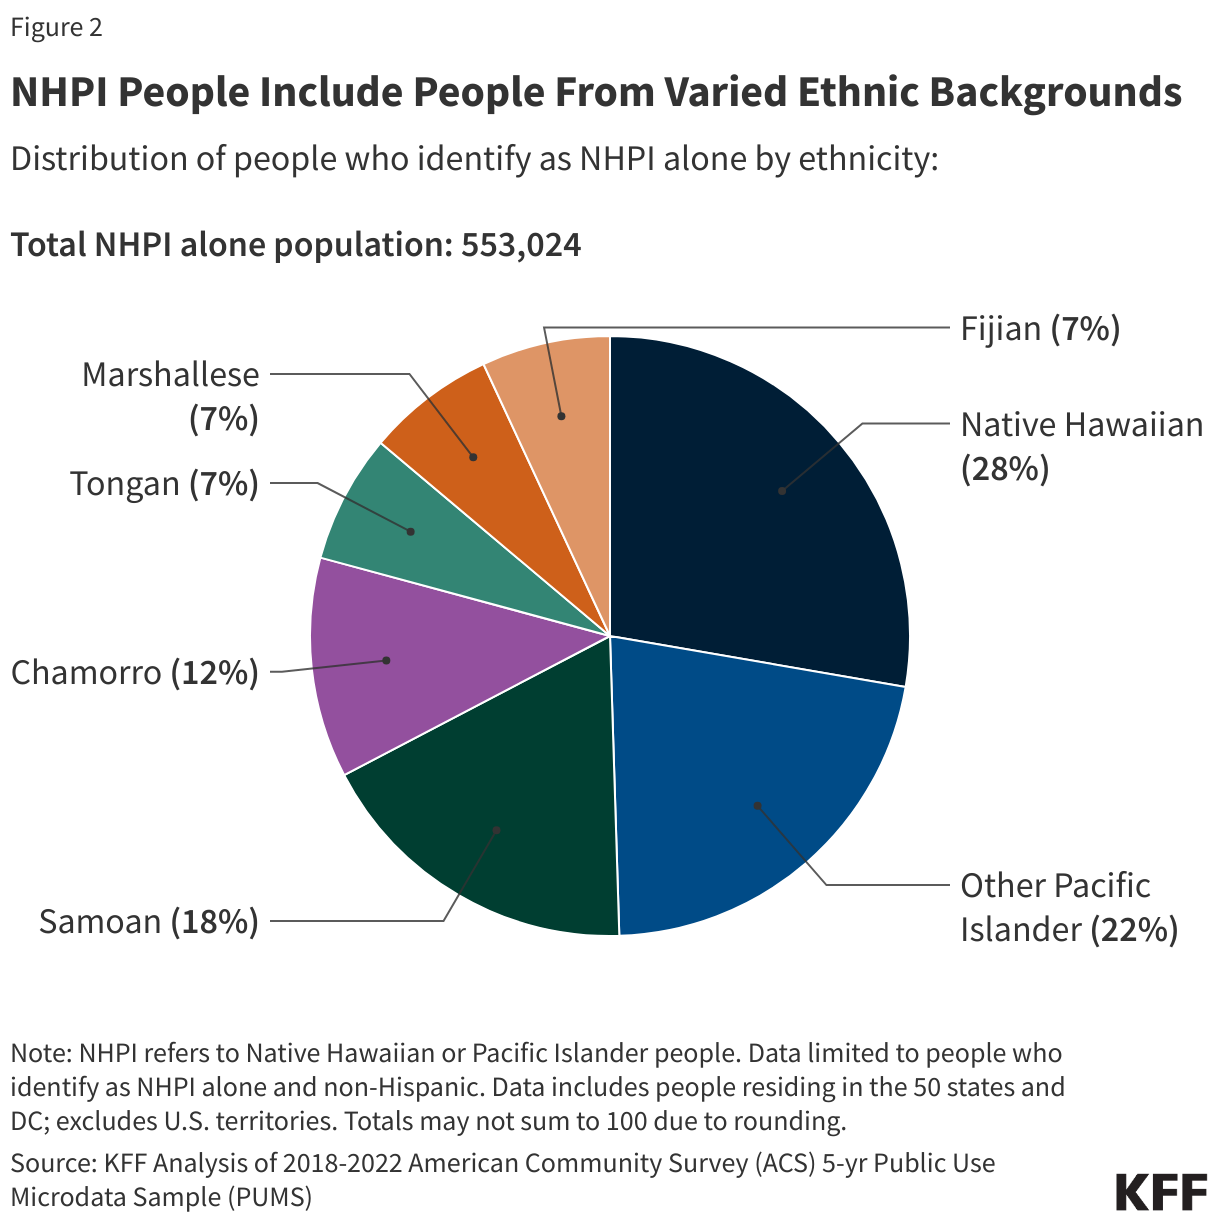
NHPI people trace their family origins to several islands in the Pacific Ocean with varying relationships with the U.S. Among people who identify as NHPI alone, 28% are Native Hawaiian. About one in five (18%) are Samoan, about one in eight are Chamorro (12%), and less than one in ten identify as Fijian (7%), Tongan (7%), or Marshallese (7%) (Figure 2). The remaining 22% identify as one of the remaining other Pacific Islander groups, including Palauan, Tahitian, Chuukese, Pohnpeian, Yapese, and other groups.

NHPI People Include People From Varied Ethnic Backgrounds

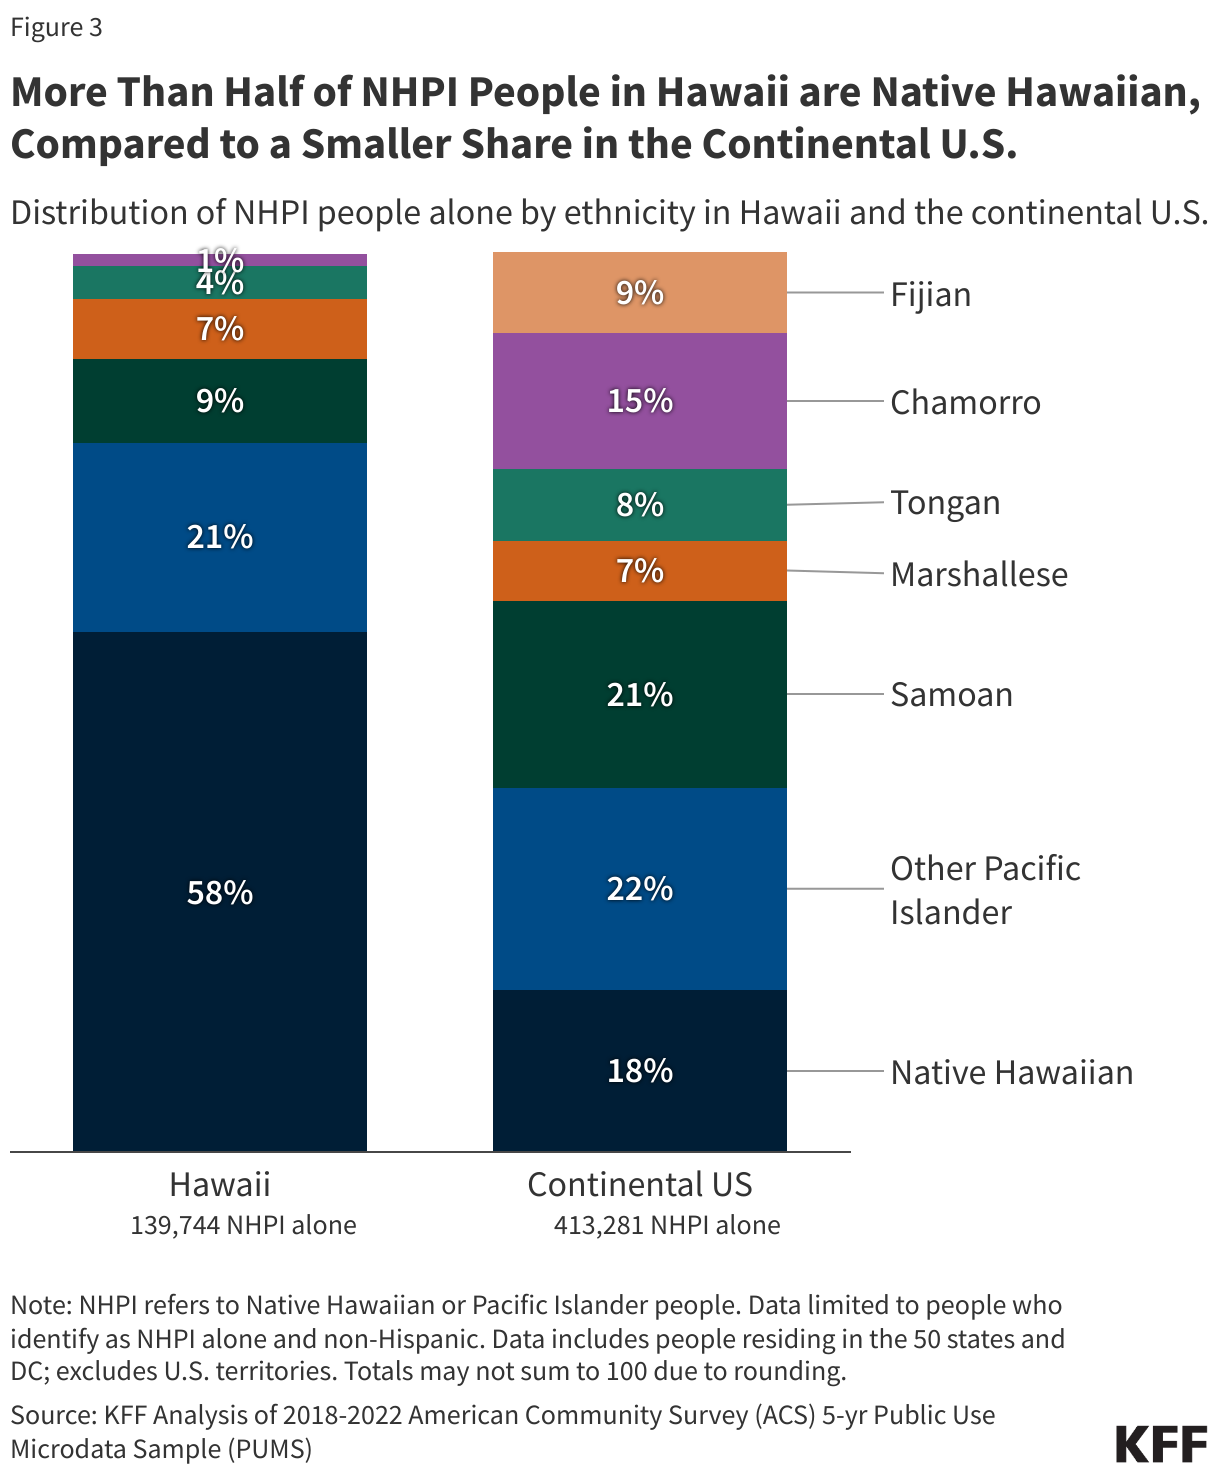
There is significant variation in the ethnic identity among NHPI people living in Hawaii compared to the continental U.S. Not surprisingly, among those who identify as NHPI alone, the majority of those residing in Hawaii are Native Hawaiian (58%), while ethnic identity is more mixed among those living in the continental U.S. (Figure 3).

More Than Half of NHPI People in Hawaii are Native Hawaiian, Compared to a Smaller Share in the Continental U.S.

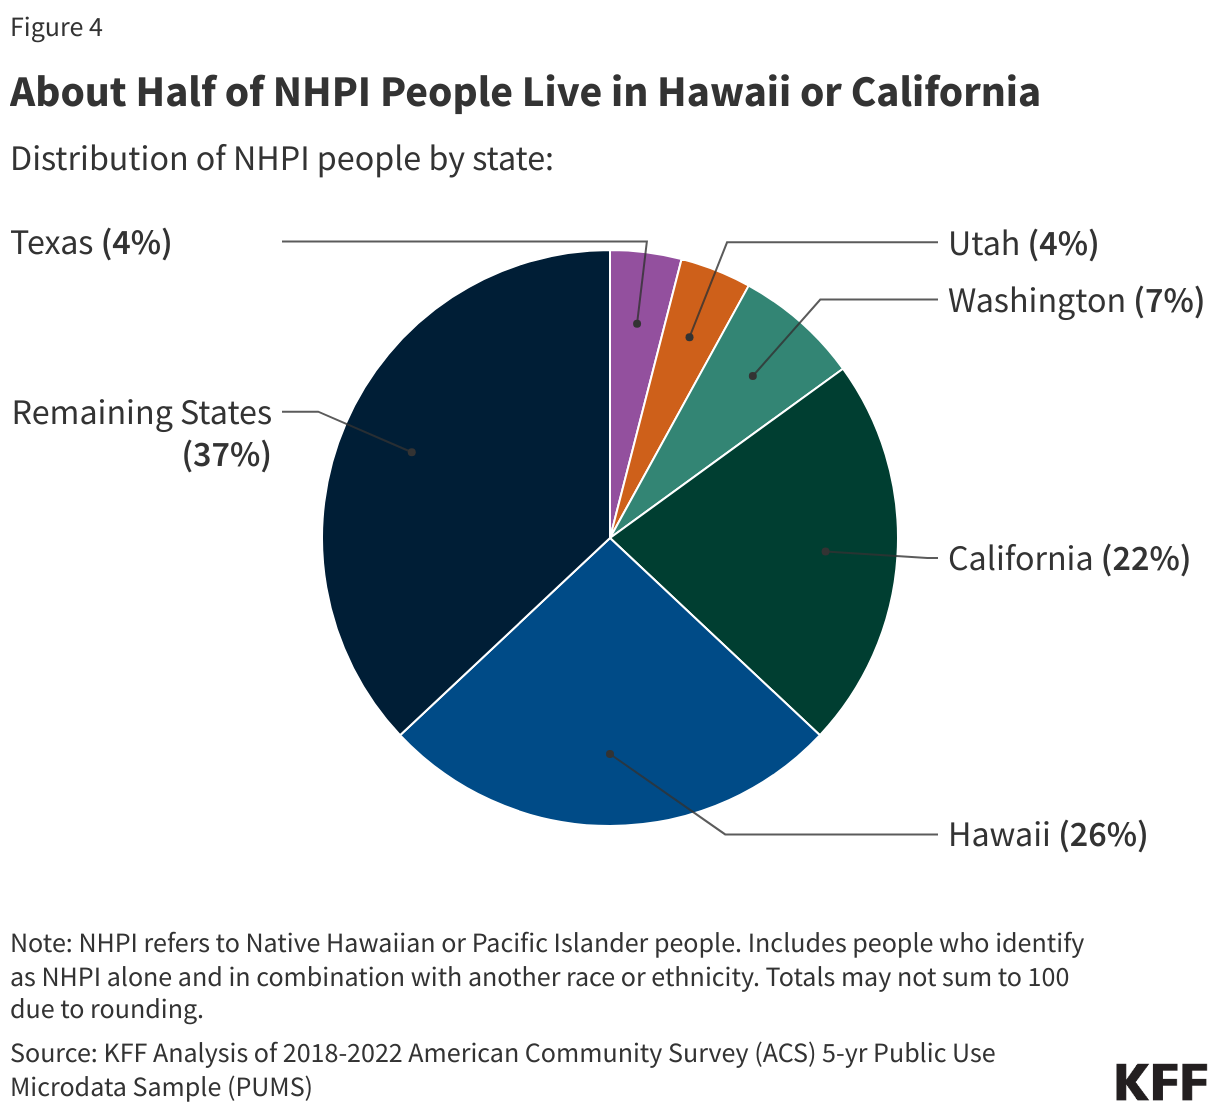
Among NHPI people (alone or in combination with another race or ethnicity) living within the 50 states and DC, nearly half reside in Hawaii (26%) and California (22%) alone (Figure 4). Washington state (7%) accounts for the next largest share of NHPI people in the U.S., followed by Utah (4%) and Texas (4%). Many NHPI people also reside in their homelands and across the U.S. territories of Guam, Samoa, the Commonwealth of the Northern Mariana Islands, and the Freely Associated States (FAS) that include the Federated States of Micronesia, the Republic of the Marshall Islands, and the Republic of Palau. However, data for NHPI people living in the territories and FAS are limited and not reflected in this analysis.

About Half of NHPI People Live in Hawaii or California

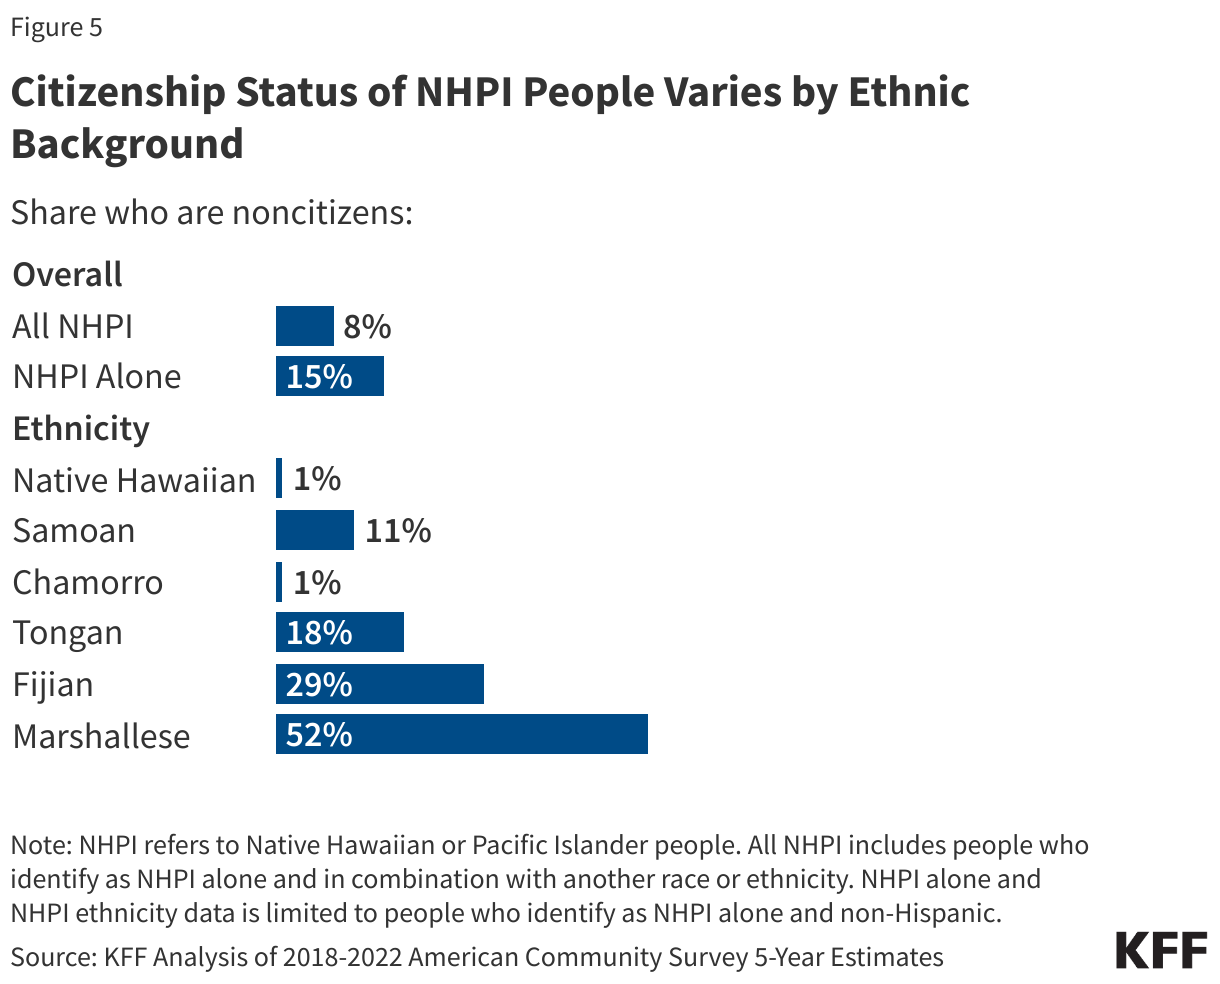
Most NHPI people (92%) living in the U.S. are. citizens, however, citizenship status varies among NHPI ethnic groups, reflecting differences in birth citizenship rights across locations to which they trace their origins. Specifically, people born in Hawaii and the U.S. territories of Guam (Chamorro people), and Northern Mariana Islands are U.S. citizens by birth. People born in the U.S. territory of American Samoa are not granted citizenship but are considered U.S. nationals. People born in the FAS, which are part of the Compact of Free Association with the U.S., are not conferred U.S. citizenship at birth, but are guaranteed the right to live, work, and access health care in the U.S. Other Pacific Islands are independent nations and therefore people born in these countries are not provided U.S. citizenship at birth. Reflecting these differences, among NHPI people living in the U.S., Native Hawaiian and Chamorro people have small shares of noncitizens (both at 1%). A larger share of Samoan (11%), Tongan (18%), and Fijian (29%) people are noncitizens, while more than half (52%) of Marshallese people are noncitizens (Figure 5).

Citizenship Status of NHPI People Varies by Ethnic Background

(Back to top)

Health Coverage, Access, and Use

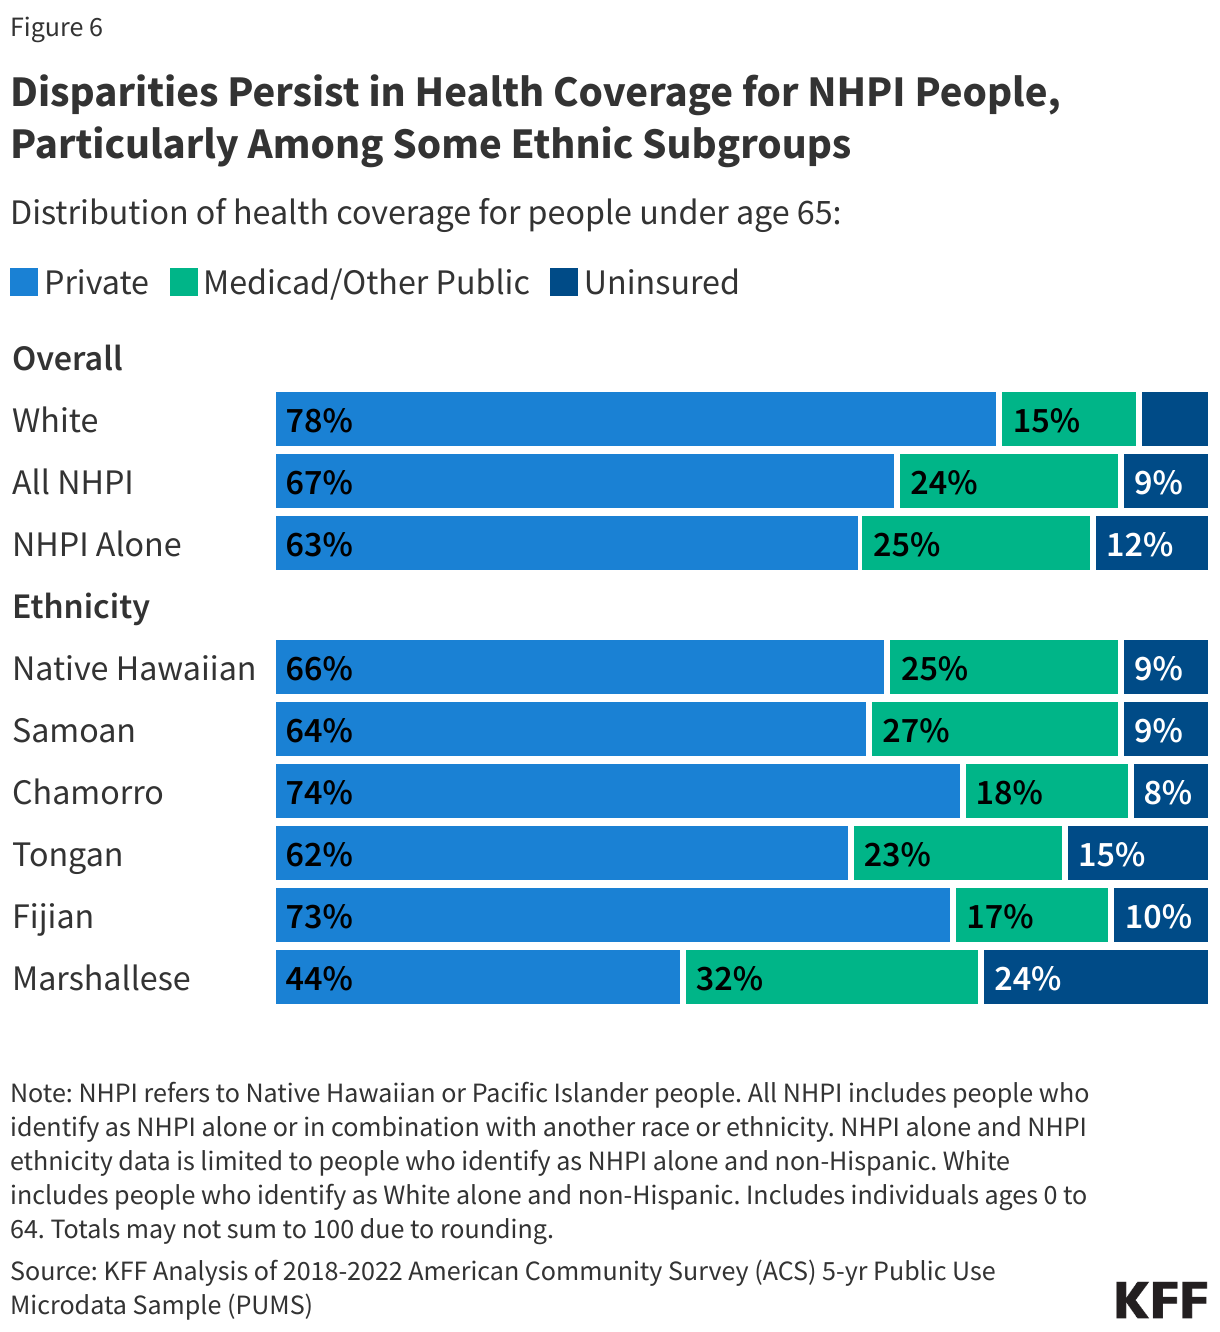
Overall, uninsured rates among NHPI people under age 65 are somewhat higher than uninsured rates among their White counterparts (9% vs. 7%) (Figure 6). This reflects lower rates of private coverage (67%) compared to White people (78%). Public coverage helps fill but does not fully offset this gap. Among people under age 65 who identify as NHPI alone, uninsured rates vary by ethnicity, ranging from about one in ten Chamorro (8%), Samoan (9%), Native Hawaiian (9%), and Fijian people (10%) to about one in seven (15%) Tongan people and about one quarter (24%) of Marshallese people.

Disparities Persist in Health Coverage for NHPI People, Particularly Among Some Ethnic Subgroups

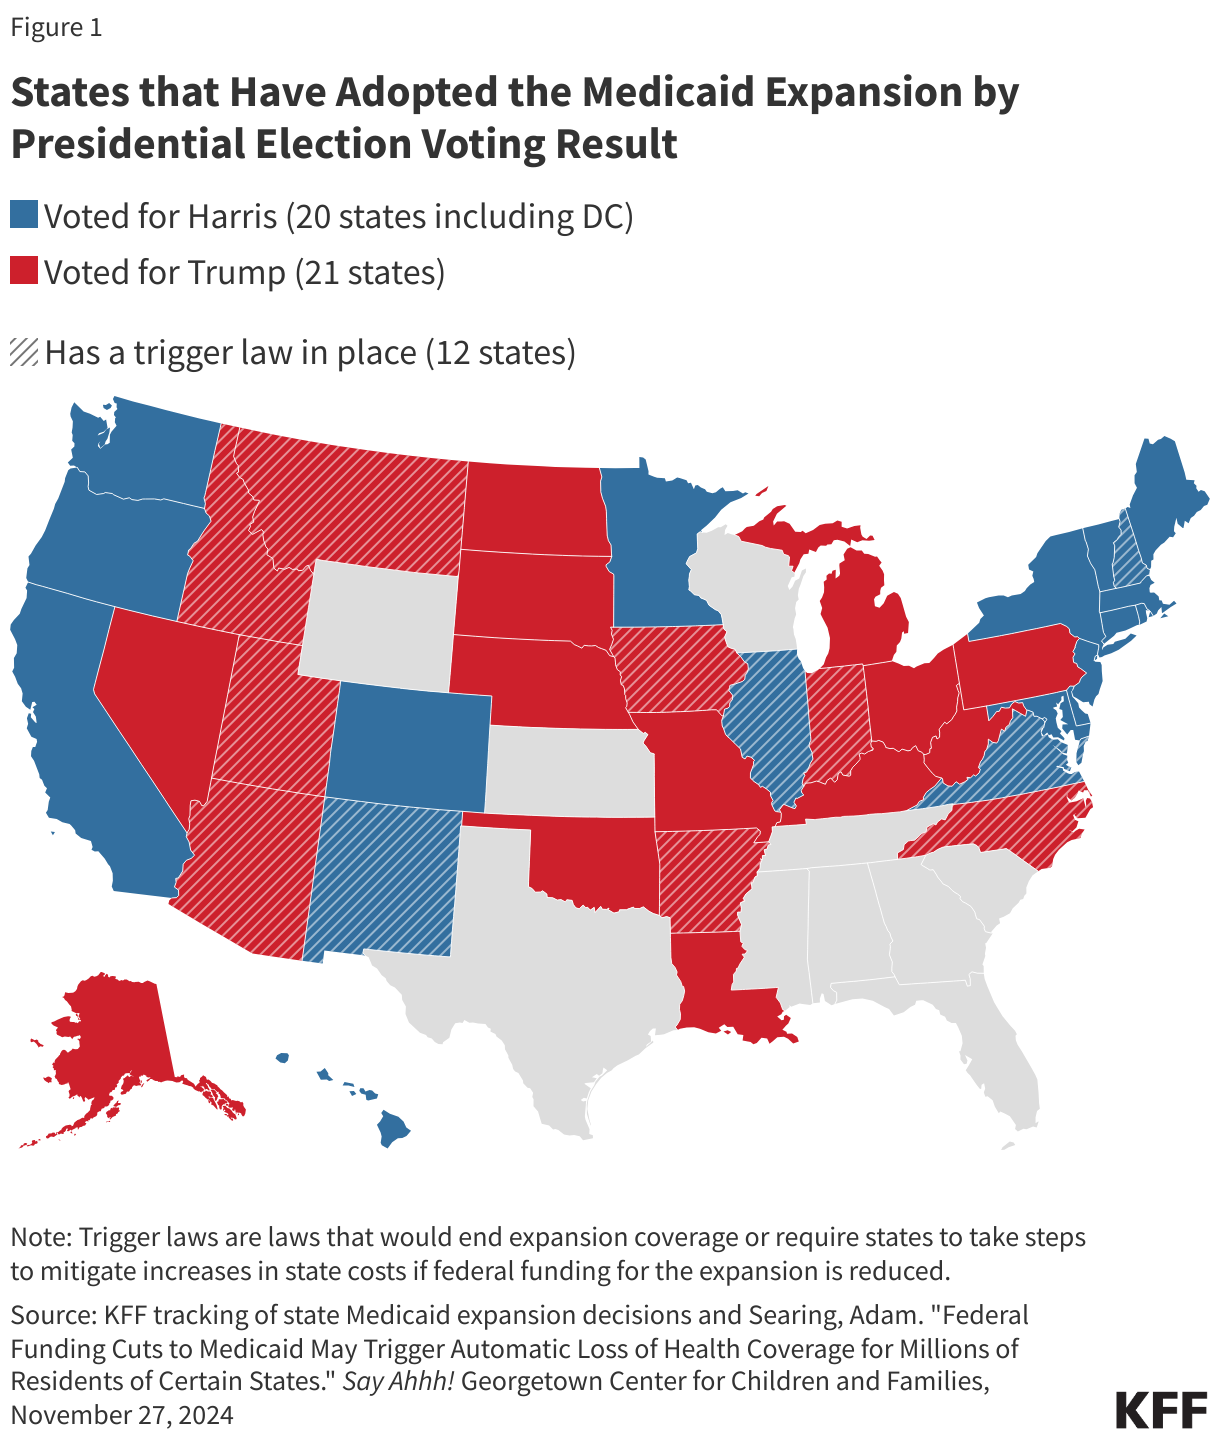
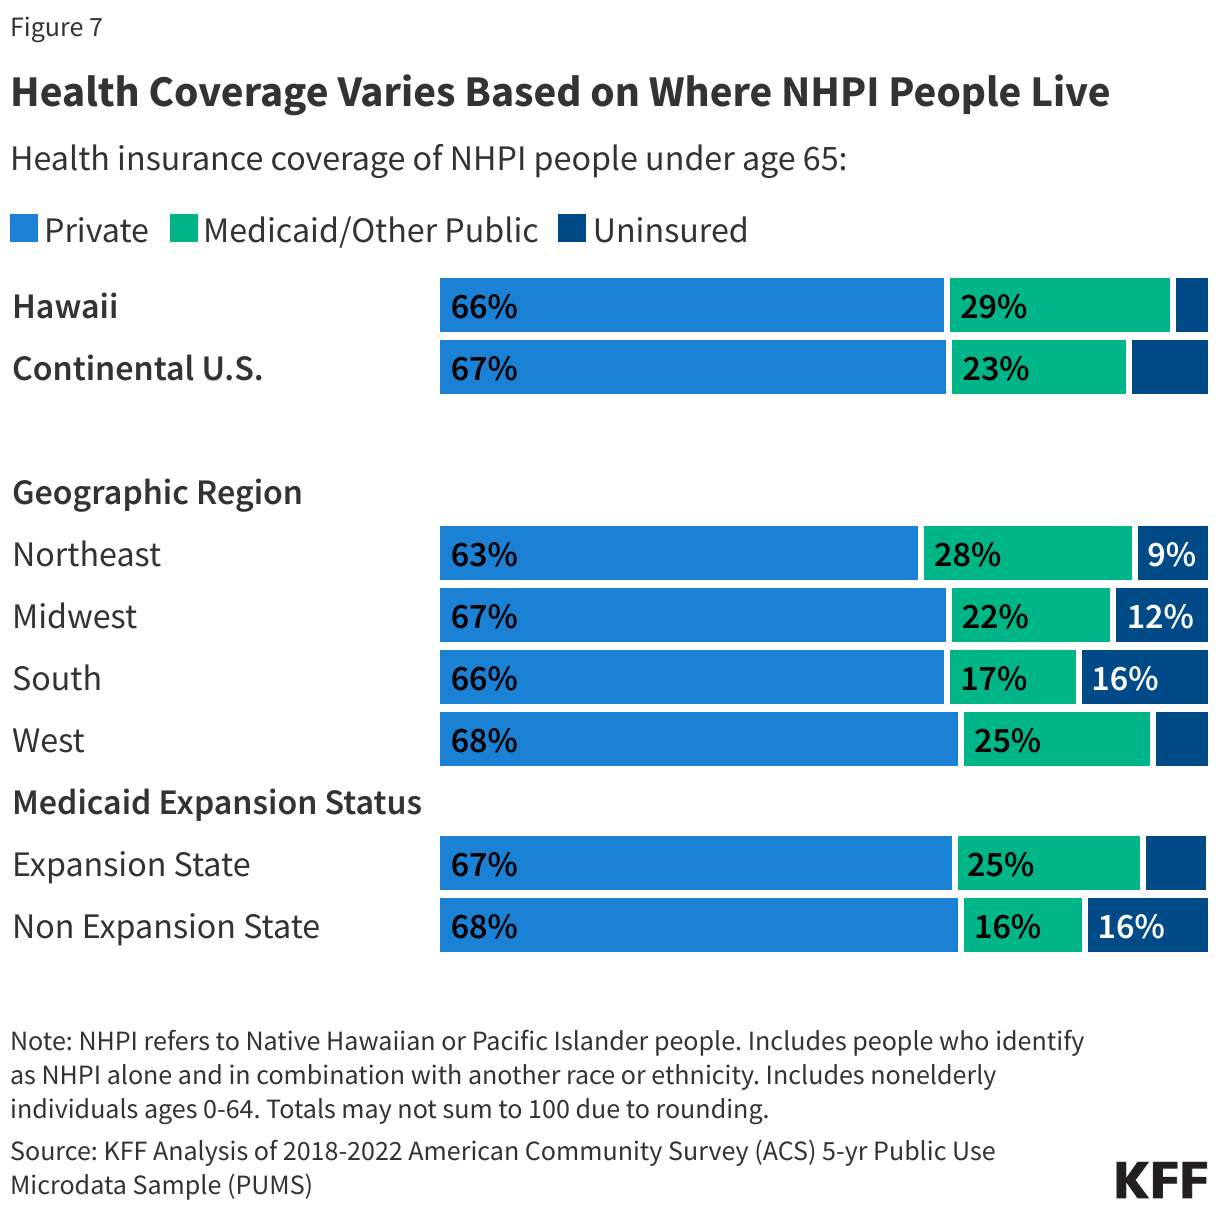
Health coverage patterns also vary based on where NHPI people live. The uninsured rate for NHPI people living in Hawaii is about half that of those living in the continental U.S. (4% vs. 10%). This pattern is largely driven by more expansive Medicaid coverage, reflecting the state’s adoption of the Affordable Care Act (ACA) Medicaid expansion for low-income adults and other eligibility expansions. Hawaii also has a longstanding mandate for employers to offer health insurance to eligible employees which facilitates access to private coverage. Uninsured rates also vary across geographic regions, ranging from 7% in the Western U.S. to 16% in the Southern U.S. These geographic patterns in part reflect differences in Medicaid expansion status among states. Many of the remaining states that have not yet adopted the ACA expansion to low-income adults are in the South. NHPI people under age 65 living in non-expansion states are twice as likely to be uninsured as those in expansion states (16% vs. 8%) (Figure 7).

Health Coverage Varies Based on Where NHPI People Live

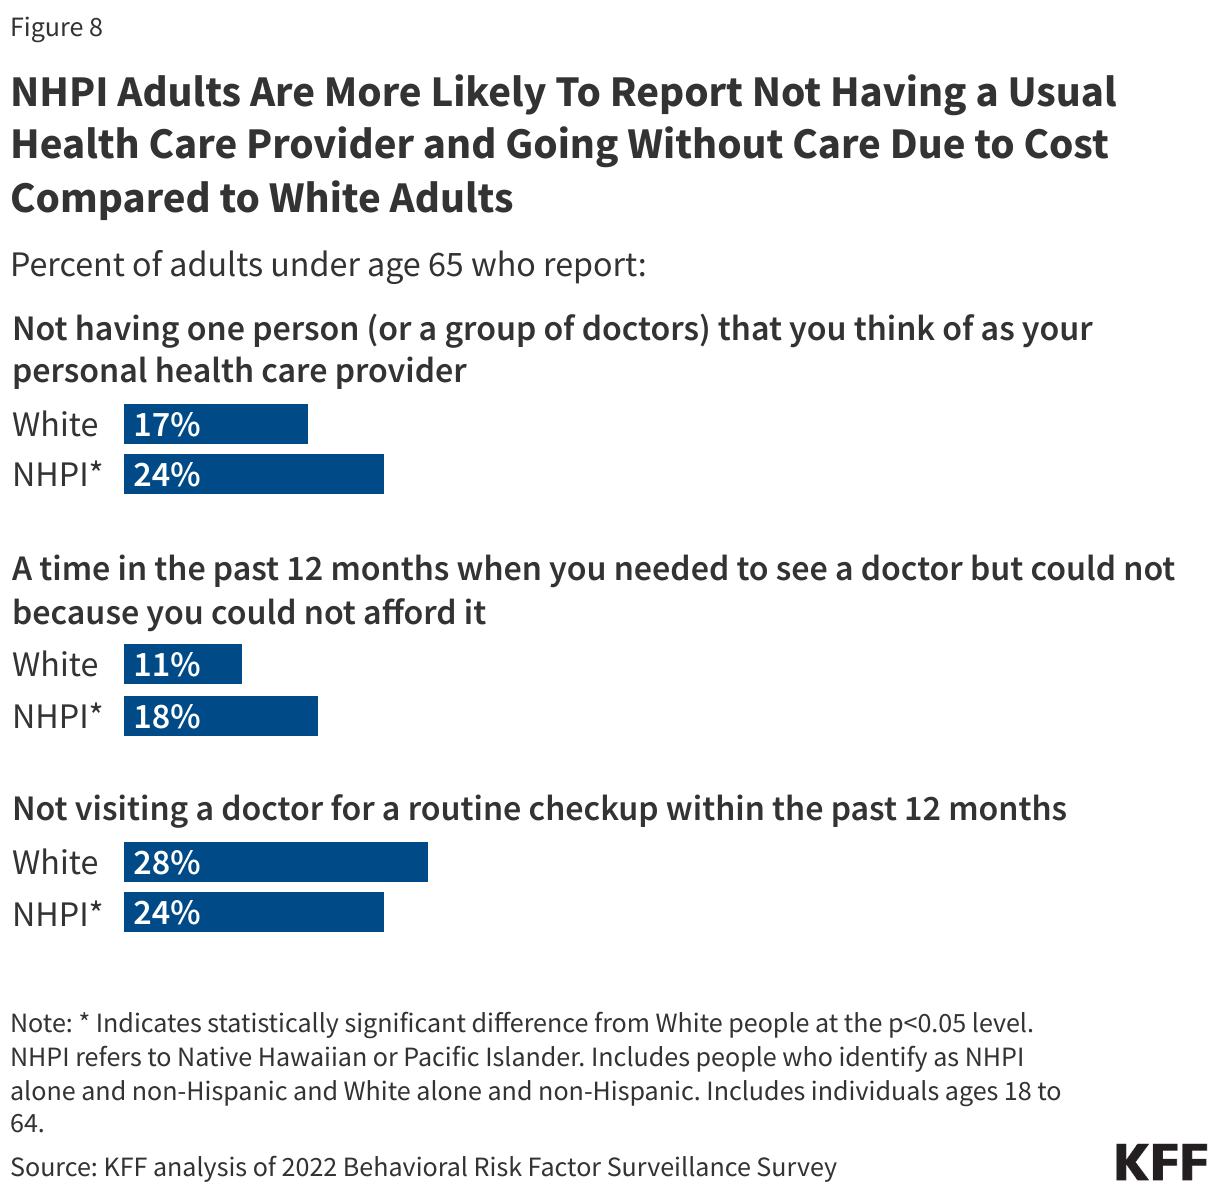
NHPI adults are more likely to report not having a usual doctor or provider or going without care due to cost than White adults but are less likely to say they went without an annual check-up. About a quarter of NHPI adults (24%) under age 65 report not having a personal provider compared to 17% of White adults (Figure 8). NHPI adults (18%) also are more likely to report not seeing a provider due to cost compared to 11% of White adults. However, NHPI adults are less likely to say they went without a routine checkup in the past 12 months than White adults (24% vs. 28%).

NHPI Adults Are More Likely To Report Not Having a Usual Health Care Provider and Going Without Care Due to Cost Compared to White Adults

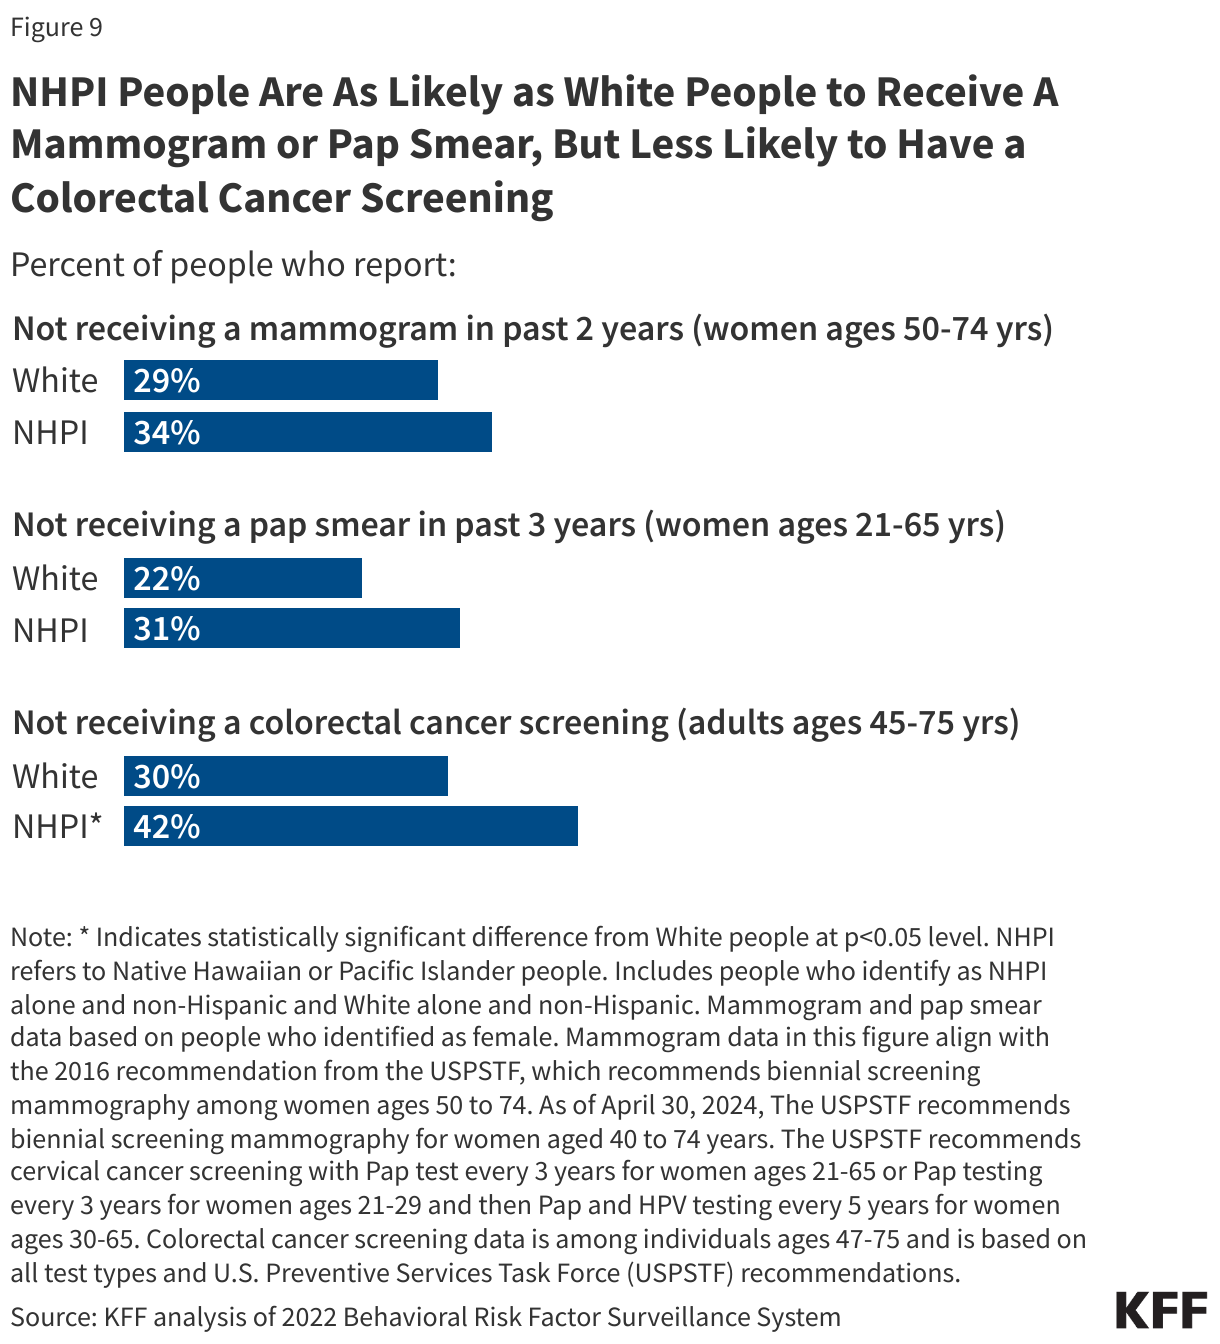
NHPI people are more likely to report going without colorectal cancer screening compared to White people but are as likely to receive a mammogram or pap smear. Among those recommended for colorectal cancer screening, about four in ten (42%) NHPI people did not receive a colorectal cancer screening compared to about three in ten (30%) White people (Figure 9). As of 2022, among women ages 50-74 (the age group recommended for screening for breast cancer prior to updates in 2024, which lowered the starting age to 40), the share of NHPI women (34%) who did not receive a mammogram in the past two years was not significantly different from the share of White women (29%). Similarly, the difference in the share of NHPI women (31%) ages 21 to 65 years (the age group recommended for screening for cervical cancer) who did not receive a pap smear was not significantly different from their White counterparts (22%).

NHPI People Are As Likely as White People to Receive A Mammogram or Pap Smear, But Less Likely to Have a Colorectal Cancer Screening

(Back to top)

Health Outcomes of NHPI People

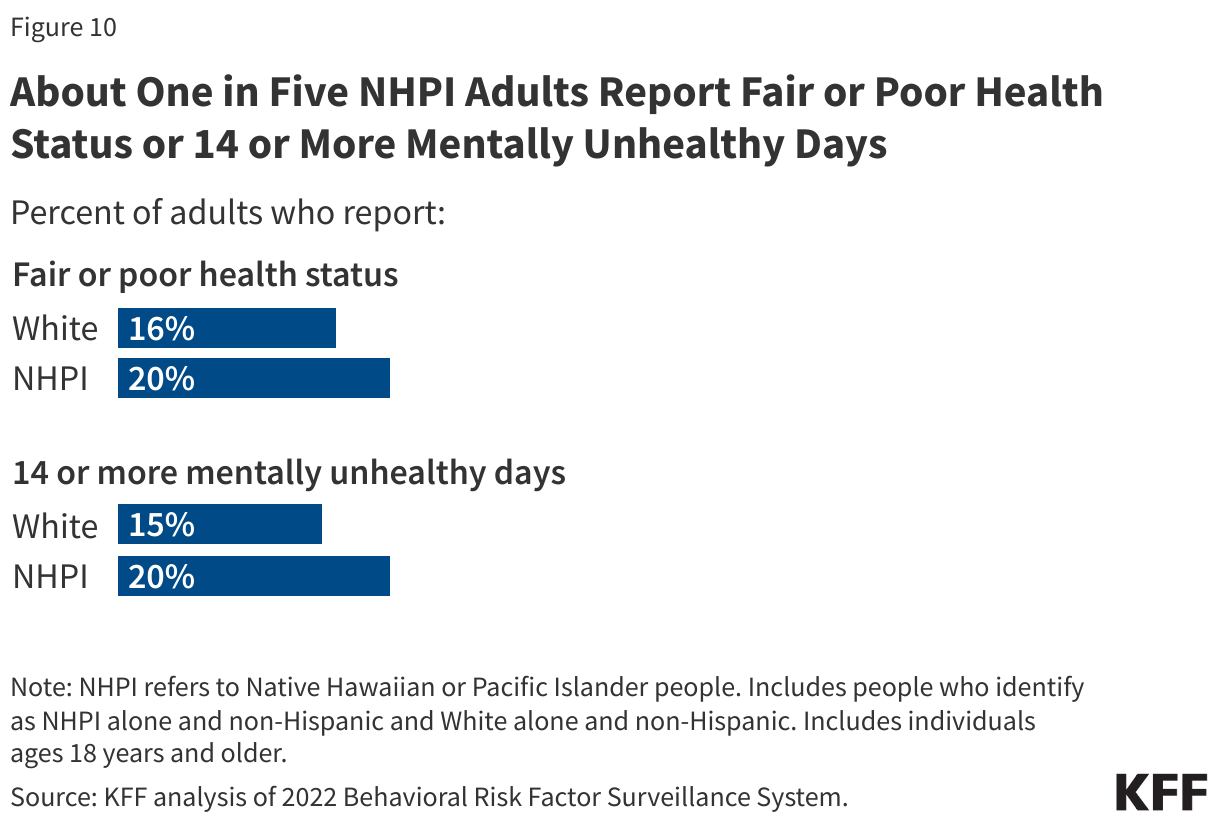
One in five NHPI adults report fair or poor health status (20%) and having 14+ mentally unhealthy days (20%), which are similar to the rates for White people (Figure 10).

About One in Five NHPI Adults Report Fair or Poor Health Status or 14 or More Mentally Unhealthy Days

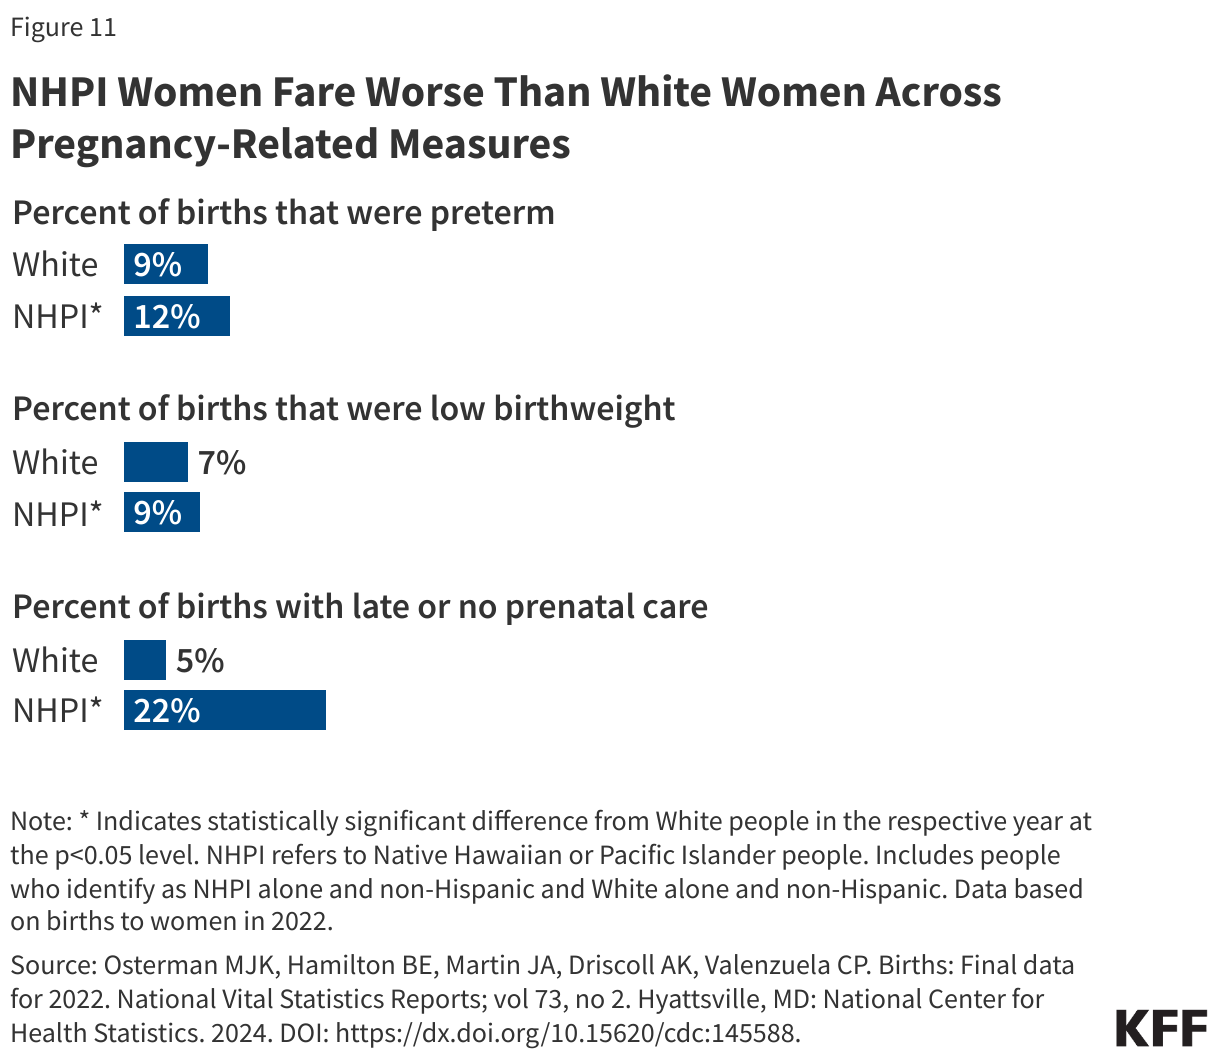
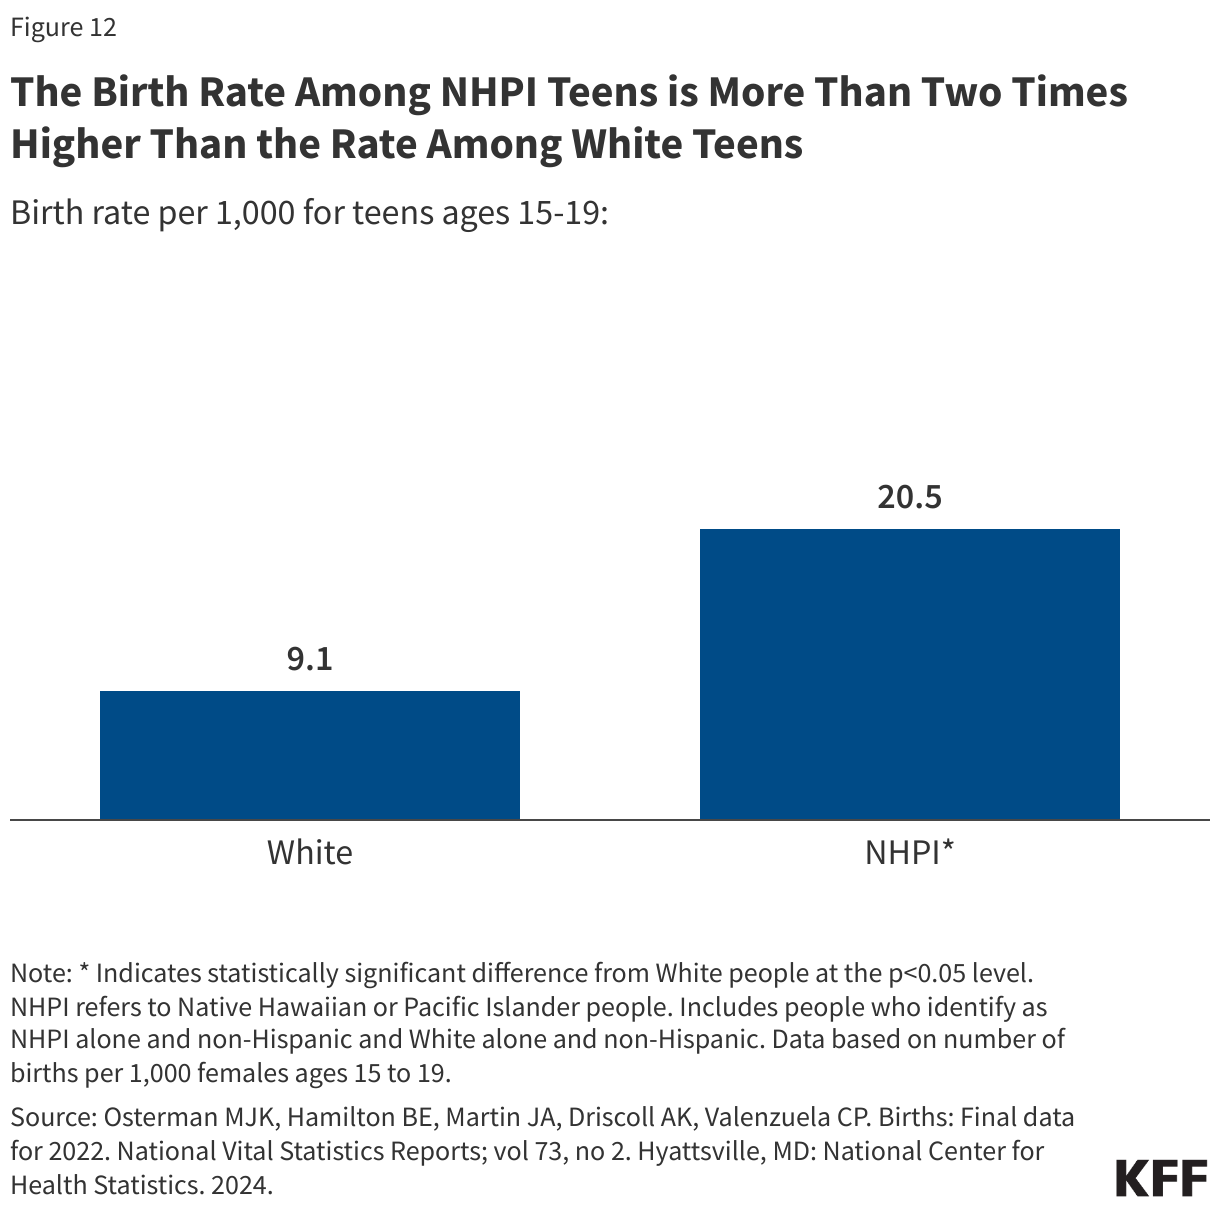
NHPI women fare worse than their White counterparts across multiple measures of birth risks and outcomes. NHPI women have higher shares of preterm births (12% vs. 9%) and low birthweight births compared to White women (9% vs. 7%) (Figure 11). Notably, NHPI women (22%) are four times more likely than White women (5%) to begin receiving prenatal care in the third trimester or to receive no prenatal care at all. Additionally, NHPI teen birth rates (20.5 per 1,000) are more than two times higher than the rate among White teens (9.1 per 1,000) (Figure 12).

NHPI Women Fare Worse Than White Women Across Pregnancy-Related Measures
The Birth Rate Among NHPI Teens is More Than Two Times Higher Than the Rate Among White Teens

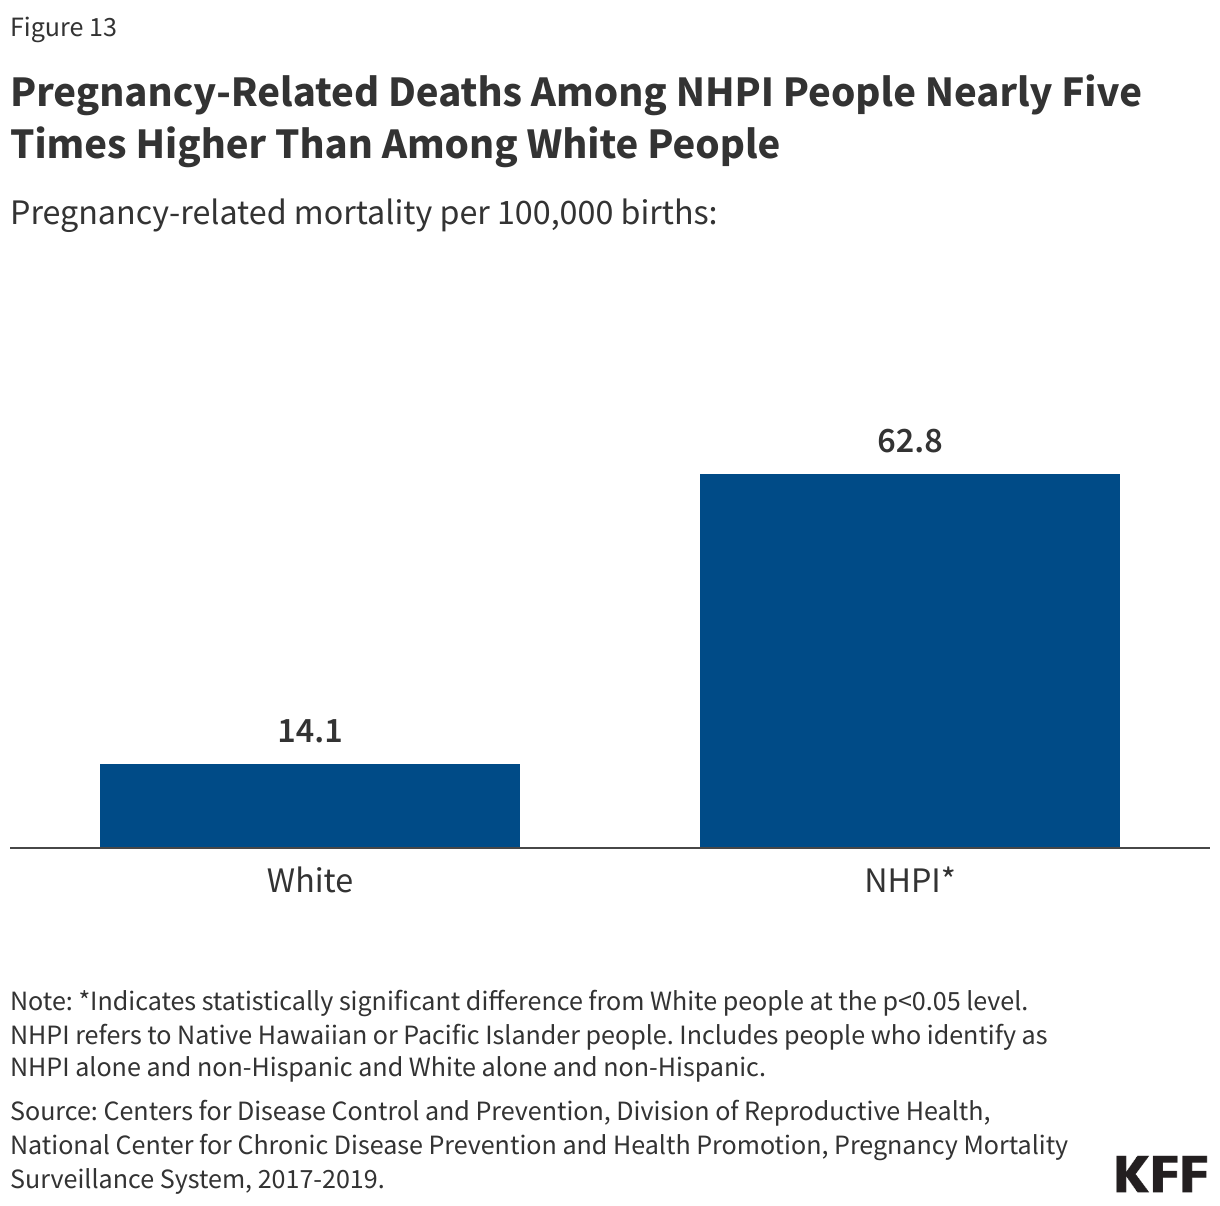
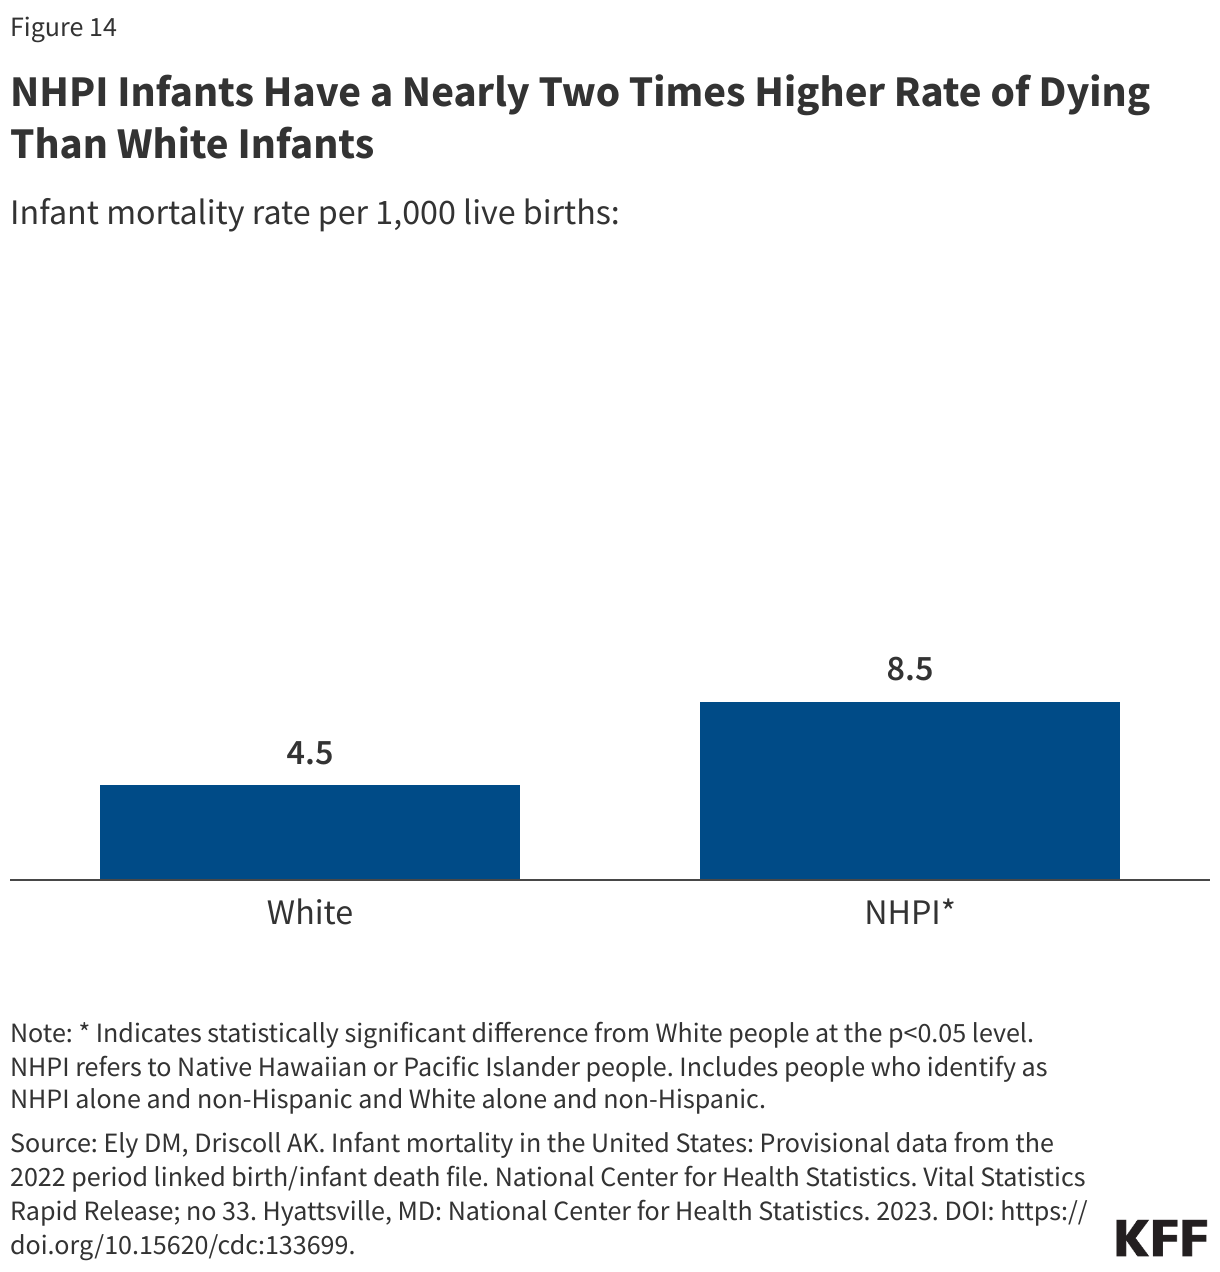
NHPI people have higher rates of pregnancy-related and infant mortality than White people. NHPI people have nearly five times higher pregnancy-related death rate than White people (62.8 vs. 14.1 per 100,000) (Figure 13). NHPI infants are nearly twice as likely to die as White infants (8.5 vs. 4.5 per 1,000) (Figure 14).

Pregnancy-Related Deaths Among NHPI People Nearly Five Times Higher Than Among White People
NHPI Infants Have a Nearly Two Times Higher Rate of Dying Than White Infant

Chronic Disease

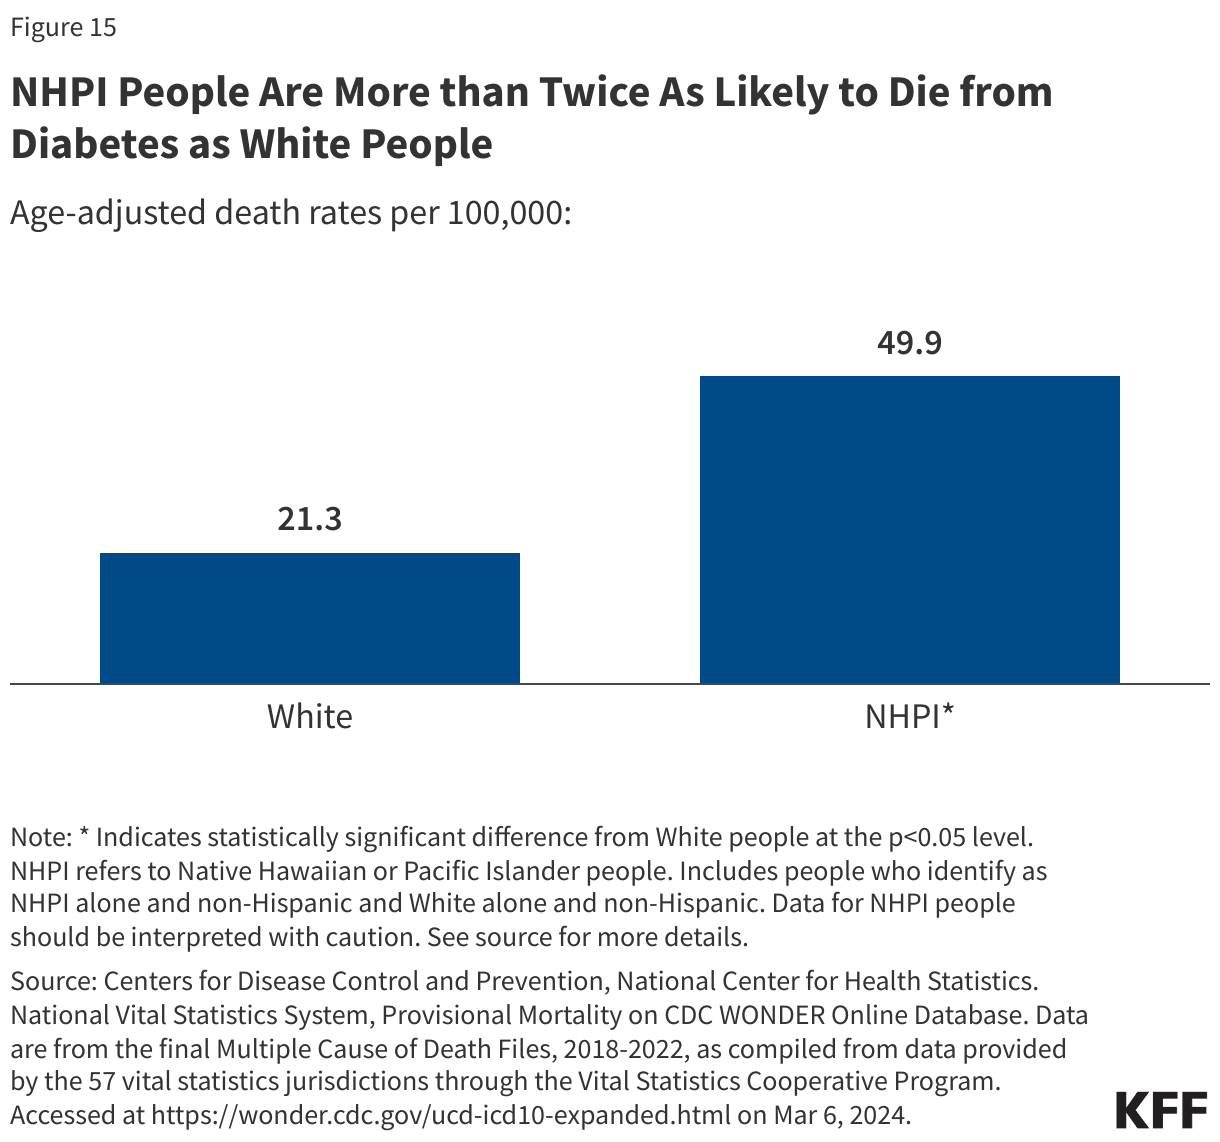
NHPI adults are more than two times as likely to die from diabetes than White adults (Figure 15). Diabetes rates for NHPI people (15%) do not statistically differ from the rate for White adults (11%), but the diabetes death rate for NHPI people is more than twice as high as the rate for White adults (49.9 vs. 21.3 per 100,000). The diabetes mortality rate for NHPI people is based on a small number of observations and should be interpreted with caution.

NHPI People Are More than Twice As Likely to Die from Diabetes as White People

NHPI adults are less likely to have a heart attack or heart disease than White adults but are at similar risk of dying due to heart disease. While rates of heart attack or heart disease are lower for NHPI adults (6%) compared to White adults (8%), the rate of heart disease-related mortality is similar (173.2 per 100,000 vs. 173.1 per 100,000, respectively).

Cancer

During 2015-2019, the latest period for which disaggregated data for NHPI people were available, there were over 18,000 new cancer cases among NHPI people. Breast cancer is the most diagnosed cancer type among women across NHPI ethnic groups, as is the case for most other racial and ethnic groups, ranging from 25% among Samoan women to 44% among Fijian women. For Native Hawaiian, Samoan, Tongan, and Fijian men, the most commonly diagnosed cancer type is prostate cancer, while the most commonly diagnosed cancer for Chamorro men is lung cancer. While updated data as of 2021 is available for other racial and ethnic groups, disaggregated data on rates of cancer incidence are unavailable for NHPI people.

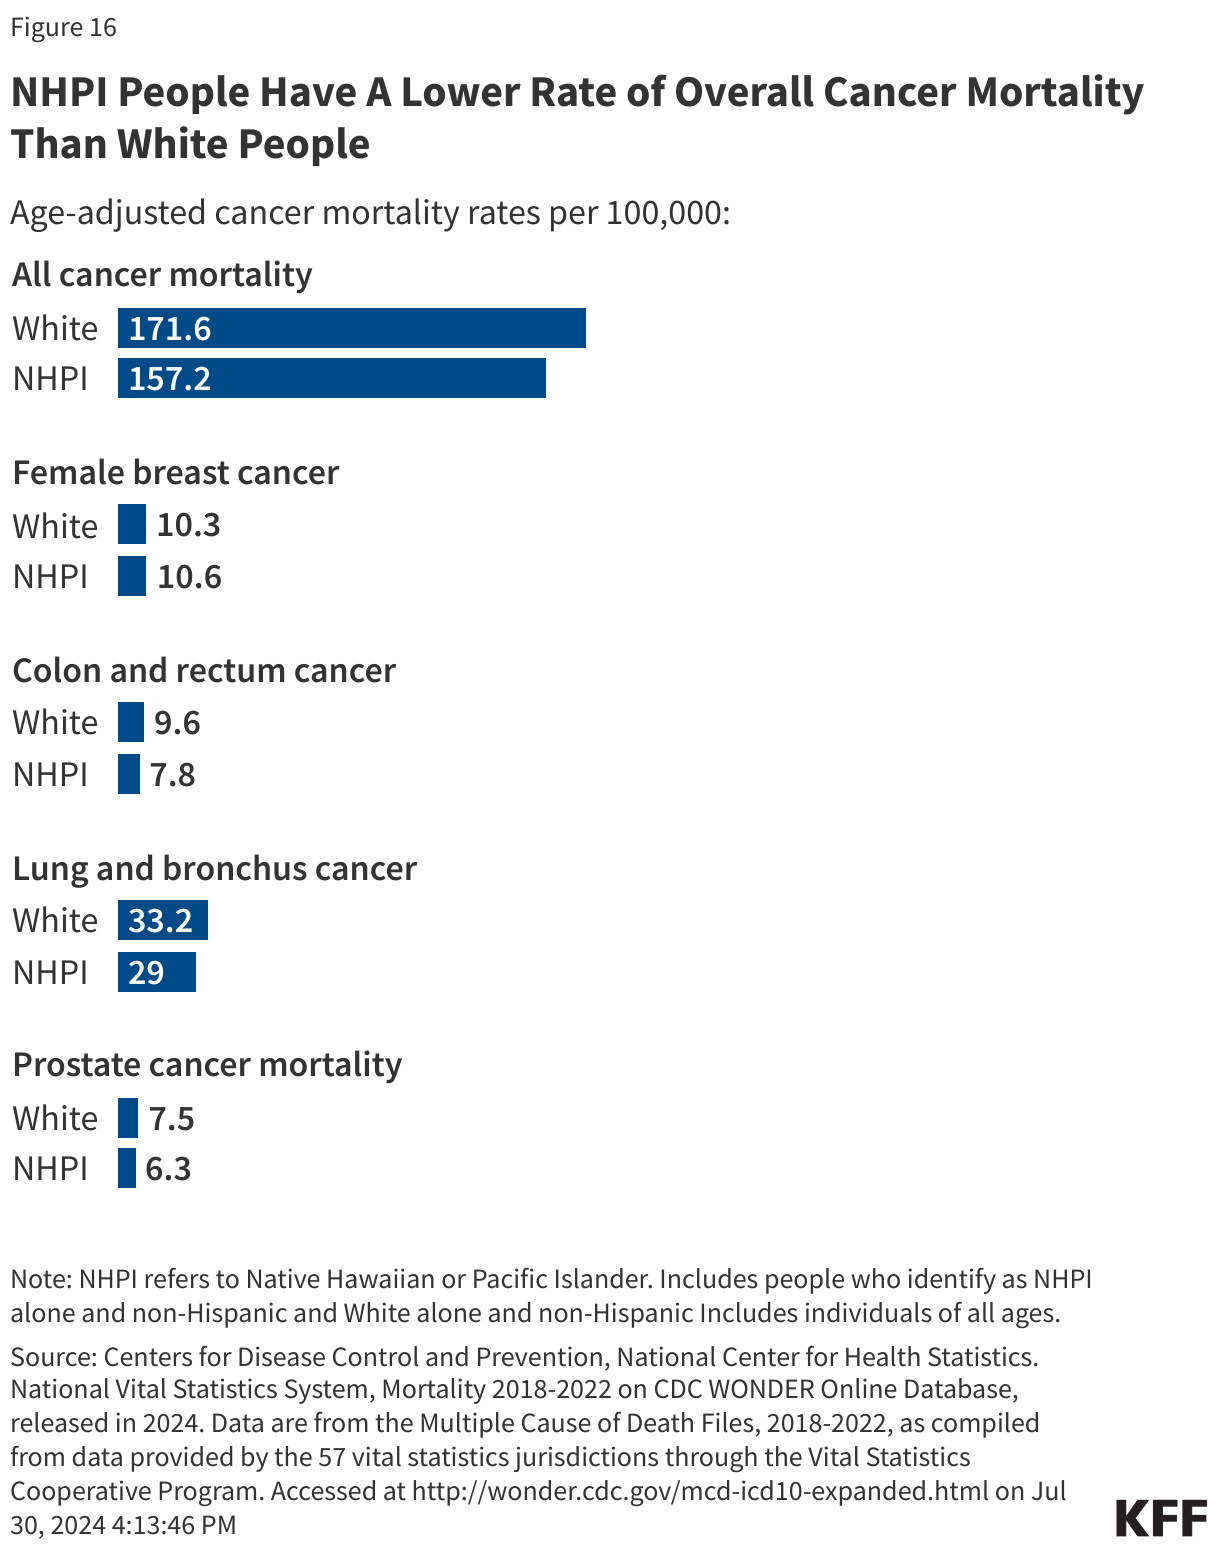
Overall, NHPI people have lower rates of cancer mortality than White people across most types of cancer. NHPI people have lower rates of all cancer-related deaths than White people (157.2 per 100,000 versus 171.6 per 100,000) (Figure 16). NHPI people have similar rates of female breast cancer mortality than White people (10.6 vs. 10.3 per 100,000). They have lower mortality rates of colon and rectum cancer (7.8 vs. 9.6 per 100,000), lung and bronchus cancer (29 vs. 33.2 per 100,000), and prostate cancer (6.3 vs. 7.5 per 100,000).

NHPI People Have A Lower Rate of Overall Cancer Mortality Than White People

Mental Health

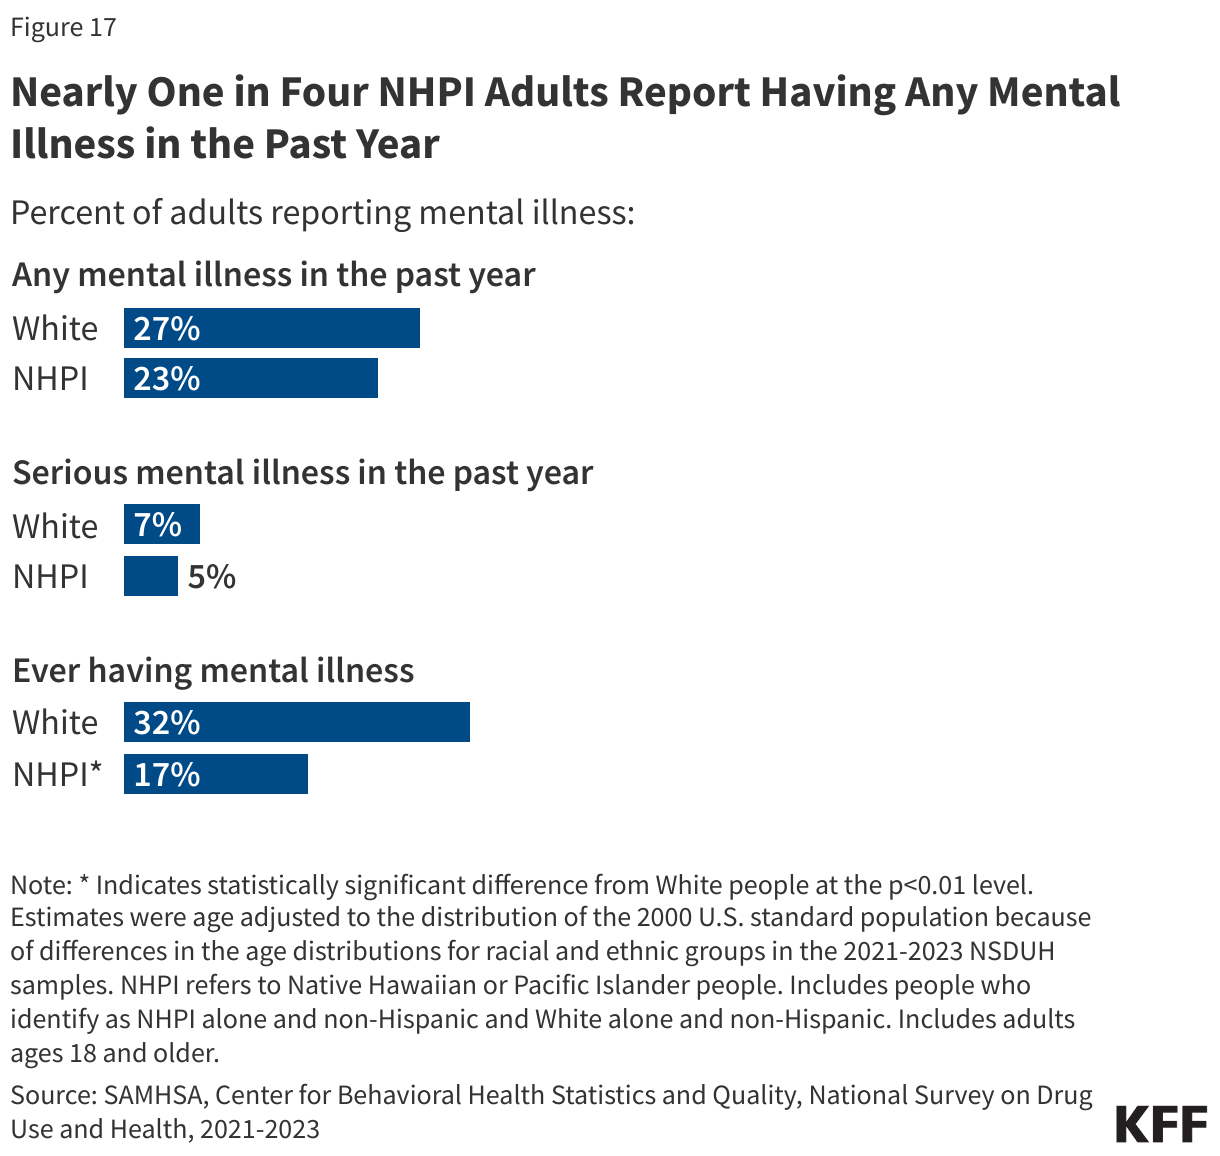
Reported rates of mental illness among NHPI people are similar to White people, but research suggests mental illness could be underdiagnosed among NHPI people. About one quarter of NHPI adults (23%) report experiencing any mental illness in the past year, similar to their White counterparts (27%). The share of NHPI adults reporting serious mental illness is also similar to White adults (5% vs 7%) (Figure 17). NHPI people (17%) are nearly half as likely to report ever having mental illness compared to White people (32%). However, research suggests that a lack of culturally sensitive screening tools that detect mental illness, coupled with structural barriers could contribute to underdiagnosis of mental illness among people of color.

Nearly One in Four NHPI Adults Report Having Any Mental Illness in the Past Year

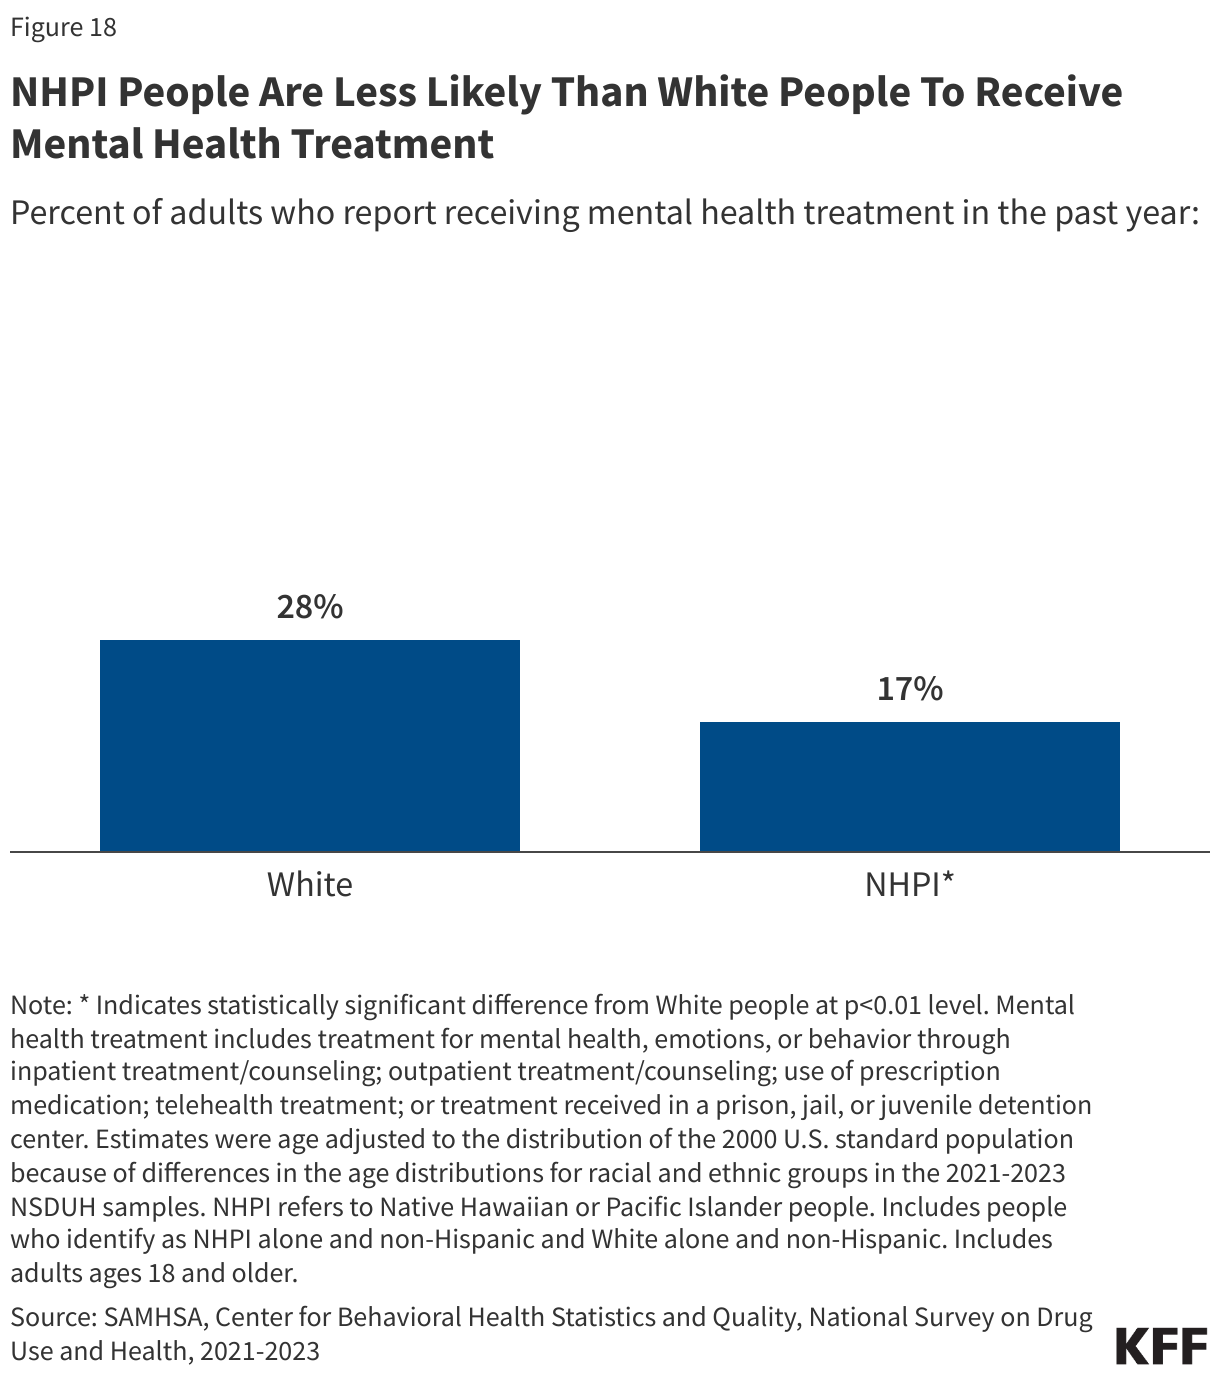
NHPI people are less likely to receive treatment compared with White people. 16% of NHPI people report receiving treatment in the past year compared to over one in four White people (26%) (Figure 18).

NHPI People Are Less Likely Than White People To Receive Mental Health Treatment

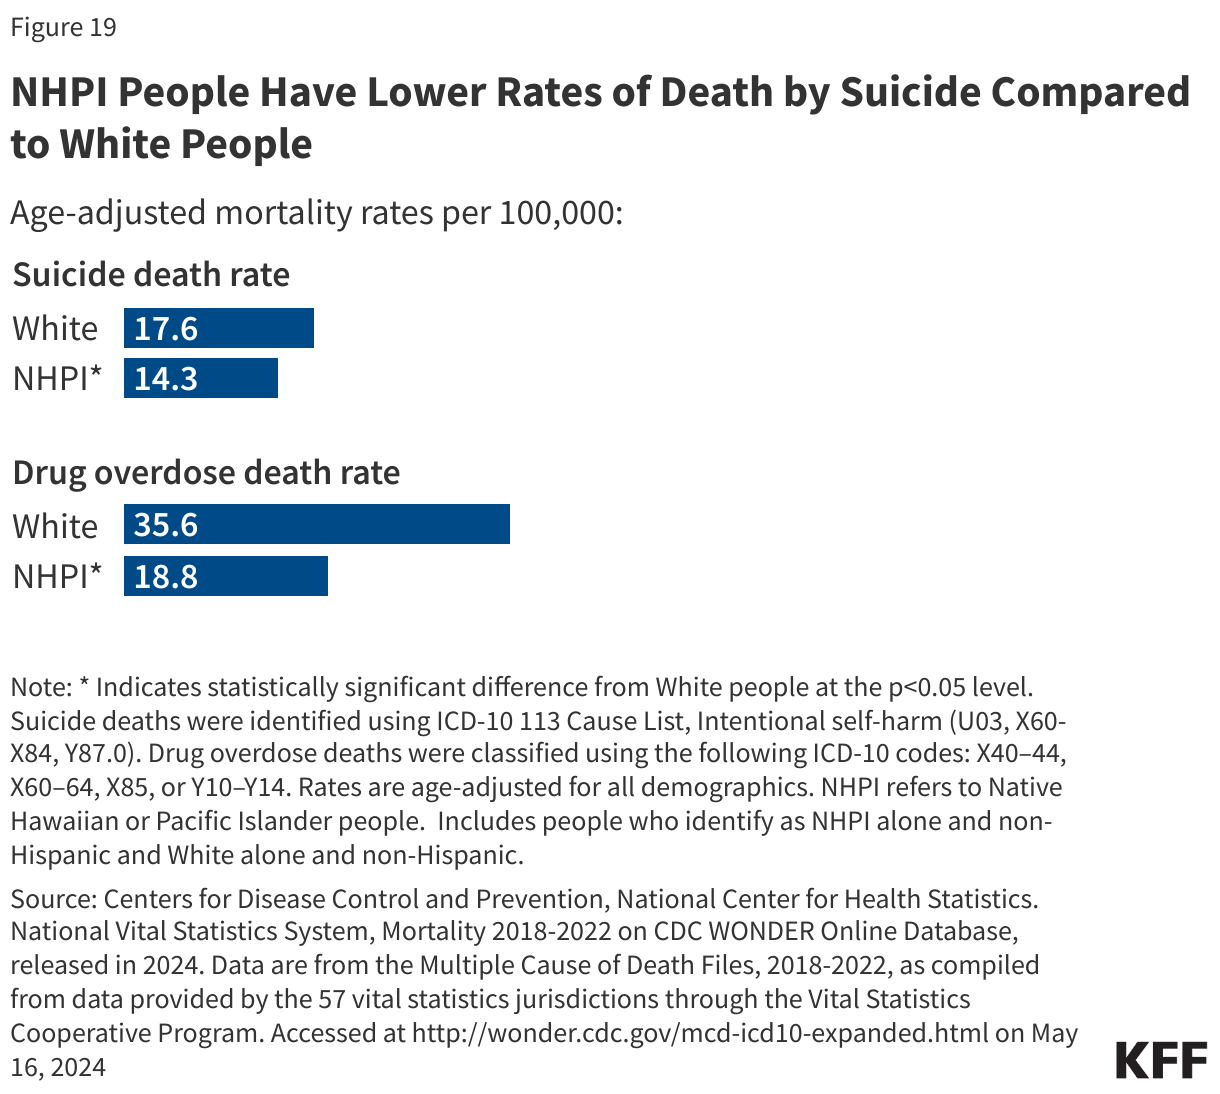
NHPI adults have lower rates of deaths by suicide and drug overdose than White people (Figure 19). As of 2022, the suicide death rate for NHPI adults (14.3 per 100,000) is lower than the rate for White adults (17.6 per 100,000). Between 2011 and 2021, Asian or Pacific Islander people experienced a faster increase in suicide death rates than White people. The data was not disaggregated and therefore the changes observed cannot specifically be attributed to Asian or NHPI racial groups, alone. Suicide data are not available for NHPI adolescents. NHPI adults have roughly half the rate of drug overdose deaths than their White counterparts (18.8 vs. 35.6 per 100,000). Between 2022 and 2023, the number of opioid overdose deaths among Asian or Pacific Islander people declined by 2%, a smaller decline than that of White people (-14%). Opioid overdose death data are combined for Asian and Pacific Islander people.

NHPI People Have Lower Rates of Death by Suicide Compared to White People

(Back to top)

Social And Economic Factors that Influence Health

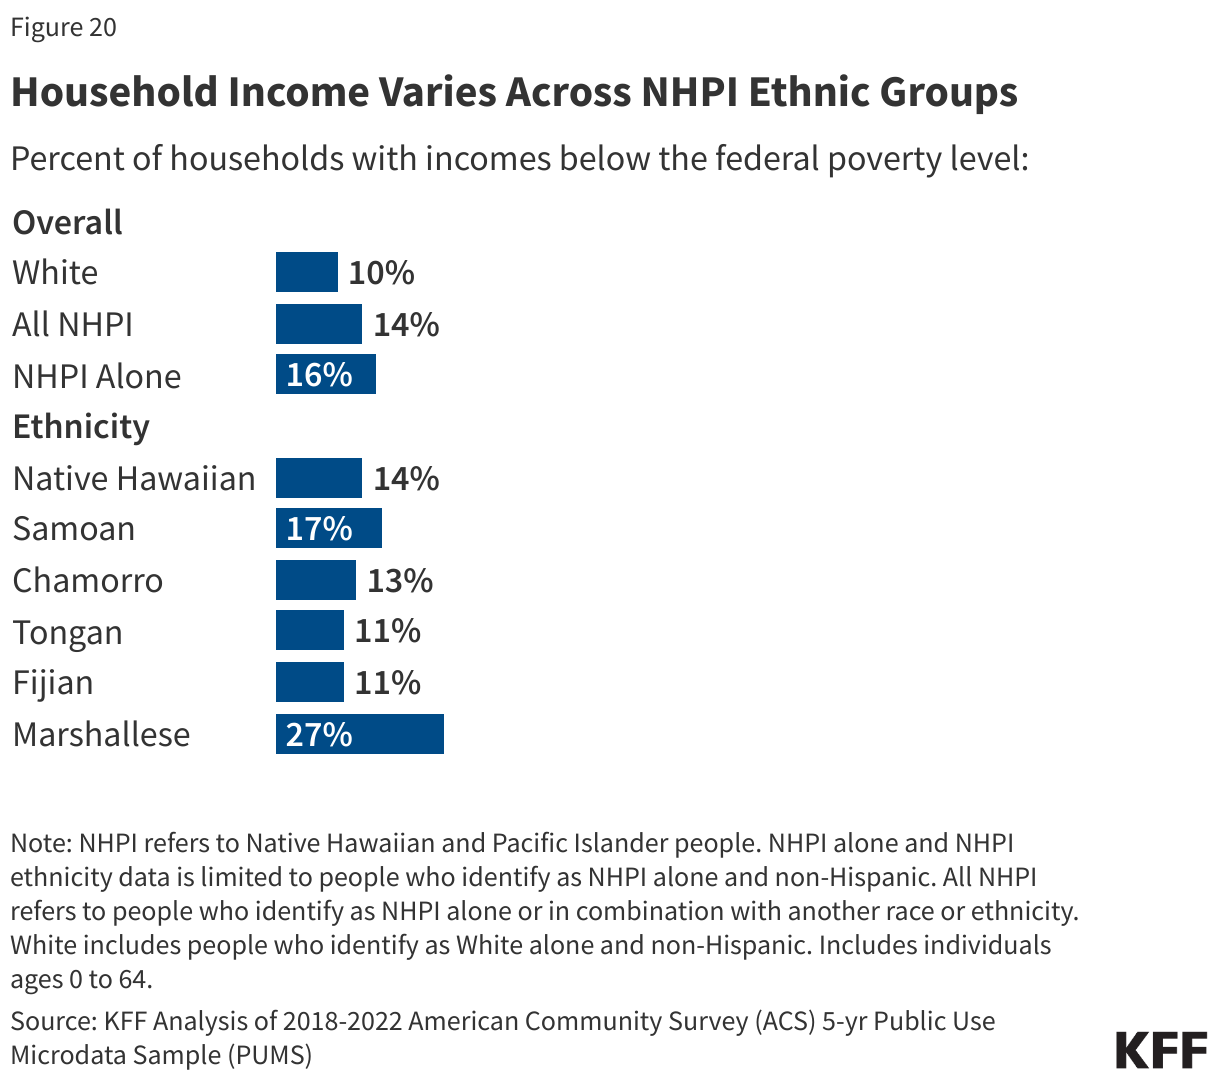
Across ethnic groups, most NHPI people are in working families, but there is significant variation in family income among NHPI people. Most NHPI people under age 65 are in a family with at least one worker (77%). Although the majority are in working families, NHPI people under age 65 are more likely to have income below the poverty level than their White counterparts (15% vs. 10%), with the share ranging from 11% among Tongan and Fijian people to 27% among Marshallese people (Figure 20).

Household Income Varies Across NHPI Ethnic Groups

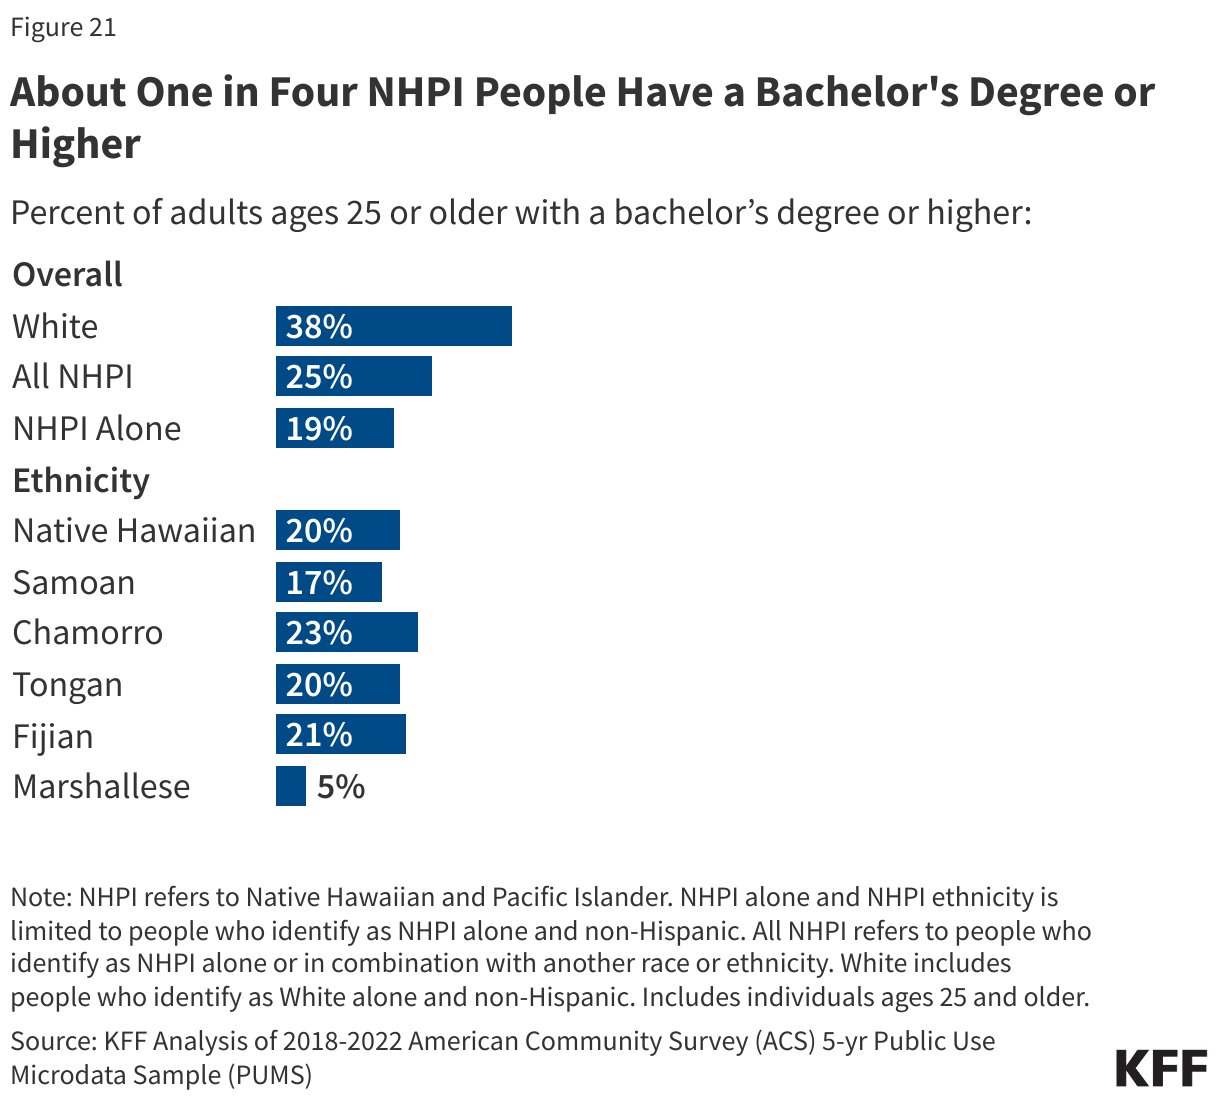
NHPI people have lower educational attainment compared to White people, but there is significant variation among NHPI people. Among adults ages 25 and older, one in five adults who are NHPI alone (19%) and one quarter of all NHPI adults (25%) report having a bachelor’s degree or higher compared to nearly four in ten White adults (38%) (Figure 21). Among NHPI people, the share with a bachelor’s degree ranges from 5% of Marshallese people to nearly one quarter (23%) of Chamorro people.

About One in Four NHPI People Have a Bachelor's Degree or Higher

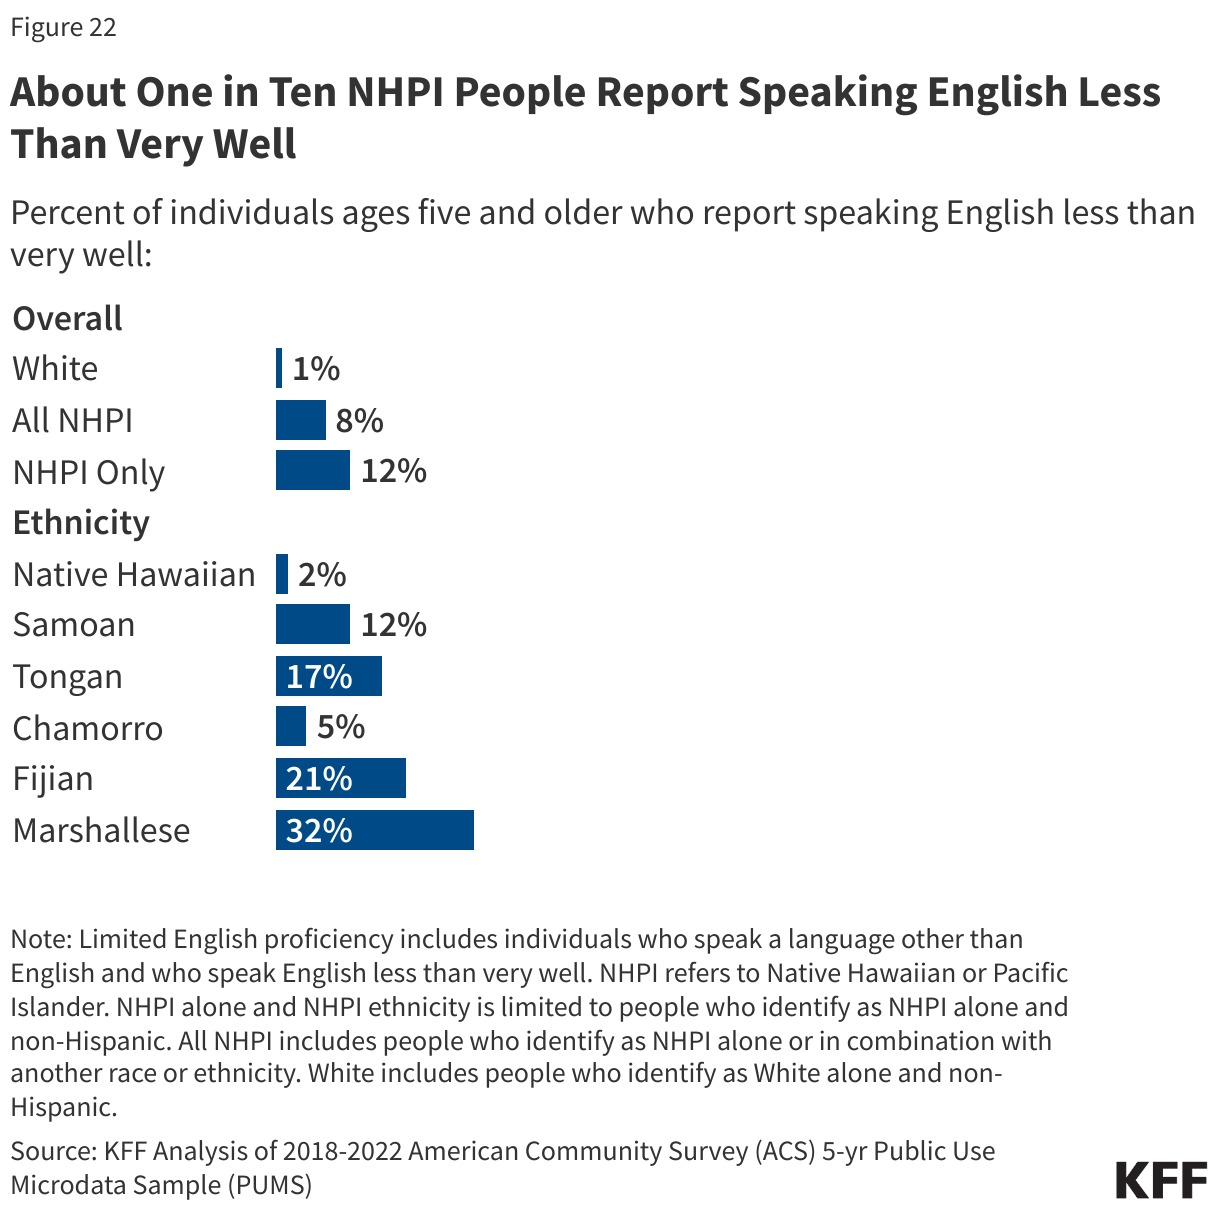
About one in ten (8%) NHPI people report speaking English less than very well compared to one percent of White people (Figure 22). Among NHPI people, limited English proficiency varies by ethnicity, ranging from about 2% of Native Hawaiian people to 5% of Chamorro people and one third of Marshallese people (32%). 17% of Tongan people and about one in five Fijian people (21%) report speaking English less than very well.

About One in Ten NHPI People Report Speaking English Less Than Very Well

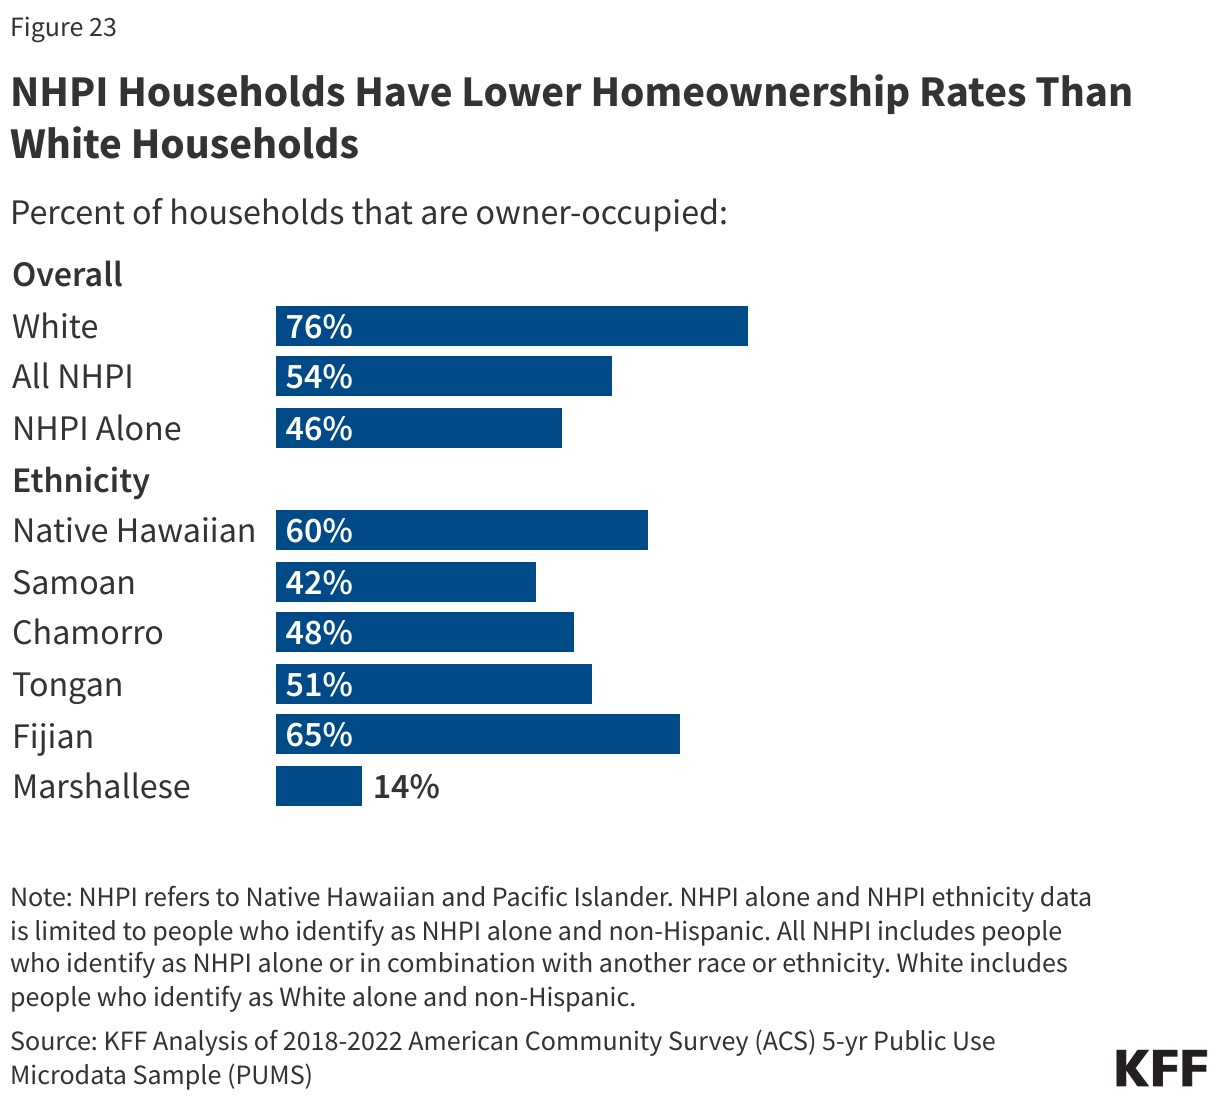
Overall, NHPI households (54%) have lower rates of homeownership compared to White households (76%) (Figure 23). Homeownership rates vary among NHPI people, ranging from about one in seven Marshallese households (14%) to about roughly half of Tongan households (51%), six in ten Native Hawaiian households (60%), and about two thirds of Fijian households (65%). Despite U.S. promises to return ancestral lands to Native Hawaiian people under the Hawaiian Homes Commission Act of 1920, home ownership rates among NHPI people in Hawaii remain at 56%. Some of the barriers to homeownership faced by Native Hawaiians include the high cost of living and the failures and long waitlists under the Hawaiian Homes Commission Act. The Maui wildfires have further increased housing demand and may exacerbate barriers to homeownership.

NHPI Households Have Lower Homeownership Rates Than White Households

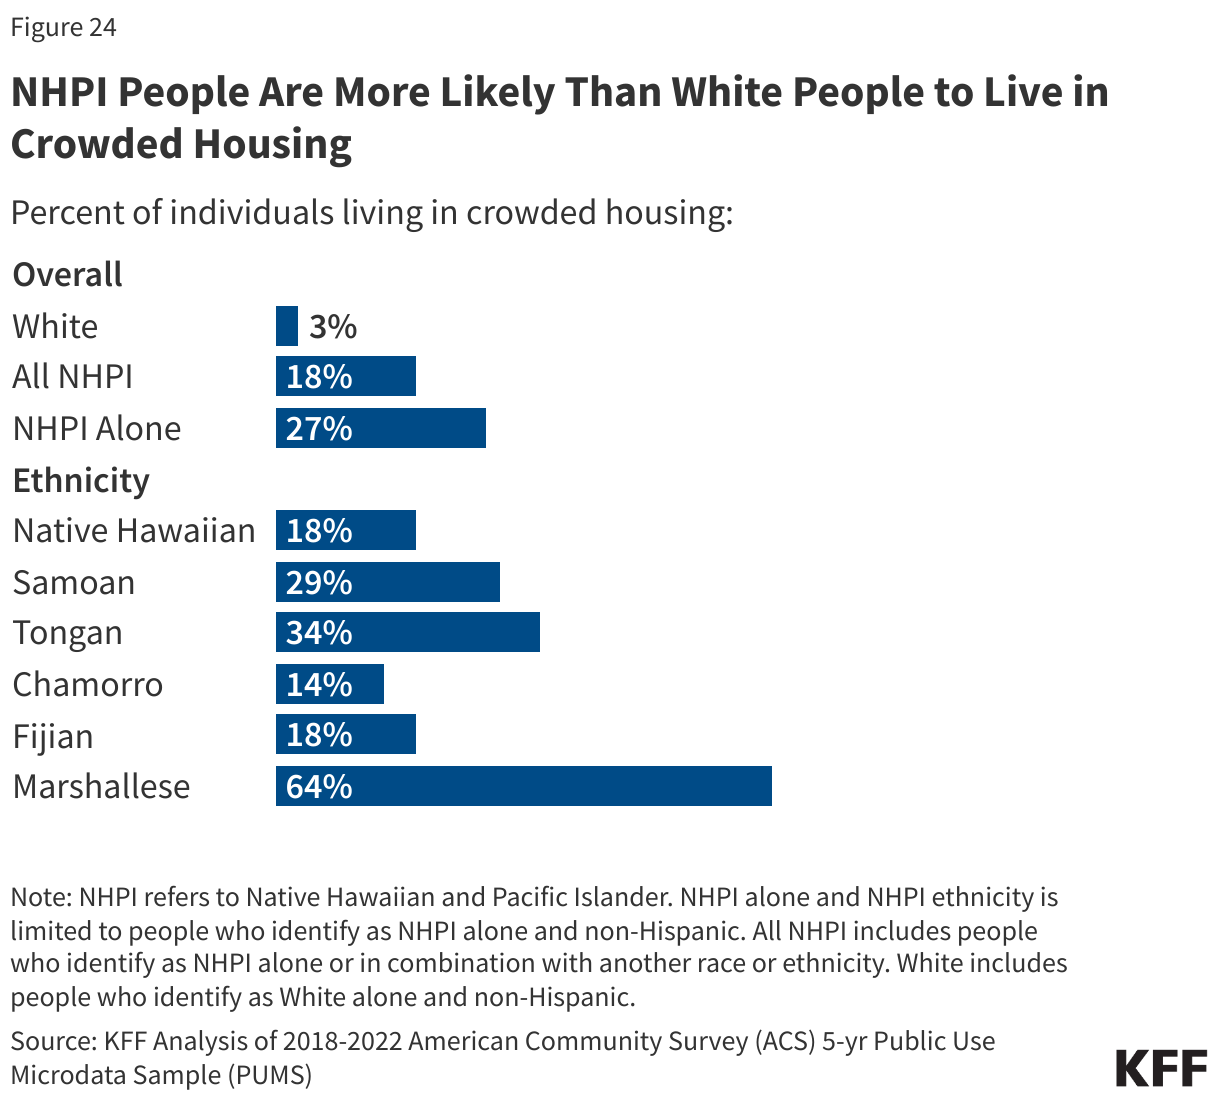
NHPI people are more likely to live in “crowded” housing compared to White people, and this share is higher among NHPI people living in Hawaii compared to those living in the continental U.S. (Figure 24). Nearly one in five (18%) people who identify as NHPI alone or in combination with another race or ethnicity and about a quarter of people who identify as NHPI alone (27%) report living in crowded housing compared to 3% of White people. “Crowded housing” is defined as housing with more than one occupant per room (not counting bathrooms, porches, balconies, hallways, or unfinished basements, etc.). Among NHPI people, the share of people living in crowded housing ranges from 14% for Chamorro people to 64% for Marshallese people. About three in ten (29%) NHPI people living in Hawaii report living in crowded housing compared 7% of White people living in Hawaii and to 15% of NHPI people in the continental U.S. NHPI people have the highest share of people living in multigenerational housing —households containing three or more generations— compared to other racial and ethnic groups, which may contribute to the higher share reporting crowded housing. Family is considered a core value in NHPI culture and is defined very broadly to include extended family. Consequently, living in multigenerational households is more common among NHPI people and is considered a strength within the community. Additionally, Hawaii consistently ranks as the most expensive state to live in, which can also lead to crowded housing conditions.

NHPI People Are More Likely Than White People to Live in Crowded Housing

(Back to top)

  1. Data and research often assume cisgender identities and may not systematically account for people who are transgender and non-binary. The language used in this brief attempts to be as inclusive as possible while acknowledging that the data we are citing uses gender labels that we cannot change without misrepresenting the data. ↩︎

Medicaid Expansion is a Red and Blue State Issue

Published: Nov 27, 2024

Although health care did not figure prominently in the 2024 presidential election, with President-elect Trump returning to the White House and Republicans controlling Congress, significant changes to Medicaid are expected. One potential target for federal spending reductions is the Affordable Care Act’s (ACA) Medicaid expansion. The ACA expanded Medicaid coverage to nearly all adults with incomes up to 138% of the Federal Poverty Level ($20,783 for an individual in 2024) and now provides states with an enhanced federal matching rate (FMAP) of 90% for their expansion populations. While the expansion was originally mandatory for states, a Supreme Court decision in 2012 effectively made it optional and as of November 2024 all but 10 states have adopted the expansion. Twelve states have “trigger” laws in place that would automatically end expansion or require other changes if the federal match rate were to drop below 90%.

Rather than repealing the ACA outright, some conservative and Republican proposals would instead lower the federal match rate for the expansion population from 90% to the standard Medicaid match rate, which is calculated based on a state’s per capita income and ranges from 50% to 83%. The Congressional Budget Office estimated in 2022 that reducing the match rate for the expansion group would save the federal government $631 billion over 10 years. This financing change would shift a substantial amount of Medicaid spending from the federal government to states. States would then need to decide whether to use states funds to make up for the lost federal funding or cut coverage. Given the challenges states would face replacing substantial lost federal funds, the health coverage implications would likely be significant and could reverse gains in financial security, access to care, and health outcomes. A large body of prior research shows that Medicaid expansion has helped to reduce the uninsured and improve access, affordability, and financial security among the low-income population. More recent research shows improvements in health outcomes and continues to show positive effects for providers (particularly rural hospitals) and for sexual and reproductive health.

Because of the widespread adoption of the Medicaid expansion across states, the financial and coverage impacts will be felt by both states that voted for President-elect Trump and those that voted for Vice President Harris. This data note provides key facts on the Medicaid expansion using enrollment data as of March 2024 and FY 2023 spending data from the Medicaid Budget and Expenditure System (MBES).

Medicaid expansion has been adopted by 41 states including the District of Columbia, split nearly evenly between states that voted for Trump (21 states) and those that voted for Harris (20 states) (Figure 1). Over the past ten years, Medicaid expansion has been broadly adopted by states led by Republicans and Democrats. Consequently, any changes to the Medicaid expansion authority or financing structure will affect both red and blue states. While the data are presented by states that voted for Trump or Harris in the November 2024 elections, there are five states with Democratic governors that voted for Trump (Arizona, Kentucky, Michigan, North Carolina, and Pennsylvania) and three Republican-led states that voted for Harris (New Hampshire, Virginia, and Vermont). In total, there are 19 expansion states with Republican governors, and 22 expansion states (including DC) headed by Democrats. Ultimately, it will be state governors and legislatures that will respond to any federal policy changes.

States that Have Adopted the Medicaid Expansion by Presidential Election Voting Result

As of March 2024, over 21 million people were enrolled through the Medicaid expansion representing nearly a quarter of enrollment across all states and about three in ten Medicaid enrollees in expansion states (Figure 2). Medicaid expansion enrollment totaled 7.3 million in states that voted for Trump and 13.7 million in states that voted for Harris. Across all Medicaid expansion states, total Medicaid enrollment was 68.2 million and the majority of people (69%) were enrolled through traditional eligibility pathways. Medicaid expansion enrollment comprised a slightly larger share of enrollment in states that voted for Harris (33%) than in states that voted for Trump (28%). Expansion enrollment ranged from a high of 53% of total enrollment in Oregon to a low of 13% in North Carolina, which implemented Medicaid expansion coverage in December 2023 (Appendix Table 1). The variation across expansion states likely reflects several factors, including different poverty distributions and economic conditions across states as well as variation in state Medicaid eligibility levels for expansion and traditional groups.

Medicaid Expansion Enrollment as a Share of Total Medicaid Enrollment for All Expansion States and by 2024 Presidential Election Vote

About 4.3 million expansion enrollees live in states with some type of trigger law that would end expansion coverage or require review of expansion coverage to mitigate increases in state costs if federal funding for the expansion is reduced. Trigger laws require states to automatically end Medicaid expansion coverage or require them to take actions to ensure state costs do not increase if the federal matching rate for the Medicaid expansion drops below 90% or below a specified threshold. Not all of the laws would immediately end the Medicaid expansion, but enrollees in states with trigger laws are at greater risk of losing coverage, although some may be able to maintain coverage through other eligibility pathways in some states. Currently, nine states (Arizona, Arkansas, Illinois, Indiana, Montana, New Hampshire, North Carolina, Utah, and Virginia) have laws that require termination of the expansion if the share of federal funding drops. Laws in three additional states (Idaho, Iowa, and New Mexico) require the states to take some action to mitigate the fiscal impact of the loss of federal funds. Of the 12 states with trigger laws, eight states voted for Trump (Arizona, Arkansas, Idaho, Indiana, Iowa, Montana,  North Carolina, and Utah) and four states voted for Harris (Illinois, New Hampshire, New Mexico, and Virginia). While laws in the so-called “trigger” states require action, the substantial loss of federal funding would likely force all states to reassess whether to continue the expansion coverage.

In FY 2023, spending on the expansion group represented 20% of Medicaid spending across all states and over a quarter of Medicaid spending in expansion states (Figure 3). Medicaid spending totaled $863.9 billion for all states and $686.9 billion in the 40 states that had implemented expansion in 2023 (North Carolina did not implement expansion until December 2023 and, consequently, is not counted as an expansion state during FY 2023). Spending on the expansion group totaled $178.2 billion, or 26% of total Medicaid spending in those states, and federal spending was $158.3 billion. Due to the 90% federal match for expansion, federal spending represents a larger share of spending for the expansion group than for traditional enrollees. The share of spending for the expansion group is lower than its share of enrollment (26% vs. 31%), in part, because the traditional Medicaid group includes populations such as those with disabilities and seniors who have higher per-enrollee spending. Similar to enrollment, expansion spending as a share of total spending varied across states from a high of 43% in Montana to a low of 16% in Massachusetts (Appendix Table 2).

Medicaid Expansion Spending as a Share of Total Medicaid Spending for All Expansion States and by 2024 Presidential Election Vote

Appendix Tables

Medicaid Expansion Enrollment as a Share of Total Enrollment
Medicaid Expansion Spending as a Share of Total Medicaid Spending

Proposed Coverage of Anti-Obesity Drugs in Medicare and Medicaid Would Expand Access to Millions of People with Obesity

Published: Nov 26, 2024

The Biden administration has proposed to allow Medicare and require Medicaid to cover drugs used to treat obesity by reinterpreting the statutory language that currently prohibits coverage of drugs used for weight loss under Medicare and permits but does not require states to cover these drugs for weight loss under Medicaid. This reinterpretation reflects an evolution in the understanding of obesity as a disease and weight loss as conferring real health benefits in people with obesity rather than being merely for cosmetic purposes. It also comes amidst high and growing demand for and use of a relatively new class of highly effective, but also very expensive, drugs being used to treat obesity, known as GLP-1s.

Under current law, people on Medicare can get anti-obesity drugs covered by Part D, Medicare’s outpatient drug benefit, only if they are used for a medically accepted FDA-approved indication other than obesity, like diabetes or cardiovascular disease risk reduction. State Medicaid programs also have to cover these drugs for indications such as diabetes or cardiovascular disease risk reduction, but only 13 states currently cover these drugs for obesity treatment as well. These limitations on coverage in Medicare and Medicaid mean that millions of people who have obesity and might benefit from these drugs may be unable to access them due to their high prices. But even with these coverage limits in place, gross spending on these drugs for approved uses in Medicare and Medicaid has skyrocketed in recent years, totaling $4 billion in Medicaid in 2023 and close to $6 billion in Medicare in 2022 for selected GLP-1s.

The new Biden administration proposal would authorize Medicare and Medicaid coverage of anti-obesity medications for people with obesity but not people who are overweight. While coverage would be available for Medicare and Medicaid enrollees with obesity, Medicare Part D drug plans and state Medicaid programs could still apply utilization management tools such as prior authorization, which could limit access. According to the Centers for Medicare & Medicaid Services, the proposal would increase Medicare spending by $25 billion and Medicaid spending by $15 billion over 10 years (net of rebates) and would apply to around 3.4 million people with Medicare and 4 million people with Medicaid. Because Medicaid is jointly financed by the states and the federal government, CMS estimates the federal government would pay $11 billion and states would pay nearly $4 billion.

Rising prescription drug costs are an ongoing concern for states, and state Medicaid programs reported the high cost of obesity drugs as key reason for not expanding coverage prior this proposal. The potential cost to Medicare is lower than some other estimates because it assumes many people with obesity can already get Medicare coverage of these drugs for other medically accepted indications, and CMS’s proposal would not apply to people who are overweight. Nonetheless, the combination of high demand, new uses, and high prices for these treatments is likely to place tremendous pressure on Medicare spending, Part D plan costs, and premiums for Part D coverage over time.

KFF analysis has found most large employer firms currently do not cover GLP-1 drugs for weight loss and coverage in ACA Marketplace plans remains limited, but if finalized, the proposed change to Medicare and Medicaid coverage could put pressure on other payers to expand access. If it becomes official coverage policy, this change would also lift the burden off lawmakers in Congress who have repeatedly introduced legislation to authorize Medicare coverage of anti-obesity drugs but who may have been stymied by the potential cost of doing so. But as the Biden administration prepares to hand the reins over to the incoming Trump administration, a key question is whether the rule will be finalized as proposed under new leadership at CMS, changed in some way, or pulled back altogether.