KFF designs, conducts and analyzes original public opinion and survey research on Americans’ attitudes, knowledge, and experiences with the health care system to help amplify the public’s voice in major national debates.
Starting on his first day of his second term in office, President Trump and his administration have taken several executive actions that directly impact U.S. global health efforts. This timeline, which is a companion resource to components of KFF’s Overview of President Trump’s Executive Actions on Global Health, provides a detailed overview of actions, including counter-actions, related to the administration’s efforts to freeze all U.S. foreign aid, dissolve the U.S. Agency for International Development (USAID), which implements most U.S. global health programs, and reorganize the Department of State. It will be updated as needed to reflect additional developments.
Editorial Note: The Policy Actions tracker will no longer be updated as the data source has ceased tracking government responses to COVID-19. For more information, please visit the Oxford Covid-19 Government Response Tracker.
Section:
0/0
Cases and Deaths
This tracker provides the cumulative number of confirmed COVID-19 cases and deaths, as well as the rate of daily COVID-19 cases and deaths by country, income, region, and globally. It will be updated weekly, as new data are released. As of March 7, 2023, all data on COVID-19 cases and deaths are drawn from the World Health Organization’s (WHO) Coronavirus (COVID-19) Dashboard. Prior to March 7, 2023, this tracker relied on data provided by the Johns Hopkins University (JHU) Coronavirus Resource Center’s COVID-19 Map, which ended on March 10, 2023. Please see the Methods tab for more detailed information on data sources and notes. To prevent slow load times, the tracker only contains data from the last 200 days. However, the full data set can be downloaded from our GitHub page. While the tracker provides the most recent data available, there is a two-week lag in the data reporting.
Note: The data in this tool were corrected on March 18, 2024, to clarify that they represent new cases and deaths over a full week rather than the average per day over a seven-day period.
Policy Actions
This tracker contains information on policy measures currently in place to address the COVID-19 pandemic. Policy categories currently being tracked include social distancing & closure measures, economic measures, and health systems measures. Policies are tracked at the country-, income-, and region-level. Please see the Methods tab for more detailed information on data sources and notes.
Social Distancing and Closure Measures
As countries continue to implement policies to prevent the transmission of SARS-CoV-2, the virus that causes COVID-19, these tables and charts show which social distancing and closure measures are currently in place by country.
Economic Measures
The COVID-19 pandemic has placed an unprecedented strain on country economies. These tables and charts show which economic-related measures, namely income support and debt relief, are currently in place by country.
Health Systems Measures
The COVID-19 pandemic continues to strain and disrupt global health systems. These tables and charts show which health systems measures are currently in place by country.
Policy actions data include the measure that was in place for each indicator at the country-level as of the end of 2022. Policy actions data will no longer be updated as the data source has ceased tracking government responses to COVID-19. For more information, please visit the Oxford Covid-19 Government Response Tracker.
Social Distancing and Closure Measures
Under 'Stay At Home Requirements', exceptions for leaving the house may include anything from being able to leave for daily exercise, grocery shopping, and essential trips, to only being allowed to leave once a week, or one person may leave at a time, etc. Under 'Workplace Closing', partial closing includes instances in which a country recommends closing the workplace (or working from home); businesses are open but with significant COVID-19-related operational adjustments; or when workplaces require closing for only some, but not all, sectors or categories of workers. Under 'School Closing', partial closing includes instances in which a country has recommended school closures; all schools are open but with significant COVID-19-related operational adjustments; or some schools, but not all, are closed; full closing includes schools that are in session but operating virtually. Under 'Restrictions On Gatherings', partial restrictions include restrictions on gatherings of more than 10 people; full restrictions include restrictions on gatherings of 10 people or less. Under 'International Travel Controls', partial restrictions include screening and quarantine requirements for those entering the country. Values for ‘Cancel Public Events’ were not recodified.
Economic Measures
Under 'Income Support', narrow support includes instances in which a country's government is replacing less than 50% of lost salary (or if a flat sum, it is less than 50% median salary); broad support includes instances in which a country's government is replacing 50% or more of lost salary (or if a flat sum, it is greater than 50% median salary). Under 'Debt/Contract Relief', narrow support includes instances in which a country's government is providing narrow relief, such as relief specific to one kind of contract.
Health Systems Measures
Under 'Vaccine Eligibility', partial availability includes availability for some or all of the following groups: key workers, non-elderly clinically vulnerable groups, and elderly groups, or for select broad groups/ages. Under 'Facial Coverings', recommend/partial requirement includes instances in which a country's government recommends wearing facial coverings, requires facial coverings in some situations, and requires facial coverings when social distancing is not possible.
Note: The data presented below are updated monthly as new Medicaid/CHIP enrollment data become available.
This tracker presents the most recent data on monthly Medicaid and Children’s Health Insurance Program (CHIP) enrollment reported by the Centers for Medicare & Medicaid Services (CMS) as part of the Performance Indicator Project. It includes data for Medicaid and CHIP and reports enrollment data for children and adults. The data are generally the most recent data available and are useful for reporting trends in Medicaid enrollment. However, the data only capture full-benefit enrollees, excluding those who receive limited benefits, such as those who receive family planning services only, and consequently, do not provide a full count of the total population enrolled in Medicaid. Additionally, these data cannot be used to monitor changes in enrollment by eligibility pathway, including for adults in the Medicaid expansion group. Enrollment data for the full Medicaid population is available here, and for more information on how implementation of Medicaid work requirements is affecting Medicaid expansion enrollment, please see Tracking Implementation of the 2025 Reconciliation Law Medicaid Work Requirements.
Medicaid/CHIP Enrollment Trends
Following implementation of the Affordable Care Act’s (ACA) Medicaid expansion in January 2014, Medicaid enrollment increased as adults with income up to 138% of the federal poverty level (FPL) gained coverage. As more states adopted the expansion, Medicaid enrollment peaked at just over 75 million in March 2017 before declining steadily until the start of the COVID-19 pandemic in March 2020. By February 2020, enrollment had dropped to 71 million.
At the start of the pandemic, Congress enacted legislation that included a provision that Medicaid programs keep people continuously enrolled in exchange for enhanced federal funding. As a result, national Medicaid/CHIP enrollment increased to a record high of 94 million enrollees in March 2023 when the continuous enrollment provision ended. The unwinding of this provision started on April 1, 2023, and millions were disenrolled from Medicaid over the subsequent 16 months. By September 2024, national Medicaid/CHIP enrollment had dropped to 80 million. Medicaid enrollment stabilized briefly at the end of 2024 but began declining again in March 2025.
Passage of the 2025 reconciliation bill in July 2025 included significant changes to Medicaid that are expected to reduce Medicaid enrollment over the next 10 years relative to what would have been expected under current law. For the first time, the law conditions Medicaid eligibility for Medicaid expansion enrollees on meeting work and reporting requirements. These work requirements, which will go into effect in January 2027, or sooner at state option, represent the largest source of enrollment declines in the law. The bill also restricts eligibility for certain immigrant populations starting in October 2026, which is also expected to affect Medicaid enrollment.
The figures below show Medicaid and CHIP enrollment from February 2020 through the most current month of available data. Figures include enrollment for adults and children in Medicaid/CHIP and for Medicaid only and CHIP only. Key enrollment data and trends asof April 2026 include:
There were 73.9 million people enrolled in Medicaid/CHIP nationally (Figure 1). Medicaid enrollment declined by 5 million or 6% from April 2025 through April 2026 (Table 1).
Total Medicaid/CHIP enrollment has decreased in all states since April 2025. Enrollment changes since April 2025 vary from a less than 1% decrease in Iowa to a 20% decrease in Indiana (Figure 2).
Child enrollment in Medicaid/CHIP decreased in all states and DC but Hawaii from April 2025 through April 2026. Adult enrollment has decreased in all but five states (IA, MO, NC, OK, SD) (Figure 2).
There were 66.7 million people enrolled in Medicaid and 7.1 million people enrolled in CHIP (Figure 1). Since April 2025, Medicaid enrollment has decreased in all states and DC but Iowa while CHIP enrollment has increased in eighteen states (AL, CA, CT, DE, FL, HI, IL, MO, NJ, NM, NC, ND, RI, SC, TN, VT, WA, WI).
Total Medicaid/CHIP enrollment was 3% higher in April 2026 compared to enrollment in February 2020, prior to the pandemic. However, in the 49 states and DC with complete enrollment data by age, the number of children enrolled in Medicaid/CHIP declined by 631,000 or 2% from February 2020 to April 2026 (Figure 2 and Table 1).
Unwinding Data - Archived
Note: The data on unwinding renewal outcomes presented below were last updated on September 12, 2024; since most states have now completed the Medicaid unwinding, the information will not be updated again.
As of September 12, 2024 and with nearly complete unwinding data for most states:
Over 25 million people were disenrolled (31% of completed renewals) and over 56 million people had their coverage renewed (69% of completed renewals).
Disenrollment rates varied across states from 57% in Montana to 12% in North Carolina, driven by a variety of factors including differences in renewal policies and procedures as well as eligibility expansions in some states.
Among those who were disenrolled, nearly seven in ten (69%) were disenrolled for paperwork or procedural reasons while three in ten (31%) were determined ineligible.
Among those whose coverage was renewed during the unwinding, 61% were renewed on an ex parte, or automated, basis, meaning the individual did not have to take any action to maintain coverage.
State Data on Renewal Outcomes
The data on unwinding-related renewal outcomes presented in this section rely primarily on monthly reports that states were required to submit to the Centers for Medicare & Medicaid Services (CMS) during the unwinding period. The data also reflect updates to the monthly reports that states submit three months after the original report submission to account for the resolution of pending cases and any other changes in renewal metrics. For 13 states, data were pulled from dashboards or reports published on state websites that provide more complete information, and for a few additional states, updated monthly reports were pulled from state websites because they were more timely than what is reported on the CMS website.
As of September 12, 2024, at least 25,198,000 Medicaid enrollees had been disenrolled during the unwinding of the continuous enrollment provision. Overall, 31% of people with a completed renewal were disenrolled in reporting states while 69%, or 56.4 million enrollees, had their coverage renewed.
There is wide variation in disenrollment rates across reporting states, ranging from 57% in Montana to 12% in North Carolina.A variety of factors contribute to these differences, including differences in renewal policies and system capacity. Some states adopted policies that promote continued coverage among those who remain eligible and/or have automated eligibility systems that can more easily and accurately process renewals while other states have adopted fewer of these policies and have more manually-driven systems. In addition, North Carolina and South Dakota adopted Medicaid expansion and other states increased eligibility levels for certain populations (e.g., children, parents, etc.) during the unwinding, which may have lowered disenrollment rates in these states.
Across all states with available data, 69% of all people disenrolled had their coverage terminated for procedural reasons. However, these rates vary based on how they are calculated (see note below). Procedural disenrollments are cases where people are disenrolled because they did not complete the renewal process and can occur when the state has outdated contact information or because the enrollee does not understand or otherwise does not complete renewal packets within a specific timeframe. High procedural disenrollment rates are concerning because many people who are disenrolled for these paperwork reasons may still be eligible for Medicaid coverage.
(Note: The first tab in the figure below calculates procedural disenrollment rates using total disenrollments as the denominator. The second tab shows these rates using total completed renewals, which include people whose coverage was terminated as well as those whose coverage was renewed, as the denominator. And finally, the third tab calculates the rates as a share of all renewals due, which include completed renewals and pending cases.)
Medicaid Renewals
Of the people whose coverage has been renewed as of September 12, 2024, 61% were renewed on an ex parte basis while 39% were renewed through a renewal form, though rates vary across states. Under federal rules, states are required to first try to complete administrative (or “ex parte”) renewals by verifying ongoing eligibility through available data sources, such as state wage databases, before sending a renewal form or requesting documentation from an enrollee. Ex parte renewal rates varied across states from 90% or more in Arizona, North Carolina, and Rhode Island to less than 20% in Pennsylvania and Texas.
Federal Data on Renewal Outcomes
The data presented here are cumulative unwinding metrics published by CMS. These counts and percentages may differ from the above data, which present renewal metrics reported on state websites when state-reported data are more complete.
Figure 1 below shows cumulative renewal data reported by CMS during states’ unwinding periods. Renewal data for the months after the end of states’ unwinding period are excluded. The data reflect updated unwinding data reported by states three months after the original monthly reports as they become available.
Note: The state data presented below were last updated on September 12, 2024; since most states have now completed the Medicaid unwinding, the information will not be updated again.
The data presented here provide state-level data on enrollment trends and renewal outcomes during the unwinding period. Figure 1 shows total Medicaid enrollment by month starting in January 2023 and, once disenrollments resumed in a state, the cumulative percent change in Medicaid enrollment relative to the month before Medicaid disenrollments started (this baseline month will differ across states). Figure 2 shows renewal metrics for each month of a state’s unwinding period (or cumulative data for the unwinding period for some states).
This brief, originally published on September 9, 2025, was updated with the most recently available data on July 31, 2026.
According to the most recent data available from the U.S. Department of Housing and Urban Development (HUD), nearly 746,000 people were experiencing homelessness on a single night in January 2025, an over 30% increase from 2019, but also a 3% decrease from the highest levels ever recorded in 2024. The links between homelessness and health are complex, and past KFF research found that people with prior experiences of homelessness have disproportionate physical and mental health needs and face greater socioeconomic challenges compared to those who have never experienced homelessness. People experiencing homelessness who are unsheltered also experience higher rates of chronic homelessness, chronic disease, mental illness, and substance abuse than those who are sheltered.
This data note reviews trends in homelessness and characteristics of people who are homeless using data from HUD’s Point-in-Time (PIT) count of sheltered and unsheltered people experiencing homelessness. The PIT count is generally conducted on a single night during the last ten days of January. While the PIT count is the primary nationally standardized measure to track trends in homelessness over time, these estimates likely undercount the total number of people experiencing homelessness, particularly among the unsheltered, due to challenges locating individuals who are unsheltered, local staffing capacity, and weather. The PIT count also does not include people who are staying with family or friends, referred to as “doubling up”, in other unstable housing situations, or living in permanent supportive housing.
These data capture a look at homelessness amid a number of federal policy changes aimed at clearing homeless encampments, limiting provisions for housing alternatives, and potentially resulting in institutionalization among people experiencing homelessness. President Trump signed an executive order in July 2025 on homelessness, mental health, and substance use that encouraged states to remove unhoused people from public spaces, following nationwide passage of Supreme Court-backed local laws making it easier for law enforcement to ticket, fine, or arrest people sleeping on public property. HUD proposed to shift homelessness services spending away from “Housing First” programs–which provide immediate housing without preconditions such as sobriety or mandatory mental health treatment—towards “transitional housing” programs, and require local homelessness services entities to cooperate with law enforcement to prohibit homeless encampments, but was blocked by court ruling in June 2026. Most recently, the Department of Justice (DOJ) issued an opinion in June 2026 and a notice in July 2026 challenging the longstanding interpretation of the Olmstead Supreme Court decision, signaling narrower federal enforcement of the integration mandate, which has helped spur state investment in rental assistance, supportive housing, and community services for people with disabilities. These changes could potentially result in fewer community services and increased institutionalization among people experiencing homelessness.
1. From 2019 to 2025, the number of people experiencing homelessness on a single night increased by over 30% to nearly 746,000 people, with nearly four in ten (36%) staying in unsheltered locations.
The HUD PIT survey counts people experiencing homelessness in both sheltered and unsheltered settings on a single night. People are counted as unsheltered if they sleep in locations not ordinarily used as a regular sleeping accommodation, such as cars, parks, abandoned buildings, or campgrounds. The remainder of people experiencing homelessness were in sheltered locations, with nearly six in ten (56%) staying in emergency shelters and nearly one in ten (8%) in transitional housing, which is temporary housing with supportive services (Figure 1).
Between 2019 and 2025, the number of people experiencing homelessness rose by 31%. This increase was primarily driven by the growth in the number of people staying in emergency shelters and experiencing unsheltered homelessness, while the number of people in transitional housing declined over the same period. According to HUD, rising housing costs and the end of the COVID-19 public health emergency in May 2023, which ended the eviction moratorium and other income and safety net programs, drove recent increases. Counts of people experiencing homelessness peaked in 2024 and then decreased 3% from 2024 to 2025, with nearly 60% of the decrease driven by a reduction in the number of people in emergency shelters.
Beyond shifts in sheltered and unsheltered homelessness, the share of people experiencing homelessness identified as “chronic homelessness”—defined by HUD as having a disability, including physical, mental, developmental, substance use-related, or HIV/AIDS-related disabilities, and experiencing long-term or repeated episodes of homelessness of at least 12 months—increased from 19% in 2019 to 23% in 2025 (from about 106,000 to 170,000). However, the share of adults experiencing homelessness who were veterans fell from 8% in 2019 to 5% in 2025 (from about 37,000 to 33,000), similar to their share of the general adult population (6%). An increase in housing assistance programs from the Department of Veterans Affairs (VA) in recent years likely drove this decrease.
2. In 2025, over eight in ten (82%) people experiencing homelessness were adults, with decreases in the number of people experiencing homelessness seen across age groups since 2024 except among adults ages 55 and older.
On a single night in January 2025, there were about 612,000 adults and 134,000 children experiencing homelessness, with adults consistently representing about eight in ten of all people experiencing homelessness since 2019 (Figure 2). The number of children experiencing homelessness increased 25% from 2019 to 2025. However, after several years as the fastest-growing age group among people experiencing homelessness, the number of children experiencing homelessness fell 10% (from about 148,000 to 134,000) from 2024 to 2025. Most households with children experiencing homelessness are sheltered, as children made up less than one in ten (4%) unsheltered people in 2025. Housing insecurity during childhood is associated with negative health outcomes later in life, including anxiety and depression. The number of adults experiencing homelessness fell 11% among adults ages 18-24 and 2% among adults ages 25-54 from 2024 to 2025 but increased among those ages 55 and older by 2%. While long-term data for these specific age ranges are not available prior to the 2023 PIT count, research found that adults born between 1955 and 1965 have comprised a disproportionate share of single adults experiencing sheltered homelessness across several decades, suggesting that the aging of this cohort has contributed to the recent rise in adults ages 65 and older experiencing homelessness.
3. In 2025, Southern and Western states had higher shares of people who were experiencing homelessness who were unsheltered compared to other parts of the country.
States in the Northeast and West had higher rates of people experiencing homelessness per 10,000 people than elsewhere in the country on a single night in January 2025 (Figure 3). The share of people experiencing homelessness who were unsheltered by state were highest in Southern and Western states, including in California (64%), Oregon (61%), Arizona (56%), and Georgia (54%). In contrast, the shares of people experiencing homelessness who were unsheltered were lowest in New York (4%) and Massachusetts (6%), despite these states having relatively high rates of people experiencing homelessness per 10,000 people. These patterns may reflect a combination of local factors, including climate, housing costs, shelter capacity, right to shelter laws, and law enforcement policies that bring more people into emergency shelters or other sheltered housing.
4. In 2025, about seven in ten (67%) people experiencing homelessness were people of color.
White (33%), Black (31%), and Hispanic (27%) people each accounted for about three in ten of people experiencing homelessness on a single night in January 2025, with other racial and ethnic groups making up smaller shares (less than 5%) (Figure 4). Black, Hispanic, AIAN, and NHPI people made up a disproportionate share of the people experiencing homelessness compared to their share of the total population.
5. From 2019 to 2025, the share of adults experiencing homelessness with serious mental illness (SMI) or substance use disorder (SUD) remained stable, suggesting that rising homelessness reflects broader factors affecting both people with and without these conditions.
In 2025, about a quarter (24%, or 146,000) of adults experiencing homelessness on a single night in January met HUD’s SMI definition and nearly one in five (18%, or 112,000) had SUD according to HUD’s definition in the point-in-time count, about a 1% decrease from 2019 (Figure 5). SMI and SUD often co-occur—about one-quarter of people with SMI also have an SUD—but HUD’s publicly available data do not report the overlap of these conditions. The prevalence of SMI and SUD represents an outsized share of the population of adults experiencing homelessness as about 5-6% of adults overall have SMI according to the National Survey of Drug Use and Health (NSDUH) and 3% of adults in the general population meet NSDUH criteria for severe SUD. While homelessness among adults increased sharply from 2019 to 2025, the share of adults with SMI or SUD changed little, suggesting the increase was not concentrated among people with behavioral health conditions, and likely reflects broader pressures, such as rising housing and living costs. A Government Accountability Office (GAO) report found that a $100 increase in median rental price was linked to a 9% increase in estimated homelessness rate. Other research found increases in the number of people experiencing homelessness from 2019 to 2024 were more strongly associated with reductions in eviction moratoriums and climate-related events.
As of 2024, there were about 50 million immigrants residing in the U.S. Within this group, there were 24 million noncitizen immigrants, including lawfully present and undocumented immigrants, and 26 million naturalized citizens, who accounted for about 7% and 8% of the total population, respectively. Actions taken by the Trump administration and Congress will likely have major impacts on health and health care for immigrant families, including increasing the number of uninsured immigrants.
While undocumented immigrants have been ineligible for federally-funded health coverage programs under longstanding policy, the 2025 reconciliation law includes new eligibility restrictions for many lawfully present immigrants, including refugees and asylees, to access Medicaid and the Children’s Health Insurance Program (CHIP), subsidized Affordable Care Act (ACA) Marketplace, and Medicare coverage. The CBO estimates that 1.4 million lawfully present immigrants could lose health coverage by 2034 due to the law’s eligibility changes. Research shows that having insurance makes a difference in whether and when people access needed care. Those who are uninsured often delay or go without needed care, which can lead to worse health outcomes over the long-term that may ultimately be more complex and expensive to treat.
This brief provides data on health and health care experiences of uninsured immigrant adults based on a KFF survey of immigrant adults ages 18 and older conducted in partnership with The New York Times in Fall 2025. The data provide insight into how the projected coverage losses under the 2025 reconciliation law may impact health and health care for immigrant families as more lawfully present immigrants become uninsured. Key takeaways include the following:
Compared to those with insurance coverage, uninsured immigrant adults are more likely to not have a usual source of care and to delay or go without health care. Half of uninsured immigrant adults say that they do not have a usual source of health care other than the emergency room compared to about one in six (16%) of their insured counterparts. Further, half of uninsured immigrant adults report skipping or postponing care, twice the share of those with coverage (50% vs. 26%). Nearly one in five (18%) of all uninsured immigrant adults said their health got worse as a result of skipping or postponing health care.
Cost or lack of coverage is the primary reason uninsured immigrant adults cite for skipping or postponing care, reflecting the role insurance plays in facilitating access to care. Almost half (46%) of uninsured immigrant adults say they delayed or went without care because of cost or lack of insurance compared to 14% of insured immigrant adults. Overall, about seven in ten (69%) uninsured immigrant adults say they have had problems paying for health care (62%), housing (41%), or food (36%) in the past 12 months. In comparison, over four in ten (44%) insured immigrant adults report problems paying for health care (31%), housing (29%), or food (26%) in the past 12 months.
Consistent with other researchdemonstrating that parental coverage affects children’s health coverage and access to care, uninsured immigrant parents are three times as likely as those with insurance coverage (32% vs. 10%) to say they have at least one child who is uninsured. Further, over four in ten (44%) uninsured immigrant parents say any of their children delayed or skipped health care in the past 12 months compared to about a quarter (26%) of those with insurance coverage.
Findings
Characteristics of Uninsured Immigrants
About one in seven (15%) immigrant adults age 18 and older report being uninsured as of 2025, with higher uninsured rates among those who are noncitizens, Hispanic, lower income, have limited English proficiency (LEP), or live in states with less expansive coverage. Nearly half of likely undocumented immigrant adults (46%) and one in five lawfully present immigrant adults (21%) report being uninsured compared to fewer than one in ten of their U.S.-born (6%) and naturalized citizen (7%) counterparts (Figure 1). Uninsured rates also are higher among immigrant adults who are Hispanic (27%), have lower incomes (household income of less than $40,000 per year) (23%), or have LEP (23%) compared to their White (5%), higher income (household income of $90,000 or more per year) (4%), and English proficient (10%) counterparts, likely reflecting that these groups also are more likely to be noncitizens. Further, immigrant adults who live in states that provide less expansive coverage, including not adopting the ACA Medicaid expansion to all low-income adults or any coverage expansions for immigrants, are about twice as to be uninsured compared with those living in states with more expansive policies (23% vs. 11%).
Access to Health Care
Half of uninsured immigrant adults say they do not have a usual source of care other than an emergency room (Figure 2). In comparison, about one in six (16%) insured immigrant adults say they do not have a usual source of care other than an emergency room. Research shows that having a usual source of care is associated with better access to health care even after controlling for demographic and socioeconomic characteristics.
Uninsured immigrant adults are about twice as likely as those who are insured to report delaying or going without needed care (50% vs. 26%) (Figure 3). Delaying or going without needed care can contribute to health problems becoming worse and taking more time and resources to treat. Nearly one in five (18%) of uninsured immigrant adults say they skipped or postponed health care and their health got worse compared to 9% of insured immigrant adults.
Uninsured immigrant adults are more likely than those with insurance to cite cost or lack of coverage and immigration-related concerns as reasons for delaying or going without care. Almost half (46%) of uninsured immigrant adults say they delayed or went without care because of cost or lack of insurance compared to 14% of insured immigrant adults (Figure 4). Additionally, 16% of uninsured immigrant adults identified concerns about their or a family member’s immigration status as a reason compared to 4% of insured immigrant adults, likely reflecting that uninsured immigrants include a higher share of likely undocumented immigrants. Similar shares of uninsured (14%) and insured immigrant adults (12%) cited not being able to find services at a time or location that worked for them as a reason for delaying or going without care. Language barriers were also cited by some of those with LEP.
Likely reflecting their lower incomes, uninsured immigrant adults report more difficulty paying for basic needs, including health care, compared to those with insurance. Six in ten uninsured immigrant adults say that it has been harder to earn a living since January 2025 (60%) and about seven in ten (69%) say they have had problems paying for basic necessities such as health care (62%), housing (41%), or food (36%) in the past 12 months (Figure 5). These shares are higher compared to those with insurance coverage, with the largest gap in difficulty paying for health care (62% vs. 31%).
Impacts of Parental Coverage on Children’s Coverage and Access to Care
Uninsured immigrant parents are about three times as likely as insured immigrant parents (32% vs. 10%) to report at least one uninsured child as of 2025 (Figure 6). Further, over four in ten (44%) uninsured immigrant parents say any of their children delayed or skipped health care in the past 12 months compared to about a quarter (26%) of those with insurance coverage. These findings are consistent with other research showing that parental coverage impacts children’s access to health coverage and care.
The latest KFF Health Tracking Poll finds that though a majority of the public has heard of the abortion medication mifepristone, public awareness of its prevalence and longstanding safety record is limited. Six in ten adults say they have heard of mifepristone, but just one in four (26%) correctly identify abortion pills as the most common way abortions are administered in the U.S. Additionally, while about four in ten (44%) adults say abortion pills are safe when taken according to a health care provider’s instruction, one in seven (15%) say they are unsafe and four in ten (41%) are unsure of their safety.
The FDA’s re-evaluation of the safety of mifepristone is now underway, following Health and Human Services Secretary Robert F. Kennedy Jr.’s call to the federal health agency late last year. Public confidence in the FDA to make decisions based on science when reviewing the safety of mifepristone is somewhat limited as slightly more than half (54%) say they have little to no confidence at all in this regard. Partisans differ over the motivation behind the review, with a majority of Republicans saying it was mostly to protect the health and safety of women and a similar majority of Democrats saying it was to make abortion pills more difficult to access.
Majorities of the public oppose laws restricting medication abortion, though Republicans lean more in support. Two-thirds of the public – including large majorities of Democrats and independents – oppose laws that would ban mifepristone nationwide (65%) and laws that would make it a crime for health care providers to mail abortion pills to patients in states with abortion bans (64%). Republicans are notably split on the issue of banning mifepristone nationwide (52% support, 48% oppose), while a majority (57%) of Republicans support laws criminalizing health care providers mailing abortion pills to patients in states with abortion bans.
While health costs and the future of government health programs are key health issues for voters in the upcoming midterm elections, a majority of voters (57%) say it is “extremely” or “very important” for candidates to discuss abortion policy. Since the Dobbs decision, abortion policy remains a core issue for Democratic voters. Four in ten Democratic voters say abortion policy is “extremely important” for 2026 midterm candidates to talk about, compared to fewer independent (22%) and Republican (20%) voters. The Democratic Party has the advantage over the Republican Party when it comes to which political party voters trust more on the issue of abortion (39% vs. 28%, respectively), though nearly three in ten (27%) voters say they trust neither party on this issue. Among independent voters, the Democratic Party has the edge over the Republican Party (35% vs. 19%), though four in ten say they trust neither party on the issue.
Sizeable Shares of the Public Are Unaware of Mifepristone’s Prevalence and Safety
Mifepristone, commonly known as the abortion pill, is one of two drugs that are used in medication abortion, the most common abortion method in the United States. While mifepristone has been approved by the FDA for over 25 years and has a longstanding safety record, Congressional Republicans and anti-abortion groups continue to call into question the safety of the abortion pill. The latest KFF Health Tracking Poll finds six in ten (60%) adults have heard of the abortion medication mifepristone, including two-thirds (66%) of women of reproductive age (ages 18 to 49). Public awareness of mifepristone has risen sharply since the overturning of Roe v. Wade and the lawsuits and public scrutiny of the abortion pill that followed, increasing from 31% in January 2023 to about six in ten since then.
Despite increased awareness of mifepristone, the public is still largely unaware that most abortions in the U.S. are done by taking abortion pills. About one-quarter of adults (26%) correctly identify abortion pills as the most common way abortions are administered in the United States, while another quarter (26%) incorrectly say medical procedures are the most common, and nearly half (48%) say they are not sure. Democrats, independents, women of reproductive age, and adults who identify as “pro-choice” are most likely to correctly say most abortions in the U.S. are done using abortion pills. Yet, even among these groups, about half say they are not sure how most abortions in the U.S. are provided.
A large share of the public is unaware of the abortion medication’s longstanding safety record. Less than half (44%) of adults say abortion pills are safe when taken according to a health care provider’s instruction, about three times larger than the share who say they are unsafe (15%). Still, four in ten (41%) adults are “not sure” about the safety of abortion pills when administered according to a health care provider’s instruction.
Similar shares of adults overall say abortion pills are safe compared to last year (42% in November 2025). Among women ages 18 to 49, the group who would be most directly impacted by changes to the availability of mifepristone, about half (52%) say abortion pills are safe when taken as directed by a health care provider, a share that has increased from four in ten (41%) last November. Currently, one in five (19%) women ages 18-49 say they are not safe and three in ten are not sure of their safety.
Looking at women across racial and ethnic groups, Black women are less likely than White women to say abortion pills are safe (33% vs. 51%) and more likely than White women to say they are unsure how safe they are (51% vs. 35%). Among Hispanic women, about four in ten (42%) say abortion pills are safe, while a similar share (41%) say they are unsure.
Partisans differ in their assessment of the safety of mifepristone, with about six in ten Democrats (61%) saying medication abortion pills are “very” or “somewhat safe,” compared to about four in ten (44%) independents and three in ten Republicans. Larger shares of independents (42%) and Republicans (50%) than Democrats (30%) say they are not sure whether abortion pills are safe.
Public Divides Over Motives Behind FDA Review of Mifepristone and Ability to Conduct a Scientific Review
Last September, Health and Human Services Secretary Robert F. Kennedy Jr. and the FDA Commissioner at the time—Dr. Marty Makary—wrote to Republican state attorneys general in response to states’ concerns about mifepristone, announcing the FDA would conduct another review of the abortion pill’s safety. This new review has now begun and FDA officials are investigating whether the abortion pill’s current Risk Evaluation and Mitigation Strategy (REMS) is “sufficient to protect women from unstated risks” following the 2023 update that removed the in-person dispensing requirement and therefore made the drug accessible through telehealth. Depending on the safety review’s conclusions, the FDA could restrict mifepristone access, potentially limiting its availability through telehealth and mail, limiting the ability of advance practice clinicians from prescribing the medication, or removing pharmacies as authorized dispensers.
The latest KFF Health Tracking Poll finds a slim majority (54%) of the public has little to no confidence in the FDA to make decisions based on science when it comes to reviewing the abortion pill’s safety—including one in four (24%) who say they have no confidence “at all.” Fewer than half (46%) have “a lot” (10%) or “some” (36%) confidence. Among women of reproductive age, about half (52%) say they have little to no confidence, while 47% say they have at least some confidence. This limited trust is consistent with KFF’s Health Information and Trust research, which has found less than half of adults have confidence in the FDA’s ability to fulfill core responsibilities, such as making recommendations about childhood vaccine schedules and ensuring the safety and effectiveness of vaccines.
Across partisans, about half of Democrats and Republicans say they have little or no confidence (47% of Democrats; 53% of Republicans) in the FDA to make decisions based on science when evaluating the safety of mifepristone and similar shares say they have least some confidence (53% of Democrats; 47% of Republicans). Among independents, most (57%) say they have little to no confidence at all in the FDA in this regard.
When asked about the motivation behind Secretary Kennedy’s request to the FDA to review the safety of the abortion pill, the public is split, with half (51%) saying this decision was mostly to “make it more difficult to access abortion pills,” and another half (48%) saying it was mostly to “protect the health and safety of women.”
Notably, Democrats are more likely to say the reasoning behind Kennedy’s request was to “make it more difficult to access abortion pills” (71%), while Republicans are more likely to say it was to “protect the health and safety of women” (73%). Independents are split with about half saying the decision was to make abortion access more difficult (53%) and half saying it was to protect women’s safety (47%).
Women ages 18 to 49 are also divided on the motivation behind Secretary Kennedy’s request, with about half saying his call to review mifepristone was to “make it more difficult to access abortion pills” (55%) and another half saying it was to “protect the health and safety of women” (45%).
The latest KFF Health Tracking Poll finds majorities oppose laws that would place further restrictions on medication abortion. Around two-thirds of adults say they oppose banning the use of mifepristone, or medication abortion, nationwide (65%) and a similar share oppose making it a crime for health care providers to mail abortion pills to patients in states where abortion is banned (64%).
Eight in ten Democrats (81%) and two-thirds of independents (67%) say they oppose banning mifepristone entirely. However, Republicans are split in their views, with half (52%) saying they support laws that would ban the abortion pill nationwide while a similar share (48%) say they are opposed. And, while large majorities of Democrats (79%) and independents (66%) oppose laws making it a crime to mail abortion pills to patients in states with abortion bans, a majority (57%) of Republicans support such laws while 43% are opposed.
Unsurprisingly, about eight in ten adults who identify as pro-choice oppose the restrictive abortion laws asked about in this KFF Health Tracking Poll (78% banning mifepristone; 79% criminalizing the mailing of abortion pills to patients in states with abortion bans). Among those who identify as pro-life, majorities say they support these laws (57% and 61%, respectively), though sizeable shares—about four in ten—say they would oppose laws banning mifepristone nationwide (43%) and criminalizing the mailing of abortion pills to abortion-banned states (38%).
Voters’ Attitudes Toward Abortion in the Upcoming Midterm Elections
While health costs and the future of government health programs such as Medicare and Medicaid are the health issues taking center stage in this election, a majority of voters (57%) say it is “extremely” (27%) or “very important” (31%) for candidates to talk about abortion policy. Looking at voters by views on abortion, slightly larger shares of pro-choice voters say abortion is extremely important for 2026 midterm candidates to discuss compared to their pro-life counterparts (30% vs. 22%).
Previous election-related polling at KFF has found that, since the Dobbs decision, voters who view abortion policy as an important issue are disproportionately Democrats, and this election is no exception. Three-quarters (73%) of Democratic voters say abortion policy is important for 2026 midterm candidates to talk about, including four in ten who say it is “extremely important.” Notably, the share who say abortion policy is “extremely important” is consistent among Democratic voters, regardless of whether those voters live in states where abortion is either banned or limited (40%) or where abortion is available (39%). In contrast, fewer independent (22%) and Republican (20%) voters say abortion policy is extremely important for midterm candidates to discuss.
Among Republican and Republican-leaning independent voters who support the Make America Great Again movement, nearly one in four (23%) say abortion policy is extremely important for candidates to discuss, compared to one in ten (11%) non-MAGA-supporting Republicans and Republican-leaning independents who say the same. About two-thirds of MAGA Republicans identify as pro-life (63%), while about four in ten (44%) non-MAGA supporting Republicans identify as pro-choice.
The Democratic Party has the advantage over Republicans when it comes to which political party voters trust more on the issue of abortion (39% vs. 28%, respectively), though nearly three in ten (27%) voters say they trust neither party on this issue. Women voters ages 18 to 49 and younger voters (ages 18 to 29) are notably among the most likely to trust the Democratic Party more (46% and 52%, respectively).
Unsurprisingly, voters are largely split across partisan identification when it comes to which political party they trust more on the issue of abortion. Among independent voters, the Democratic Party has the edge over the Republican Party (35% vs. 19%), though four in ten (41%) say they trust neither party on the issue.
Methodology
This KFF Health Tracking Poll/KFF Tracking Poll on Health Information and Trust was designed and analyzed by public opinion researchers at KFF. The survey was conducted June 25 – June 30, 2026, online and by telephone among a nationally representative sample of 1,321 U.S. adults in English (n=1,238) and in Spanish (n=83). The sample includes 1,015 adults (n=69 in Spanish) reached through the SSRS Opinion Panel either online (n=990) or over the phone (n=25). The SSRS Opinion Panel is a nationally representative probability-based panel where panel members are recruited randomly in one of two ways: (a) Through invitations mailed to respondents randomly sampled from an Address-Based Sample (ABS) provided by Marketing Systems Groups (MSG) through the U.S. Postal Service’s Computerized Delivery Sequence (CDS); (b) from a dual-frame random digit dial (RDD) sample provided by MSG. For the online panel component, invitations were sent to panel members by email followed by up to three reminder emails.
Another 306 (n=14 in Spanish) adults were reached through random digit dial telephone sample of prepaid cell phone numbers obtained through MSG. Phone numbers used for the prepaid cell phone component were randomly generated from a cell phone sampling frame with disproportionate stratification aimed at reaching Hispanic and non-Hispanic Black respondents. Stratification was based on incidence of the race/ethnicity groups within each frame. Among this prepaid cell phone component, 142 were interviewed by phone and 164 were invited to the web survey via short message service (SMS).
Respondents in the prepaid cell phone sample who were interviewed by phone received a $15 incentive via a check received by mail or an electronic gift card incentive. Respondents in the prepaid cell phone sample reached via SMS received a $10 electronic gift card incentive. SSRS Opinion Panel respondents received a $5 electronic gift card incentive (some harder-to-reach groups received a $10 electronic gift card). In order to ensure data quality, cases were removed if they failed two or more quality checks: (1) attention check questions in the online version of the questionnaire, (2) had over 30% item non-response, or (3) had a length less than one quarter of the mean length by mode. Based on this criterion, 1 case was removed.
The combined cell phone and panel samples were weighted to match the sample’s demographics to the national U.S. adult population using data from the Census Bureau’s 2025 Current Population Survey (CPS), September 2023 Volunteering and Civic Life Supplement data from the CPS, and the 2026 KFF Benchmarking Survey with ABS and prepaid cell phone samples. The demographic variables included in weighting for the general population sample are gender, age, education, race/ethnicity, region, civic engagement, frequency of internet use and political party identification. The weights account for differences in the probability of selection for each sample type (prepaid cell phone and panel). This includes adjustment for the sample design and geographic stratification of the cell phone sample, within household probability of selection, and the design of the panel-recruitment procedure.
The margin of sampling error including the design effect for the full sample is plus or minus 3 percentage points. Numbers of respondents and margins of sampling error for key subgroups are shown in the table below. For results based on other subgroups, the margin of sampling error may be higher. Sample sizes and margins of sampling error for other subgroups are available on request. Sampling error is only one of many potential sources of error and there may be other unmeasured error in this or any other public opinion poll. KFF public opinion and survey research is a charter member of the Transparency Initiative of the American Association for Public Opinion Research.
The recently proposed 2027 Medicare Hospital Outpatient Perspective Payment System (OPPS) rule from the Centers for Medicare & Medicaid Services (CMS) includes a proposal to reduce Medicare’s reimbursement for 340B drugs. The proposal would reduce reimbursement for 340B drugs from average sales price (ASP) plus 6% (what Medicare generally pays for Part B outpatient drugs administered by providers) to ASP minus 33.4%, a 37% reduction. CMS indicated that this change would better align Medicare reimbursement with hospitals’ costs of acquiring 340B drugs.
The 340B Drug Pricing Program requires drug manufacturers participating in Medicaid to sell outpatient drugs to eligible nonprofit and government providers at a substantial discount, allowing providers to earn larger profits when being reimbursed for 340B drugs. The intent of the program is to support providers, such as certain disproportionate share hospitals and federally qualified health clinics, that care for low-income and other underserved populations. Critics have raised concerns that the 340B program, which has grown substantially over time, is not well-targeted; that savings from the program are not shared with patients; and that the program incentivizes hospitals to acquire clinics and physician practices in order to extend 340B discounts to those settings, enabling them to generate more revenue. Supporters of the program say that revenues generated by the difference between Medicare (and other payer) reimbursement for 340B drugs and the discounted price help 340B providers care for underserved populations and invest in operations.
CMS based the amount of the proposed payment reduction on a cost acquisition survey of 340B drugs completed by hospitals in early 2026. This proposed change revives an earlier effort by CMS to reduce Medicare payments for 340B drugs that was implemented in 2018 under the first Trump administration, but the Supreme Court overturned that rule in 2022 because the agency had not first conducted a cost acquisition survey. If finalized, CMS’s proposed Medicare 340B payment reduction would take effect on January 1, 2027, and would have disparate effects on different types of hospitals, as described more below.
CMS’s proposed cut to 340B drug reimbursement would reduce Medicare spending on 340B drugs by an estimated $4.85 billion in 2027, while increasing spending on non-drug outpatient services by the same amount because of budget neutrality requirements. Under federal law, CMS is generally required to maintain the same amount of aggregate spending through OPPS regardless of reimbursement changes (i.e., maintain budget neutrality). Based on this requirement, CMS proposed an 8.44% across-the-board increase in payments for non-drug outpatient services covered under the OPPS, which the agency estimates will offset the impact of cuts to spending on 340B drugs in 2027.
The budget neutrality requirement means that savings from reductions in 340B payments to 340B hospitals would be redistributed to both 340B and non-340B hospitals through higher payments for non-drug outpatient services. Similarly, Medicare beneficiaries would face lower cost sharing on 340B drugs (e.g., based on 20% coinsurance applied to a lower amount) but higher cost sharing for non-drug outpatient hospital services. CMS estimates that Medicare beneficiaries who use 340B drugs would save $1.15 billion in total in 2027, but cost sharing would increase for beneficiaries who use non-drug outpatient hospital services based on Medicare’s proposed 8.44% payment increase.
Proposed cuts would reduce revenues among safety-net hospitals while increasing revenues among for-profit hospitals, among other differences. For 340B hospitals, total Medicare revenues would decrease or increase depending on how reliant they are on revenues from 340B drugs versus non-drug outpatient services, but non-340B hospitals would experience revenue increases only based on the higher payment rate for non-drug outpatient services. CMS’s proposal to reduce reimbursement for 340B drugs would exempt rural sole community hospitals (SCHs) (rural hospitals that are the only source of short-term, acute inpatient care in a region), children’s hospitals, and PPS-exempt cancer hospitals. Changes would not affect hospitals that are not reimbursed under the OPPS, including critical access hospitals (CAHs), which make up the majority of rural hospitals.
In the aggregate, some types of hospitals would lose or benefit more from these changes than others, based on estimates from CMS (Figure 1):
Safety-net hospitals would face a 5.8% net reduction of OPPS revenue under this proposal (see figure notes for definition of “safety-net hospitals”). Other types of hospitals would also see net reductions in OPPS revenue in the aggregate, including large urban hospitals (with 500 beds or more) (-5.2%), major teaching hospitals (-4.3%), government hospitals (-3.0%), and nonprofit hospitals (-0.5%). Some hospitals that would see the largest decrease in revenue likely fall into more than one of these categories (e.g., major teaching hospitals tend to be large urban hospitals).
For-profit hospitals would see a 7.4% net increase in OPPS revenues. For-profit hospitals are not eligible for the 340B program and so would only see increases in reimbursement for non-drug outpatient services. Other types of hospitals would also face net increases in Medicare OPPS reimbursement in aggregate, including rural SCHs (5.7%), small urban hospitals (with 0 to 99 beds) (4.8%), and non-teaching hospitals (3.5%).
Reductions in 340B payments could add to the financial challenges facing safety-net hospitals while increasing margins of for-profit hospitals. Safety-net hospitals havelower operating margins than average and so could have an especially difficult time absorbing any revenue losses from the 340B payment cut, while for-profit hospitals have muchhigher operating margins than the average hospital. Additionally, safety-net hospitals, which are particularly dependent on Medicaid revenues, are likely to be disproportionately affected by the 2025 reconciliation law, as it achieves most of its health care savings through federal Medicaid spending reductions.
The substantial growth of the 340B program in recent years has led hospitals, pharmaceutical companies, and policymakers to focus on whether and how to change the program. At the federal level, lawmakers haveproposedoptions that would preserve or narrow the scope of the program and have proposed increasing transparency around the program, such as by requiring hospitals to report 340B savings. At the state level, some states have passed laws that would preserve the ability of hospitals to use multiple contract pharmacies to dispense 340B drugs, among other things. Other states have implemented requirements for hospitals to disclose the amount of savings generated from the 340B program (as required by Minnesota) or how those savings are spent.
Some pharmaceutical companies have attempted to start providing 340B drug discounts through a rebate model, an approach that would require hospitals to purchase 340B drugs at a non-discounted price and receive post-sale rebates after submitting claims information. These efforts have been halted by the courts due to lack of authorization from HHS, the agency that administers the 340B program. In 2025, the Trump administration attempted to implement the 340B Rebate Model Pilot Program, but a court halted the pilot after a lawsuit was filed by the hospital industry. HHS has recently requested information from stakeholders on a revised rebate model pilot.
The 2025 reconciliation law requires 44 states to condition Medicaid eligibility for adults in the Affordable Care Act (ACA) Medicaid expansion group and enrollees in certain waiver programs, on meeting work requirements starting January 1, 2027, or sooner at state option. While the law specifies mandatory exclusions, including for individuals who are “medically frail,” the approach to determining medical frailty specified in the June 2026 interim final rule could make it difficult for some people to qualify for this exclusion. Medicaid expansion provides coverage to many adults with significant health care needs, including some with disabilities who are applying for the Supplemental Security Income Program (SSI). This coverage could be at risk for some because of the planned approach to defining medical frailty.
SSI is a means-tested federal program administered by the Social Security Administration (SSA) that pays monthly cash assistance to people with limited resources who are unable to work because of a disability and generally qualifies people to receive health coverage through Medicaid. Once approved for SSI, Medicaid enrollees would not be subject to work requirements, but the application for SSI can be a lengthy and complicated process, spanning months, if not years, during which time applicants may be at risk of uninsurance because they are unable to work. Medicaid can fill coverage gaps during the SSI application period, particularly in states that have adopted the Medicaid expansion.
This issue brief finds that the percent of new SSI enrollees ages 19 through 64 with Medicaid prior to SSI entitlement is twice as high in ACA expansion states as it is in non-expansion states, and in 2023, over 100,000 new SSI enrollees had ACA Medicaid coverage prior to their SSI entitlement. It also describes the lengthy SSA process for determining SSI eligibility, particularly assessing ability to work, and how the current approach to determining medical frailty could cause some SSI applicants to undergo concurrent assessments of their ability to work using different processes and criteria. The new documentation requirements and processes could cause some people with disabilities to lose Medicaid coverage or be denied Medicaid enrollment while they are waiting on their SSI determination.
How does Medicaid provide coverage for people during the SSI application process?
Medicaid provides coverage for many people with disabilities, including those who are applying for SSI.One in five Medicaid enrollees have a disability, including 43% of adults ages 50-64, but only one-third of these individuals receive SSI income, generally qualifying for Medicaid for that reason. The remaining people with disabilities are covered through different Medicaid eligibility pathways, including the ACA Medicaid expansion. Because of the lengthy process for obtaining an SSI determination and the fact that people who are applying for SSI are unable to work, many people applying for SSI rely on Medicaid to avoid going uninsured.
In 2023, 223,000 SSI applicants ages 19 through 64 had Medicaid while they were waiting for an SSI determination, including over 106,000 with coverage through the ACA expansion. KFF analyzed detailed Medicaid administrative data to identify people who were ages 19 through 64 and became eligible for Medicaid because of SSI during the calendar year 2023 and whether those enrollees had Medicaid coverage in the months prior to their SSI-based eligibility (see Methods). Among the 337,000 people who started SSI during the calendar year, over 200,000 had prior Medicaid coverage through a different eligibility pathway, with roughly half receiving that coverage through the ACA expansion.
In ACA expansion states, 76% of new SSI enrollees ages 19 through 64 had Medicaid coverage through a different eligibility pathway prior to their disability determination (including 42% who were covered through the Medicaid expansion) compared with only 33% in non-expansion states (Figure 1). In both expansion and non-expansion states, roughly 1 in 3 new SSI enrollees ages 19 through 64 were enrolled in non-ACA Medicaid coverage (such as coverage for parents and caretakers) prior to becoming eligible for SSI. However, in expansion states, an additional 42% of new SSI enrollees were enrolled in Medicaid through the expansion, covering over 100,000 people in 2023. New SSI enrollees who were not covered by Medicaid prior to their SSI approval were likely uninsured because of their low income and inability to work.
How do people demonstrate eligibility for SSI?
To be eligible for SSI, people must have limited income (defined as no more than $2,073 per month in 2026), limited resources (defined as no more than $2,000 for an individual or $3,000 for a couple), and a disability that affects their ability to work for at least a year or result in death or be age 65 and older.
For applicants under age 65, demonstrating a disability is often the most complicated part of the SSI application process, involving a lengthy five-step process that starts by proving one is not gainfully employed (Figure 2). The federal government establishes verification processes that all states must use to determine applicants’ disability status, and funds state Disability Determination Services (DDS) offices to carry out these processes. The same processes are used for SSI and for Social Security Disability Insurance. Illustrating the high costs of this lengthy process, the Social Security Administration provided states with $2.6 billion in Fiscal Year (FY) 2025 to run the DDS offices. The first step requires people to demonstrate that their current earnings are below the threshold of “substantial gainful activity” (SGA, $1,690 per month in 2026).
The second step assesses whether applicants have a severe impairment, where impairment is defined based on which body system is affected. For adults, impairments are classified into the following categories with associated medical criteria: musculoskeletal disorders, special senses and speech, respiratory disorders, cardiovascular system, digestive disorders, genitourinary disorders, hematological disorders, skin disorders, endocrine disorders, congenital disorders that affect multiple body systems, neurological disorders, mental disorders, cancer, and immune system disorders.
The third step assesses whether the impairment qualifies as a disability that wouldn’t require further demonstration of an inability to work using established criteria for disabilities. Some impairments allow applicants to qualify for SSI without further demonstrating an inability to work, including blindness and several hundred specific disorders or conditions included in the “compassionate allowance program,” which quickly identifies diseases and other conditions that meet SSA’s standards for disability benefits. Examples of such conditions include Amyotrophic Lateral Sclerosis (ALS), certain cancers, and Duchenne Muscular Dystrophy. SSA reports that between 2008 and 2025, the agency approved more than 1 million people (for SSI and Social Security Disability Insurance combined) through the compassionate allowance program.
The final two steps respectively assess peoples’ ability to engage in “past relevant work” or any job in the national economy that is feasible considering the applicant’s residual functional capacity, age, education, and work experience. The SSA makes this assessment based on information provided in Form 3368 which requires people to provide personal information including their English language proficiency, current work activity, job history over the last 15 years, the claimed disability onset date, list of medical conditions, prescription list, and medical treatment history. Medical records from providers can be submitted with the application. Along with this form, the SSA will request any missing medical records and may request that the person have a consultative medical examination by an SSA medical consult. SSA also compares information about people’s jobs from the past 5 years (such as job title and pay; tasks performed; tools, machinery, and equipment used; knowledge, skills, and ability required; physical demands; and environmental conditions) with tables of rules about the requirements for jobs in the national economy.
Assessing ability to engage in any job requires information about all jobs in the economy, which can be difficult to implement in practice, and SSA is currently relying on outdated job information. SSA’s current jobs listing comes from the Department of Labor’s Dictionary of Occupational Titles which was last updated in 1991 and is not currently used by the Department of Labor. Since FY 2021, SSA has partnered with the Department of Labor to develop a survey that will be the main source of updated occupational information, but that new system has not yet been implemented. Congressional Research Services reports that between FYs 2012 and 2024, SSA spent $300 million on this project.
The application for disability benefits can be a lengthy and complicated process, spanning months, if not years, meaning hundreds of thousands of people are currently waiting for determinations. As of May 2026, the initial processing time for all disability applications was 184 days—over 6 months—and roughly 862,000 people were waiting for their initial determinations. (This number includes applications for SSI and applications for Social Security Disability Insurance, a related program that uses the same disability determination process.) Many people receive initially unfavorable decisions and choose to appeal, which can considerably lengthen the process. Having a lawyer increases the likelihood of being approved at the initial stage and, on average, can reduce the time it takes to reach a final decision by nearly one year.
How might work requirements affect Medicaid coverage for people during the SSI application process?
Starting in January 2027, individuals applying for or enrolled in coverage through the ACA expansion and in certain waiver programs will be required to work or engage in qualifying activities, such as volunteer community service, for 80 or more hours per month, attend school half-time, unless they qualify for an exemption or exclusion from the requirements. SSI applicants enrolled in the ACA expansion will be subject to these new requirements. Applicants who meet the SSI criteria do not have to meet the community engagement requirements, but there may be challenges for them in proving their eligibility for the medical frailty exclusion while they are applying for SSI.
People applying for SSI are generally unable to work, but current rules could make it challenging for them to qualify for a medical frailty exclusion. Because individuals must have earnings below the SGA level to be eligible for SSI, they are unlikely to be able to work 80 or more hours in a month. Additionally, most people with new impairments significant enough to qualify for SSI will likely also face challenges meeting the Medicaid community engagement requirements through education or volunteering. Instead, to obtain or retain Medicaid, individuals applying for SSI who are subject to the work requirements will need to qualify for an exclusion from the requirements, most likely through the medical frailty exclusion. The interim final rule implementing Medicaid work requirements issued on June 1, 2026, adopts a restrictive definition of medical frailty that requires individuals to have a physical or mental health condition that impairs their ability to meet community engagement requirements. This two-part test for medical frailty will require navigating a verification process that may lead to people losing coverage because they cannot provide the required documentation, even though they qualify for the exclusion.
Different requirements for Medicaid eligibility determinations mean SSI applicants covered through the Medicaid expansion could face two concurrent assessments of their ability to work: one for SSI and one for Medicaid. Medicaid eligibility determinations of whether an individual meets the medical frailty exclusion will need to be done on a faster timeline than SSI determinations. States are required to process Medicaid applications for individuals who qualify based on income within 45 days, and starting January 1, 2027, they must conduct renewals for individuals enrolled through the Medicaid expansion every six months instead of annually. That makes it likely that many SSI applicants will not have a disability determination before they have an assessment of their ability to work to meet the medical frailty exclusion from Medicaid work requirements. These new requirements could place additional administrative burdens on individuals who are experiencing significant physical or mental health challenges and could cause people to lose health insurance while they wait for an SSA disability determination.
In contrast to the SSI determination process, the Medicaid interim final rule is not clear on how states should determine ability to work in the context of Medicaid work requirements, which will lead states to adopt different approaches that could put coverage at risk for some SSI applicants. The rule requires states to automate, to the extent possible, verification of the Medicaid medical frailty exclusion using claims and encounter data before requesting information from the individual. However, claims data alone will often be insufficient to assess whether a condition impairs the ability to work or engage in community service, and claims data do not include information about people’s ability to engage in the activities of daily living (one measure of disability) or their overall functional status and frailty. Given the broader Medicaid definition of community engagement activities, states will need to assess people’s ability to participate in education or volunteer activities in addition to doing any work in the national economy. The lack of information about minimum acceptable practices raises questions about what standards states will use to assess ability to work, and what types of documentation will be sufficient to prove the inability to comply with the requirements. As they develop processes for verifying medical frailty, states will rely more heavily on provider determinations or other documentation and self-attestation, to the extent permitted by the rule, for individuals who cannot be automatically verified. Self-attestation will be permitted in 2027 and once for each individual in 2028. Absent clearer guidance, the approaches states develop will differ. This variability coupled with enhanced documentation requirements could cause some people with disabilities to lose Medicaid coverage or be denied Medicaid while they are waiting on their SSI determination.
This work was supported in part by Arnold Ventures. KFF maintains full editorial control over all of its policy analysis, polling, and journalism activities.
Methods
Data: Data are from the 2023 Transformed Medicaid Statistical Information System (T-MSIS) Analytic Files (TAF) Research Identifiable Files (RIF) files.
State inclusion criteria: National estimates include enrollees living in 49 states and DC and exclude residents in the U.S. territories. Non-expansion states include AL, FL, GA, KS, MS, NC (Medicaid expansion started 12/1/23), SC, TN, TX, and WY. WI is excluded from this analysis because it has an 1115 waiver that offers coverage similar to the ACA expansion. The pre-SSI Medicaid coverage rates look much more similar to those of an ACA expansion state, but the T-MSIS data do not clearly identify people enrolled in the 1115 coverage.
Identifying new SSI enrollees using Medicaid administrative data: Enrollees are classified as new SSI enrollees if their latest eligibility group in the year is SSI (having ELGBLTY_GRP_CD_LTST with value of 11-22, 37, 38, 40, or 41) but in January, they are either not enrolled in Medicaid or they are enrolled through some other pathway (ELGBLTY_GRP_CD_01 not having value of 11-22, 37, 38, 40, or 41). The analysis is limited to enrollees ages 19 through 64 who are in Medicaid only (and not CHIP) during the year.
Assessing prior Medicaid coverage in the year for new SSI enrollees: Monthly eligibility group codes (ELGBLTY_GRP_CD_01-ELGBLTY_GRP_CD_12) are used to determine the first month of SSI enrollment (first monthly eligibility group code with value of 11-22, 37, 38, 40, or 41). Then, all monthly eligibility group codes prior to the first month of SSI enrollment are used to assess prior Medicaid enrollment during the year as follows:
Prior Medicaid coverage through the expansion pathway: having at least one monthly eligibility group code indicating enrollment through the ACA expansion group (value of 72, 73, 74, or 75) before the first month of SSI enrollment.
Prior Medicaid coverage through non-expansion pathway: having at least one non-missing monthly eligibility group code and no monthly eligibility group codes indicating enrollment through the ACA expansion group (value of 72, 73, 74, or 75) before the first month of SSI enrollment.
No prior Medicaid coverage: eligibility group codes for all months before the first month of SSI enrollment are missing.
Following several years of rapid enrollment growth in the Affordable Care Act (ACA) Marketplaces that corresponded with temporary enhanced premium tax credits, enrollment fell for the first time in seven years in 2026, when those tax credits expired. The Assistant Secretary for Planning and Evaluation (ASPE) of the Department of Health and Human Services reported that enrollment declined by nearly three million people between 2025 and 2026.
Earlier federal data and analysis had focused on plan selections, or sign-ups, which decreased by about one million (5%) from last year, but plan selections do not account for enrollees who ultimately do not make their premium payments and are not covered. Effectuated enrollment is different from selection or sign-up data in that it accounts for who paid their premiums. Consumers who canceled their coverage or did not make their premium payments, resulting in termination of coverage, do not contribute to effectuated enrollment totals.
This analysis uses data from the Centers for Medicare and Medicaid Services (CMS) on effectuated enrollment in addition to Open Enrollment plan selections to examine how enrollment in the ACA Marketplaces has changed in 2026.
Key Findings
Every state except for New Mexico saw a drop in ACA Marketplace enrollment from 2025 to 2026. New Mexico is the only state to fully replace the expired federal enhanced premiums tax credits with state-funded subsidies.
State-based Marketplaces that run their own enrollment platforms, including those that partially offset the expiring federal enhanced tax credits, generally saw lower drops in enrollment (a 6% decline versus a 15% decline for states that use the federal marketplace).
The effectuation rate (the rate at which people who initially signed up for a plan kept their coverage by making their premium payments) was lower in 2026 than in recent years.
States that run their own Marketplaces, and particularly those that offered state-funded subsidies, generally saw higher-than-average effectuation rates.
February effectuated enrollment declined in 2026 to 19.2 million people (as of May 5, 2026), down from 21.8 million people in 2025, a record high enrollment (see note in Methods about 2025 total enrollment). This represents a 12% decline in enrollment year-over-year. Similarly, KFF polling indicated about one in ten 2025 Marketplace enrollees (9%) said they became uninsured for the 2026 plan year. The decline in enrollment coincides with the expiration of the enhanced premium tax credits at the end of 2025.
While effectuated enrollment data do not capture the reasons coverage lapsed, these significant declines in enrollment correspond with rising premium payments after the expiration of enhanced premium tax credits. Without the enhanced credits, premium payments increased substantially for most subsidized enrollees, and some middle-income enrollees who previously qualified for subsidies faced the full cost of coverage for the first time. On average, premium payments net of tax credits increased by 58% for people who signed up for 2026 coverage. A 2026 KFF follow-up survey of people who had been enrolled in ACA Marketplace coverage in 2025 found that eight in 10 enrollees who made changes to their ACA coverage or became uninsured cited cost as a reason, with 17% of returning Marketplace enrollees stating they worried about being able to pay their premiums for the entirety of 2026.
As shown in Figure 2, 2026 was the first year of widespread increases in premium payments. In prior years, including before the implementation of enhanced premium tax credits, people receiving a subsidy were largely sheltered from increases in the premiums charged by insurers. This may at least in part explain why the effectuation rate in 2026 was lower than some years preceding the enhanced premium tax credits. While the drop in enrollment from 2025 to 2026 is the largest drop since the Marketplaces opened, there are still more ACA Marketplace enrollees now than there were before the enhanced premium tax credits were passed.
Effectuated enrollment declined in nearly every state from 2025 to 2026, though the size of the decline varied substantially. New Mexico was the only state to see an increase in effectuated enrollment, growing 14% between 2025 and 2026, coinciding with the state's premium assistance program that fully replaced the expiring federal enhanced tax credits with state-funded subsidies. Effectuated enrollment in Illinois, Connecticut, Pennsylvania, Idaho, the District of Columbia, Massachusetts, and Texas held relatively flat or fell by less than 5%. Of these states, Texas is the only state that is not a state-based Marketplace. Enrollment in Texas may have been buoyed by a state rule that mandates substantial silver loading, which can lead to more subsidized people being eligible for a bronze plan, or in some cases a gold plan, with little or no premium payment.
At the other end of the spectrum, effectuated enrollment fell by just over 32% in Ohio and Oklahoma, and by more than a quarter in Arizona (30%), South Carolina (29%), Indiana (28%), Michigan (27%), Minnesota (27%), Mississippi (26%), and Louisiana (26%). Of these states, Minnesota is unlike the others in that it offers a Basic Health Program covering low-income people who would otherwise sign up on-exchange. With a relatively higher-income group of Marketplace enrollees, Minnesota enrollees may have been disproportionately affected by the return of the subsidy cliff as enhanced tax credits expired.
A sortable table in the appendix shows the change in enrollment for each state, alongside other information about the type of Marketplace, whether state subsidies are available, and the effectuation rate.
Figure 3
States that run their own enrollment platforms, and particularly those that offered state-funded subsidies, generally saw a smaller drop in enrollment (or an increase, in the case of New Mexico). When weighted by enrollment in each state, those that use the HealthCare.gov platform (and do not offer state-specific subsidies) saw a decline in effectuated enrollment of 15% from 2025 to 2026. However, state-based Marketplaces experienced a 6% decline during the same period. States that offered state-funded subsidies all saw below-average declines in enrollment, or an increase in the case of New Mexico.
Figure 4
Of the 26 states with effectuated enrollment drops smaller than the national average, 18 were state-based Marketplaces, including all nine that offered their own state-funded subsidies. These differences across states suggest that the availability of state-level premium assistance helped cushion the effect of expiring enhanced premium tax credits on enrollees' ability to maintain coverage, though enrollment changes likely also reflect broader differences in state populations and Marketplace administration.
Figure 5
Changes in both plan selections and effectuated enrollment from 2025 to 2026 varied considerably among states. However, changes in effectuated enrollment were not always well predicted by earlier reported changes in plan selections. In most states (37), both plan selections and effectuated enrollment declined, and the gap between the two widened, meaning that drops in plan selections underpredicted the change in effectuated enrollment. This pattern was particularly pronounced in states such as South Carolina, where plan selections fell 7% but effectuated enrollment fell 29%; Michigan, where plan selections fell 6% but effectuated enrollment fell 27%; and Minnesota, where plan selections fell 8% but effectuated enrollment fell 28%.
For nine states, plan selections rose from 2025 to 2026 but effectuated enrollment fell, reflecting a declining effectuation rate. Louisiana saw the largest divergence: plan selections increased by about 1% but effectuated enrollment fell by 27%. Texas showed the largest difference by number of enrollees: about 206,000 more people signed up this year (a 5% increase in sign-ups), with effectuated enrollment ultimately falling by about 146,000 people (a 4% decrease). Connecticut, Idaho, Massachusetts, Maryland, Pennsylvania, and Rhode Island saw smaller versions of this trend, with modest increases in plan selections alongside slight declines in effectuated enrollment.
Nationwide, the February effectuation rate fell from 90% in 2025 to 83% in 2026. This means a larger share of the people who signed up for coverage during open enrollment did not maintain their coverage, perhaps because they did not pay the first month's premium, canceled after enrolling, or fell behind on payments and had their coverage terminated. Since 2019, the effectuation rate (measured past the end of the three-month grace period for February premium payment) has been above 90% but was lower in the early years of Marketplace coverage.
This year, Mississippi had the lowest effectuation rate (61%), meaning nearly two in five consumers who signed up during open enrollment did not maintain coverage past January. Similarly, South Carolina, Louisiana, Indiana, and Oklahoma also saw effectuation rates below 70% in 2026. By contrast, New Mexico, California, Nevada, Vermont, and Idaho each had effectuation rates of 95% or more.
Figure 7
States that run their own Marketplaces generally maintained higher effectuation rates than states that use HealthCare.gov. The ten states with the lowest effectuation rates all use the Healthcare.gov platform, while the ten states with the highest effectuation rates are all state-based Marketplaces. These differences may reflect variation in state populations, subsidy structures, or outreach and enrollment assistance efforts. Of state-based Marketplaces, Minnesota and the District of Columbia were the only ones to see lower-than-average effectuation rates. Both markets skew relatively higher-income, as both offer Basic Health Programs that cover lower-income enrollees who would otherwise sign up on exchange.
Figure 8
As with smaller drops in effectuated enrollment, states that implemented state-based subsidy programs to help offset the expiration of the enhanced premium tax credits through their state-based Marketplaces saw higher effectuation rates. Of the nine states offering state-based premium subsidies, seven saw effectuation rates higher than 90%, and all saw effectuation rates higher than the U.S. average. New Mexico, which, as mentioned earlier, fully replaced the lost enhanced premium tax credits through state funds, had the highest effectuation rate among all states at 96%.
These patterns suggest that state policies designed to blunt the effect of rising premiums may be associated with higher rates of enrollees maintaining active coverage, though other factors—such as income levels, Marketplace type, and state outreach efforts—likely also play a role. All states that offered state subsidies to backfill some portion of the expired enhanced premium tax credits were above the median change in effectuated enrollment.
Appendix
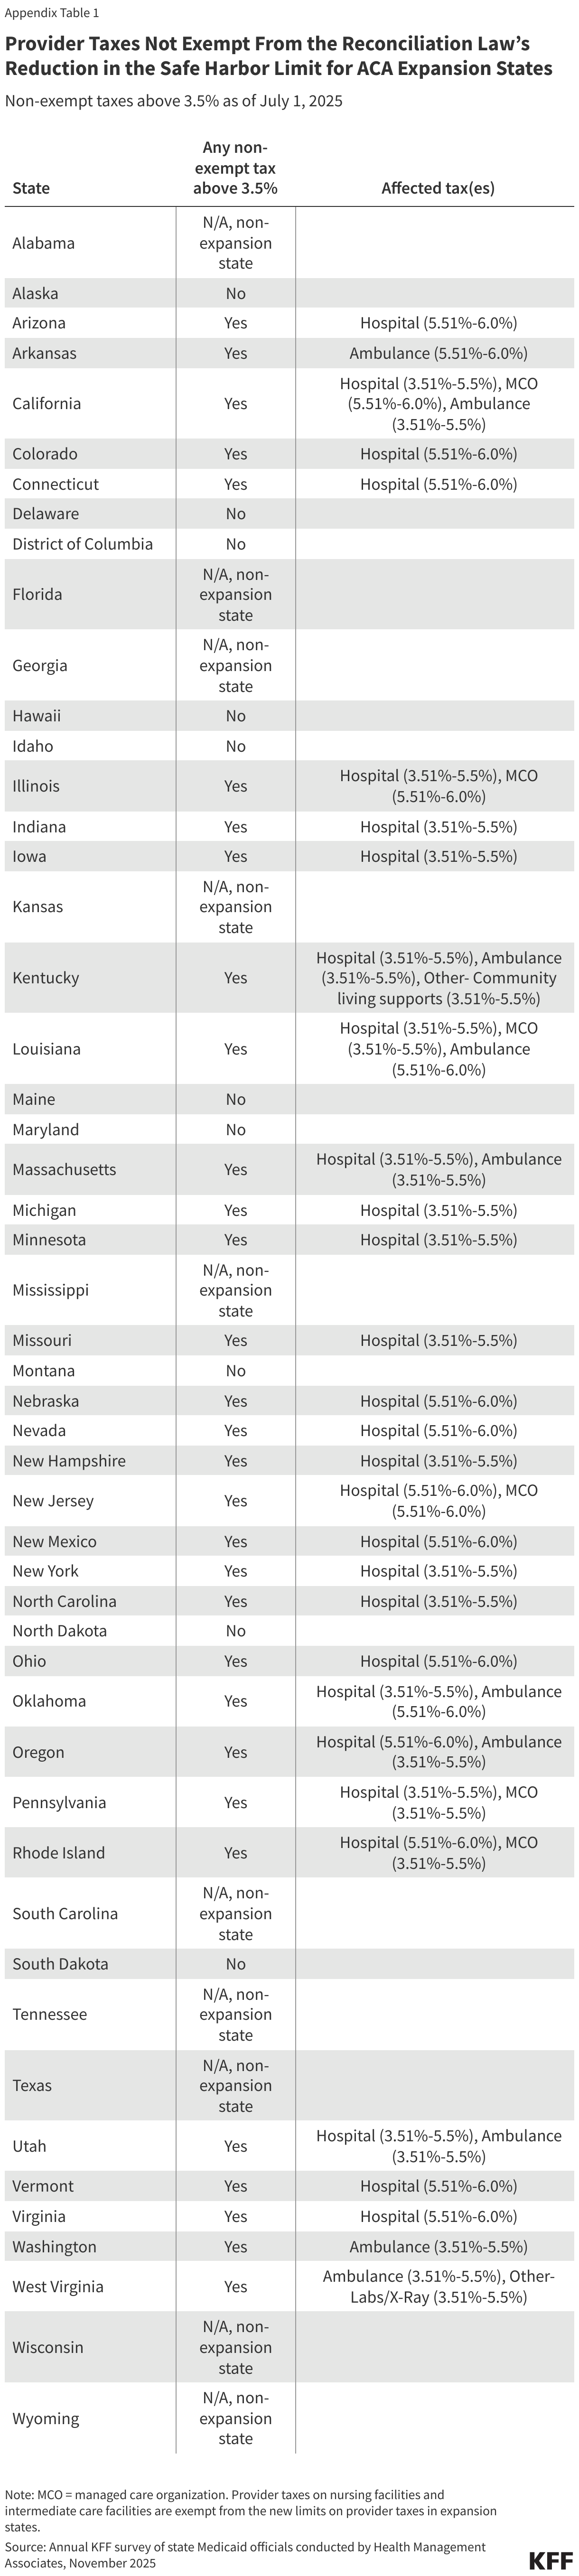
Methods
Open enrollment plan selections and monthly effectuated enrollment were collected from Centers for Medicare & Medicaid Services (CMS) sites. Effectuated enrollment in this current analysis refers to enrollees with any coverage in February. For 2025, effectuated enrollment is as of March 15, 2026; for 2026, as of May 5, 2026. Both of these dates are past end of the February premium payment grace period for consumers who had effectuated coverage. State-based subsidy information was obtained from state government websites; see Figure 3 for links to source data. States that operate their own exchanges but use the HealthCare.gov platform are included in the HealthCare.gov category; none of them provide state-funded premium assistance. Weighted average enrollment changes by platform type were calculated using the above described categorizations. Illinois, which switched from using HealthCare.gov in 2025 to its own state-based Marketplace platform in 2026, is counted as a state-based Marketplace for change in effectuated enrollment.
An analysis by ASPE reported the 2025 February effectuated enrollment total to be 22.1 million, but the CMS monthly effectuated enrollment data report a total of 21.8 million enrollees in February 2025. Effectuated enrollment totals may differ across data sources, potentially due to the date of measurement. This KFF analysis is based on CMS monthly effectuated enrollment data (linked above) which indicated a total of 21.8 million effectuated enrollees.
The current Ebola outbreak centered in the Democratic Republic of the Congo (DRC), first identified in May 2026, has rapidly developed into the third largest Ebola outbreak on record. It presents particular challenges for responders because there are no readily available vaccines or treatments for the species of Ebola causing this outbreak, which is also taking place in a region with active conflict and multiple concurrent humanitarian crises. It is also the most significant international infectious disease outbreak the Trump administration has had to face in its second term. Given major changes made by the administration to U.S. global health and pandemic response mechanisms over the past year and half – including reducing funding, cutting staff, changing priorities and shuttering USAID – some have raised concerns that U.S. international disease response capacity has been compromised and the effectiveness of the U.S. response has been limited. Others have observed that the U.S. has, in comparison to previous Ebola responses, mobilized relatively quickly this time. To help put U.S. capacities and actions in further context, this analysis compares the current U.S. Ebola response to those of the two prior largest outbreaks – the West African outbreak of 2014-2015 and the DRC outbreak of 2018-20201 looking across a range of indicators and categories. Even so, such comparisons are complex, as there are many interrelated factors that affect any governmental response — including the severity and size of the outbreak itself, the response of other international and domestic actors, whether there are medical countermeasures available, and whether the outbreak is occurring under exceptionally difficult conditions, such as active conflict.
Taking these dimensions into consideration, this analysis finds that:
The speed of the U.S. government’s response to the current outbreak is on par with the prior two outbreaks. In all three cases, the U.S. mobilized an initial response, including funding and personnel, within days of cases first being reported.
Initial U.S. funding amounts are already surpassing the prior two outbreaks. The U.S. provided $21 million in the first six months of the West African outbreak, $98 million in the first year of the 2018-2020 DRC outbreak and has already pledged $375 million in the first two months of the current outbreak. Given that it is still relatively early in the current outbreak, which could become protracted, final U.S. funding levels will likely grow; the administration has already asked Congress for emergency funding of $1.4 billion.
Across all outbreak responses including the current response, the U.S. has consistently supported research and development (R&D) for Ebola countermeasures such as diagnostics, tests, treatments, and vaccines, which has been instrumental in identifying and testing new vaccine and treatment candidates; given that there is no vaccine or specific treatments for the current species of Ebola, this work is quite critical.
At the same time, a significant difference between current and past responses is in the U.S. organizational structure and approach, resulting from the changes made last year by the administration. Past responses were led by USAID and its Office of Foreign Disaster Assistance (OFDA), with a major role played by CDC. Given the dissolution of USAID in 2025, the response lead has shifted to the State Department and its Bureau of Global Health Security and Diplomacy (GHSD) and Bureau of Disaster and Humanitarian Response (DHR), both of which have seen their staffing reduced over the past year. Past responses also had White House National Security Council (NSC) level offices and staff with specific responsibilities for international infectious disease response coordination, something initially absent this time. The current relative lack of specified inter-departmental coordination mechanisms could affect the U.S. response over time, particularly if the outbreak is protracted and the U.S. response scales up further, although there are indications that the administration may seek to name an Ebola response coordinator.
In addition, while the U.S. has had pre-existing global health programs in these countries when each outbreak has occurred, the current U.S. response takes place after significant upheaval in U.S. global health programs, and as the administration implements its new America First Global Health Strategy, including through a new memorandum of understanding (MOU) the U.S. signed with the DRC in February, three months before the current outbreak was identified. That new agreement will reduce U.S. funding over time and shift financial and operational responsibility to the country.
Another notable difference is in U.S. multilateral engagement. In the past, the U.S. was directly engaged with the World Health Organization (WHO) and synced to the strategic pillars identified by WHO and other partners in Ebola response plans. Having left WHO membership last year, the U.S. is, for the first time, not formally coordinating with the agency, although it is coordinating with other United Nations (UN) agencies including the Office for the Coordination of Humanitarian Affairs (OCHA), the International Organization for Migration (IOM), the World Food Programme (WFP), and the United Nations Children’s Fund (UNICEF). The lack of formal relations with WHO, however, could have implications as the response continues to unfold, and present barriers to communications or coordination at times.
There is also a marked difference in how the U.S. has approached domestic border protection in the current outbreak compared to the past. During prior outbreaks, the U.S. relied on country exit screening, screening at U.S. ports of entry, and follow-up monitoring of travelers from affected countries but not outright travel bans. At present, the administration has imposed a more restrictive posture barring incoming travelers altogether (U.S. citizens and non-citizens that have been in DRC within the last 21 days, as well as non-citizens that have been in Uganda or South Sudan in that time period).
While it is still early to take full stock of the U.S. response to the current outbreaks, based on this analysis some key questions and areas to watch going forward include:
Will this escalate and potentially require more long-standing U.S. engagement?
Will the level of U.S. international engagement shift, particularly if the outbreak worsens significantly and/or spreads beyond DRC borders in a more substantial way?
If the outbreak does expand significantly, will the U.S. support greater mobilization of U.S. staff?
Will Congress appropriate emergency funding?
How might the outbreak affect other U.S. supported health efforts in the DRC including the recently signed MOU on global health?
What will happen with the approach to U.S. border security, especially if more Americans become infected? What other domestic response would be put in place if Ebola cases are identified in the U.S.?
Table 1. Comparing U.S. Responses to Three Ebola Outbreaks
Date of Initial WHO “Public Health Emergency of International Concern (PHEIC) declaration
August 8, 2014 (141 days after initial cases identified)
July 17, 2019 (almost 1 year after first case reports, due to the WHO EC initial determination the outbreak was not a regional threat, a key criteria for PHEIC determinations).
May 17, 2026 (16 days after first cases identified, 2 days after first cases confirmed).
PHEIC declaration was made by Director-General before Emergency Committee met.
No vaccine available initially. Clinical trials with candidate vaccines began in in West Africa in February and March 2015. A candidate vaccine was made available under a compassionate use protocol for broader community “ring vaccination” purposes in March 2016 in Guinea.
(time from outbreak detection to mobilization of U.S. response funds)
Initial U.S. Agency for International Development (USAID)/Office of Foreign Disaster Assistance (ODFA) funding provided in March 2014, soon after initial outbreak reports.
Centers for Disease Control and Prevention (CDC) supported initial staff deployments to affected areas in late March/early April. As the outbreak worsened considerably over subsequent months, U.S. funding scaled up, particularly from August 2014 on.
Initial USAID funding provided in August 2018, within weeks of the initial announcement of confirmed Ebola cases in eastern DRC. CDC also supported staff deployments and response activities in August.
As outbreak worsened considerably in March/April 2019, U.S. response funding scaled up.
Initial funding announced on May 19. (four days after initial case confirmation and two days after PHEIC declaration).
Amount and source of initial response funding
Between March and August 2014, $21 million in cumulative response funding reported from USAID. By October 2014, CDC had committed >$16.7 million for its Ebola response activities. Initial funding drawn from USAID International Disaster Assistance funds
As of September 5, 2018, USAID had provided at least $2 million for response activities. Over the first 11 months of the response (through July 2019) USAID reported $98 million in support for the response. Funds drawn from unspent FY2015 Ebola emergency supplemental funds.
State Department announced $23 million in initial Ebola response funding on May 19, drawn from existing FY2026 State Department humanitarian assistance funds.
Total U.S. response funding amount and source
Approximately $2 billion in U.S. international response funding obligated by the end of 2015, primarily through emergency/supplemental appropriations provided to USAID and CDC.
From August 2018 to June 2020, USAID provided over $342 million for response activities, drawn from USAID International Disaster Assistance, USAID/Global Health, USAID/Food for Peace, and USAID Mission funds. USAID used unspent FY2015 Ebola emergency supplemental funds.
$270 million was committed by the State Department as of June 12, drawn from State Department’s existing FY2026 humanitarian response funds. The U.S. has made an overall pledge of $375 million in support of the response as of June 19.
Emergency / supplemental funding requests and appropriations
White House requested $6.2 billion in emergency supplemental funding in November 2014. In December 2014, Congress appropriated $5.4 billion, including $3.7 for international response activities.
None requested.
White House requested $1.4 billion in emergency supplemental funding in June 2026. As of July 2026, Congress had not yet appropriated additional funding.
U.S. funding share of overall international response funding
The U.S. was the largest donor to the response, providing $2.4 billion (41%) of the $5.81 billion in overall donor funding provided between 2014 and 2016.
The U.S. was the largest donor to the response, providing $252 million (34%) of the $734 million in overall donor funding provided between August 2018 and December 2019.
The $375 million pledged $375 million by the US for Ebola response activities represents 41% of the $910 million in overall donor funding pledges made by international donors in support of the joint continental Ebola response plan.
U.S. Staff Deployments, EOC Activation
Staff Mobilized/ Deployed
Prior to the outbreak, USAID and CDC presence in the three most affected countries “very limited.” On March 31, 2014, a 5-person CDC team deployed to Guinea. In August 2014, 28-member DART team deployed (staff from USAID, CDC, the Department of Defense (DoD), other agencies).
By the end of the outbreak, over 3,500 personnel from DoD, CDC, U.S. Public Health Service (USPHS) Commissioned Corps, USAID, and National Institutes of Health (NIH) were deployed.
First 5 CDC staff deployed to North Kivu August 2018 (pulled back after a few days). By May 2019, CDC had 17 staff in Kinshasa and Goma.
In May 2014, the White House asked the HHS Office of Global Affairs to coordinate the U.S. government response, with USAID as operational lead and CDC as lead on technical and public health issues.
As the outbreak continued to expand in West Africa, and several Americans working in West Africa became infected with Ebola, President Obama became directly involved, offering to send U.S. troops in September, and appointing an Ebola Response Coordinator in October 2014 who eventually led coordination of U.S. agencies through a position at the National Security Council (NSC)
USAID/OFDA, CDC.
No NSC-level leader designated for coordinating U.S. response, as the global health security team at NSC was disbanded in May 2018 during a reorganization process under the first Trump Administration. Primarily, coordination occurred at the department/agency level.
USAID was dissolved in 2025, making the State Department the primary response agency along with CDC. At the State Department, the Bureau of Global Health Security and Diplomacy (GHSD), and Bureau of Disaster and Humanitarian Response (DHR) are the key bureaus overseeing response activities.
No specific NSC GHS staff/office designated initially to provide coordination, though a director for bioresponse at the National Security Council was named in July. In June, Secretary of State Rubio stated the administration is considering naming an Ebola response coordinator to oversee the U.S. response.
Pre-existing U.S. Global Health Programs in Affected Countries
Amount of U.S. GH funding in affected countries in the fiscal year prior to initial outbreak
(amounts are disbursements for the indicated fiscal year)
In FY2014, U.S. GH funding by affected country was: –Guinea: $18.8 million, primarily for malaria and family planning/ reproductive health (FPRH), plus maternal and child health (MCH), and HIV/AIDS. –Liberia: $26.2 million, primarily malaria, MCH, and FPRH, plus HIV/AIDS, and Nutrition. –Sierra Leone: $750k for HIV/AIDS.
In FY2018, U.S. GH funding for DRC was $146.4 million, primarily for malaria, HIV/AIDS, MCH, FPRH, tuberculosis (TB), Global Health Security (GHS), and Nutrition.
In FY2025, U.S. GH funding for DRC was $165.8 million, primarily for malaria, HIV/AIDS, MCH, FPRH, GHS, and Nutrition.
U.S. Communications Practices
USG public communications on Ebola response
Regular communications from USAID, CDC and other federal agencies on international response activities, domestic public health guidance. National press conferences and televised briefings were featured. Notable White House involvement in communications starting in August 2014 due to significant public interest in the topic following identification of Ebola cases in the U.S. USAID had the lead for communications regarding U.S. response operations in West Africa, while HHS (including CDC) and the National Security Council handled communications about domestic Ebola cases.
Comparatively less U.S. public attention compared to 2014. Still, CDC and USAID provided situation updates, travel notices, technical guidance. WH public facing engagement was not apparent.
CDC has conducted media briefings, technical briefings, publication of updates, guidance, risk assessments. State Department has provided press conferences, semi-regular posts about U.S. activities and support. President Trump mentioned U.S. support for international response in public remarks.
U.S. Research & Development Support
U.S. support for countermeasures R&D, including vaccines
NIH provided accelerated early clinical trials of vaccine candidates, and field efficacy studies in Guinea and Liberia. U.S. supported evaluation of several experimental therapies, including ZMapp, TKM-Ebola, Favipiravir, and convalescent plasma.
NIH supported ZMapp investigational treatment R&D in DRC.The rVSV Ebola vaccine was used extensively during the response, under expanded-access, with the U.S. supporting vaccine logistics, effectiveness monitoring, operational research, ring vaccination strategy, and other related activities.
U.S. research response has focused on evaluating cross-protection of existing vaccines/treatments, development of multivalent vaccine candidates.USG committed $50 million to the Coalition for Epidemic Preparedness Innovations (CEPI) to advance Bundibugyo vaccine R&D.
BARDA/Mapp Biopharmaceutical announced a transfer of investigational doses of MBP134 monoclonal antibody to DRC.
U.S. Multilateral Engagement
U.S. multilateral engagement on response activities
The U.S. led much of the response, especially in the early stages in 2018, as the WHO-led multilateral response took time to scale up. U.S. response primarily bilateral, with a focus particularly on supporting activities in Liberia
As the multilateral response expanded, the U.S. engaged as active, partner for WHO, UN agencies, and the UN special mission for Ebola response known as UNMEER that was created in September 2014. U.S. activities and engagement spanned all major “response pillars” outlined in multilateral response plans. The U.S. was the largest donor to WHO’s Ebola response activities, providing $73.9 million, and largest donor overall to Ebola response in the region.
The U.S. played an important, though more supporting role as WHO and the DRC government primarily led the response. U.S. activities supported the Ebola response plan developed by DRC, WHO and other international partners. U.S. agencies (including NIH, USAMRIID, and CDC) as well as U.S. funded NGOs were listed as supporting partners across most of the response sectors/pillars, though the U.S. CDC was the only U.S. agency listed as a co-lead (along with WHO) for one of the main response pillars (“Health Information and Analytics”).
Following U.S. withdrawal as a WHO member state, communication and engagement with WHO is limited. The U.S. has direct engagement with UN humanitarian response organizations including OCHA, WFP, UNICEF. The multisectoral continental response plan released by DRC, WHO, and Africa CDC lists the following USG entities as partners across response activities: CDC as co-lead for the surveillance and epidemiology & laboratory systems and genomic sequencing response pillars, and NIH as a partner organization for the clinical trials/R&D sub-pillar.
Domestic border protection measures
U.S. government border policies during Ebola response
Focused on exit screening of travelers from at-risk countries, and entry risk assessment and management for incoming travelers. Travelers from West Africa were primarily directed through five US airports where they went through CDC-designed screening and follow-up with active monitoring of at-risk contacts. In limited cases, there were state-imposed quarantines/isolation.
CDC implemented routine border health security measures at ports of entry. No additional measures imposed.
The U.S. has barred entry for all travelers on commercial flights who were recently in DRC – including U.S. citizens – and non-U.S. citizen travelers who were recently in Uganda or South Sudan. U.S. officials have stated they do not wish to repatriate any Americans who become infected with Ebola overseas. Already, two U.S. citizen health care workers infected with Ebola in DRC have been transported to Germany for monitoring and treatment, rather than brought to the U.S., and seven American aid workers working on the Ebola response in DRC have been sent to a facility in Kenya to quarantine rather than allowed to return to the U.S. immediately.
There was an earlier, smaller Ebola outbreak in 2018 in the northwestern Equateur Province in DRC, initially identified in May 2018. The Equateur outbreak was contained by the end of July 2018, just weeks before the before another, separate, and eventually much larger, outbreak was identified in the Ituri Province in eastern DRC in August 2018. This analysis does not examine the U.S. response to the Equateur outbreak. ↩︎