Responding to Federal Medicaid Reductions: Which States Are Most at Risk?
Issue Brief
The House and the Senate have now passed a budget resolution that implies big, but unspecified, cuts to Medicaid. The House Energy and Commerce Committee is instructed to reduce the federal deficit by at least $880 billion over 10 years, with nearly all those cuts expected to come from Medicaid. The targets in the Senate are less clear, but Senate Majority Leader John Thune has suggested the Senate will seek at least $1.5 trillion in overall spending cuts, which again would have to include substantial cuts to Medicaid.
Medicaid is the primary program providing comprehensive health and long-term care to one in five people living in the U.S and accounts for nearly $1 out of every $5 spent on health care. There are not yet detailed proposals under consideration by Congress to achieve federal Medicaid spending reductions. Because Medicaid financing is shared between the states and the federal government, any reduction in federal Medicaid spending would leave states with tough choices about how to offset reductions through tax increases or cuts to other programs, like education, corrections, and economic development. If states are not able to offset the loss of federal funds, they would have to make cuts to their Medicaid programs by reducing coverage, restricting benefits, or lowering provider reimbursement rates.
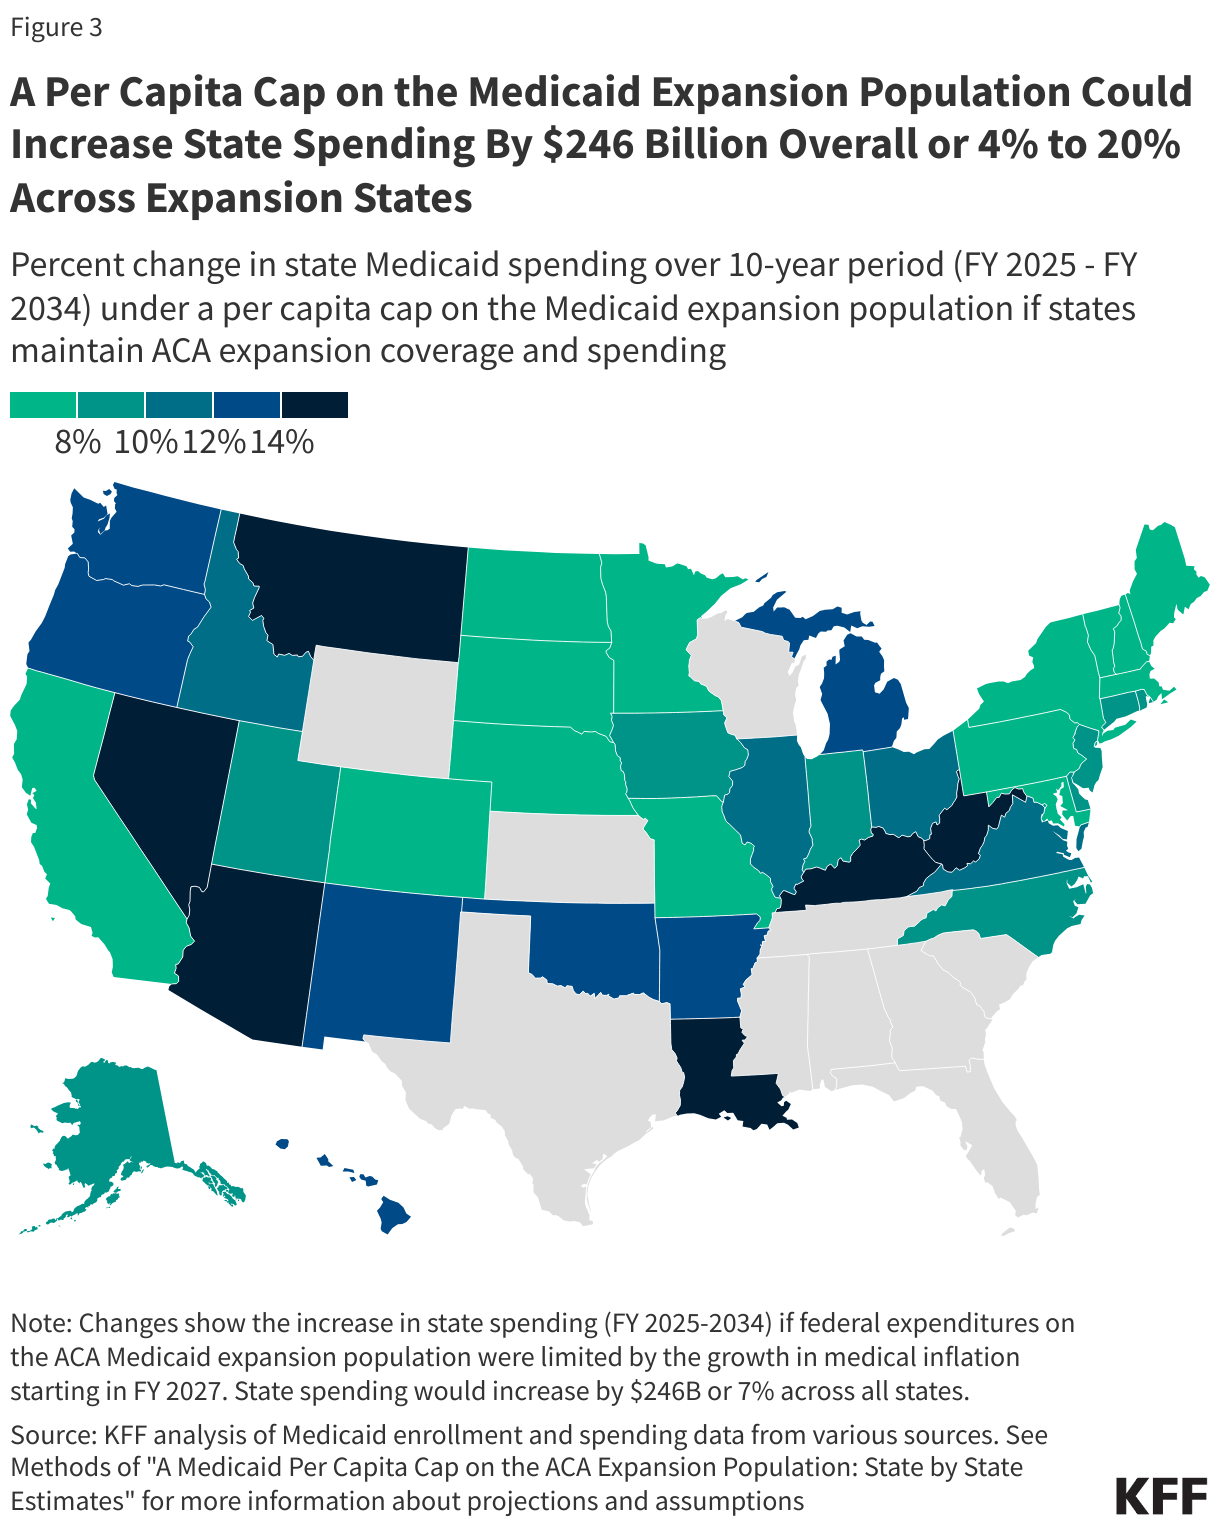
Because states have some flexibility to determine which populations and services to cover, how to deliver care, and how much to reimburse providers, there is significant variation in Medicaid per enrollee spending across states. Some notable differences in policy choices include whether states have implemented the Medicaid expansion under the Affordable Care Act (ACA) as well as decisions about optional coverage for children, pregnancy, people with disabilities and people who need long-term care. State flexibility to cover benefits deemed optional by the federal government leads to significant variation in covered services, particularly the adoption of optional home care benefits. Because of this variation in state policy choices, some states may be disproportionately impacted by federal cuts depending on the specific federal policy changes pursued. For example, the effects of federal policy changes to reduce federal spending for the ACA expansion group would be limited to expansion states while a cap on per enrollee spending for all eligibility groups would impact all states.
States’ ability to respond to federal spending reductions and how they will be affected by any cuts is complicated and depends on an array of factors. The cuts will be made in the context of states’ existing Medicaid programs, but other factors, including population demographic characteristics, health status of Medicaid enrollees, available revenue and state budget choices, and measures of health care costs and access to care, that drive demand for Medicaid as well as states ability to raise revenue or reduce spending will also play a role. This analysis examines a range of measures within these four broad categories to identify states that may have greater difficulty responding to federal Medicaid spending reductions (Figure 1).
The measures used in the analysis were selected from many possible data points because of the availability of state-level data and because they highlight both the capacity of states to respond to federal reductions and the possible implications of federal reductions and state responses on specific populations. Choosing different measures would likely lead to different state rankings. To identify states most at risk, states were ranked separately for each measure, with ties receiving the same rank. Rankings were then summed across each measure within a category to produce a cumulative score, which was used to determine each state’s aggregate ranking for the category. For the full state aggregate ranking for each category, see the Appendix tables. State specific data for these measures as well as other key Medicaid program characteristics can be found in a data collection on State Health Facts.

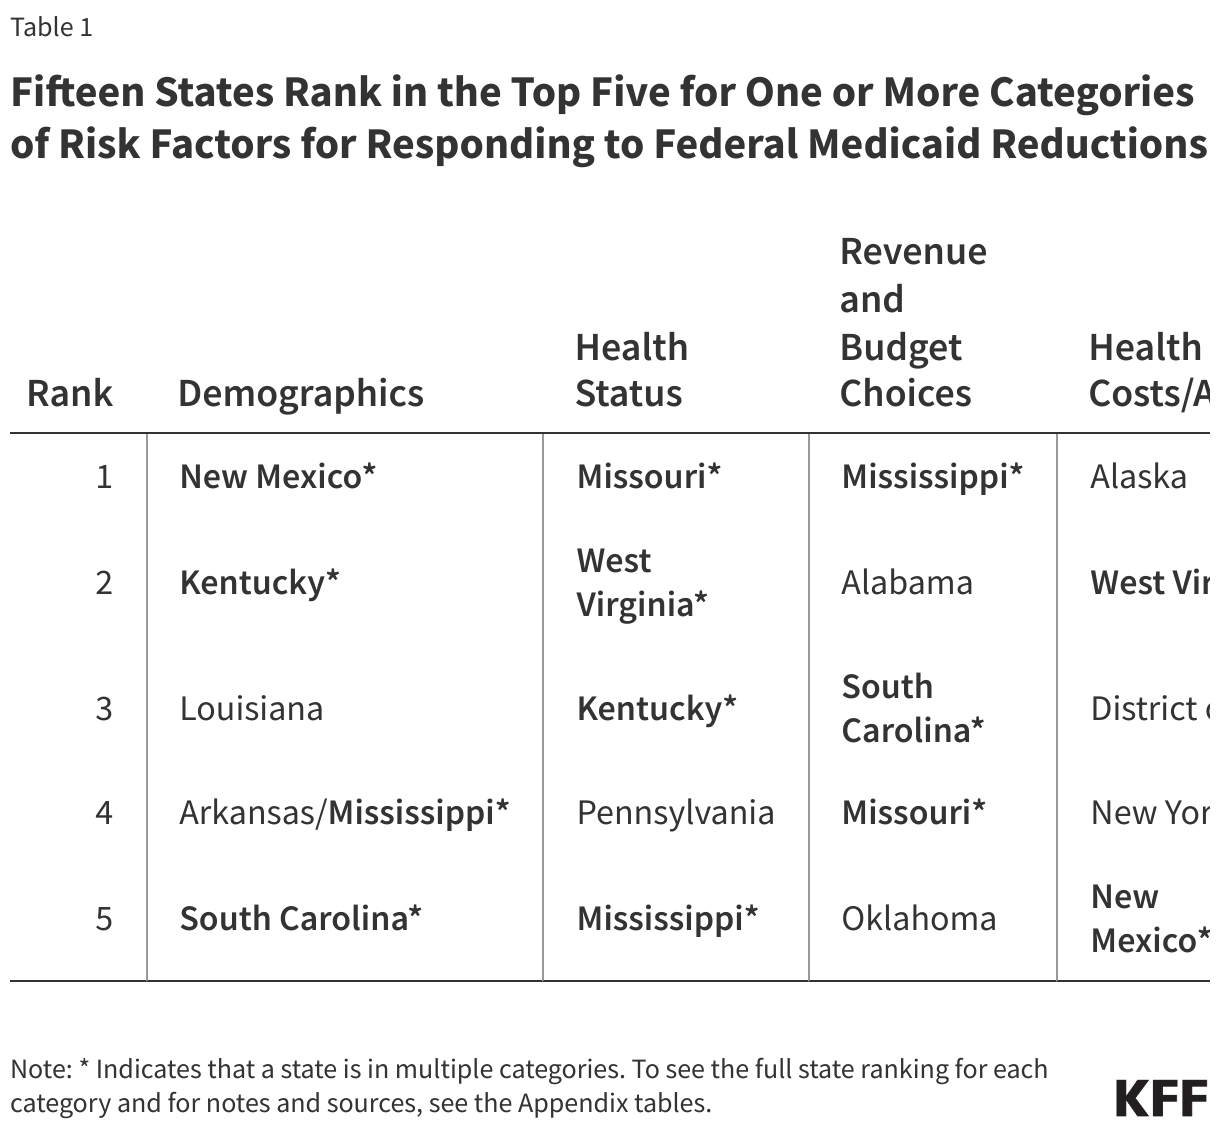
All states will likely face challenges responding to federal Medicaid cuts and caps to varying degrees, but states with certain characteristics are more at risk. Six states (Kentucky, Mississippi, Missouri, New Mexico, South Carolina, and West Virginia) rank in the top five for multiple risk categories and another nine states (Alabama, Alaska, Arkansas, District of Columbia, Louisiana, New York, Oklahoma, Pennsylvania, Washington) rank in the top five for at least one category of risk factors.
Demographics
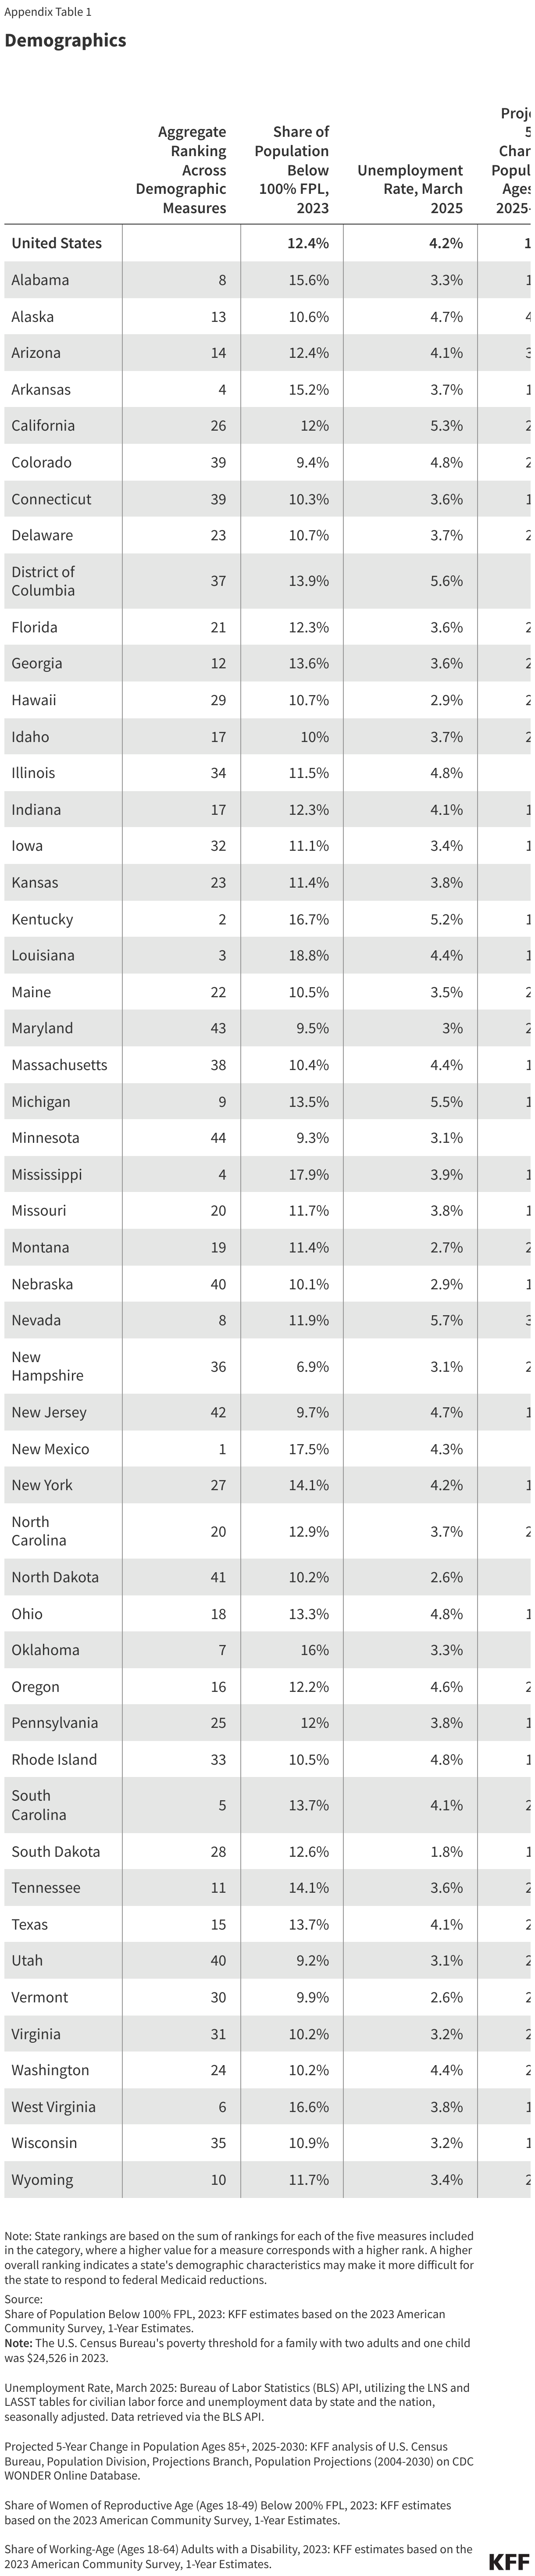
Higher rates of poverty and unemployment among state residents as well as a growing share of individuals over age 85, increase demand for Medicaid, making it more difficult for states to respond to federal Medicaid reductions. Because Medicaid serves low-income populations, states with higher shares of residents in poverty or higher unemployment rates would likely experience continued enrollment in Medicaid even as they make cuts in response to federal funding reductions. Similarly, Medicaid is the largest provider of long-term care services, and an aging population could contribute to increased need for these services. Medicaid also disproportionately covers people with disabilities and finances 41% of births overall so states with higher shares of people ages 18 to 64 who have a disability and higher shares of the female population of reproductive age who have low incomes could face more challenges making program cuts. New Mexico, Kentucky, Louisiana, South Carolina, Arkansas, and Mississippi rank in the top 5 for states with population demographics that could make it difficult to respond to federal Medicaid reductions.
The measures used to rank states on population demographics include:
- Higher Share of Population Below 100% FPL
- Higher Unemployment Rate, March 2025
- Higher Projected 5-Year Change in Population Ages 85+
- Higher Share of Female Population Ages 18-49 Who Have Income Below 200% FPL
- Higher Disability Rate for Working-Age Adults (18-64)

Health Status
Medicaid cuts in states with Medicaid enrollees who have higher health care needs could undermine efforts to improve overall health status. Because Medicaid is a key source of coverage for individuals with significant health care needs, states with higher shares of Medicaid enrollees who are children with special health care needs, who have a disability, serious mental illness, or multiple chronic conditions, or who need long-term care may face greater challenges in restricting program coverage or benefits. Additionally, any cuts to Medicaid programs in states with sicker Medicaid enrollees could have more negative effects on individuals’ health and potentially the health status of the overall population. Missouri, West Virginia, Kentucky, Pennsylvania, and Mississippi rank in the top 5 for states with poor Medicaid enrollee health status that could worsen in the face of Medicaid program cuts made in response to federal funding reductions.
The measures used to rank states based on the health status of Medicaid enrollees include:
- Higher Share of Children with Special Health Care Needs Covered by Medicaid/CHIP
- Higher Share of Medicaid Enrollees Who Reported a Disability
- Higher Share of Medicaid Enrollees with Serious Mental Illness (SMI)
- Higher Share of Medicaid Enrollees Using Long-Term Care
- Higher Share of Medicaid Enrollees Who Have Three or More Chronic Conditions

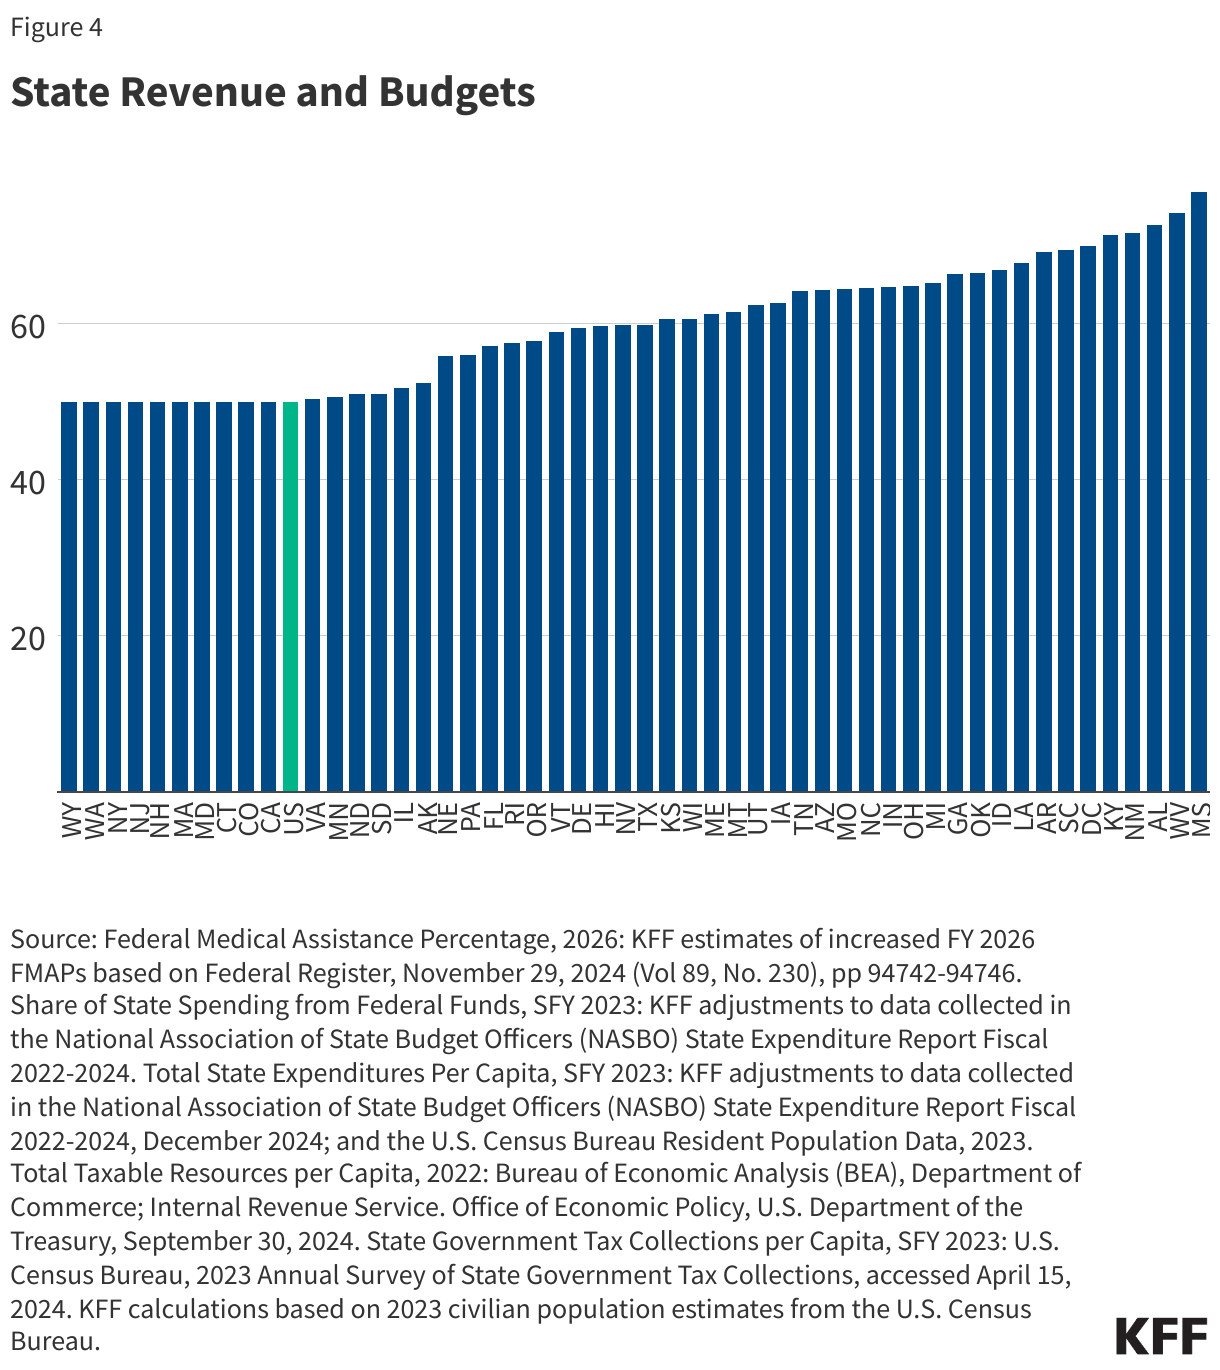
State Revenue and Budgets
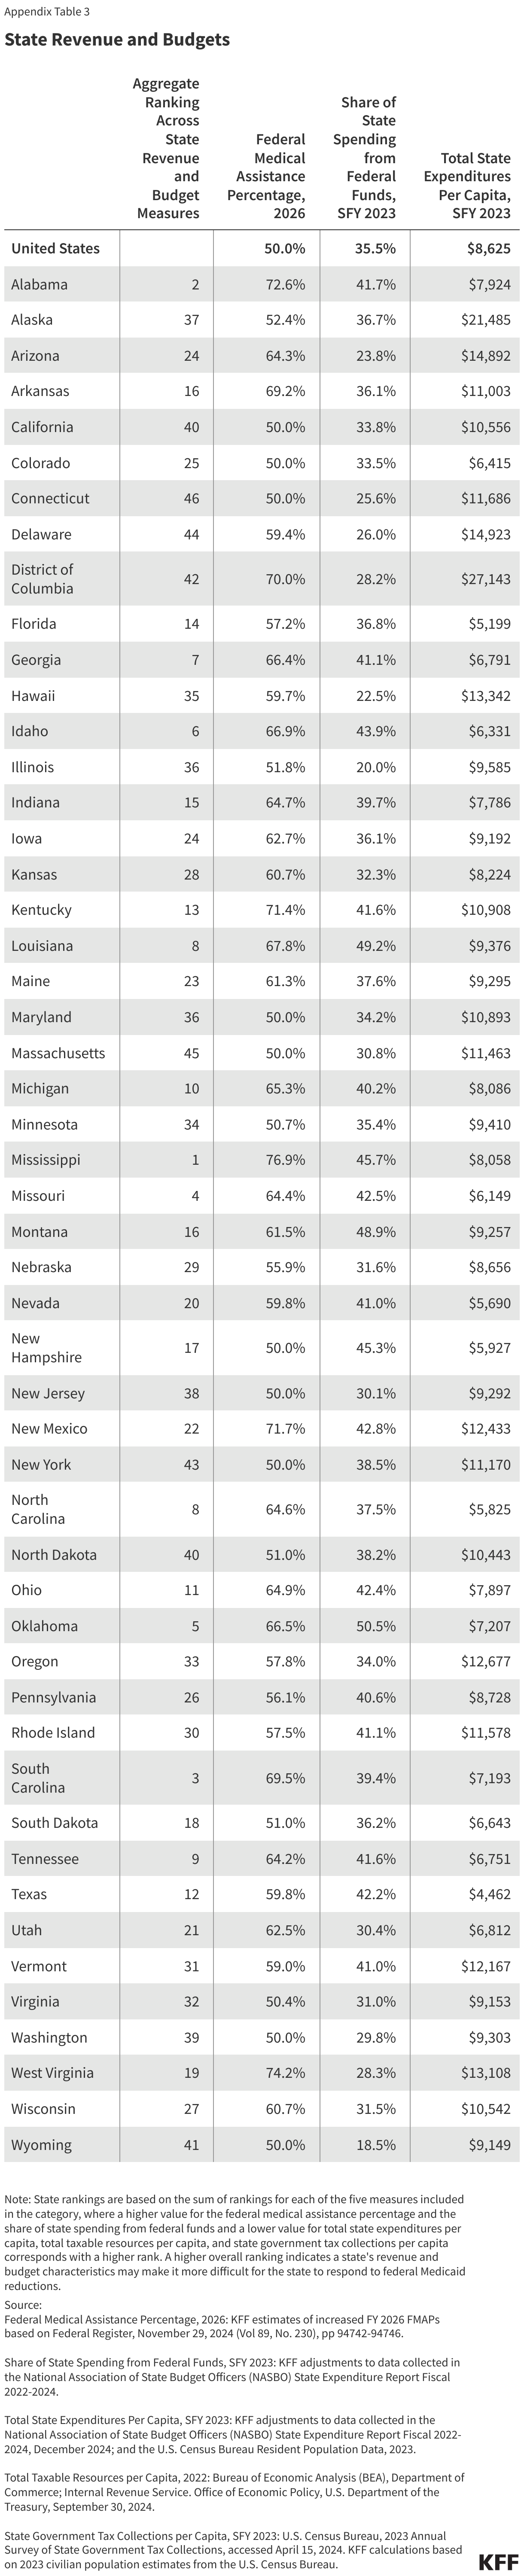
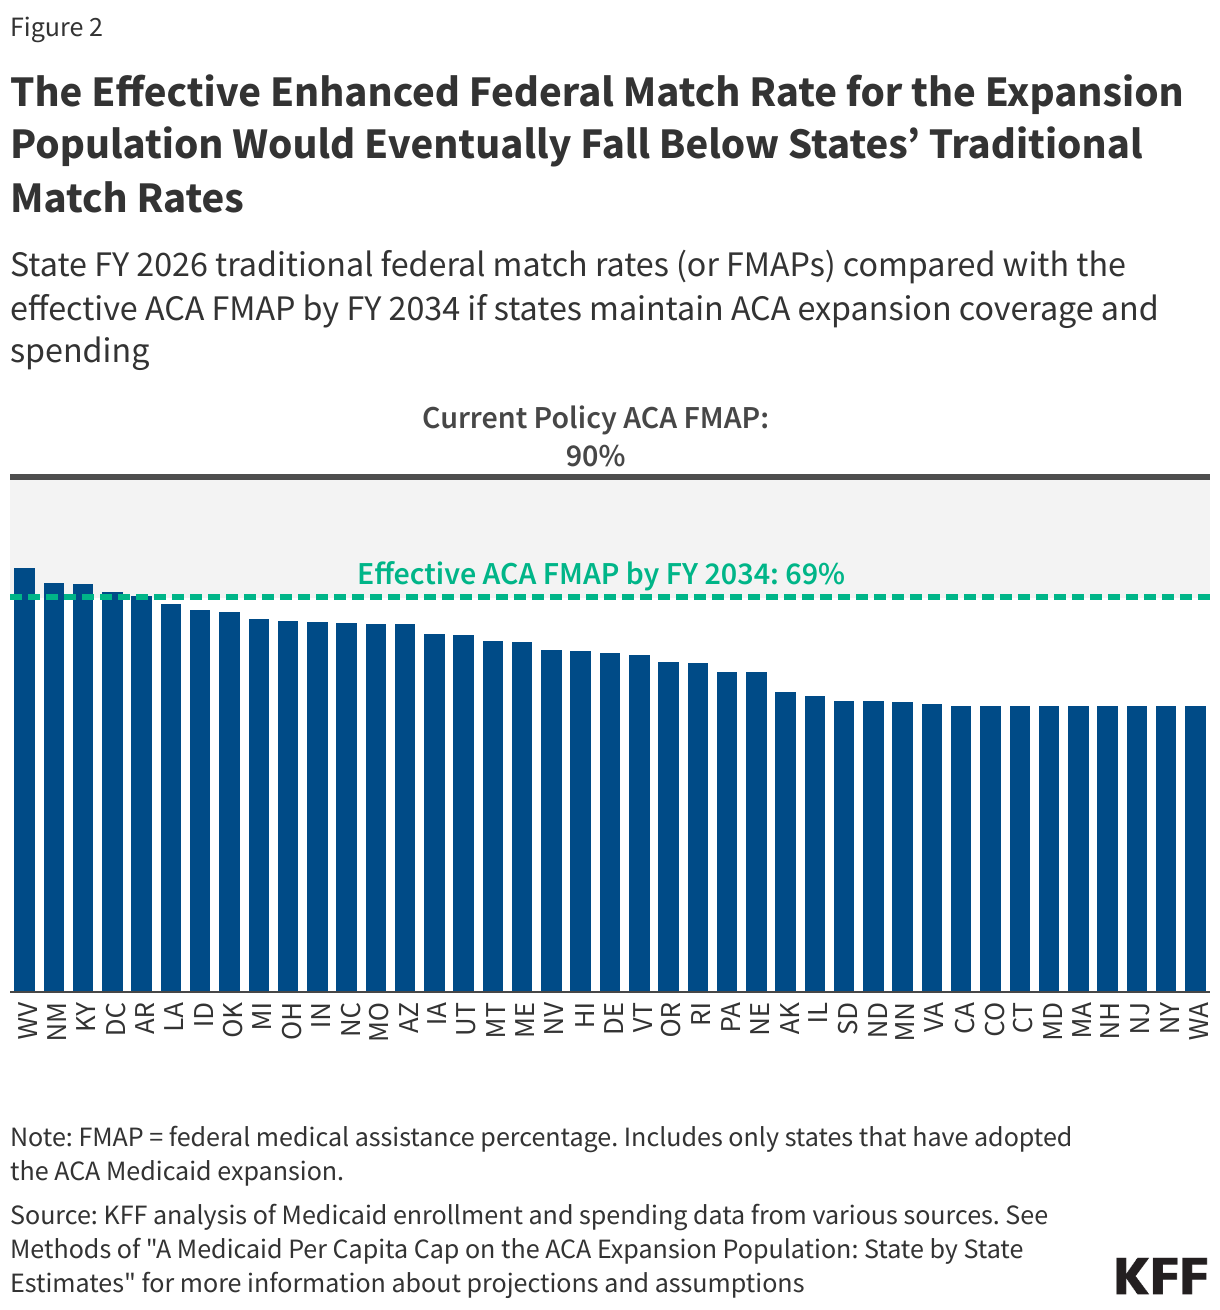
States that are more reliant on federal Medicaid and other federal funding and those that have more limited ability to raise revenue may have a harder time responding to federal funding reductions. Medicaid financing is shared by states and the federal government. For states that have a higher federal medical match rate (FMAP) replacing lost federal funding will require more state dollars than for states with the minimum FMAP. With broader federal funding reductions at play, states that rely more heavily on federal funding beyond Medicaid could face even deeper reductions in federal funding. States that currently spend less per capita may have a harder time reallocating spending across programs to offset federal reductions. While it is difficult for all states to increase revenue by raising taxes, states with lower taxable resources or lower tax collections per capita could experience greater challenges offsetting cuts. Mississippi, Alabama, South Carolina, Missouri, and Oklahoma rank in the top 5 for states with high reliance on federal funding and limited ability to raise revenue or reduce spending that could make it difficult to offset federal Medicaid funding reductions.
The measures used to rank states on their ability to raise revenue or reduce spending include:
- Higher Federal Medical Assistance Percentage (FMAP) for Medicaid and Multiplier
- Higher Share of State Spending from Federal Funds
- Lower Total State Expenditures per Capita
- Lower Total Taxable Resources per Capita
- Lower State Government Tax Collections per Capita
Health Care Costs and Access
States that face higher health care costs and related access issues could have a harder time cutting Medicaid spending without exacerbating existing access to care and provider shortage issues. Medicaid operates within the broader health care system. In higher cost markets, states have to spend more to pay for health care services needed by Medicaid enrollees and can make it harder to reduce spending. High health care costs can also be a barrier to accessing needed care for people who are un- or underinsured. In states with higher shares of residents reporting access to care issues and larger numbers of people living in primary care shortage areas, cutting provider reimbursement rates or scaling back on coverage or benefits in response to federal Medicaid spending reductions could worsen these issues. Alaska, West Virginia, District of Columbia, New York, New Mexico, and Washington rank in the top 5 for states with high health care costs and access barriers that could make it difficult to respond to Medicaid reductions.
The measures used to rank states on overall health costs and access to care include:
- Higher Health Care Expenditures per Capita by State of Residence
- Higher Average Annual Family Premium per Enrolled Employee for Employer-Based Health Insurance
- Higher Share of Children (Ages 3-17) Who Faced Difficulties Obtaining Mental Health Care
- Higher Share of Adults Who Report Not Seeing a Doctor in the Past 12 Months Because of Cost
- Higher Share of the Population in a Primary Care Health Professional Shortage Areas (HPSAs)

Appendix Tables