Poll Finding

KFF Health Tracking Poll April 2025: Public’s View on Major Cuts to Federal Health Agencies

Published: May 1, 2025

Findings

Key Takeaways

  • Amid sweeping overhauls of federal health agencies in the first 100 days of President Trump’s second term, majorities of the public oppose major cuts to staff and spending at these agencies (61%) and say recent actions by the administration and Elon Musk’s Department of Government Efficiency (DOGE) have gone too far (54%). In addition, six in ten (59%) say the administration is “recklessly making broad cuts to programs and staff, including some that are necessary for agencies to function,” while a smaller share (41%) say “the administration is carefully making cuts to programs and staff to reduce fraud and waste, and to improve government efficiency.”
  • Views of cuts to staff and spending are largely partisan with most Democrats and independents opposing the cuts and thinking they go “too far,” while a majority of Republicans support the cuts and six in ten (63%) say the extent has been “about right.” In addition, nine in ten Democrats and two-thirds of independents categorize the cuts as reckless while eight in ten Republicans think the administration is carefully making the cuts. Across the board, the strongest proponents of these cuts are MAGA supporters, a group that constitutes about three-quarters of all Republicans and Republican-leaning independents. Large majorities of MAGA supporters say they support the cuts and a quarter say the cuts haven’t gone far enough. Much smaller shares of Republicans and Republican-leaning independents whose views don’t align with the MAGA movement approve of the current actions by the Trump administration.
  • Most of the public also see the negative consequences from these cuts, with majorities saying cuts to staff and spending at federal health agencies will have a negative impact on health care for veterans, research to find cures and treatments for cancer and other diseases, efforts to combat the spread of infectious diseases, and food safety. Once again, views are partisan with most Democrats and independents saying the cuts will have a negative impact in these areas while Republicans are more likely to say the cuts won’t have an impact.
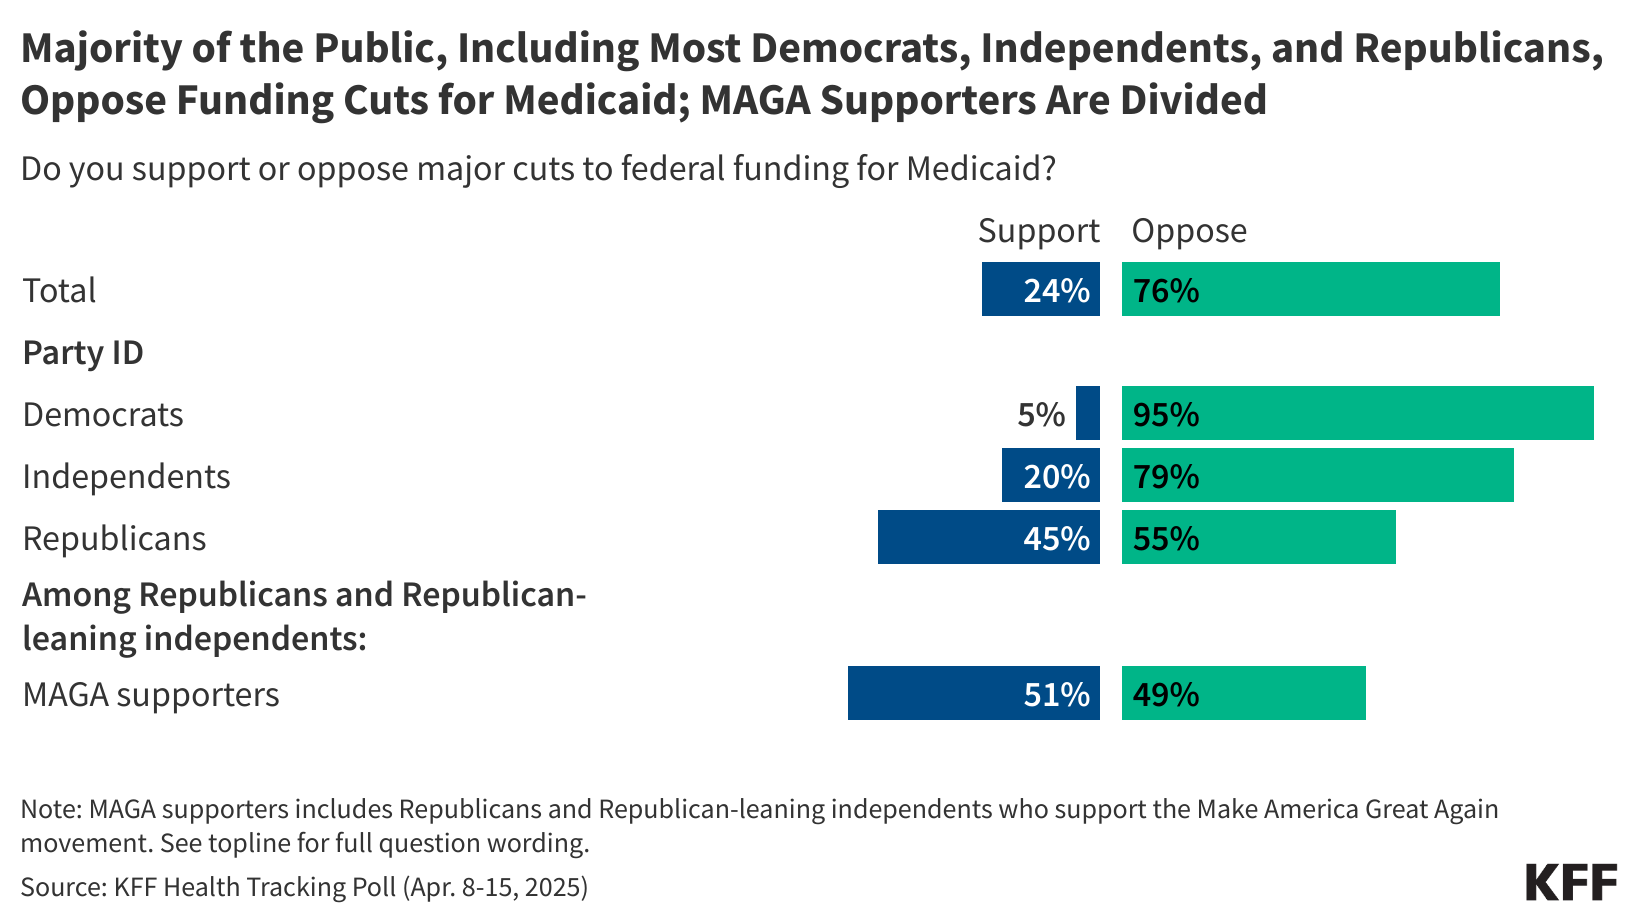
  • There is partisan agreement when it comes to funding cuts to Medicare, Medicaid, and Social Security with more than nine in ten Democrats, eight in ten independents, and more than half of Republicans opposing federal funding cuts to each of the three government programs. In addition, majorities across partisanship oppose funding cuts to states for mental health and addiction prevention services and for tracking infectious disease outbreaks. Another seven in ten oppose cuts to federal funding for research at universities and medical centers, including nine in ten (92%) Democrats, seven in ten (69%) independents, and almost half (44%) of Republicans. Overall, two-thirds (65%) oppose cutting funding to help people who purchase health coverage through the ACA to pay their premiums (65%), but about six in ten Republicans support major cuts in this area.
  • Most of the public agree with the Trump administration that fraud, waste, and abuse are a problem in health care in the U.S., yet partisans disagree on whether the cuts will make any difference and on who is responsible for it. Roughly four in ten (43%) of the public say cuts to staff and spending at government health agencies will negatively impact reducing fraud, waste, and abuse in health care, which is similar to the share (38%) who say there will be a positive impact. Additionally, while majorities (57%) think fraud, waste and abuse are a “major problem” in private health insurance plans, fewer – about half – think fraud is a problem in Medicaid (52%), Social Security (51%), and Medicare (50%). Half of Democrats identify private health insurance companies as the group most responsible for fraud, waste, and abuse in government health programs while four in ten Republicans place the blame on government employees running the programs.

Most Oppose Trump Administration Cuts to Federal Health Agencies

The first few months of President Donald Trump’s second term have been punctuated by a wave of cuts to the federal workforce and government funded programs, especially in health care agencies. At least 20,000 jobs have been lost from the Department of Health and Human Services and its sub-agencies since Robert F. Kennedy Jr. assumed his job as secretary of the agency.

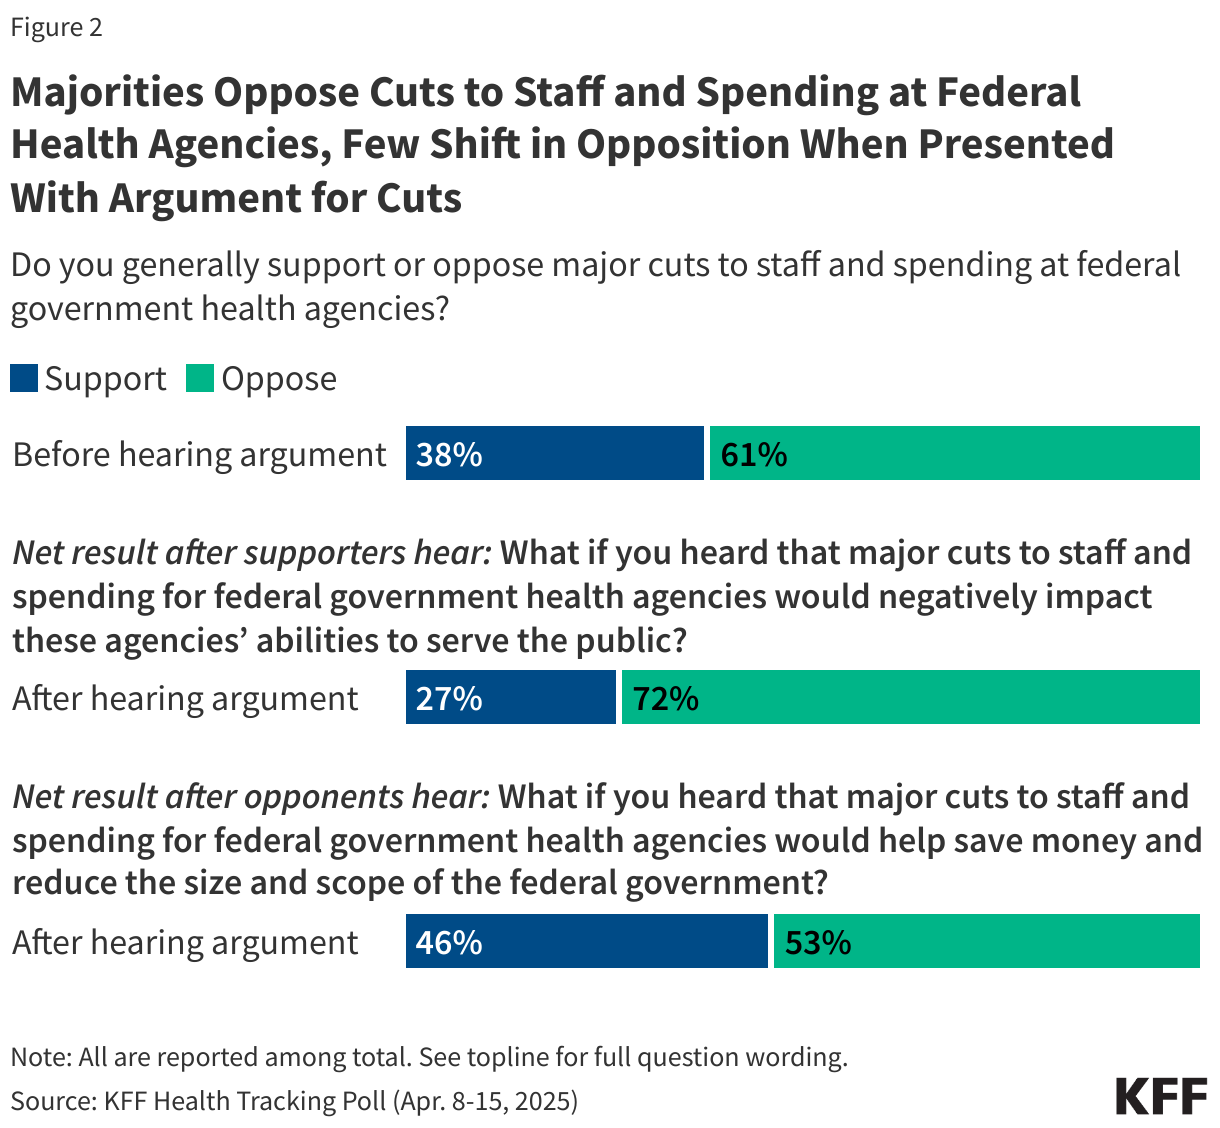
Most of the public (61%) oppose major cuts to staff and spending at federal health agencies, while two in five (38%) support such cuts. Views on the cuts to staff and spending are expectedly partisan, with the majority of Republicans supporting major cuts (72% support, 27% oppose), while nine in ten Democrats oppose the cuts (89% oppose, 10% support). Two-thirds of independents oppose the cuts (67%) while a third are in support (32%).

Support for major changes at federal government health agencies is driven by the most enthusiastic segment of President Trump’s political base – Republicans and Republican-leaning independents who identify as supporters of the Make America Great Again (MAGA) movement. This group, which makes up 75% of Republicans and leaners (31% of total U.S. adults) are demographically similar to other Republicans and Republican-leaning independents when it comes to race/ethnicity, gender, and income, but tend to be older. Roughly eight in ten MAGA-aligned Republicans say they generally support major cuts to staff and spending at federal health agencies, while non-MAGA Republicans are more divided (48% support and 52% oppose).

Six in Ten Oppose Major Cuts to Staff and Spending at Federal Health Agencies, With Nearly Nine in Ten Democrats in Opposition

Perhaps a reflection of the entrenched partisan views, hearing arguments for and against major cuts to staff and spending for federal government health agencies causes few people to change their views. When those who support cuts to the agencies hear that the cuts would negatively impact these agencies’ abilities to serve the public, about a quarter change their view, dropping overall support for the cuts to agencies nine percentage points, from 38% to 27%.

When opponents of the major cuts to federal government health agencies hear that it would help save money and reduce the size and scope of the federal government, about one in ten change their view, increasing overall support eight percentage points to about half (46%) of the public, while 53% remain opposed to the change. On many health issues, polls find that arguments can lead to large shifts in opinion, but that doesn’t seem to be the case here, with majorities continuing to oppose cuts in the face of arguments for them.

Majorities Oppose Cuts to Staff and Spending at Federal Health Agencies, Few Shift in Opposition When Presented With Argument for Cuts

Most of the public (54%) say cuts to staff and spending at federal government health agencies by the Trump administration and Musk’s Department of Government Efficiency (DOGE) go “too far” while three in ten (31%) think the cuts are “about right” and 14% say the cuts haven’t gone far enough. Republicans are largely in favor of the level of cuts at the federal government health agencies with six in ten (63%) saying the cuts have been “about right.” This is in stark comparison to the nine in ten Democrats (90%) and six in ten independents (57%) who say the cuts to health agencies have gone “too far.” MAGA Republicans are also much more likely than non-MAGA Republicans to say the cuts to staff and spending at federal government health agencies so far are “about right”, (64% vs. 46%). In fact, one-third (33%) of non-MAGA Republicans think the cuts have gone “too far.”

Half of Adults Say They Think Cuts to Federal Health Agencies Have Gone Too Far, Including One in Three Non-MAGA Republicans

In addition to believing the cuts have gone “too far,” the public expresses generally negative views about the manner in which the administration has approached these cuts. Asked which comes closer to their view, six in ten (59%) say “the administration is recklessly making broad cuts to programs and staff, including some that are necessary for agencies to function,” while a smaller share (41%) say “the administration is carefully making cuts to programs and staff to reduce fraud and waste, and to improve government efficiency.” Overall sentiment on this question is largely driven by partisanship. Large majorities of both Democrats (92%) and independents (65%) say the cuts have been reckless, while this view is shared by only one in five Republicans (18%). On the other hand, eight in ten (82%) Republicans think the administration is carefully making the cuts. MAGA supporters are much more likely to say that the administration is “carefully making cuts to programs and staff to reduce fraud and waste, and to improve government efficiency” compared to non-MAGA Republicans and Republican-leaning independents (87% vs. 57%). Notably, four in ten non-MAGA Republicans (42%) say the cuts have been reckless.

Six in Ten Adults Say the Trump Administration Is Recklessly Making Cuts to Federal Health Agencies, but Views Are Polarized Across Partisan Lines

There is Large Opposition to Funding and Staff Cuts at Government Health Agencies

With tepid support for cuts generally, very few also support major cuts to federal funding for specific programs such as Medicaid, Medicare, and Social Security. The House budget resolution is targeting federal cuts to Medicaid for up to $880 billion or more over the next 10 years, representing 29% of state-financed Medicaid spending per resident. Trump has promised not to cut Social Security, Medicare, and Medicaid benefits.

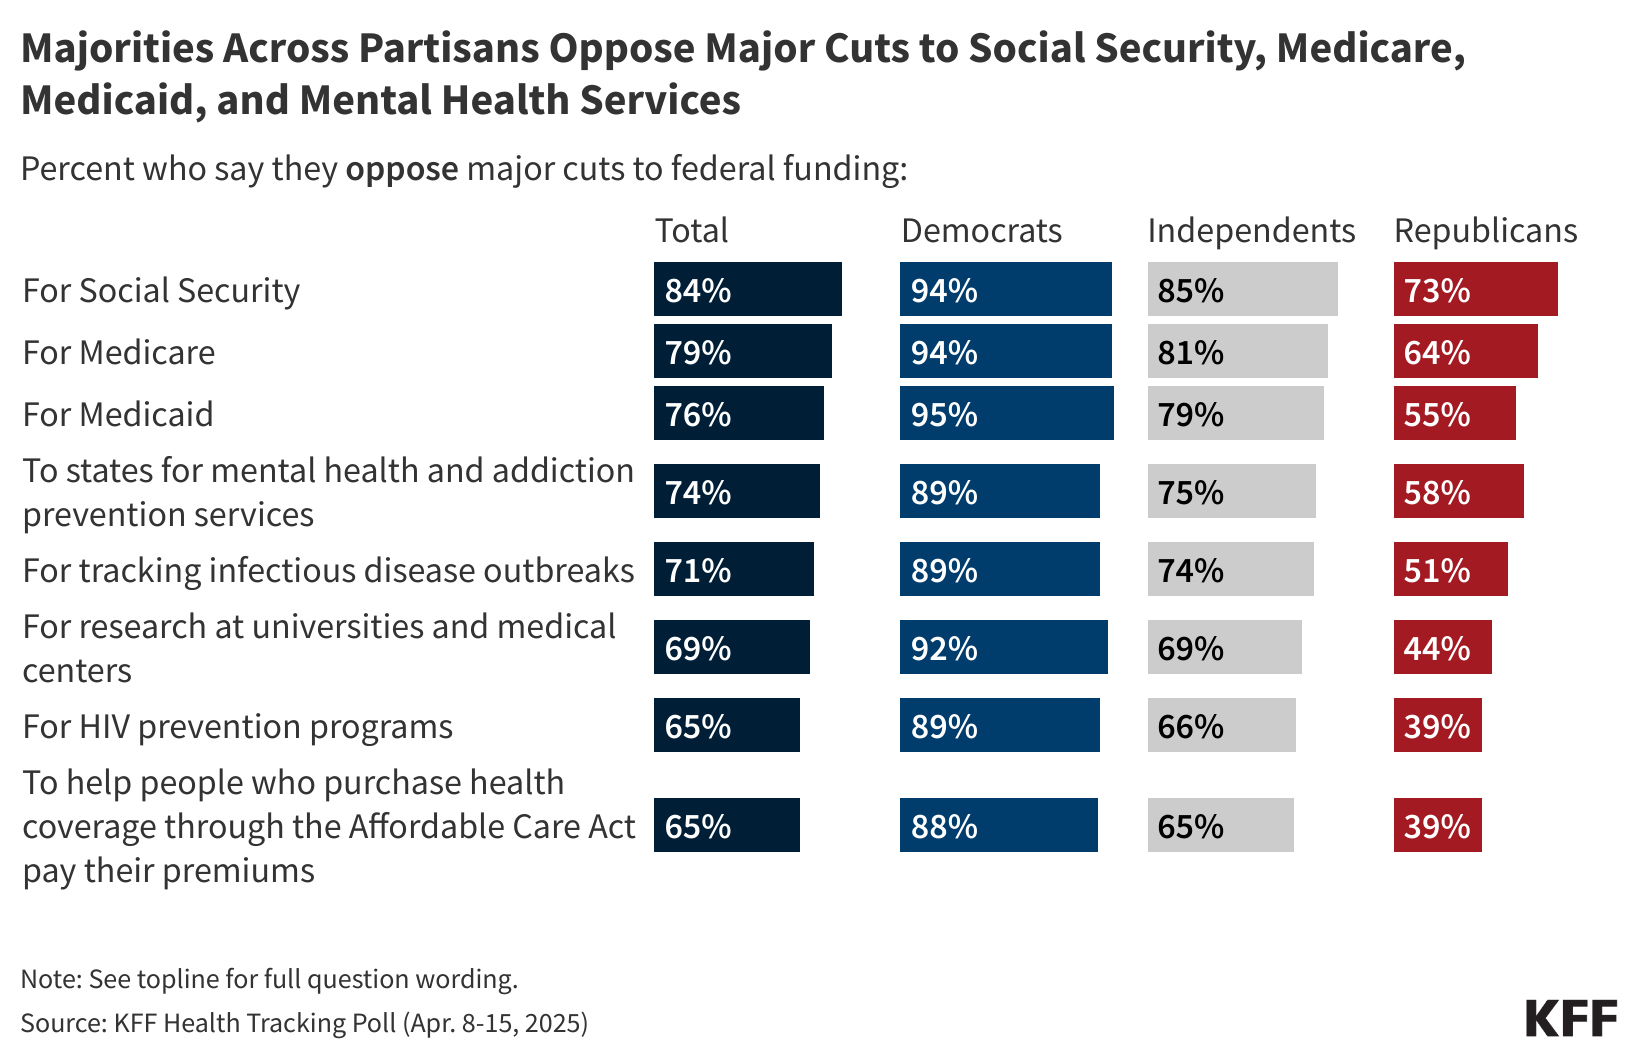
At least three-quarters of the public oppose major cuts to funding for Social Security (84%), for Medicare (79%), and for Medicaid (76%). Beyond these major programs, large shares of the public also oppose cuts in other areas of public health, research, and disease prevention. At least two-thirds oppose cutting funding to states for mental health and addiction prevention services (74%), for tracking infectious disease outbreaks (71%), for research at universities and medical centers (69%), for HIV prevention programs (65%), and to help people who purchase health coverage through the ACA to pay their premiums (65%). About one-third or fewer support major cuts to federal funding in each of these areas.

Majorities Oppose Major Cuts to Federal Funding for Public Health Programs, With at Least Three in Four Opposing Cuts to Social Security, Medicare, and Medicaid

Views on cuts to federal health spending are predictably partisan, with about nine in ten Democrats and at least two-thirds of independents opposed to funding cuts in each area included on the survey. On the other hand, about six in ten Republicans support major cuts to federal funding to help people who purchased coverage through the ACA to pay their premiums (61%) and for HIV prevention programs (61%), while about half of Republicans support cutting funding for research at universities and medical centers (56%) and for tracking infectious disease outbreaks (49%).

But majorities of Republicans oppose major cuts to funding for Social Security (73%), Medicare (64%), and Medicaid (55%). Additionally, a majority of Republicans (58%) oppose cuts to funding to states for mental health and addiction prevention services.

Majorities Across Partisans Oppose Major Cuts to Social Security, Medicare, Medicaid, and Mental Health Services

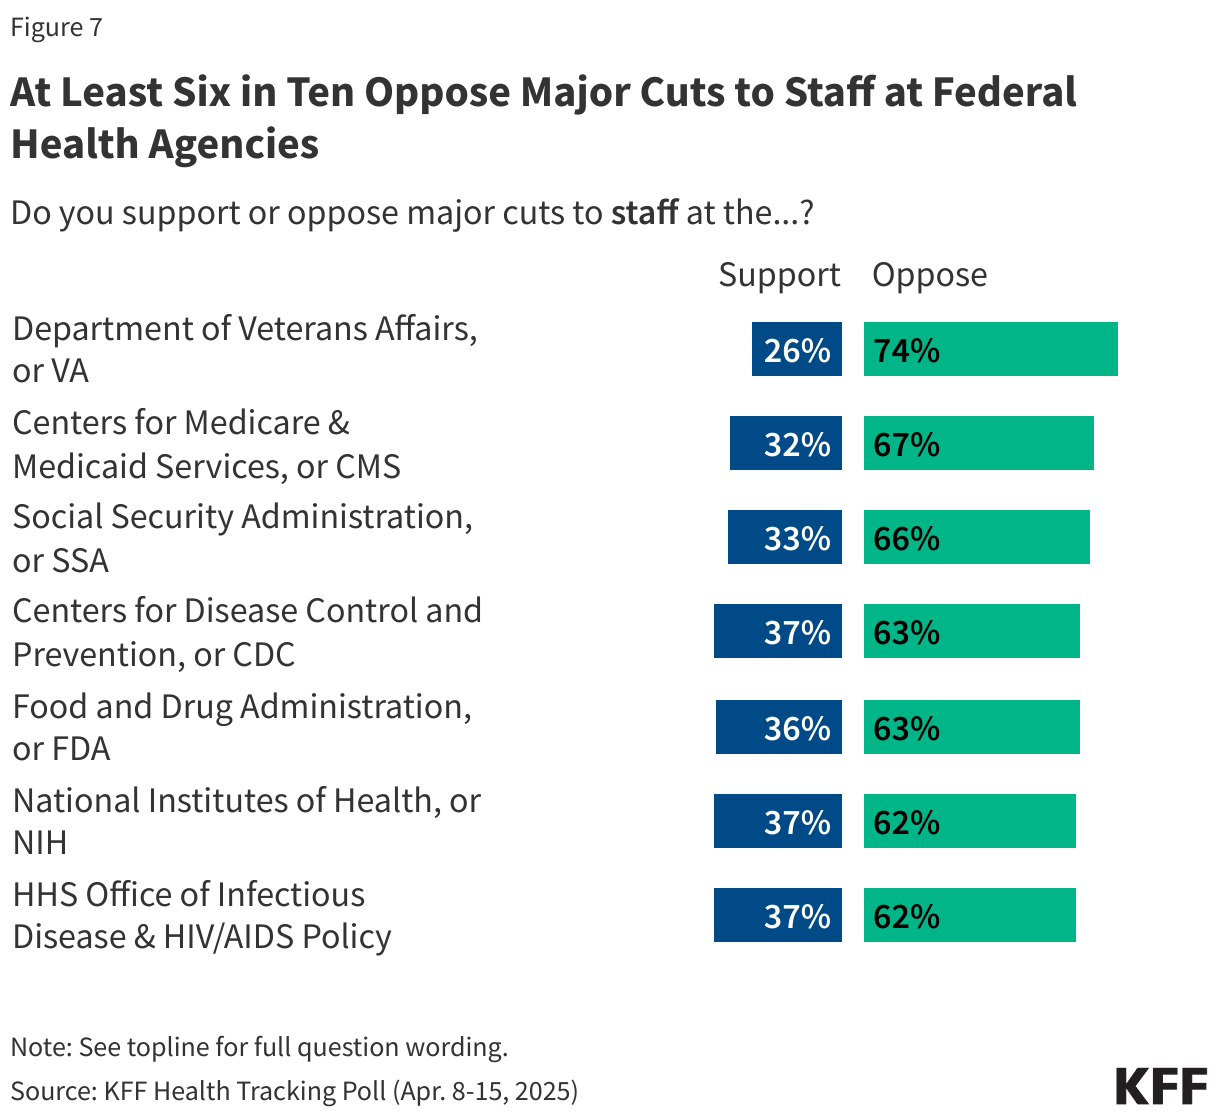
Many agencies have already undergone major staffing cuts under the Trump administration, including the Department of Veterans Affairs, or VA, which announced a plan to cut 83,000 jobs in March. Majorities of the public oppose major staffing cuts at government agencies with responsibilities in health. The largest opposition is to staffing cuts at the VA, which three-quarters of the public oppose.

At least six in ten of the public also oppose cuts to staff at the Centers for Medicare and Medicaid Services, or CMS (67%), the Social Security Administration, or SSA (66%), the Food and Drug Administration, or FDA (63%), the Centers for Disease Control and Prevention, or CDC (63%), HHS Office of Infectious Disease & HIV/AIDS Policy (62%), and the National Institute of Health, or NIH (62%).

At Least Six in Ten Oppose Major Cuts to Staff and Spending at Federal Health Agencies

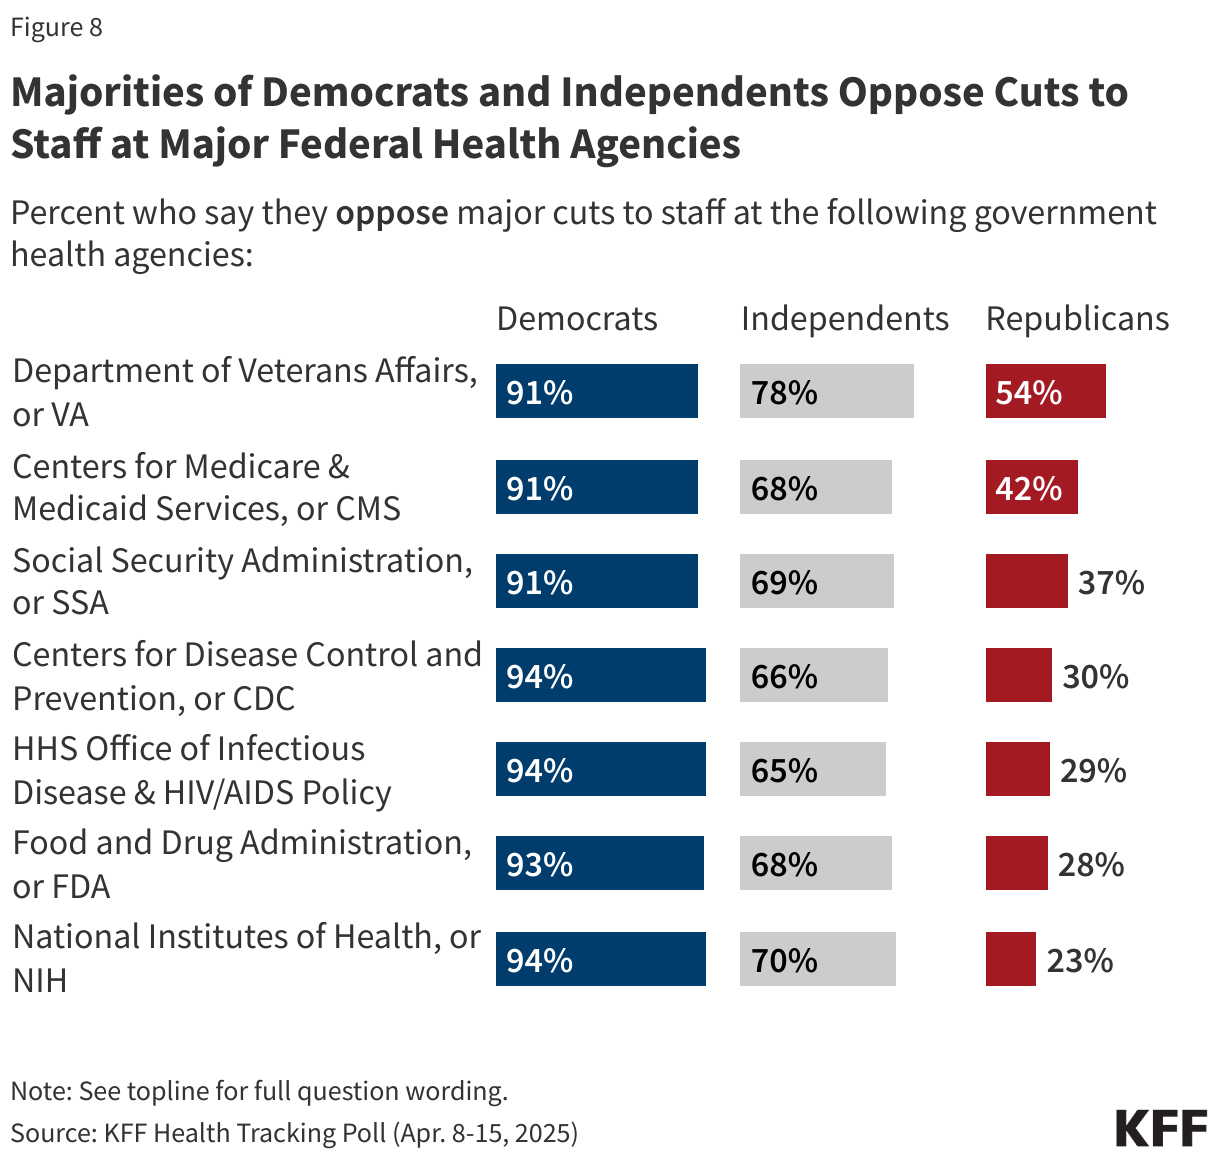
At least nine in ten Democrats oppose major staffing cuts at each of the health agencies included in the survey, while majorities of Republicans (between 58% and 77%) approve of such cuts at most agencies. One exception is staffing cuts at the Department of Veterans Affairs, or VA, with Republicans divided on the issue, with half supporting the cuts (46%) and half (54%) opposing.

Majorities of Democrats and Independents Oppose Cuts to Staff at Major Federal Health Agencies

Republicans and Republican-leaning independents who support the MAGA movement largely support the cuts to federal funding and staff, with a few notable exceptions.

Majorities of MAGA Republicans support major cuts to federal funding for HIV programs (66%), to help pay ACA premiums (64%), and for research at universities and medical centers (62%). About half support major cuts for tracking infectious disease outbreaks (51%), for Medicaid (51%), and to states for mental health and addiction prevention services (46%). Yet, fewer than four in ten MAGA Republicans support cutting funding for Medicare (38%) and just three in ten support cutting funding for Social Security.

When it comes to cutting staff, three-quarters support major cuts to staff at the HHS Office of Infectious Disease & HIV/AIDS policy (78%), CDC (78%), NIH (77%), and the FDA (75%). Another two-thirds support major cuts to staff at SSA (65%) and CMS (65%). Notably, less than half of MAGA-supporting Republicans (47%) support cuts to the VA.

Large Shares of MAGA Supporters Favor Many Cuts, But Mixed On Others

Concerns About Fraud, Waste, and Abuse in Federal Health Programs

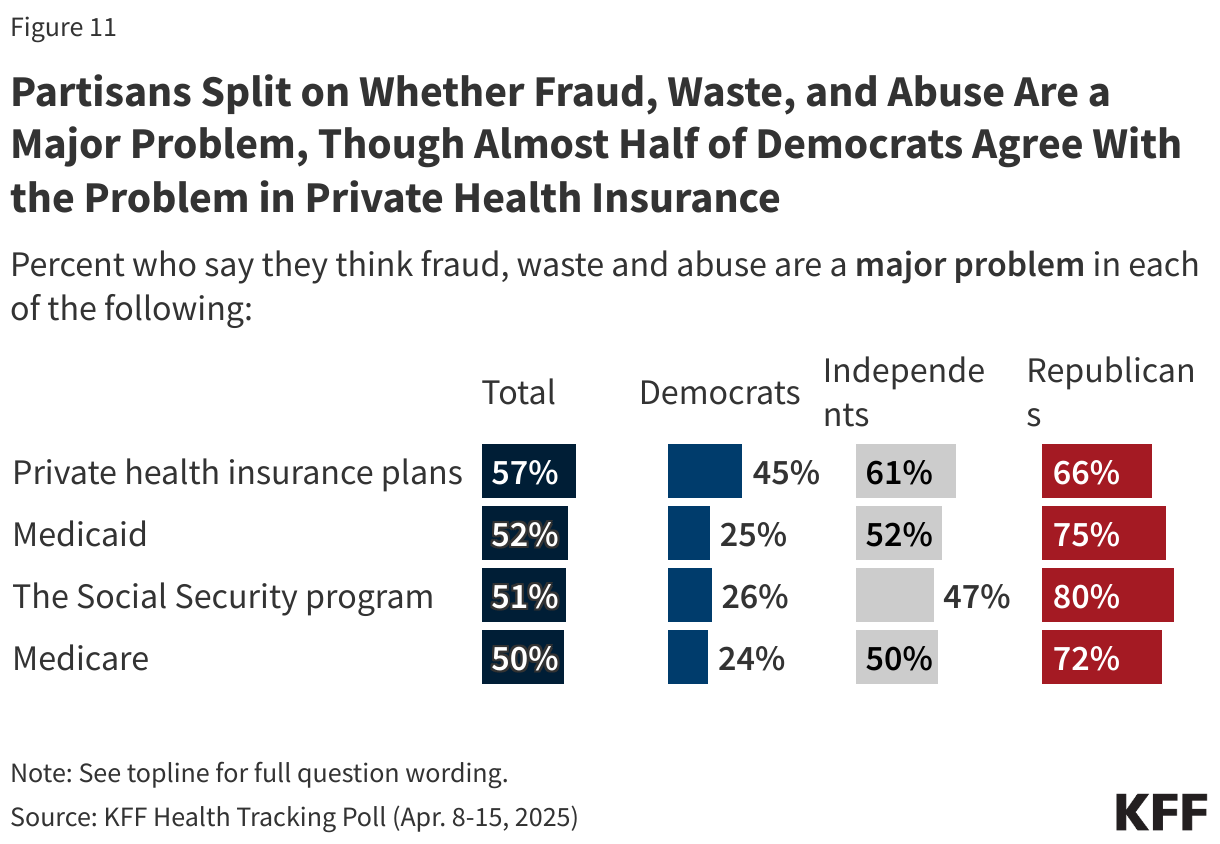
The Trump administration and DOGE have framed the cuts occurring throughout the federal government as eliminating “fraud, waste, and abuse”, implementing DOGE’s cost efficiency initiative. Large majorities of the public think fraud, waste, and abuse are a major problem facing our country’s health care programs, though most don’t view the problem as being limited to public health insurance programs. About six in ten (57%) think fraud, waste and abuse are a “major problem” in private health insurance plans, while about half say the same about Medicaid (52%), Social Security (51%), and Medicare (50%). Close to a third say fraud, waste, and abuse are a “minor problem” in each of these, while about one in ten say fraud, waste, and abuse are “not a problem”.

About Half of Adults Say They Think Was, Fraud and Abuse Are a Major Problem in Private Insurance Plans, Medicare, Medicaid and the Social Security Program

Republicans are about three times as likely as Democrats to say fraud, waste, and abuse are a major problem in Social Security (80% vs. 26%), Medicaid (75% vs. 25%) and Medicare (72% vs. 24%). There is a much smaller partisan difference in the share seeing fraud, waste, and abuse as a major problem in private health insurance, with two-thirds of Republicans (66%), six in ten independents (61%), and nearly half of Democrats (45%) sharing this view. MAGA-supporting Republicans are much more likely than non-MAGA Republicans to say fraud, waste, and abuse are major problem in private health insurance plans (69% vs. 58%), Medicaid (80% vs. 57%), Social Security (84% vs. 54%), and Medicare (77% vs. 53%).

Partisans Split on Whether Fraud, Waste, and Abuse Are a Major Problem, Though Almost Half of Democrats Agree With the Problem in Private Health Insurance

Adults in the U.S. are divided when identifying culprits of fraud, waste, and abuse in government health programs. One in three (33%) say that private health insurance companies are most often responsible for fraud, waste, and abuse in government health programs, with a similar share (29%) saying government employees running the programs are most responsible. One in five (20%) think hospitals, doctors, and other health care providers are responsible for most fraud, waste, and abuse in government health programs, while one in six (17%) say the same about people enrolled in the programs.

Less than a quarter across partisans blame people enrolled in the programs or hospitals, doctors, and health care providers for fraud, waste, and abuse in government health programs. Instead, half (49%) of Democrats identify private health insurance companies as the group most responsible for fraud, waste, and abuse while four in ten (42%) Republicans place the blame on government employees running the programs.

One in Three Say They Think Private Health Insurance Companies Are Most Responsible for Fraud, Waste, and Abuse in Government Health Programs

The Public Is Concerned How Cuts May Impact Services, but Some Think They Will Reduce Fraud and Waste and Bring Down the Deficit

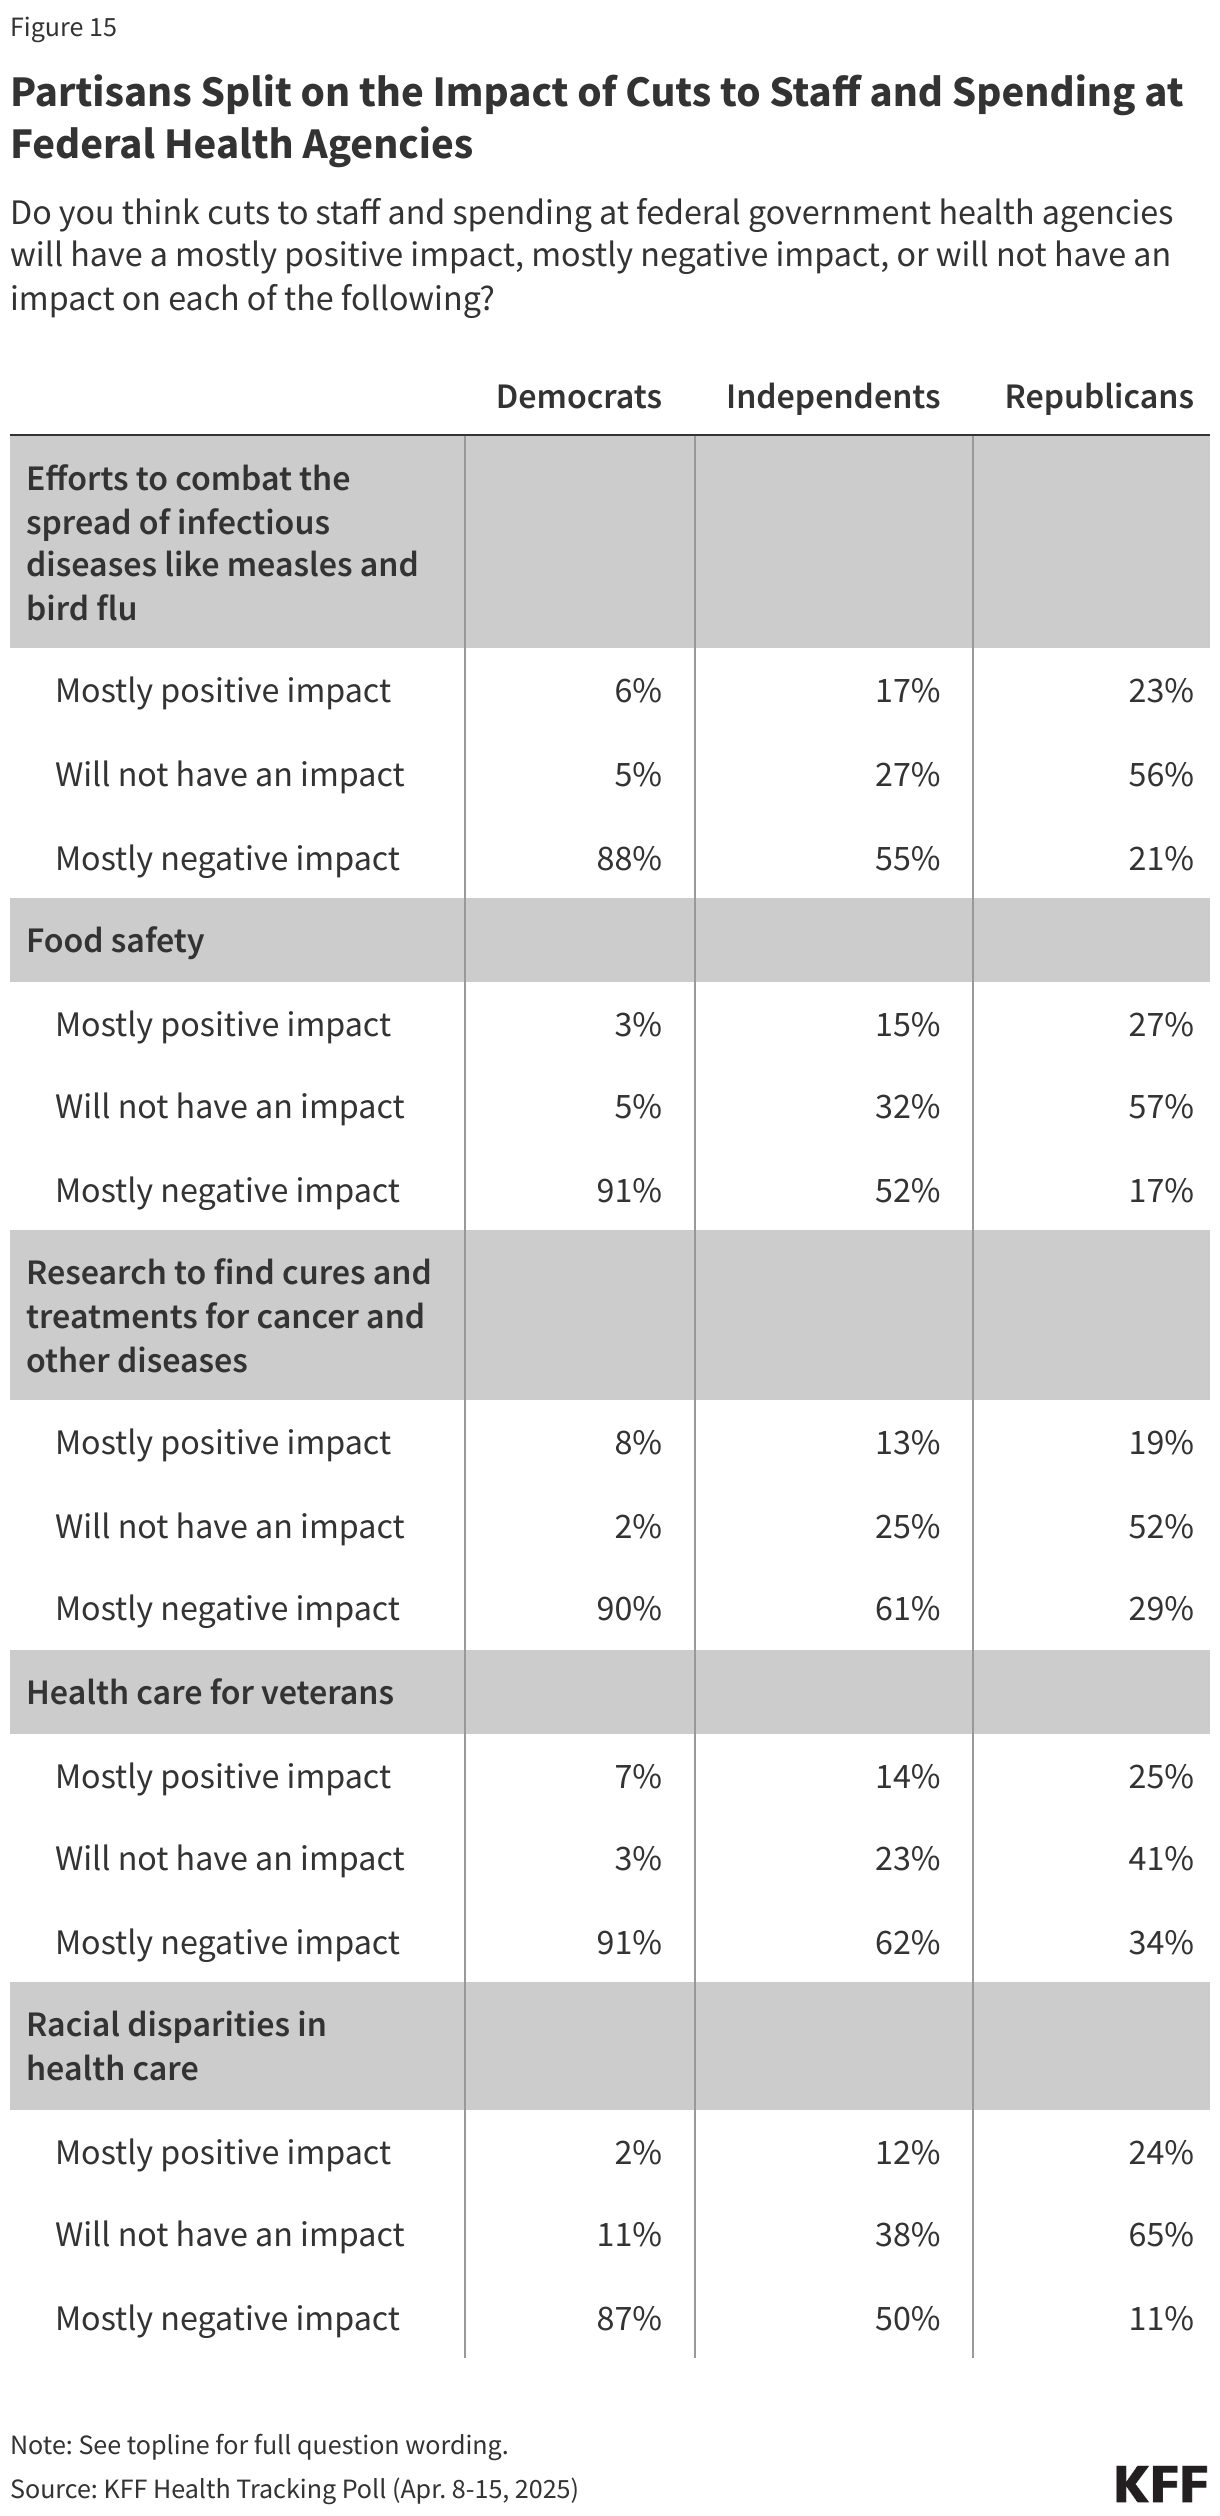
Majorities of the public believe that cuts to staff and spending at federal health agencies will have negative impacts in a variety of areas. Six in ten say these cuts will have a “mostly negative” impact on health care for veterans (62%) and on research to find cures and treatments for cancer and other diseases (60%). More than half of adults say there will be “mostly negative” impacts on efforts to combat the spread of infectious diseases like measles and bird flu (55%) as well as food safety (53%). Half believe the cuts will have a negative impact on racial disparities in health care. Fewer than one in six expect the cuts to have positive impacts in any of these areas.

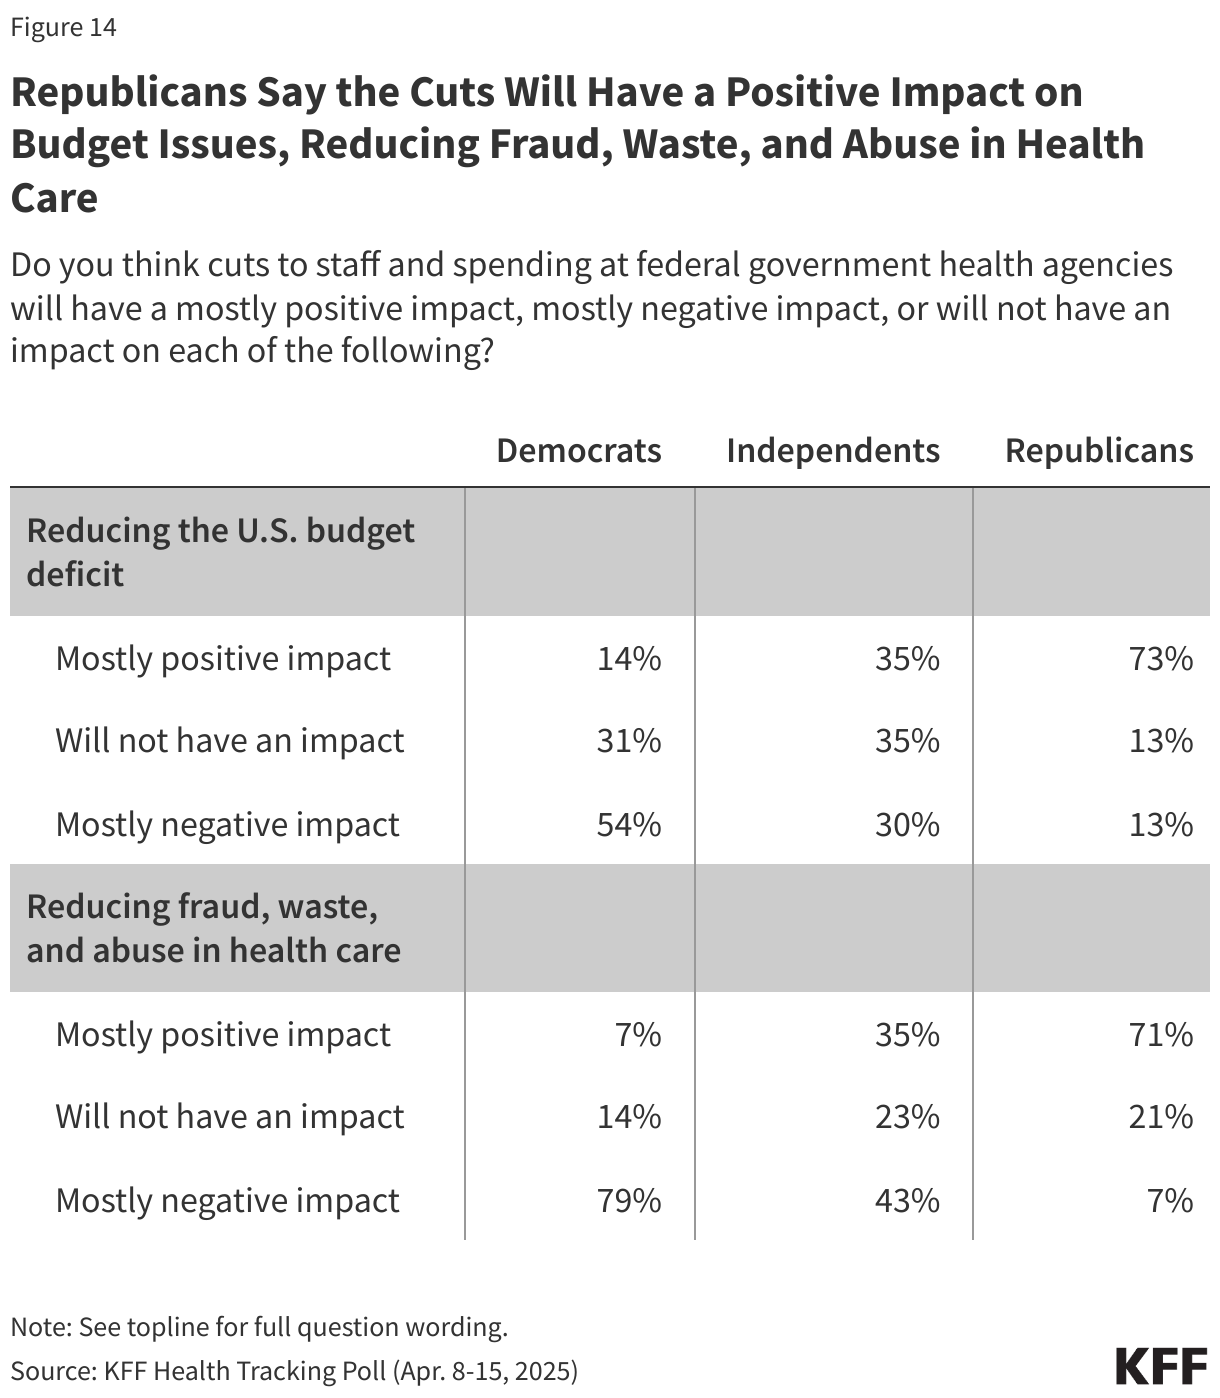
While President Trump and Elon Musk have framed many of the recent cuts as necessary to curb fraud and waste and reduce the federal budget deficit, the public is divided in their views of whether these goals are likely to be achieved. About four in ten (38%) say staff and spending cuts at federal health agencies will have a “mostly positive” impact on reducing fraud, waste, and abuse in health care, but a similar share (43%) say these cuts will have a “mostly negative” impact on reducing fraud, waste, and abuse. Similarly, while four in ten say cuts will have a positive impact on reducing the U.S. budget deficit, nearly as many (34%) say they will have a “mostly negative” impact.

Half or More Think Cuts to Staff and Spending at Federal Health Agencies Will Have Negative Impacts on Most Aspects, but Remain Split on the Impact Cuts Will Have on Budget

Most Democrats say the cuts to staff and spending will negatively impact health care for veterans (91%), food safety (91%), research to find cures and treatments for cancer and other diseases (90%), efforts to combat the spread of infectious diseases like measles and bird flu (88%), and racial disparities in health care (87%).

Republicans are more positive about how the cuts will impact the budget and waste in health care, with at least seven in ten saying the cuts will have a “mostly positive” impact on reducing the U.S. budget deficit (73%) and reducing fraud, waste, and abuse in health care (71%). Most Democrats say the cuts to staff and spending will have a “mostly negative” impact in these areas while independents are divided in how they think the cuts will impact fraud and waste as well as reducing the U.S. budget deficit.

Republicans Say the Cuts Will Have a Positive Impact on Budget Issues, Reducing Fraud, Waste, and Abuse in Health Care

Republicans are also more likely than both independents and Democrats to think that the cuts to staff and spending will not have any impact on the areas that affect public health, like racial disparities in health care (65%), food safety (57%), efforts to combat infectious disease (56%), and research to find cures for treatments for cancer and other diseases (52%). Majorities of independents and Democrats think the cuts will have “mostly negative” impacts in each of these areas.

Partisans Split on the Impact of Cuts to Staff and Spending at Federal Health Agencies

Methods

This KFF Health Tracking Poll/KFF Tracking Poll on Health Information and Trust was designed and analyzed by public opinion researchers at KFF. The survey was conducted April 8-15, 2025, online and by telephone among a nationally representative sample of 1,380 U.S. adults in English (1,322) and in Spanish (58). The sample includes 1,022 adults (n=48 in Spanish) reached through the SSRS Opinion Panel either online (n=997) or over the phone (n=25). The SSRS Opinion Panel is a nationally representative probability-based panel where panel members are recruited randomly in one of two ways: (a) Through invitations mailed to respondents randomly sampled from an Address-Based Sample (ABS) provided by Marketing Systems Groups (MSG) through the U.S. Postal Service’s Computerized Delivery Sequence (CDS); (b) from a dual-frame random digit dial (RDD) sample provided by MSG. For the online panel component, invitations were sent to panel members by email followed by up to three reminder emails.

Another 358 (n=17 in Spanish) adults were reached through random digit dial telephone sample of prepaid cell phone numbers obtained through MSG. Phone numbers used for the prepaid cell phone component were randomly generated from a cell phone sampling frame with disproportionate stratification aimed at reaching Hispanic and non-Hispanic Black respondents. Stratification was based on incidence of the race/ethnicity groups within each frame. Among this prepaid cell phone component, 194 were interviewed by phone and 164 were invited to the web survey via short message service (SMS).

Respondents in the prepaid cell phone sample who were interviewed by phone received a $15 incentive via a check received by mail. Respondents in the prepaid cell phone sample reached via SMS received a $10 electronic gift card incentive. SSRS Opinion Panel respondents received a $5 electronic gift card incentive (some harder-to-reach groups received a $10 electronic gift card). In order to ensure data quality, cases were removed if they failed two or more quality checks: (1) attention check questions in the online version of the questionnaire, (2) had over 30% item non-response, or (3) had a length less than one quarter of the mean length by mode. Based on this criterion, no cases were removed.

The combined cell phone and panel samples were weighted to match the sample’s demographics to the national U.S. adult population using data from the Census Bureau’s 2024 Current Population Survey (CPS), September 2023 Volunteering and Civic Life Supplement data from the CPS, and the 2024 KFF Benchmarking Survey with ABS and prepaid cell phone samples. The demographic variables included in weighting for the general population sample are sex, age, education, race/ethnicity, region, civic engagement, frequency of internet use, political party identification by race/ethnicity, and education. The weights account for differences in the probability of selection for each sample type (prepaid cell phone and panel). This includes adjustment for the sample design and geographic stratification of the cell phone sample, within household probability of selection, and the design of the panel-recruitment procedure.

The margin of sampling error including the design effect for the full sample is plus or minus 3 percentage points Numbers of respondents and margins of sampling error for key subgroups are shown in the table below. For results based on other subgroups, the margin of sampling error may be higher. Sample sizes and margins of sampling error for other subgroups are available on request. Sampling error is only one of many potential sources of error and there may be other unmeasured error in this or any other public opinion poll. KFF public opinion and survey research is a charter member of the Transparency Initiative of the American Association for Public Opinion Research.

GroupN (unweighted)M.O.S.E.
Total1,380± 3 percentage points
Parents of children under 18457± 6 percentage points
Party ID
Democrats469± 6 percentage points
Independents466± 5 percentage points
Republicans361± 6 percentage points
News Release

Most of the Public Oppose Major Federal Cuts to Health Agencies and Programs and Say They Have Been Made “Recklessly”

The Public, Including Most Republicans, Oppose Medicaid Cuts; MAGA Supporters Are Divided

Published: May 1, 2025

As the Trump administration and Congress pursue broad cuts to federal health agencies and budgets, most of the public, including some Republicans, oppose deep budget and staffing cuts to federal health programs and agencies, a new KFF Health Tracking Poll finds.

Across a range of questions, large majorities of Democrats and independents oppose the Trump administration’s major cuts to federal health agencies and programs, while Republicans are more supportive. Those who identify with President Trump’s Make America Great Again movement are even more supportive of cuts to health agency’s staff and budget but still split on cuts to funding for Medicaid and a few other programs.

For example, most of the public (61%), including large shares of Democrats (89%) and independents (67%), oppose major health spending and staff cuts at federal health agencies. In contrast, MAGA supporters overwhelmingly support such cuts (78%), while Republicans and Republican-leaning independents who don’t align with MAGA are divided (48% support the cuts, 52% oppose).

Similarly, most (59%) of the public, including large majorities of Democrats (92%) and independents (65%), say the Trump administration and its Department of Government Efficiency (DOGE) have been “recklessly making broad cuts to programs and staff.”  

In contrast, the vast majority of MAGA supporters (87%), and a narrower majority of non-MAGA Republicans and Republican leaners (57%), say that the administration is “carefully making cuts to programs and staff to reduce fraud and waste.”

On Medicaid, a contentious issue as the Trump administration and Congressional Republicans weigh budget cuts to help finance tax cuts, three quarters (76%) of the public say they oppose major federal funding cuts.

A narrow majority of Republicans (55%), as well as larger majorities of Democrats (95%) and independents (79%), oppose major Medicaid cuts. MAGA supporters are closely divided on major funding cuts to Medicaid, with similar shares in favor (51%) and opposed (49%) to major cuts.

Large Majorities Oppose Specific Cuts to Federal Health Programs and Agencies

The poll also gauges the public’s views on federal funding cuts for other health programs. In each case, more than six in 10 oppose specific federal health cuts.  For example:

  • About three quarters (74%) oppose major cuts to states for mental health and addiction prevention services. This includes a narrow majority of Republicans (58%), and large majorities of Democrats (89%) and independents (75%).
  • Most (71%) oppose major cuts to funding to track infectious disease outbreaks. This includes half of Republicans (51%), and large majorities of Democrats (89%) and independents (74%).
  • Seven in 10 (69%) oppose major cuts to research at universities and medical centers. This includes large majorities of Democrats (92%) and independents (69%). In contrast, most Republicans (56%) favor such cuts.
  • Nearly two thirds (65%) oppose reduced federal funding to help people pay the premiums for health coverage purchased through the Affordable Care Act marketplaces. This includes large majorities of Democrats (88%) and independents (65%). In contrast, most Republicans, (61%) favor such cuts.

Most of the public also opposes major staffing cuts to key federal health agencies such as the Department of Veteran Affairs (74% oppose), Centers for Medicare & Medicaid Services (67%), the Centers for Disease Control and Prevention (63%), the Food and Drug Administration (63%), and the National Institutes of Health (62%).

Republicans and MAGA supporters narrowly oppose major staffing cuts for Veterans Affairs but favor them at each of the other agencies.

Partisans See Different Drivers of Fraud and Waste in Government Health Program

About half of the public say that fraud, waste, and abuse are a major problem in Medicaid (52%), Social Security (51%), and Medicare (50%), and a slightly larger majority say it is a major problem in private health insurance (57%).

Partisans choose different groups when asked who is most responsible for fraud, waste, and abuse in government health programs. About half of Democrats (49%) say private health insurers are most responsible, while Republicans most often name government workers (42%). Fewer across partisans blame people enrolled in the programs or hospitals, doctors and other health providers.

Designed and analyzed by public opinion researchers at KFF, this survey was conducted April 8-15, 2025, online and by telephone among a nationally representative sample of 1,380 U.S. adults in English and in Spanish. The margin of sampling error is plus or minus 3 percentage points for the full sample. For results based on other subgroups, the margin of sampling error may be higher.

Medicaid Work Requirements: Implications for Low Income Women’s Coverage

Published: Apr 30, 2025

Work requirements for Medicaid enrollees have once again resurfaced, now as part of a broader legislative package of potential changes for the Medicaid program aimed at reducing federal spending. Given that women make up over half of adult Medicaid enrollees and women’s well documented role taking on childcare and family responsibilities, Medicaid work requirements would heavily impact women in the program. Full details of the work requirements proposal are still unknown, but analysis of previous legislation from the Congressional Budget Office found that while national work requirements would lower federal spending, they would lead to a drop in Medicaid enrollment and an increase in the number of people who are uninsured but would not increase employment.

The first Trump Administration made a significant change to the Medicaid program by giving states the option to impose work requirements as a condition of Medicaid eligibility through Section 1115 waivers. While 13 states received approval for work requirement waivers, many were struck down in court and the Biden administration rescinded the remaining waivers. Today, only Georgia has a Medicaid work requirement in place for parents and childless adults with incomes below 100% of the federal poverty level (FPL) who are newly eligible through the state’s Pathways waiver. However, several states have submitted or are developing new 1115 waivers or considering legislation to condition Medicaid eligibility on meeting work and reporting requirements.

Medicaid, the nation’s health program for low-income people, provided health and long-term coverage to one in five adult women ages 19 to 64 in 2023. Imposing work requirements in Medicaid would heavily impact women on the program and could lead to Medicaid coverage losses not only for those who lose eligibility because they don’t work or meet an exemption but also among people who remain eligible for the program but lose coverage due to new administrative burdens or red tape. This data note documents differences by sex in the work status of adult Medicaid enrollees ages 19-64 who were not receiving Supplemental Security Income (SSI) and were not dually eligible for Medicare in 2023, and highlights differences by parent status.

What is the work status of women and men covered by Medicaid?

Over nine in ten women and men on Medicaid were working full or part-time for pay or were not working because of caregiving responsibilities, illness or disability, or school attendance in 2023 (Figure 1).1  More than half of men (54%) and more than a third of women (36%) on Medicaid worked full-time during the year. A larger share of women (24%) compared to men (15%) worked part-time. Four in ten (40%) women and three in ten (31%) men enrolled in Medicaid did not work for pay in 2023, most for reasons that would likely exempt them from work requirements.

Among Medicaid adults who are not working, women are more likely to cite caregiving responsibilities while men are more likely to report an illness or disability as reasons for not working. One in five (19%) women enrolled in Medicaid did not work in 2023 because of caregiving responsibilities, compared to 4% of men (Figure 1). One in ten (9%) women said they did not work because of an illness or disability and 6% did not work because they were going to school. Similar shares of men and women report school as the reason they did not work. All the leading reasons women cite for not working would likely qualify for exemptions from state-level Medicaid work requirements. Depending on how work requirement policies are crafted, women who are exempt may have to submit paperwork to document the reasons for their exemption to remain eligible for Medicaid coverage.

Among Those Enrolled in Medicaid, Six in Ten Women and Seven in Ten Men Worked in 2023

Many Medicaid enrollees are working in service jobs with few benefits, such as health insurance and paid sick days. The top industries that employ women with Medicaid are the restaurant and food service industry, schools, and hospitals, while men tend to work in construction, the restaurant and food service industry, and landscaping services (Appendix Table 2).

What are the reasons that some adults work part-time?

Women were more likely than men to cite family obligations and child care issues as reasons for working part-time. Almost one in four (24%) women with Medicaid worked part-time in 2023 compared to one in seven (15%) men (Figure 2). Women were more likely than men to report they worked part-time because of family or personal obligations (27% vs. 12%) or child care problems (12%; data for men suppressed because it did not meet the minimum standards for statistical reliability). Four in ten men and three in ten women said they worked part time because of slack work/business conditions, they could only find part-time work or because their work week was less than 35 hours. Similar shares of women and men with Medicaid coverage worked part-time because of school or training responsibilities or because of health or medical limitations. Individuals who are working part-time are often ineligible for benefits even if they are offered by their employers, particularly health insurance coverage.

Among Part-Time Workers, Childcare Problems and Family Obligations Are the Leading Reason for Part Time Work for Women

What is the work status of mothers and fathers with Medicaid coverage?

Parents with children under 18 – both mothers and fathers – with Medicaid were more likely to work for pay in 2023 than Medicaid adults without dependent children, but fathers were more likely to work than mothers. Just under half (48%) of women ages 19 to 64 with Medicaid have children under 18 as do one-third of men on the program. About two-thirds (64%) of women with children under 18 and 87% of men with children under 18 worked full or part-time compared to 56% of women and 59% of men without children under 18 (Figure 3). Fathers were more likely to work full-time compared to mothers (78% vs. 40%) in 2023. The leading reason cited by mothers for not working (28%) was they were taking care of children and family.

Among women and men without children, the leading reason for not working was an illness or disability (13% and 15%, respectively). One in ten women and men without children reported they were not working because they were going to school (10% and 9%, respectively). Notably, even among women without children, over one in ten (11%) said they were not working because of caregiving responsibilities, which could include caring for adult children or aging or ill parents (Figure 3). Caregiving responsibilities generally consume a lot of a person’s time and could make it difficult to meet paperwork requirements to file for exemptions from work requirements.

Three in Ten Women Enrolled in Medicaid with Children Under Age 18 Are Not Working Due to Caregiving Responsibilities

Appendix

Share of Working Adult Medicaid Enrollees by Demographic Characteristics and Sex, 2023

Top Industries and Occupations With the Largest Number of Workers With Medicaid Coverage by Sex, 2023
Percent of Working Adult Medicaid Enrollees by Sex and Parental Status, 2023
  1. This data note is based on KFF analysis of data from the Current Population Survey ASEC Supplement, which stratifies data by an individual’s sex as male or female. Throughout this brief we refer to “women” and “men” but recognize that not all people who are born as females identify as “women” and not all people who are born as male identify as “men.” ↩︎

5 Questions About the Idea of Default Enrollment into Medicare Advantage Plans

Published: Apr 29, 2025

President Trump has said he will not cut Medicare benefits. At the same time, key figures within the administration, policymakers, and some conservative groups have previously expressed support for boosting the role of Medicare Advantage within the Medicare program, which could include changing the Medicare enrollment process, making Medicare Advantage the default enrollment option rather than traditional Medicare. Under current law, people who sign up for Medicare Parts A and B are automatically enrolled in traditional Medicare, unless they affirmatively choose to enroll in a Medicare Advantage plan. In contrast, under a Medicare Advantage default enrollment approach, unless Medicare beneficiaries make an affirmative choice to enroll in either traditional Medicare or a specific Medicare Advantage plan, they would be automatically enrolled into a Medicare Advantage plan, with the option to switch plans or enroll in traditional Medicare.

This brief considers how default enrollment into Medicare Advantage might work, potential challenges with this approach, and implications for beneficiaries, insurers, providers, agents and brokers, and the federal budget.

How would default enrollment into Medicare Advantage differ from the current enrollment process?

In general, when eligible people first enroll in Medicare during their Initial Enrollment Period (IEP), they can sign up for Medicare Part A and Part B. Once enrolled, new Medicare beneficiaries have the option to get their benefits under traditional Medicare or a private Medicare Advantage plan. New Medicare beneficiaries are automatically covered under traditional Medicare unless they choose to enroll in a Medicare Advantage plan in their area. In 2025, beneficiaries have a choice of 34 Medicare Advantage plans with prescription drug coverage, on average.

In 2023, about 2.8 million beneficiaries newly enrolled in Medicare, with slightly more than half (54%) or 1.5 million people covered by traditional Medicare and slightly less than half (46%) or 1.3 million enrolling in Medicare Advantage (Figure 1). For those covered by traditional Medicare when they newly enrolled in Medicare, it is possible that they made a change to their coverage and switched to a Medicare Advantage plan after their initial enrollment period. Defaulting individuals into a Medicare Advantage plan would be a change in the way most new Medicare beneficiaries get their coverage.

In 2022, Slightly More Than Half (56%) of Newly Eligible Medicare Beneficiaries Were Covered by Traditional Medicare

In contrast to the current approach, some have proposed to enroll newly eligible beneficiaries in Medicare Advantage by default, rather than traditional Medicare. Proposals vary in the level of detail, but in general, this process would involve assigning individuals to a specific Medicare Advantage plan based on certain criteria, such as patient-provider relationships or plan attributes, as discussed below.

Default options have been used across a variety of fields, including in the areas of retirement savings, organ donations, and electricity pricing programs. In these instances, defaulting people into certain programs with the option to opt out have shown to have a powerful effect on people’s choices, often resulting in a large share of people accepting the default option. In an analysis of default enrollment into Medicare Part D plans for certain low-income beneficiaries (as discussed in more detail below), the authors found that only 16% of individuals opted out of the plan they were randomly defaulted into and actively selected a new plan. The evidence on the impact of default enrollment on individual choices is one of the reasons proponents have put forward this approach for Medicare Advantage.

There are a number of questions about proposals to default beneficiaries into Medicare Advantage plans, along with tradeoffs, such as:

  • What criteria would be used to assign new Medicare beneficiaries to a specific Medicare Advantage plan offered in their area, and how would the assignment to a private plan affect the continuity of care between patients and their doctors (due to provider networks), the ability of beneficiaries to access drugs prescribed by their doctors (due to variations in plan formularies) or timely access to services (due to prior authorization requirements)?
  • Would the new system take into account special considerations such as whether the new Medicare beneficiary has a disability, is covered under both Medicare and Medicaid, or has a condition that requires access to specific medical providers or health care facilities within proximity to their home?
  • What information would be provided to beneficiaries who are default enrolled into a Medicare Advantage plan about other Medicare coverage options that are available to them, including other Medicare Advantage plans or traditional Medicare and stand-alone Part D prescription drug plans in their area? How much time would beneficiaries be given to make a change before being locked in until the next annual open enrollment period?
  • Will beneficiaries who wish to switch out of the Medicare Advantage plan in which they were enrolled and switch to traditional Medicare be provided a special enrollment period for Medigap, without pre-existing condition exclusions, if they choose to switch beyond the current 12-month “trial period” for people switching from Medicare Advantage to traditional Medicare regardless of the duration of their enrollment in Medicare Advantage?
  • How would this approach impact insurers that offer Medicare Advantage plans? Would insurers have the option to opt out of the default enrollment system and continue to enroll new Medicare beneficiaries? What would be the impact on insurance brokers?
  • What would be the impact of default Medicare Advantage enrollment on Medicare spending? While some claim this approach could achieve savings, the increase in Medicare Advantage enrollment that results from default enrollment would likely increase Medicare spending (and Part B premiums paid by all beneficiaries), without a change in current payment methodology. The Medicare Payment Advisory Commission (MedPAC) has consistently found that Medicare pays more for people enrolled in Medicare Advantage than for similar beneficiaries in traditional Medicare.

How would the government assign individuals to Medicare Advantage plans?

One of the main policy considerations for proposals that would default beneficiaries into specific Medicare Advantage plans is how the government would make this assignment. This is particularly challenging because plans vary across an array of features, including premiums, cost sharing for services, provider networks, drug coverage, plan quality (star ratings), extra benefits, and the frequency with which they impose prior authorization requirements and issue denials.

There are a number of different approaches that could be considered to implement default enrollment into Medicare Advantage:

  • Random assignment. The government could randomly assign new Medicare beneficiaries to one of the plans offered in their area. This would ensure more even distribution of enrollment across plans, without benefiting one plan (or insurer) over another. However, random assignment would not take into account any plan features that might matter to individual beneficiaries, such as premiums, cost sharing, the scope of extra benefits, existing relationships with providers, drugs taken by the individual, or quality ratings.
  • CMS currently uses random assignment for certain beneficiaries with LIS, a process which is intended to ensure a generally even distribution of beneficiaries among benchmark (premium-free) plans and to minimize selection bias for plans. However, this process does not match an individual’s prescription drugs with the list of drugs covered by plans, as opposed to a more targeted approach (“intelligent assignment” or “person-centered” assignment, which has been proposed by some advocates and policymakers) tries to align beneficiary needs with plan features. The possibility for greater discordance between an individual’s medical care needs and circumstances would likely arise with a random approach to default enrollment in Medicare Advantage plans, which would encompass more domains than just prescription drugs, such as continuity of coverage with primary care providers.
  • Preserve existing relationships with physicians, specialists and other health care providers. Some proposals would assign patients to plans based on their relationship with a primary care provider or a specific specialist. Being able to see preferred providers in-network is one of the plan elements that is a top priority for beneficiaries. However, this process might not be able to take into account relationships with all providers and may not account for relationships with providers that are most consequential to beneficiaries (e.g., for some beneficiaries it might be their primary care physician while for others it might be a certain specialty care physician). If there are also only one or two insurers offering plans in a certain area, any existing provider relationships may not be able to be prioritized at all if providers are not in plan networks. This process would also require a way to identify relationships with providers for individuals who are not yet covered by Medicare, which could prove challenging.
  • Challenges with preserving existing provider relationships for beneficiaries automatically assigned to plans were evident as part of the Financial Alignment Initiative (FAI) for beneficiaries enrolled in both Medicare and Medicaid. As part of this demonstration, states were required to try to assign enrollees to plans based on the individual’s most frequently utilized providers and medical facilities to best meet the individual’s current needs and circumstances. To do this, states could use the most recent 12 months of Medicare and Medicaid claims data, though this data was not always available. Beneficiaries automatically assigned to plans were able to opt-out, however, and there were high-opt out rates among beneficiaries, due to a number of factors, including enrollees being satisfied with existing care and not seeing the benefit of being in one of the demonstration plans and resistance from providers who refused to participate in the plan’s network and encouraged their patients not to participate. In California, for example, after the first evaluation of the demonstration, only about 50 percent of beneficiaries in the demonstration plans were able to retain their primary care providers, and those beneficiaries who were not able to maintain existing relationships with providers were more dissatisfied with the new plans. Similar issues could arise for Medicare Advantage default enrollment if the assignment process is not able to adequately match beneficiaries with their current providers.
  • Zero-dollar premiums (other than the Part B premium). Some proposals would assign beneficiaries to plans with a zero-dollar premium. Using this approach would prioritize a plan parameter that is often cited as a top reason for selecting a Medicare Advantage plan, making it very meaningful to potential enrollees. There are a small share of beneficiaries who do not have access to a plan with a zero-dollar premium – about 325,000 people in 2025 – and in those situations, assignment could be based on the lowest premium available in the area. However, nearly all beneficiaries (99%) have access to a Medicare Advantage plan with drug coverage with no additional monthly premium. Depending on the area, this plan parameter may not be enough to differentiate among plans.
  • Star ratings. Some proposals would base assignment on plan quality, placing Medicare beneficiaries in plans with star ratings of 4 or higher. According to CMS, 40% of Medicare Advantage plans with prescription drug coverage earned a star rating of 4 of higher for their 2025 rating, with 62% of Medicare Advantage enrollees currently in plans that will have stars of 4 or higher in 2025. Similar to zero-dollar premium plans, depending on the area, using the quality rating measure alone may not be enough to differentiate among plans. Further, MedPAC has recommended replacing the quality-bonus program which assigns stars because it asserts that this system does not provide a reliable indicator of quality, and Medicare focus groups have shown that few beneficiaries consider quality ratings when choosing a plan, so this approach alone may not adequately match enrollees with plans that meet their preferences.
  • Drug coverage. Individuals could be assigned to plans based on the drugs they take and whether those drugs are on the plan formulary. While coverage of prescription drugs is an important part of plan selection, implementing this kind of approach could prove challenging since it would require, at a minimum, identifying the list of prescription drugs used by people not yet covered by Medicare and could result in assigning people to plans that cover some but not all of their medications.Challenges in implementing this kind of approach have been apparent in the case of the LIS random assignment process, which has been used since the program’s beginning in 2006. Advocates and policymakers have called for using intelligent assignment or beneficiary-centered assignment instead of the current LIS random assignment process to minimize potential disruptions in access to specific medications for beneficiaries who become eligible for LIS. This approach would take into account enrollees’ current prescriptions and pharmacies. CMS previously considered modifying the current assignment process for LIS enrollees but did not implement any changes.
  • Preserve existing relationships with insurers. Assignment could be based on maintaining a relationship with an insurer based on the plan an individual was enrolled in before enrolling in Medicare. Medicare focus groups have shown that some beneficiaries choose their Medicare Advantage plan based on prior relationships with insurers because they feel comfortable with them. Continuing a plan with the same insurer could potentially preserve some relationships with providers or may be more likely to cover the drugs beneficiaries already take, but commercial plans may have different networks than Medicare plans, and provider networks change from year to year, as do formularies. It might also be difficult to identify insurance coverage for individuals prior to their enrolling in Medicare and in some areas, it may not be an option to continue coverage from a specific insurer if they do not sponsor Medicare Advantage plans.
  • Lowest cost plan. Assignment could also be based on the “lowest cost plan” offered in an area. If a goal of default enrollment into Medicare Advantage is to save money for the Medicare program, assigning beneficiaries to plans with the lowest “bid” to provide Medicare Part A and B services at the lowest cost in a specific area may be a way to achieve this. It could also encourage competition among insurers to provide care most efficiently. However, it might also mean enrollees assigned to the lowest-bid plan in an area end up with a less generous set of supplemental benefits, a more narrow network of providers, face higher cost-sharing requirements, or are subject to more utilization review requirements, than other available plans if a plan is trying to cut costs to be the lowest cost option.

What are the implications for beneficiaries, insurers, providers, and agents and brokers?

Beneficiaries. Proponents of default enrollment into Medicare Advantage observe that this approach would provide more individuals with access to benefits beyond those covered by traditional Medicare, such as dental, vision, and hearing benefits, lower cost sharing and an out-of-pocket limit. Beneficiaries would have access to all Medicare-covered and extra benefits, without needing a separate Part D plan or separate supplemental policy, such as Medigap, and Medicare Advantage plans have potential to provide better coordinated care than traditional Medicare.

At the same time, people who are newly eligible for Medicare may not be aware of the differences between traditional Medicare and Medicare Advantage and might accept default enrollment into a Medicare Advantage plan without understanding the potential implications. For example, while Medicare Advantage potentially offers coverage at lower costs with extra benefits not available in traditional Medicare, there are tradeoffs with Medicare Advantage plans, including more limited provider networks compared to traditional Medicare as well as the potential for denials or delays in care related to the use of prior authorization in Medicare Advantage. Default enrollment could also result in more enrollees experiencing cost-related problems than would be encountered by beneficiaries with traditional Medicare and other types of supplemental coverage, such as Medigap. Furthermore, only a small share of Medicare beneficiaries compare plans, meaning that once enrolled in a plan, beneficiaries are unlikely to review their coverage options, potentially leaving them in a plan that does not best meet their individual needs and preferences.

There are also tradeoffs and complications involved with the process of defaulting beneficiaries into Medicare Advantage plans, though the effects would vary on key policy decisions, such as the criteria used by the government to assign beneficiaries to specific Medicare Advantage plans, as discussed above. For example, if beneficiaries are assigned to a plan that does not have one or more of their doctors in network, the assignment could disrupt existing patient-provider relationships, which could be a particular concern for patients with serious medical conditions. Default enrollment algorithms may also not take into account beneficiaries’ health care needs and preferences, such as specific drugs on a formulary.

Insurers. Depending on how a default enrollment approach was structured, it would have implications for insurers, which could result in the realignment of the market in ways that would benefit some insurers but be negative for others. For example, if the assignment process gave priority to a previous insurer relationship, such as through a former employer, this could favor certain insurers who also offer private commercial insurance and disadvantage insurers who have a smaller presence in commercial insurance markets. A previous insurer relationship could also benefit insurers who have a strong presence in both Medicaid and Medicare, as millions of people on Medicaid ultimately become eligible for Medicare. If assignment was prioritized on certain metrics, such as preserving existing provider relationships, quality or premiums, this could favor established insurers who are more dominant in certain areas, rather than smaller insurers and newer entrants to the Medicare Advantage market. Conversely, a random assignment process could be more equitable in terms of allocating beneficiaries to all types of insurers. Some consideration would need to be given to the distribution of new beneficiaries if some insurers offered more plans than others, which would increase their share of new enrollees. Overall, most of these approaches would likely have adverse effects on insurers that have historically relied more heavily on brokers and marketing to attract new enrollees when they first sign up for Medicare.

Providers and Health Systems. Providers are likely to be impacted by a change in default enrollment for newly eligible Medicare beneficiaries. Recent news reports have indicated that some providers and health systems have dropped certain Medicare Advantage plans from their networks or are no longer taking Medicare Advantage altogether, due to what they claim are burdensome prior authorization requirements, slow payments from plans, and denied claims. Some health systems have also questioned whether they can afford to have Medicare Advantage plans in their networks based on reimbursement from these plans. For example, a recent study found that Medicare Advantage plans reimburse rural hospitals at just 90.6% of traditional Medicare rates on a cost basis. Further expansion of Medicare Advantage enrollment under a default enrollment approach could exacerbate tensions between providers and Medicare Advantage plans, which could disrupt access to care for both current and new Medicare Advantage enrollees.

Agents and Brokers. About one in three Medicare Advantage enrollees rely on insurance agents and brokers to help them select their Medicare Advantage coverage. Agents are paid a commission for signing up Medicare beneficiaries to plans and also receive compensation if enrollees renew their plan. Currently, for beneficiaries who do not select a Medicare Advantage plan and are default enrolled into traditional Medicare, agents do not play a role in their Medicare Parts A or B coverage, though they may help them select Part D prescription drug coverage and a Medigap supplemental policy. If instead new Medicare beneficiaries largely relied on a default enrollment system that auto-assigned them to a Medicare Advantage plan, rather than using an agent or broker to help them choose a plan, this change could disrupt business practices and revenues for insurance agents and brokers.

What are potential implications for the federal budget?

In 2025, MedPAC found that Medicare pays 20% more for enrollees in Medicare Advantage than it would cost to cover them in traditional Medicare, a total of $84 billion dollars in additional spending in 2025 alone. In the absence of any changes to Medicare Advantage payment policy to reduce expenditures, a default enrollment approach into Medicare Advantage would likely increase annual Medicare spending above currently projected levels. One study on default enrollment into Medicare Advantage estimates that federal outlays could increase by $189 billion to $269 billion over 10 years under different scenarios. This higher spending would affect taxpayers and beneficiaries themselves. Already, Medicare Advantage spending increases Part B premiums for all enrollees, including those not on Medicare Advantage, at a cost of $13 billion in 2025. Higher spending on benefits, including under Part B, would increase the amount of government contributions and beneficiary premiums required to cover this part of the program, so Part B premiums would likely further increase under this approach.

How could default enrollment into Medicare Advantage be adopted?

The Trump administration could take different approaches to implement a Medicare Advantage default enrollment system, including testing a model for default enrollment through the Center for Medicare and Medicaid Innovation (CMMI or Innovation Center), using Section 402 demonstration authority, or pursuing legislation through Congress.

CMMI. One approach would be testing a model through CMMI. As part of CMMI’s statutory requirements, the goal of a model must be reducing program spending while preserving or enhancing the quality of care or improving quality of care without increasing spending. Under CMMI rules, the Secretary has the authority to waive Medicare and other program requirements in order to develop and conduct these models, and this authority is not limited to reimbursement or payment related changes (in contrast to the Secretary’s waiver authority for Section 402 demonstrations, as discussed below). The testing, evaluation and expansion of CMMI models are also specifically exempted from the Paperwork Reduction Act, and specific features of models are not subject to administrative or judicial review. Implementing a model through CMMI would not require Congressional approval.

Some important questions that may arise when designing this model include (1) how to design a model that does not increase spending; (2) whether the model would require mandatory or voluntary participation; (3) whether it would be tested in certain regions or nationwide, and (4) whether it would apply broadly or to defined subgroups of the Medicare population, such as beneficiaries with both Medicare and Medicaid coverage (dual-eligible individuals).

Section 402. Another approach would be using Section 402 demonstration authority, which provides broad authority to the HHS Secretary to develop and implement demonstration projects to test new Medicare payment methodologies, and allows the Secretary to waive compliance with certain Medicare requirements only as long as they relate “to reimbursement or payment on the basis of reasonable cost, or (in the case of physicians) on the basis of reasonable charge.” While budget neutrality is not specified in statute or regulation, according to CMS’ Medicare Waiver Demonstration Application, “Medicare-waiver-only demonstrations must be budget neutral. Budget neutrality means that the expected costs under the demonstration cannot be more than the expected costs were the demonstration not to occur.” Although most demonstrations have generally conformed to the administrative practice of budget neutrality, there have been exceptions. Section 402 demonstrations also have typically been subject to certain types of review such as requirements under the Paperwork Reduction Act and administrative or judicial review. Similar to a CMMI model, a Section 402 demonstration does not have to be initiated or approved by Congress.

Legislation. Policymakers could also enact legislation to modify current law to make Medicare Advantage the default enrollment option, rather than traditional Medicare. While there is bipartisan support for Medicare Advantage, some policymakers have raised concerns recently about specific elements of the program, such as the Medicare Advantage payment system, as well as the use of prior authorization, leading to denials and delays in care. Traditional Medicare also continues to serve a larger share of beneficiaries in rural areas than Medicare Advantage. These issues might dampen support for legislative changes to the current Medicare enrollment process.

This work was supported in part by Arnold Ventures. KFF maintains full editorial control over all of its policy analysis, polling, and journalism activities.

Medicare Advantage Insurers Often Use Rewards and Incentives to Encourage Enrollees to Complete Health Risk Assessments (HRAs)

Published: Apr 28, 2025

Beginning in 2014, the Centers for Medicare & Medicaid Services (CMS) has permitted Medicare Advantage insurers to offer Rewards and Incentives Programs to their enrollees to encourage participation in activities that focus on improving health, preventing illness or injury, or promoting the efficient use of health resources. Two common ways these programs work include offering gift cards, as long as they are not redeemable for cash, or “points” or “tokens” that can then be used to acquire tangible items, such as gift cards or fitness accessories.

Completing a health risk assessment (HRA) is one of the activities for which insurers may provide a reward or incentive. HRAs are used to collect information about enrollees’ characteristics and health status. They may be conducted in the home, at a physician’s office, or via telehealth, and HRAs are also required as a component of an Annual Wellness Visit. As part of their role in ensuring coordination of care, Medicare Advantage plans must make a “best-effort” attempt to conduct an initial health risk assessment of all new enrollees within 90 days of enrollment, as well as annually.

While HRAs may be used to develop a personalized care plan and help with care management, they are also a source of diagnoses codes used to calculate a person’s risk score, and the Medicare Payment Advisory Commission (MedPAC) has estimated that Medicare Advantage plans received $15 billion in 2023 as a result of diagnoses captured during HRAs. Further, MedPAC and the Office of the Inspector General (OIG) have both found that some diagnoses are only supported by HRAs, meaning enrollees received no related care. These findings raise concerns that either these diagnoses are inaccurate, or enrollees are not receiving follow-up services for conditions documented in these assessments, while at the same time, boosting payments to plans.

Insurers are required to enter into a contract with CMS to offer Medicare Advantage plans, and each contract may offer multiple Medicare Advantage plans. Many Medicare Advantage requirements and data, such as those pertaining to network adequacy and star ratings measures, are evaluated and reported at the contract rather than the plan level. Using data submitted by Medicare Advantage insurers to CMS, this analysis examines the share of Medicare Advantage enrollees in contracts (which usually include multiple plans) that offered rewards or incentives for completing HRAs in 2023, as well as differences across Medicare Advantage insurers. (See methods for more details.) Because these data are at the contract level, we do not have data about whether individual plans offered rewards or incentives, though a review of the largest reward and incentive programs suggest these programs are broadly available.

In 2023, the majority of Medicare Advantage enrollees were in contracts that offered a reward or incentive for completing an HRA.

More than six in ten (62%) or 18.2 million Medicare Advantage enrollees, were in contracts that offered a reward or incentive specifically for completing an HRA to at least some of its enrollees in 2023 (Figure 1). These contracts may also include a reward or incentive for an Annual Wellness Visit, which is mandated to include an HRA, or other activities, but specifically include a reward for completing an HRA.

One in five enrollees (20%), or nearly 6 million people, were in contracts that offered rewards and incentives for completing an Annual Wellness Visit, but do not specify rewards for HRAs more broadly. About one in ten (9% or 2.5 million) were in contracts that offered rewards and incentives for other activities with no mention of HRAs or Annual Wellness Visits. The remaining 9% of enrollees, or 2.7 million people, were in contracts that did not offer any Rewards and Incentives Programs.

More Than Six in Ten (62%) Medicare Advantage Enrollees Were in Contracts That Offered a Reward or Incentive for Completing a Health Risk Assessment in 2023

Medicare Advantage insurers may offer a reward with a value intended to incentivize enrollee behavior but may not exceed the value of the health-related service. For example, a reward for completing a cancer screening cannot exceed the value of providing the screening itself. However, CMS has not identified explicit values for rewards, and it has not set a limit on how often rewards may be offered throughout the year. For 2023, rewards, typically in the form of gift cards, ranged from $10 to $100 for completing an HRA. Insurers are encouraged to offer enrollees a choice of gift cards to account for enrollees’ preferences and access to certain retailers, which may include, for example, IHOP, Chilis, Home Depot, Lowes, and CVS, among others.

The gift cards that Medicare Advantage enrollees receive for participating in certain health-related activities as described in this analysis are not the same as spending, debit, or “flex” cards that are offered by insurers to deliver extra benefits. These extra benefits include, but are not limited to, cards that help cover copays for dental, vision, and hearing benefits, and money toward over-the-counter products or food and produce.

The share of Medicare Advantage enrollees in contracts that offered a reward or incentive for completing an HRA varied by insurer.

Virtually all Medicare Advantage enrollees in Centene and CVS Health contracts (99%) and UnitedHealthcare contracts (98%) were offered a reward or incentive for completing an HRA. (Figure 2). Nearly two-thirds of enrollees in Blue Cross Blue Shield contracts (BCBS; 64%), and less than half of enrollees in Humana contracts (42%) were offered a reward or incentive for completing an HRA.

The Share of Medicare Advantage Enrollees in Contracts That Offered a Reward or Incentive for Completing an HRA was Higher Among Certain Insurers in 2023

Due to data constraints, we are unable to determine which individual plans offered rewards within a contract and how many enrollees actually received a reward for completing an HRA. However, for those enrollees that do complete an HRA and receive a reward, there is the potential for insurers to receive a high return on investment for providing that reward. For example, in a recent report, OIG found that for each HRA completed in the home, Medicare Advantage insurers generated $1,869 on average in estimated risk-adjusted payments. For those HRAs conducted in a facility – typically as part of Annual Wellness Visit – insurers generated $365 on average in estimated risk-adjusted payments.

Rewards and Incentives Programs are often unique to each insurer and may also vary by contract. For example, UnitedHealthcare uses its HouseCalls program to perform HRAs in the home. It also offers rewards for completing other eligible-health related activities, such as receiving a flu shot or engaging in certain fitness activities such as biking, jogging, and swimming. Humana uses its Go365 program to encourage enrollees to participate in health and fitness activities, such as Annual Wellness Visits, preventive screenings, or being active 12 days a month. Once members have earned at least $10 in rewards, they can redeem them for gift cards in the Go365 Mall at retailers such as Barnes and Noble, Macy’s, PetSmart, and Chipotle, among others.

The current reporting requirements make it difficult to understand the full scope of Rewards and Incentives Programs.

The current reporting requirements make it impossible to determine how many unique enrollees receive rewards, the amount insurers spend on these rewards, and the specific activities enrollees complete to earn a reward. Medicare Advantage insurers are required to submit data on rewards and incentives at the contract level rather than that at the plan level to CMS, and CMS does not specify any quality assurance procedures to identify outliers or potentially erroneous entries, as it does for some other data sets, such as prior authorization determinations. Most data fields are free text, which results in a lack of uniformity in reporting. Frequently, information on multiple rewards is entered on the same line (for example, Annual Wellness Exam, cancer screenings, and HRAs), making it difficult to determine how many individual rewards were distributed, as well as the dollar amount allocated to each reward.

Due to this complexity, it is not possible to calculate the total amount spent by insurers on the Rewards and Incentives Programs generally, nor for specific activities such as HRAs. This information would be useful to better understand how insurers use their budgets to increase the completion of HRAs and what the potential return on that investment is in the form of higher payments from CMS due to increased coding, as well as the potential to improve the quality of enrollees’ care and identify conditions early and prevent them from becoming more costly in the future.

This work was supported in part by Arnold Ventures. KFF maintains full editorial control over all of its policy analysis, polling, and journalism activities.

Methods

This analysis uses Rewards and Incentives Programs Part C data from the Centers for Medicare and Medicaid Services (CMS) Parts C and D Limited Data Set (LDS) for contract year 2023. Medicare Advantage insurers submit the required data at the contract level to CMS, but not at the plan level. It may be possible there are plans within a contract did not offer a particular Rewards and Incentives Program. CMS also does not specify any quality assurance procedures.

This analysis reflects data on rewards and incentives for health risk assessments (HRAs) though we were unable to determine the exact number of enrollees who qualified for a reward for completing an HRA. Special Needs Plans (SNPs) are included in the analysis and are required to complete HRAs for their enrollees. Similar to non-SNPs, SNPs are able to provide a reward for the completion of this required HRA.

The enrollment data are from the CMS Medicare Advantage enrollment file for March 2023 at the contract-plan-county level, which are aggregated to the contract level and merged with the rewards and incentives data. Contract-plan-county combinations are not included if there are fewer than 11 enrollees. 


Potential Implications of Immigration Restrictions on the U.S. Agricultural Workforce

Published: Apr 25, 2025

There are over 2.6 million people working on agricultural farms in the U.S. that play an important role in crop work and the nation’s food system. In addition to self-employed farmers and their unhired family members, these workers include 1 million hired workers, who are primarily noncitizen immigrants. The Trump administration’s restrictive immigration policies, including limits on entry at the border and increased interior enforcement efforts, may reduce the supply of immigrant workers available to fill these roles and increase fears among some immigrants about working. Reductions in the immigrant workforce to support agriculture could ultimately have negative impacts on the cost and availability of food. Moreover, increased fears among agricultural workers could compound health challenges and risks they already face.

Using data from the 2022 National Agricultural Workers Survey (NAWS), this analysis examines key characteristics of agricultural workers, including their citizenship status, health coverage, and access to health care. The analysis includes agricultural workers ages 14 years and older who are currently employed in crop and crop-related work (see Box 1 for more details). It does not include self-employed farm workers or their unpaid family members, agricultural workers with H-2A visas, or hired livestock workers. Key takeaways include the following:

  • Most agricultural workers are Hispanic, noncitizen immigrants. Overall, over seven in ten (73%) agricultural workers are Hispanic, and about two-thirds (66%) are noncitizen immigrants. This includes 18% who report having an immigration status with work authorization, such as lawful permanent status or a “green card,” and nearly half (47%) who say they lack work authorization. Additionally, one in five (19%) agricultural workers report household income below poverty.
  • Among agricultural workers, noncitizen immigrants are more likely than citizens to be Hispanic and to do field work. Nearly all (97%) noncitizen immigrant agricultural workers are Hispanic compared to three in ten (30%) of citizen agricultural workers. Noncitizen immigrant agricultural workers also are more likely to be employed in field work than their citizen counterparts, with about three in four of noncitizen immigrants with and without work authorization (78% and 74%, respectively) in a field work position compared to about half of citizens (52%). Field work involves all aspects of crop production and harvest, while work in nurseries, packing houses, or elsewhere typically takes place indoors. Agricultural workers engaged in field work may be at increased risk of climate-related adverse health effects given their routine exposure to heat stress.
  • More than half (53%) of agricultural workers are uninsured, with this share rising to 77% of noncitizen immigrants without work authorization compared to 41% of noncitizen immigrants with work authorization and 26% of citizens. Additionally, one in four (25%) noncitizen immigrant agricultural workers report not being able to access needed care in the past 12 months compared to 15% of those who are citizens. Going without needed care may have negative health implications, as roughly half of agricultural workers report ever being told by a doctor or nurse that they have a chronic health condition.

Box 1

The NAWS is a nationally representative survey of eligible hired agricultural workers ages 14 years and older who are currently employed in crop and crop-related work. The survey is conducted by the U.S. Department of Labor through face-to-face interviews with workers at randomly sampled workplaces from 12 regions throughout the year. These workplaces include farms, orchards, groves, greenhouses, and nurseries that are primarily engaged in growing crops, plants, vines, or trees and their seeds. Types of work include all phases of crop production (pre-harvest, harvest, and post-harvest), as well as supervising workers, operating machinery, and packing crops in certain cases. Other tasks include nursery work, grading and sorting, agricultural inspection, and farm supervision and management.

The NAWS sample includes both migrant and seasonal crop workers. The survey does not include self-employed farm workers or their unpaid family members, agricultural workers with H-2A visas, or hired livestock workers. People employed at eligible establishments who do not perform crop-related work, such as secretaries or mechanics, are also not included unless such workers also perform crop-related work.

Analysis was completed in R using code available from Analyze Survey Data for Free.

Overview of U.S. Agricultural Workers

As of 2022, there were over 2.6 million people working on farms in the U.S, consisting of a mix of self-employed farm operators, their family members, and over 1 million hired workers. Hired workers include agricultural workers ages 14 years and older who are employed in crop and crop-related work at places like farms, orchards, groves, greenhouses, and nurseries that grow crops and plants, and are typically employed in larger farms rather than smaller or family-operated farms. These agricultural workers are concentrated in certain labor-intensive sectors, such as fruit, tree nuts, vegetable, and specialty horticultural crops that are challenging to be automated by technology. Corn, soybeans, and wheat are the leading crops produced in the U.S., with 80% of all crops going into the U.S. food system and the remainder exported to other countries.

Most agricultural workers are Hispanic, noncitizen immigrants. Overall, more than seven in ten agricultural workers say they are Hispanic (73%), a quarter report they are White (25%), and the remaining 3% report another race or ethnicity. Nearly two in three (66%) agricultural workers say they are noncitizen immigrants, including 18% who report having work authorization, including lawful permanent residents or “green card” holders, and 47% who do not report having work authorization (Figure 1). The remaining roughly third (34%) of agricultural workers are citizens. Most immigrant agricultural workers first arrived in the U.S. ten or more years ago, and they predominantly come from Mexico.

Over Six in Ten Agricultural Workers are Noncitizen Immigrants

Agricultural workers who are noncitizen immigrants are more likely than those who are citizens to be Hispanic (97% vs. 30%) (Figure 2). Among agricultural workers who are noncitizen immigrants, 97% of those with and without work authorization say they are Hispanic, while among their citizen counterparts, over six in ten say they are White (64%), three in ten say they are Hispanic (30%), and the remaining 6% report another race or ethnicity.

Over Nine in Ten Noncitizen Immigrant Agricultural Workers Are Hispanic

Agricultural workers who are noncitizens also are more likely than those who are citizens to do field work (Figure 3). Overall, about two-thirds (67%) of agricultural workers do fieldwork while the remaining third (33%) work in nurseries or packing houses. Among noncitizen immigrant agricultural workers, 78% of those with work authorization and 74% of those without work authorization do field work, while among citizen agricultural workers, roughly half do either field work (52%) or work in nurseries or packing houses (48%). Field work involves all aspects of crop production and harvest, while work in nurseries and packing houses typically takes place indoors. Agricultural workers engaged in field work may be at increased risk of climate-related adverse health effects given their routine exposure to heat stress compared to other types of agricultural work that take place indoors more often.

Three in Four Noncitizen Immigrant Agricultural Workers Report Doing Field Work

Overall, agricultural workers have higher poverty rates than other workers. About one in five (19%) agricultural workers report household income below the federal poverty level (FPL) ($20,030 for a family of three as of 2022), higher than the share of all workers with income below poverty in 2022 (5%)1 .

Health Coverage and Care for Agricultural Workers

About half (53%) of all agricultural workers report being uninsured, with higher uninsured rates among those who are noncitizen immigrants, particularly those without work authorization (Figure 4). Agricultural workers have a nearly five times higher uninsured rate than the rate for all nonelderly adults (10%) nationwide in 2022. Among agricultural workers, noncitizen immigrants without work authorization have the highest uninsured rate with over three in four (77%) lacking coverage, compared to about four in ten (41%) noncitizen immigrants with work authorization and 26% of citizens. These higher uninsured rates reflect a combination of limited access to employer-sponsored coverage among agricultural workers overall and Medicaid eligibility restrictions for noncitizen immigrants, including the exclusion of undocumented immigrants from federally-funded health coverage programs.

Overall, one in five (21%) agricultural workers report not being able to get health care when they needed it in the past 12 months (Figure 4). Among agricultural workers, noncitizen immigrants (25%) are more likely to report not being able to access care than those who are citizens (15%). Barriers to care likely include their higher uninsured rates, cost, and limited provider access in rural areas. Language access and immigration-related fears may pose additional barriers for those who are immigrants seeking health care. Going without needed care may have negative health implications for agricultural workers as about half (51%) report ever being told by a doctor or nurse that they have a chronic illness, including asthma, diabetes, hypertension, or other conditions. Among agricultural workers, citizens (60%) are more likely to report having a chronic condition than noncitizen immigrants without work authorization (42%). This difference may, in part, reflect more limited access to health care among noncitizen immigrants. Additionally, research shows that, overall, noncitizen immigrants, particularly those who are undocumented, generally are younger and healthier than their U.S.-born citizen counterparts.

Noncitizen Immigrant Agricultural Workers Are More Likely to Be Uninsured and to Go Without Needed Care than Citizens
  1. Based on KFF analysis of 2022 Current Population Survey Annual Social and Economic Supplement (CPS-ASEC) ↩︎

A Medicaid Per Capita Cap on the ACA Expansion Population: State by State Estimates

Published: Apr 25, 2025

The concurrent budget resolution that passed the House and Senate includes instructions for the House to reduce federal Medicaid spending by up to $880 billion or more over the next decade. The Senate is expected to seek at least $1.5 trillion in overall spending cuts, including substantial cuts to Medicaid. Medicaid is the primary program providing comprehensive health and long-term care to one in five people living in the U.S. and accounts for nearly $1 out of every $5 spent on health care. Medicaid is administered by states within broad federal rules and jointly funded by states and the federal government, meaning restrictions in federal Medicaid spending could leave states with tough choices about how to offset reductions through cuts to Medicaid, cuts to other programs, or tax increases.

While the detailed proposals under consideration by Congress to achieve federal Medicaid spending reductions have yet to be released, there are several options raised earlier in 2025, including eliminating the enhanced match rate for the Affordable Care Act (ACA) expansion population and implementing a per capita cap on the federal share of Medicaid spending, which were both examined in previous KFF analyses. This analysis examines the potential impacts on states and Medicaid enrollees of implementing a per capita cap on the federal share of Medicaid spending for the ACA Medicaid expansion population only, which is another proposal that has been discussed by members of Congress. Other proposals to reduce federal Medicaid spending may also be under consideration, including work requirements, a reduced federal matching rate, limits on provider taxes to finance the state share of Medicaid spending, and repeal of certain Medicaid regulations issued by the Biden administration. To achieve spending reduction targets, multiple proposals may be considered together. Future KFF analyses will examine these proposals as well.

Key takeaways

The estimated effects of a per capita cap depend highly on what assumptions are made about policy specifications, future growth in Medicaid spending, and states’ responses to federal cuts. This analysis is designed to illustrate the magnitude of the impact of a per capita cap on the ACA expansion population if all states responded by maintaining their ACA expansion coverage and spending and picking up the new expansion costs. However, in practice, states may respond to the policy change differently, and many may ultimately drop their Medicaid expansion coverage over time as the magnitude of the federal spending cuts grows.

  • If states maintain their ACA expansion coverage and spending at current levels, a per capita cap on the expansion population tied to medical inflation would erode the effective enhanced federal match rate for the ACA expansion population over time. Assuming Medicaid spending grows as projected by the Congressional Budget Office, by FY 2034, the federal share of spending or the effective federal match rate for expansion enrollees would be 69%, a decrease of 21 percentage points from 90%, the current federal match rate for expansion enrollees.
  • The effective enhanced federal match rate for the ACA expansion population would eventually fall below states’ traditional match rates, assuming there is no limit or floor on the federal contribution to the expansion population. The effective federal match rate in FY 2034 of 69% is lower than the traditional match rate in five states, though eventually the effective federal match rate for the expansion population would be lower than the traditional match rate (which is 50% or more) in all states as the federal contribution decreases over time.
  • A per capita cap on the Medicaid expansion population could shift $246 billion in costs to states over the next ten years, with state spending increasing anywhere from 4% to 20% across expansion states.

As the effective FMAP for expansion enrollees declines, the pressure on states to eliminate ACA coverage would increase. Twelve states currently have “trigger” laws in place that would automatically end expansion or require changes if the federal match rate were to drop, but it is unclear how those trigger laws would treat a per capita cap that effectively lowers the federal match rate over time. If all states ultimately drop their Medicaid expansion coverage, up to 20 million Medicaid expansion enrollees could lose Medicaid coverage and the number of uninsured would increase.

What is the proposed policy change?

Like all other Medicaid spending, Medicaid spending on the ACA Medicaid expansion population is currently shared by states and the federal government without a cap; unlike most other spending, the federal government pays 90% of the costs of expansion enrollees. States that have implemented the ACA Medicaid expansion currently receive a 90% federal match rate or “FMAP” for adults covered through the expansion. The FMAP for services used by people eligible through traditional Medicaid is determined by a formula set in law designed to provide a higher federal match rate for states with lower per capita incomes and ranges from 50% to 77%. The ACA expanded Medicaid coverage to nearly all adults with incomes up to 138% of the Federal Poverty Level ($21,597 for an individual in 2025). However, a Supreme Court ruling effectively made the decision to implement the Medicaid expansion an option for states. Forty-one states (including DC) have since adopted Medicaid expansion, and Medicaid expansion enrollees represent nearly a quarter of Medicaid enrollment and one-fifth of total Medicaid spending.

This analysis estimates the impact of implementing a per capita cap on the federal share of Medicaid spending for the ACA expansion population. While specifics on the implementation of this policy would be included in a legislative proposal, details have yet to be released, and assumptions made here may differ from details included in any proposed legislation. To estimate a per capita (i.e., per enrollee) cap on the expansion group, this analysis first establishes FY 2025 per enrollee spending as the base year estimate; then, starting in FY 2027, the analysis limits federal spending growth for expansion adults to the consumer price index (CPI-U) plus 0.4 percentage points, which is KFF’s estimate of the difference between CPI-U and medical inflation (CPI-M) over the past 20 years (see Methods). Federal spending for all other eligibility groups remains as projected under current policy. There are a number of other Medicaid policy changes that have been suggested, and policy estimates would likely differ depending on the combination of policies and their interactive effects. The effects of a per capita cap on Medicaid spending and enrollment are also highly sensitive to policy design, inflation rates, and how states respond to the cuts; and estimates are highly sensitive to assumptions about those factors. We assume that Medicaid expansion spending per enrollee will grow at 5.9% per year on average over the 2027-2034 period, based on CBO projections. A cap based on CPI-U plus 0.4 percentage points is projected to grow by 2.6% per year on average over this period.

What is the potential impact on Medicaid spending?

This analysis does not make assumptions about specific state behavioral responses to a per capita cap on the ACA expansion population and instead examines the potential impact on Medicaid spending if all states maintained their ACA expansion coverage and spending at current levels in response to this policy change. This analysis assumes states would maintain expansion group per enrollee spending and eligibility at current levels, picking up new costs due to the federal cap on per enrollee spending. Enrollment and total spending would remain constant while costs would shift from the federal government to the states, and states would have to make offsetting cuts in other parts of Medicaid or in programs other than Medicaid or raise revenues. The analysis is designed to illustrate the magnitude of the impact of the policy change if states maintain their Medicaid expansion coverage and spending levels; however, in practice, state responses may vary. While some states may choose to continue ACA Medicaid expansion coverage with substantially reduced federal funding, many states may seek to restrain the growth in Medicaid expansion spending by reducing provider payment rates or eliminating the expansion altogether as the magnitude of the federal spending cuts compounds over time.

If states maintain ACA expansion coverage and spending at current levels, a per capita cap on the expansion population would erode the effective enhanced federal match rate for the expansion population over time (Figure 1). Per capita caps are typically designed to constrain federal Medicaid spending growth to a rate slower than is expected under current law, which is how they achieve federal savings. As time passes, the effects compound. If states maintain their ACA expansion coverage and spending, the federal share of Medicaid expansion spending would decrease while the state share of spending would increase to offset the loss of federal funds. By FY 2034, the final year in the analysis, the federal share of spending or the effective federal match rate for expansion enrollees would be 69%, a decrease of 21 percentage points from 90%, the current federal match rate for expansion enrollees.

A Per Capita Cap on the Expansion Population Would Erode the Effective Enhanced Federal Match Rate for the Expansion Population Over Time

Under these assumptions, the effective enhanced federal match rate for the expansion population would eventually fall below states’ traditional match rates. This analysis does not assume there is any kind of limit or floor on the federal contribution to the expansion population, meaning the federal share of spending on the expansion population would continue to decline over time. This would eventually result in the effective enhanced federal match rate for the expansion population falling below states’ traditional federal match rates. The effective federal match rate in FY 2034 of 69% is lower than the FY 2026 traditional match rate in five states: West Virginia (74%), New Mexico (72%), Kentucky (71%), District of Columbia (70%, which is set in statute), and Arkansas (69%). Another nine states have traditional match rates that are within 5 percentage points of 69%, including Louisiana (68%), Idaho (67%), Oklahoma (67%), Michigan (65%), Ohio (65%), Indiana (65%), North Carolina (65%), Missouri (64%), and Arizona (64%). The federal share of spending on the expansion population would continue to decline beyond FY 2034, resulting in more states where the effective federal match rate for the expansion population is lower than the traditional match rate over time.

The Effective Enhanced Federal Match Rate for the Expansion Population Would Eventually Fall Below States’ Traditional Match Rates

If states maintain their Medicaid expansion spending and coverage, a per capita cap on the Medicaid expansion population could shift $246 billion in costs to states over the next ten years. Federal Medicaid spending could decrease by 4% or $246 billion over the 10-year period, and states would pay those costs, increasing the state share by 7% across all states. All expansion states would be impacted, but the increase in state spending would vary across states, ranging from 4% in Massachusetts and South Dakota to 20% in Louisiana. States with larger shares of expansion enrollment and spending would experience the largest shifts in spending from the federal government to the state.

A Per Capita Cap on the Medicaid Expansion Population Could Increase State Spending By $246 Billion Overall or 4% to 20% Across Expansion States

What are other implications to consider?

As the effective FMAP for expansion enrollees declines, the pressure on states to eliminate ACA coverage would increase. As the effective ACA FMAP declines, states would face increasing difficulties raising the necessary state tax revenues or decreasing spending on non-Medicaid services such as education needed to offset federal cuts, resulting in increasing pressure to eliminate ACA expansion coverage.

Pressure to eliminate ACA expansion coverage might be greatest in the twelve states that currently have “trigger” laws in place that would automatically end expansion or require changes if the federal match rate were to drop. While not a direct change to the expansion FMAP, this change would reduce the federal contribution for expansion enrollees and could put people in states with trigger laws at greater risk of losing coverage. Amid the threat of changes to federal support for Medicaid expansion, some states are actively debating their Medicaid expansion trigger laws. Three states (South Dakota, Missouri, and Oklahoma) have passed constitutional amendments that require the state to cover the Medicaid expansion population, which means they could not easily drop their ACA expansion coverage and would have to find a way to offset the additional costs.

If all states ultimately drop their Medicaid expansion coverage, up to 20 million Medicaid expansion enrollees could lose Medicaid coverage and the number of uninsured would increase. Prior KFF analysis shows that if all states drop their Medicaid expansion coverage, federal Medicaid spending would decrease a quarter ($1.7 trillion) over a 10-year period and up to nearly a quarter of all Medicaid enrollees (20 million people) could lose Medicaid coverage. It’s unknown whether states would increase eligibility for other groups, such as parents and people with disabilities to offset some of the coverage losses associated with eliminating the expansion. While some people losing Medicaid would be eligible for ACA marketplace coverage (those with incomes 100-138% of the poverty level) and others may be able to obtain employer-sponsored health insurance, many expansion enrollees would become uninsured, with some enrollees with incomes below poverty falling into the coverage gap. A large body of prior research shows that Medicaid expansion has helped to reduce the uninsured rate and improve health care access, affordability, and financial security among the low-income population. More recent research shows improvements in health outcomes and continues to show positive effects for providers (particularly rural hospitals) and for sexual and reproductive health.

The effects of this policy change could be larger if paired with other Medicaid cuts, and there would be interactive effects across policies that affect the ACA expansion population, such as Medicaid work requirements. A number of House Republicans have expressed support for work requirements as a condition of eligibility for Medicaid. Work requirement proposals would likely apply to ACA Medicaid expansion enrollees as well as other adults. Prior estimates show that work requirements result in lower federal spending, an increase in the number of uninsured, and no increase in employment. Because work requirements and a per capita cap on expansion enrollees would target the same population, it is likely that these two policies would have substantial interactive effects resulting in spending and coverage implications for ACA expansion enrollees. In addition, if Congress does not extend enhanced ACA premium tax credits due to expire at the end of this year, ACA marketplace coverage would be less affordable for people who lose Medicaid expansion coverage but are eligible for ACA tax credits.

Appendix

Changes in State Medicaid Spending Due to a Per Capita Cap on the ACA Expansion Population, by State

Methods

Data: To project Medicaid enrollment, spending, and spending per enrollee by state and eligibility group, this analysis uses the Medicaid CMS-64 new adult group expenditure data collected through MBES for FY 2023 (downloaded in December 2024), Medicaid new adult group enrollment data collected through MBES for June 2024 (downloaded in December 2024), the 2019-2021 T-MSIS Research Identifiable Demographic-Eligibility and Claims Files, and the June 2024 Congressional Budget Office (CBO) baseline.

Overview of Approach:

  • Develop baseline projections of Medicaid enrollment, spending, and spending per enrollee by state and eligibility group from FY 2025 through FY 2034 (a 10-year period). This model estimates Medicaid enrollment and spending under the status quo with no policy changes.
  • Estimate Medicaid enrollment, spending, and spending per enrollee by state and eligibility group over the same 10-year period after accounting for the effects of proposed policy changes.
  • Calculate differences in Medicaid enrollment and spending in the policy change scenario relative to the baseline projections.
  • The estimates do not predict states’ responses to federal policy changes. We examine differences in Medicaid enrollment and spending under one state response scenario to build off prior KFF analyses and illustrate the potential effects of this policy change.

Definitions and Limitations:

  • At the time of publishing, CBO had released their January 2025 baseline. However, this analysis uses CBO’s June 2024 baseline because it was the most recent baseline with spending projections by Medicaid eligibility group.
  • The estimates assume that all states experience the same growth rates for Medicaid enrollment and spending; and that total spending grows at the same rate as federal spending.
  • FMAP calculations do not account for the other services that are matched at a higher rate, which include family planning, services received through an Indian Health Services facility, expenditures for Medicare beneficiaries enrolled in the “Qualifying Individuals” program, and health home services that are matched at a 90% rate. For this reason, the model may underestimate the federal share of spending in some states.
  • Estimates of total spending include all spending that is matched as medical assistance but exclude states’ administrative costs which are matched at a separate rate. Federal payments for administrative costs are less than 4% of total federal spending, according to the CBO June 2024 baseline.
  • The analysis does not account for secondary effects or people’s behavioral responses.
  • The analysis does not include policy effects for states that had not expanded Medicaid under the ACA as of February 2025 but would have done so in the absence of the policy change.
  • We implement the per capita cap in FY 2027; we assume it takes effect immediately.
  • To implement a per capita cap, this analysis uses CPI-U + 0.4% instead of CPI-M because projections of CPI-M are not available. Studies and data show that in any given year, either measure may be higher so it’s unclear whether savings would be larger or smaller using a different measure. We chose to add 0.4% to CPI-U because over the past 20 years, CPI-M was 0.4% higher than CPI-U.

We provide more details about the baseline model below.

1. Estimate initial Medicaid spending and enrollment by eligibility group using the most recent years’ data available (FY 2023 for spending data and FY 2024 for enrollment data).

  • First, we pull the quarterly Medicaid CMS-64 new adult group expenditure data collected through MBES for FY 2023 and aggregate total spending by state for enrollees in the ACA expansion group and for all other Medicaid enrollees. Spending reflects an accrual basis of accounting.
  • We exclude spending on DSH by calculating the share of spending on DSH from the FY 2023 CMS-64 Financial Management Report and reducing medical assistance among non-expansion enrollees by that share.
  • Separately, we pull the Medicaid new adult group enrollment data collected through MBES for June 2024. This data includes enrollment by state and is broken into ACA expansion group enrollees and all other Medicaid enrollees. MBES enrollment includes individuals enrolled in limited benefit plans and only includes individuals whose coverage is funded through Medicaid (not CHIP).
  • To obtain spending and enrollment estimates across the remaining eligibility groups (seniors, individuals with disabilities, children, and other adults), we apply the distribution of spending and enrollment across the groups and by state from T-MSIS to the FY 2023 spending data and June 2024 enrollment data. We use the average distribution from 2019 to 2021 to mitigate the impact of the continuous enrollment provision (data in states denoted as “unusable” for a given year by the DQ atlas were excluded from the averages).

2. Calculate initial spending per enrollee in FY 2024.

  • We grow Medicaid spending in FY 2023 by CBO’s growth rates for federal benefit payments by eligibility group to get Medicaid spending in FY 2024. The June 2024 enrollment data is used as our FY 2024 enrollment.
  • We divide Medicaid spending in FY 2024 by Medicaid enrollment in FY 2024 (for each state and eligibility group) to get Medicaid spending per enrollee in FY 2024.

3. Project total spending and spending per enrollee for fiscal years 2025 through 2034 using CBO growth rates and use those estimates to calculate future years’ enrollment.

  • Starting with spending data for FY 2024, we apply the CBO growth rates to estimate Medicaid spending in FY 2025 through FY 2034.
  • Starting with per enrollee spending in FY 2024, we apply the CBO growth rates for average federal spending on benefit payments per enrollee to estimate Medicaid spending in FY 2025 through FY 2034.
  • We calculate enrollment growth in FY 2025 through FY 2034 by dividing estimated Medicaid spending by estimated spending per enrollee.

4.     Split total Medicaid spending over the 10-year period into federal and state spending.

  • We calculate federal and state spending by using a 90% match rate for the ACA expansion group and the traditional state FMAPs for the remaining eligibility groups. We use the FY 2025 FMAPs for FY 2025 and FY 2026 FMAPs for FY 2026 and beyond.

We provide more details about the policy change scenario below.

1. Calculate Medicaid spending under a per capita cap if states maintain ACA expansion coverage and spending. This follows the methodology in KFF’s previous per capita cap analysis, though only applies the cap to the ACA expansion population.

  • Assume enrollment and total spending remain the same as the baseline model over the 10-year period.
  • Establish the base year of per capita spending as FY 2025. We chose FY 2025 because most per capita cap proposals use spending from the period prior to enactment of the law to prevent states from inflating their base estimates of per capita spending in response to the law. We assume the per capita cap takes effect in FY 2027, so FY 2025 and FY 2026 per enrollee spending are the same as baseline and FY 2027 per enrollee spending is the same as the base year for the ACA expansion group.
  • After FY 2027, growth in per enrollee spending for the ACA expansion group is capped at estimated medical inflation levels. To estimate medical inflation, we use CPI-U (Consumer Price Index for All Urban Consumers) + 0.4%, which is the difference in CPI-U and CPI-M (CPI Medical Care) over the past two decades.
  • Calculate new federal spending levels for the ACA expansion group based on the capped per enrollee amounts by first multiplying enrollment and new per enrollee levels and then calculating the federal share using the FMAP. Federal spending for all other eligibility groups remains as projected under current policy.
  • State spending on the ACA expansion group is calculated as the difference between baseline total spending (held constant) and new reduced federal spending levels. State spending for all other eligibility groups remains as projected under current policy.

2. Calculate differences in Medicaid enrollment and spending (including federal and state spending) relative to the baseline projections. 

5 Key Facts About Medicaid Expansion

Published: Apr 25, 2025

Congress has passed a budget resolution that targets up to $880 billion or more in federal spending cuts from Medicaid over ten years. While specific proposals are not yet known, policies under discussion could limit financing and coverage for the Affordable Care Act (ACA) expansion group. Recent KFF polling shows there is little support for cuts to federal Medicaid spending overall, and a majority of adults (59%) oppose eliminating the enhanced federal match rate for adults covered under Medicaid expansion specifically.

The ACA expanded Medicaid coverage to nearly all adults with incomes up to 138% of the Federal Poverty Level ($21,597 for an individual in 2025) and provided states with an enhanced federal matching rate (FMAP) of 90% for their expansion populations over time, which is greater than the matching rate for Medicaid generally. While federal funding finances 90% of spending on the expansion population, states are responsible for the remaining 10% of costs for enrollees eligible under Medicaid expansion. As a result of a Supreme Court ruling in 2012, the expansion is effectively optional for states, and as of April 2025, all but 10 states have adopted the expansion. While expansion has led to higher government spending on Medicaid, a large body of literature shows that it is linked to reduced rates of uninsurance, increased health care affordability, improvements in access and health and outcomes, and economic benefits for states and providers. KFF polling shows that of people living in non-expansion states, two-thirds (66%) said their state should expand Medicaid to cover more low-income uninsured people.

This issue brief examines Medicaid expansion enrollment and Medicaid spending in expansion and non-expansion states and describes the characteristics of adults covered by the Medicaid expansion.

1. Medicaid expansion is widely adopted by both red and blue states.

Over the past 11 years, Medicaid expansion has been broadly adopted. The 41 states including the District of Columbia that have adopted Medicaid expansion are split nearly evenly between states that voted for Trump (21 states) and those that voted for Harris (20 states) in the 2024 Presidential election (Figure 1). Over half (27) of states adopted Medicaid expansion in 2014, while 14 states have implemented expansion since 2014, with South Dakota and North Carolina adopting most recently in 2023. Most states adopted expansion through legislation; however, in seven states, the expansion was adopted via a ballot measure. As of June 2024, over 20 million people were enrolled through Medicaid expansion, representing nearly a quarter of total Medicaid enrollment across all states and 31% of total enrollment in expansion states.

Medicaid expansion is linked to gains in coverage, access, increased health care affordability, and economic benefits for states and providers. Although establishing direct causality between health insurance and health outcomes is complex, evidence generally shows Medicaid expansion is associated with improved health outcomes, including increased early-stage cancer diagnosis, improved disease management, and lower mortality rates for many chronic conditions.

Medicaid Expansion is Widely Adopted by Both Red and Blue States

2. Medicaid median income eligibility for children, pregnancy, and parents, and Medicaid spending per enrollee are higher in expansion states compared to non-expansion states.

Overall, per enrollee spending for the expansion group was higher than for other adults and children but well below per enrollee spending for enrollees over age 65 and people with disabilities. While some critics of Medicaid expansion have argued that expansion diverts resources away from other groups of Medicaid enrollees, including people with disabilities and children, data show that expansion states spend more per enrollee overall and on each eligibility group than non-expansion states. Per enrollee spending for people with disabilities in expansion states is nearly 2.5 times the spending in non-expansion states ($25,170 per enrollee vs. $10,494) (Figure 2). The difference in per-enrollee spending for expansion and non-expansion states holds true for more detailed eligibility pathways for people based on age or disability. Expansion states also spent nearly $2,000 more per child enrollee than non-expansion states ($6,001 vs $4,295). The differences in per enrollee spending may reflect state policy choices about benefits and eligibility, in addition to payment rates, regional variation in health care costs, and state demographics.

In addition to difference in spending, expansion states have higher median income-based eligibility limits compared to non-expansion states for children (266% FPL in expansion states compared to 234% in non-expansion states), pregnant individuals (213% FPL compared to 203% FPL), and parents (138% FPL compared to 33% FPL). There is substantial variation in adoption of optional eligibility and other policies for seniors and people with disabilities, with state expansion status not a strong predictor of these policy choices.

Per-Enrollee Spending in States That Expanded Medicaid Is Higher for All Eligibility Groups Than in Non-Expansion States

3. Nearly four in ten women of reproductive age and over six in ten 50-64 year olds enrolled in Medicaid are covered through Medicaid expansion.

Medicaid expansion provides coverage across age groups for those 19 to 64 (Figure 3). Many expansion adults are working; however, they work for employers and in industries that are less likely to offer health insurance, leaving them without affordable health coverage options. As discussed below, older enrollees are more likely to have chronic conditions and may face more barriers to work.

Medicaid expansion also provides an important eligibility pathway for women of reproductive age, covering 38% of women ages 19-49 enrolled in Medicaid. For those who become pregnant, Medicaid coverage prior to pregnancy can promote pre-pregnancy health care, which can lead to healthier pregnancies and help reduce the risk of complications. Previous KFF analyses show that in expansion states, pregnant individuals are more than twice as likely to be enrolled in Medicaid prior to pregnancy (59%) than in non-expansion states (26%) (the difference in income eligibility levels for pregnant adults vs. other adults is large in non-expansion states, explaining the difference in pre-pregnancy enrollment rates). Medicaid expansion can provide stable coverage to pregnant individuals after the postpartum coverage period ends. Medicaid expansion coverage of parents also increases enrollment of their children: evidence shows that if children are eligible for Medicaid or CHIP coverage but unenrolled, when their parents gain coverage through Medicaid expansion it has a spillover, or “welcome mat” effect, increasing the number of children who enroll in health coverage. Medicaid expansion also covers adults as they age – more than six in ten Medicaid enrollees ages 50-64 are covered through expansion – and before they become eligible for Medicare.

Three in Ten Women of Reproductive Age and Nearly Two-Thirds of 50-64 Year Olds Enrolled in Medicaid are Covered Through Medicaid Expansion

4. One third of Medicaid expansion enrollees have a chronic physical health condition and a quarter have a chronic behavioral health condition.

Nearly half (44%) of expansion adults have at least one chronic condition, including 33% that have a chronic physical condition and 24% that have a behavioral health condition. Of Medicaid enrollees with at least one chronic condition, 53% are enrolled through Medicaid expansion (data not shown). Similar to all adults on Medicaid, the share of expansion adults with at least one chronic physical condition increases with age (Figure 4). Nearly six in ten (57%) expansion adults ages 50-64 have at least one physical health condition compared to just 16% of expansion adults ages 19-26. While the share of expansion adults with physical health conditions increases with age, the share with behavioral health conditions remains relatively stable, ranging from 19% to 26% across age groups.

One Third of Medicaid Expansion Enrollees Have a Diagnosed Chronic Physical Health Condition and One in Four Have a Diagnosed Chronic Behavioral Health Condition

Research finds that expansion is associated with improved access to care and outcomes related to behavioral health conditions. For other chronic conditions, expansion has positive impacts on access to care and may improve certain health outcomes. Medicaid coverage helps expansion enrollees manage chronic conditions and supports workforce participation. Medicaid expansion also provides coverage to individuals who have chronic conditions or disabilities that may limit their ability to work. Although some people with disabilities qualify for Medicaid because they receive Supplemental Security Income, most are eligible for Medicaid through other pathways, including the expansion group. While many adults who need long-term care may qualify for coverage through other Medicaid pathways, Medicaid expansion covers some individuals with costly health needs who may otherwise be unable to afford care; two percent (2%) of expansion enrollees, or 395,000 individuals, use long-term care services (LTC) which support activities of daily living such as eating, bathing, or dressing (data not shown). Medicaid expansion is also the primary pathway for Medicaid coverage for people with HIV.

5. Policy changes targeting Medicaid expansion would reduce government spending but also could put coverage for 20 million enrollees at risk.

There are several options under consideration in Congress to reduce federal Medicaid spending that could have implications for enrollees in the expansion group, including work requirements and changes in financing for the expansion. Congress may debate federal legislation requiring states to impose work requirements as a condition of Medicaid coverage. Most adult Medicaid enrollees are already working without a work requirement; estimates of national work requirements show $109 billion in federal savings over 10 years, and an increase in the number of uninsured, but no increase in employment. Beyond legislative changes, a number of states are pursuing waivers to condition Medicaid expansion coverage on meeting work requirements since work requirement waivers were encouraged and approved during the first Trump administration.

Congress may also consider proposals that would alter the financing for the Medicaid expansion. Any approach to reduce federal Medicaid spending for the expansion would shift costs to states, forcing governors to make tough choices about whether to drop the ACA Medicaid expansion, provide alternative coverage options or make up the loss of federal funding by cutting other state programs or raising taxes. Twelve states have “trigger” laws in place that would automatically end expansion or require other changes if the share of federal funding drops below 90%, and two additional states, Ohio and South Dakota, are considering similar action. But all states, including those without trigger laws in place, would examine their ability to maintain the ACA Medicaid expansion if Medicaid expansion financing was altered. An analysis of the impact on Medicaid enrollment if all states eliminated the expansion shows the decline in enrollment would vary across states, ranging from 19% in Massachusetts, Minnesota, North Carolina, and South Dakota to 49% in Oregon (Figure 5).

Eliminating the ACA Expansion Match Rate Could Reduce Total Medicaid Enrollment By 19% to 49% Across Expansion States

If states eliminate the Medicaid expansion, individuals with incomes 100-138% FPL would be eligible for subsidies in the Marketplace, but could face barriers transitioning to Marketplace coverage and could face higher out of pocket costs, especially if the enhanced subsidies expire at the end of 2025. However, current Medicaid expansion enrollees with incomes below 100% FPL are not eligible for subsidies in the Marketplace and could fall into the “coverage gap” and become uninsured if they are unable to qualify for Medicaid under a different eligibility pathway, for example based on a disability. Currently, 1.4 million adults are in the coverage gap in the ten non-expansion states; however, that number would likely increase significantly under proposed policy changes targeting the Medicaid expansion. Eliminating the Medicaid expansion could have additional spillover effects, including children whose eligibility status is unchanged but become uninsured after their parents lose Medicaid coverage. People without insurance have more difficulty accessing care and are more likely to have medical debt, with almost one in four uninsured adults in 2023 not receiving needed medical treatment due to cost. Uninsured individuals are also less likely than those with insurance to receive preventive care and treatment for major health conditions and chronic diseases.

Methods

Medicaid Claims Data: This analysis uses the 2021 T-MSIS Research Identifiable Demographic-Eligibility and Claims Files (T-MSIS data) to identify Medicaid expansion enrollees, spending, and chronic conditions in Figures 2-4.

State Inclusion Criteria: 

  • Expansion states: Though Idaho and Virginia expanded Medicaid prior to 2021, adult expansion enrollees primarily show up in the traditional adult eligibility group. Therefore, those expansion states are excluded from Figures 2-4. West Virginia is excluded from Figure 2 (but included in Figures 3-4) of this analysis due to unusable spending data, according to quality assessments from the DQ Atlas.
  • Non-expansion states: Mississippi was also excluded from Figure 2-3 this analysis due to data quality concerns flagged by the DQ Atlas.

Enrollee Inclusion Criteria: Enrollees were included if they were ages 19-64, had full Medicaid coverage for at least one month, and were not dually enrolled in Medicare. Dually enrolled individuals were excluded from these calculations since they may not have had sufficient claims in T-MSIS to identify chronic conditions.

Calculating Spending (Figure 2): This figure reflects spending from all states except Idaho, Virginia, West Virginia, and Mississippi. Average annual per capita spending calculations include fee-for-service spending and payments to managed care plans. Spending was calculated by summing the total spending of all claims per enrollee in the T-MSIS claims files. Estimates here do not include prescription drug rebates and most supplemental payments to providers.

Defining Chronic Conditions (Figure 4): This figure reflects chronic conditions from all expansion enrollees in expansion states that expanded prior to 2021 except for Idaho and Virginia. This analysis used the CCW algorithm for identifying chronic conditions (updated in 2020). This analysis also included in its definition of chronic conditions substance use disorder, mental health, obesity, HIV, hepatitis C, and intellectual and developmental disabilities. In total, 35 chronic conditions were included and were further grouped into 3 broad categories: behavioral health, physical health, and cognitive impairment conditions. Specific conditions within these groupings include:

  • Behavioral health conditions: Any mental health condition and any substance use disorder. See KFF’s brief, “5 Key Facts About Medicaid Coverage for Adults with Mental Illness,” KFF brief “SUD Treatment in Medicaid: Variation by Service Type, Demographics, States and Spending,” and the Urban Institute, Behavioral Health Services Algorithm for additional details (Victoria Lynch, Lisa Clemans-Cope, Doug Wissoker, and Paul Johnson. Behavioral Health Services Algorithm. Version 4. Washington, DC: Urban Institute, 2024).
  • Physical health conditions: Hypertension, transient ischemic attack, acute myocardial infarction, hyperlipidemia, ischemic heart disease, atrial fibrillation, heart failure, obesity, chronic obstructive pulmonary disease, pneumonia, asthma, diabetes, arthritis, hip fracture, osteoporosis, cataracts, glaucoma, chronic kidney disease, colorectal cancer, endometrial cancer, urologic cancer, prostate cancer, lung cancer, breast cancer, hepatitis, HIV, anemia, hypothyroidism
  • Cognitive impairment conditions: Alzheimer’s, intellectual and developmental delay, Parkinson’s, and dementia

Appendix

Medicaid Expansion Enrollment
Medicaid Expansion Spending

Coverage of Breast Cancer Screening and Prevention Services

Published: Apr 24, 2025

Among women in the United States, breast cancer is the most diagnosed cancer and the second leading cause of cancer death. In 2021, an estimated 4 million women in the U.S. were living with breast cancer. The Affordable Care Act (ACA) and many state laws have provisions that assure that most women with private insurance, Medicaid, and Medicare have coverage for breast cancer screening services. This typically includes mammography but can also include genetic testing and preventive medications for high-risk women over the age of 35. This factsheet discusses breast cancer screening and prevention services and reviews the scope of private and public insurance coverage, as well as access to those services, for women in the U.S.

Breast Cancer in the United States

Breast cancer makes up about 16% of all new cancer diagnoses in the U.S., and approximately 1 in 8 women will be diagnosed with breast cancer during their lifetime. In 2025, there will be an estimated 316,950 new cases of female breast cancer and 42,170 deaths attributable to breast cancer in the U.S. Breast cancer is most often diagnosed among middle-aged and older women, with 71% of new cases diagnosed among women 55 and older (Figure 1).

Seven in Ten Cases of Breast Cancer in the United States are Diagnosed Among Women Age 55 and Older

Most breast cancers are diagnosed at an early stage. Sixty-six percent of breast cancers diagnosed are localized, meaning they are found only in the organ in which they started; 25% are regional, meaning the cancer has spread to surrounding organs; and 6% have metastasized, meaning the cancer has spread to other regions of the body. Risk factors for breast cancer include, but are not limited to, a personal or family history of breast cancer, genetic predispositions, breast density, obesity, drinking alcohol, early menstruation, and delayed menopause.

In the U.S., while white women have the highest incidence of breast cancer, black women have higher breast cancer mortality rates (Figure 2). These disparities are likely attributable to a combination of factors, such as differences in stage at diagnoses, as well as disparities in access to screening, follow-up care, and treatment.

Breast Cancer Incidence and Mortality Rates in the U.S., by Race/Ethnicity, 2017-2021

Although very rare (less than 1%), men can develop breast cancer. In 2025, there will be approximately 2,800 cases of male breast cancer diagnosed and 510 deaths.

Breast Cancer Preventive Services

While several health organizations issue guidelines for breast cancer screening and prevention, private insurance coverage of clinical preventive services under the ACA is governed by recommendations from the United States Preventive Services Task Force (USPSTF) and the Health Resources and Services Administration (HRSA). The Women’s Preventive Services Initiative (WPSI) is the group that works with HRSA by providing clinical recommendations for preventive services specific to women and makes coverage recommendations to HRSA for breast cancer screening. Under these guidelines, private group and individual insurance plans and state Medicaid expansion programs must cover the following breast cancer screening and prevention services at no cost to the consumer: 1) screening mammography at least every 2 years and as frequently as once a year for women ages 40 to 74 with average-risk for breast cancer; 2) genetic counseling and testing for mutation of the BRCA1 and BRCA2 genes in some women with a personal or family history of breast, ovarian, fallopian tube, or peritoneal cancer; 3) preventive medication for some women with elevated risk of breast cancer and at low risk for adverse medication effects (Table 1). Some medical professionals recommend other services for women at higher risk for breast cancer, but these services are not currently subject to the ACA’s preventive services coverage requirement. The ACA’s preventive services requirement is currently the subject of ongoing litigation in the case Kennedy v. Braidwood Management. Depending on the eventual outcome of that case, there could be changes to preventive services requirements in the future.

Breast Cancer Preventive Services Covered Without Cost-Sharing, as of April 2025

Mammography Utilization

Screening mammography is a low-dose x-ray that provides images of the internal structures of the breast and is the most common screening test for breast cancer.

Current HRSA guidelines—which define no-cost coverage standards for private insurance—and WPSI recommend biennial screening mammography to start no earlier than age 40 and no later than age 50 for average-risk women and continue through at least age 74, while the USPSTF breast cancer screening guidelines recommend biennial screening mammography for women aged 50 to 74, and states that starting mammography screening before age 50 should be an individual decision based on preference and patient values. The USPSTF also concludes that there is insufficient evidence to assess the benefits and harms of screening mammography for women 75 years and older.

In 2022, 77% of women ages 50-74 reported having had a mammogram in the past two years (Figure 3). Screening rates are higher among women with insurance (74%) compared to those without insurance (37%).

Mammography Rates Among Women in the U.S., 2022, by Select Characteristics from the Behavioral Risk Factor Surveillance System

Mammography use varies by state (Figure 4). Among women ages 50-74, Rhode Island reported the highest rate of mammography use (85.5%) whereas Wyoming reported the lowest rate (64%).

Mammography Rates in the U.S. by State, 2022, from the Behavioral Risk Factor Surveillance System

Breast Density

Breast density refers to the amount of fibrous and glandular tissue (or, fibroglandular tissue) in the breast compared to the amount of fatty tissue. Dense breasts have more fibroglandular tissue, while less dense breasts have more fatty tissue.  Although breast density is a risk factor for developing breast cancer, breast density changes naturally throughout one’s lifetime, and dense breasts are very common—nearly half of women over 40 years old who have had a mammogram have dense breasts. As of September 2024, the U.S. Food and Drug Administration (FDA) requires mammography facilities to report the presence of breast density detected by imaging to both patients and providers.

Mammograms are the most used imaging method for breast cancer screening, but dense breasts can be difficult to interpret with this technique. Fibroglandular tissue and masses in the breast appear similarly in mammogram images, meaning cancerous masses may go undetected in someone with dense breasts. Consequently, additional imaging such as ultrasound, MRI, or digital breast tomosynthesis (DBT) may be required to complete a breast cancer screening. However, follow up imaging for women with dense breasts is not currently required to be covered by insurance as preventive services.

Genetic Testing and Screening for BRCA 1/ BRCA 2 Mutations

Mutations to the tumor suppressor genes BRCA1 and BRCA2, increase the risk of female breast and ovarian cancers, as well as fallopian tube, peritoneum, pancreatic, and skin cancers. While almost 13% of women in the general population will develop breast cancer at some point in their lives, over 60% of women who have inherited a mutation in either BRCA1 or BRCA2 will develop breast cancer in their lifetime. Factors associated with an increased likelihood of having a harmful BRCA1 or BRCA2 mutation include: personal or family history of breast cancer diagnoses before age 50, cancer in both breasts, both breast and ovarian cancers in the same individual, reoccurring cases of breast cancer, family history of BRCA mutations, cases of male breast cancer, and being of Ashkenazi Jewish descent.

Currently, the USPSTF recommends that primary care providers use a familial risk assessment tool to screen women who have a personal or family history of breast, ovarian, tubal, or peritoneal cancers or have an ancestry associated with BRCA 1/2 gene mutations. It is also recommended that women with positive screenings receive genetic counseling and, if necessary, BRCA genetic testing. This screening is required to be covered by insurance plans without cost sharing as a preventive service due to the USPSTF recommendation.

Preventive Medication

The use of medications to help reduce the risk or delay the onset of cancer is called chemoprevention. Raloxifene and aromatase inhibitors are two medications used to reduce primary breast cancer risk in postmenopausal women, while tamoxifen reduces risk in premenopausal women and women who do not have a uterus. The USPSTF recommends that clinicians should discuss and offer to prescribe these risk-reducing medications to some women 35 and older who are at an increased risk for breast cancer and at low-risk for adverse medication effects. This is covered without cost-sharing for those with private insurance or under Medicaid expansion. While Medicare covers chemoprevention, patients may be subject to cost-sharing for these drugs. It is recommended that women who are not at an increased risk for breast cancer should not take these medications prophylactically.

Programs for Breast Cancer Services

Most women with public and private insurance have coverage for breast cancer screening services, but the scope of coverage can differ based on the type of insurance plan, how they qualify for Medicaid, and in the case of Medicare, where they live. While there are programs to assist uninsured and underserved women, these programs only reach a fraction of eligible women.

  • Private Individual and Group Insurance Plans—The ACA requires most private group and individual insurance plans (including most employer plans) to cover recommended preventive services with an “A” or “B” rating from the USPSTF, as well as preventive services recommended by HRSA, without consumer cost-sharing. In addition to covering the full cost of mammograms starting at age 40, plans must cover genetic screening and preventive medication for high-risk women. Currently, there is ongoing litigation over the scope of the preventive services requirement in the case, Braidwood Management Inc. v. Becerra, which could affect coverage policy of preventive health services in the future.
  • Medicaid— Under the ACA, women who qualify for Medicaid through their state’s Medicaid expansion are entitled to the same screening and preventive services as women who are covered by private insurance. Traditional Medicaid programs consider breast cancer screening and preventive services to be “optional” and the scope of coverage is determined by the state. A 2021 state survey of Medicaid programs, however, found that most states cover breast cancer screening and prevention services under both expansion and traditional eligibility pathways.
  • Medicare—Medicare Part B covers annual screening mammograms at no-cost for women 40 and over. Coverage for BRCA genetic testing is not required nationally, but may be covered in some regions based on local coverage determinations. Women enrolled in a Medicare Part D drug plan who are at high-risk for breast cancer may have coverage for chemoprevention drugs, but there is no requirement for Part D plans to cover these drugs without cost sharing.
  • TRICARE—TRICARE, the public program for military personnel and dependents, covers screening mammography for women 40 and older, BRCA genetic counseling, and chemoprevention, but is not required to offer coverage without cost-sharing. Out-of-pocket costs for consumers vary by an individual’s specific level of TRICARE coverage and active-duty status.
  • The National Breast and Cervical Cancer Early Detection Program (NBCCEDP)—The NBCCEDP is a CDC program that helps low-income, uninsured, and underinsured women access breast and cervical cancer screening, diagnostic, and treatment services. Uninsured and underinsured women are eligible for the program if they are at or below 250% Federal Poverty Level (FPL) and are between the ages of 40 to 64 for breast cancer screenings. In 2023, 273,989 women received NBCCEDP-funded breast cancer services, including mammograms, screening MRIs, clinical breast exams, and diagnostic services.
  • The Breast and Cervical Cancer Prevention and Treatment Act (BCCPTA)—Passed in 2000, the BCCPTA gives states the option to extend Medicaid coverage to uninsured women under 65 who are diagnosed with breast or cervical cancer through NBCCEDP-funded screening programs. Although all states and D.C. provide full Medicaid benefits to women who receive breast cancer treatment through the NBCCEDP, eligibility requirements may vary by state. In 2001, the Native American Breast and Cervical Cancer Treatment Technical Amendment Act was passed to extend eligibility to American Indian and Alaska Native women who qualify for health services through a tribal organization or the Indian Health Service.

VOLUME 21

Public Perception of Measles Vaccines and Unsubstantiated Treatment Claims


Summary

This Monitor shares new findings from the latest KFF Tracking Poll on Health Information and Trust and examines the false promotion of budesonide and clarithromycin for treating measles. It also explores misrepresentations of safe syringe programs and how prompting strategies can improve accuracy of AI chatbots when answering health-related questions.  


As the U.S. faces rising measles cases across multiple states and the highest number of cases since 2019, the latest KFF Tracking Poll on Health Information and Trust finds that most adults – including most parents – say they have heard at least one of several false claims about measles or the vaccine used to prevent it. About six in ten adults (63%) and a similar share of parents (61%) say they have read or heard the false claim that the measles, mumps, and rubella (MMR) vaccines have been proven to cause autism in children and one in five adults and similar shares of parents (17%) have heard the false claim that vitamin A can prevent measles infections. One in three adults (33%) say they have heard or read the false claim that the measles vaccines are more dangerous than being infected with measles, an increase of 15 percentage points from March 2024.

While fewer than 5% of adults say they think each claim is “definitely true,” less than half identify each as “definitely false.” Consistent with previous KFF polling, most adults express some uncertainty, saying it is either “probably true” or “probably false” that vitamin A can prevent measles infections (70%), that the MMR vaccines have been proven to cause autism in children (62%), or that measles vaccines are more dangerous than measles infections (54%). While at least half of adults express uncertainty, across partisans, Republicans and independents are more likely than Democrats to believe or lean toward believing each false claim about measles, with similar partisan gaps found among parents.

At Least Half of the Public are Uncertain When it Comes to False Claims About Measles, Saying Such Claims are Either Probably True or Probably False

Believing or leaning toward believing false claims about measles and MMR vaccines is associated with whether parents keep their children up to date on recommended vaccines. Among parents who say that at least one of the three false claims about measles is either “definitely” or “probably true,” a quarter (24%) say they have delayed or skipped some vaccines for their children, compared to about one in ten parents (11%) who say each of the three myths are “probably” or “definitely false.” The survey did not measure whether parents have specifically skipped the MMR vaccine for their children. 


Recent Developments

Some Health Professionals Use Budesonide and Clarithromycin to Treat Measles Without Evidence

Natalya Maisheva / Getty Images

As measles outbreaks continue to spread across the U.S., the measles, mumps, and rubella (MMR) vaccine remains the most effective form of prevention. There is no medical treatment for measles once infection occurs, but ongoing skepticism and misinformation about vaccine safety may discourage some from vaccinating themselves or their children. In some cases, individuals seeking alternatives to vaccination may turn to non-evidence-based treatment methods that can be harmful and may delay necessary clinical care. In Texas, hospitals have reported cases of pediatric patients admitted with both measles and vitamin A toxicity, following online promotion of high-dose vitamin A as a treatment, despite no medical consensus supporting its use.

At the same time, some health care providers in Texas have recently made misleading claims that measles can be effectively treated with budesonide, a steroid typically used for asthma and Crohn’s disease, and clarithromycin, an antibiotic. However, there is no evidence these drugs are effective for measles, and both carry risks. Medical experts, including Dr. Paul Offit of the Children’s Hospital of Philadelphia and Dr. Adam Ratner of the American Academy of Pediatrics, told NBC that steroids like budesonide can suppress the immune system and should not be used early in viral infections like measles. False claims about budesonide’s effectiveness for preventing viral infections have circulated before when it was also wrongly promoted as a treatment for COVID-19. Those claims were based on preliminary research from Oxford that showed a relief of symptoms in mild cases of COVID-19, but did not reduce risk of hospitalization and death. Clarithromycin is also ineffective against viruses and generally not used to treat any secondary bacterial infections that arise from measles, which often require intravenous antibiotics like vancomycin and ceftriaxone. Unnecessary use of broad-spectrum oral antibiotics like clarithromycin may also increase the risk of antibiotic resistance.

The inaccurate claim that budesonide and clarithromycin can treat measles gained further attention after Health and Human Services (HHS) Secretary Robert F. Kennedy Jr. shared a post on X calling physicians who used these drugs to treat measles patients “extraordinary healers.” His post claimed that about 300 children in Texas had been successfully treated with budesonide and clarithromycin, but he later stated that vaccines are the best way to prevent measles. Other anti-vaccine social media users  amplified these claims, including a medical doctor with approximately 1.2 million followers on X who shared an article suggesting that budesonide could have prevented the death of a child in Texas.

False Claims Undermine HIV Prevention Efforts in Maine

Radule Perisic / Getty Images

Misleading claims about syringe service programs (SSPs), or needle exchange programs, may complicate local public health efforts in Maine to contain an ongoing HIV outbreak primarily affecting people who inject drugs and/or are unhoused. Since October 2023, the Maine CDC has reported a total of 23 cases related to an outbreak in Penobscot County, a sharp increase from the county’s average of two new diagnoses per year over the past five years. In response, the agency says it is working with community partners to increase access to HIV and hepatitis C testing, provide HIV and sexually transmitted infection (STI) prevention services such as post-exposure prophylaxis (PEP) and pre-exposure prophylaxis (PrEP), and offer SSPs—community-based initiatives that provide sterile syringes and safe disposal of used ones.

Articles about the outbreak were shared on Facebook and Reddit, where many commenters disparaged SSPs. Some falsely claimed that the programs increase drug use and cause infectious disease outbreaks, despite research showing that they reduce the spread of HIV. Extensive research, including a 2022 systematic review published in International Journal of Drug Policy, found sufficient evidence that SSPs prevent HIV transmission among people who inject drugs. The review also found that SSPs are likely to reduce injection risk behaviors and do not appear to be associated with an increase in injection frequency. Continued misleading claims about the effectiveness of SSPs may undermine support for evidence-based interventions in communities facing stigma and barriers to care.


AI & Emerging Technology

Study Highlights How AI Prompting Can Influence Health Misinformation Risk 

Lourdes Balduque / Getty Images

As people turn to AI for health information, the way patients phrase their questions may affect whether they receive accurate answers. A study in JAMIA Open explored how neuro-oncology patients could most effectively use large language models (LLMs) to answer health-related questions when reviewing their doctor’s notes. One study author – a neuro-oncologist – and one of their patients evaluated three widely available LLMs on 8 dimensions, including accuracy and evidence, using questions based on a doctor’s note from a neuro-oncology visit. The chatbots were tested with and without a prompt to act like an expert oncologist, and the questions were presented either in the order that the information appeared in the doctor’s note or in random order. Both the neuro-oncologist and their patient rated the responses highest across all 8 dimensions when the chatbots were instructed to act as an expert oncologist. However, all models scored low in their use of evidence, which may pose risks if people rely on these tools without understanding their limitations. Unlike search engines, LLMs are trained on large datasets and generate responses based on patterns, rather than by directly referencing verifiable sources. Because of these limitations, the study authors note that involving patients in the development of ethical guidelines could help strengthen existing efforts – such as the transparency requirements set by the Assistant Secretary for Technology Policy/Office of the National Coordinator for Health Information Technology’s (ASTP/ONC) AI assurance labs – to better limit AI-generated misinformation.

About The Health Information and Trust Initiative: the Health Information and Trust Initiative is a KFF program aimed at tracking health misinformation in the U.S., analyzing its impact on the American people, and mobilizing media to address the problem. Our goal is to be of service to everyone working on health misinformation, strengthen efforts to counter misinformation, and build trust. 


View all KFF Monitors

The Monitor is a report from KFF’s Health Information and Trust initiative that focuses on recent developments in health information. It’s free and published twice a month.

Sign up to receive KFF Monitor
email updates


Support for the Health Information and Trust initiative is provided by the Robert Wood Johnson Foundation (RWJF). The views expressed do not necessarily reflect the views of RWJF and KFF maintains full editorial control over all of its policy analysis, polling, and journalism activities. The Public Good Projects (PGP) provides media monitoring data KFF uses in producing the Monitor.