Poll Finding

Americans’ Experiences With Gun-Related Violence, Injuries, And Deaths

Published: Apr 11, 2023

Findings

Key Findings

  • Experiences with gun-related incidents are common among U.S. adults. One in five (21%) say they have personally been threatened with a gun, a similar share (19%) say a family member was killed by a gun (including death by suicide), and nearly as many (17%) have personally witnessed someone being shot. Smaller shares have personally shot a gun in self-defense (4%) or been injured in a shooting (4%). In total, about half (54%) of all U.S. adults say they or a family member have ever had one of these experiences.
  • Gun-related injuries and deaths, as well as worries about gun violence, disproportionately affect people of color in the U.S. Three in ten Black adults (31%) have personally witnessed someone being shot, as have one-fifth of Hispanic adults (22%). One-third of Black adults (34%) have a family member who was killed by a gun, twice the share of White adults who say the same (17%). In addition, one-third of Black adults (32%) and Hispanic adults (33%) say they worry either “every day,” or “almost every day” about themselves or someone they love being a victim of gun violence (compared to one in ten White adults). And one in five Black adults (20%) and Hispanic adults (18%) feel like gun-related crimes, deaths, and injuries are a “constant threat” to their local community, more than double the share among White adults (8%).
  • The majority (84%) of U.S. adults say they have taken at least one precaution to protect themselves or their families from the possibility of gun violence, including nearly six in ten (58%) who have talked to their children or other family members about gun safety, and more than four in ten who have purchased a weapon other than a gun, such as a knife or pepper spray (44%), or attended a gun safety class or practiced shooting a gun (41%). About a third (35%) have avoided large crowds, such as music festivals, or crowded bars and clubs to protect themselves or their families from the possibility of gun violence. Three in ten (29%) have purchased a gun to protect themselves or their family from the possibility of gun violence. Smaller shares, but still at least one in seven, have avoided using public transit (23%), changed or considered changing the school that their child attends (20%), avoided attending religious services, cultural events or celebrations (15%), or moved to a different neighborhood or city (15%).
  • One in seven (14%) adults say a doctor or other health care provider has asked if they own a gun or if there are guns in the home, while about one in four (26%) parents of children under 18 say their child’s pediatrician has asked them about guns in the home. Few (5%) adults say a doctor or other health care provider has ever talked to them about gun safety.
  • Four in ten (41%) adults report living in a household with a gun. Among this group, more than half say at least one gun in their home is stored in the same location as the ammunition (52%), 44% say a gun is stored in an unlocked location, and more than one-third report a gun is stored loaded (36%). Overall, three in four (75%) adults living in households with guns say any of their guns are stored in one of these ways, representing three in ten overall adults (31%). About four in ten (44%) parents of children under age 18 say there is a gun in their household. Among parents with guns in their home, about one-third say a gun is stored loaded (32%) or stored in an unlocked location (32%). More than half of parents (61%) say any gun in their homes is stored in the same location as ammunition.

Many Say They Or A Family Member Have Experienced Or Witnessed A Shooting, Or Have Been Threatened With A Gun

The latest polling from KFF finds a majority (54%) of U.S. adults have either personally or had a family member who has been impacted by a gun-related incident, such as witnessing a shooting, being threatened by gun, or being injured or killed by a gun. When asked about their own personal experience, one in five report that they have been threatened with a gun (21%), while nearly as many (17%) say they have witnessed someone being shot. Small but important shares report experiencing other gun-related incidents, including 4% who have been injured by a gun, and 4% who have shot a gun in self-defense. The share who have shot a gun in self-defense rises to 18% among adults whose current or past job included the use of guns, such as military or law enforcement work.

When asked about their family members, about three in ten adults (31%) say they have a family member who has been threatened with a gun, while a similar share (28%) say a family member has witnessed someone being shot. One in five (20%) adults say a family member has been injured by a gun, and 19% say a family member has been killed by a gun, including death by suicide. About half of deaths (55%) in the U.S. involving guns are suicides.

More Than Half Of U.S. Adults Have Experienced A Gun-Related Incident, Including One In Five Who Have Personally Been Threatened With A Gun Or Had A Family Member Who Has Been Killed By A Gun

The latest KFF poll finds experiences with shootings are pervasive but even more commonly reported among people of color. While many factors, such as income, education, age, gender, and where they live can play a role in people’s experiences with gun-related incidents and worries about gun violence, race and ethnicity consistently is one of the strongest demographic predictors of both experiences and worries.1 

Black adults (31%) are about twice as likely as White adults (14%) to say they have personally witnessed someone being shot and are also twice as likely to have a family member who has been killed by a gun (34% compared to 17% of White adults). Appendix Table 1 shows each reported incidence asked about by racial and ethnic groups.

Black And Hispanic Adults More Likely Than White Adults To Have Witnessed A Shooting, Black Adults Twice As Likely To Report Having A Family Member Who Was Killed By A Gun

Black Adults Are More Likely To Report Being Worried About Being Victims Of Gun Violence, See Gun Violence As A Constant Threat

While a majority of adults (82%) say they worry “sometimes” or less often that they or someone they love will be a victim of gun violence, small but important shares say they worry either “every day,” (8%) or “almost every day” (10%) about this. Larger shares of Black and Hispanic adults compared to White adults say they frequently worry about themselves or someone they love being a victim of gun violence. One-third of Black adults (32%) and Hispanic adults (33%) say they worry either “every day,” or “almost every day” about themselves or someone they love being a victim of gun violence, compared to one in ten (10%) White adults.

One-fourth of parents of children under 18 say they worry “every day” (12%) or “almost every day” (13%) about themselves or a loved one being a victim of gun violence. Adults who have personally experienced or had a family member experience a gun-related incident are almost twice as likely to say they worry “every day” than those who have not (11% vs. 6%). In a sign of how pervasive gun violence is, how often someone worries about a loved one being a victim of gun violence does not vary much among all age groups under the age of 65.

Black Adults, Hispanic Adults, And Parents Significantly More Likely To Worry About A Loved One Being A Victim Of Gun Violence

Half (51%) of U.S. adults say gun-related crimes, injuries, and deaths, are a “constant threat” in their local community (11%) or a “major concern but not a constant threat” (40%). Majorities of Black adults (62%) and Hispanic adults (62%) say gun-related activities are either a major concern or a constant threat, while less than half (45%) of White adults say the same. Notably, 8% of White adults say gun-related activity is a constant threat, less than half the share of Black adults (20%) or Hispanic adults (18%) who say the same.

Those living in urban areas are more concerned about the threat of gun-related crimes, injuries, and deaths compared to those living in other types of areas. About six in ten (62%) adults living in urban areas say gun activity is a constant threat or a major concern, compared to about half (48%) of those who live in suburban areas and about three in ten (29%) rural adults.

Women are also more likely than men to say gun-related crimes, injuries, and deaths are either a constant threat or major concern in their local communities (58% vs. 43%).

Gun Violence Considered A "Constant Threat" Or "Major Concern" By A Majority Of Black And Hispanic Adults

Overall, most adults say they feel either “very” (41%) or “somewhat” (41%) safe from gun violence in their neighborhoods. The groups most likely to say they feel “not too safe” or “not safe at all” from gun violence in their neighborhood are also among the groups most likely to say they worry about someone they love being a victim of gun violence. One in six (17%) Black adults say they feel “not safe at all” from gun violence in their neighborhood, a substantially larger share compared to White adults (2%) and nearly twice as many as compared to Hispanic adults (9%).

Similar shares of people living in urban areas (25%) also say they feel not too safe or not safe at all. About one in five women (22%) say they do not feel safe from gun violence, including 6% who say they feel not safe at all. Larger shares of adults who have experienced gun-related incidents, either personally or had a family member who has, say they feel unsafe from gun violence in their neighborhood than do adults who have not experienced gun-related incidents (23% vs. 13% not too safe or not safe at all).

About Three In Ten Black And Hispanic Adults Say They Feel "Not Too Safe" Or "Not Safe At All" From Gun Violence In Their Neighborhood

More Than Eight In Ten Adults Have Taken At Least One Precaution To Protect Themselves Or Their Families From The Possibility Of Gun Violence

Large majorities of adults (84%) say they have taken at least one precaution to protect themselves or their families from the possibility of gun violence. Nearly six in ten (58%) adults say they have talked to their child or other family members about gun safety, including majorities of White adults (62%), Hispanic adults (56%) and Black adults (54%). At least four in ten adults have taken defensive actions, including 44% who say they have purchased a weapon other than a gun, such as a knife, pepper spray, or something else, and 41% who say they have attended a gun safety class or practiced shooting a gun. Nearly half of White adults (47%) say they have taken a gun safety class or practiced shooting a gun, a substantially larger share than Black adults (34%) or Hispanic adults (32%) who say they have done so.

About one in three (35%) adults say they have avoided large crowds, such as music festivals or crowded bars and clubs to help protect themselves or their families from the possibility of gun violence. This figure is driven largely by Black adults, of whom more than half (55%) say they have done this, compared to about four in ten (43%) Hispanic adults and three in ten (29%) White adults.

About three in ten (29%) adults say they have purchased a gun as a precaution against gun violence, including slightly larger shares of White adults (35%) than Black adults (24%) or Hispanic adults (20%). Smaller, but important shares of adults report that they have taken other steps to protect themselves or their families from gun violence, including one in four (23%) who say they have avoided using public transit, one in five (20%) who say they changed or considered changing the school their child attends, and one in seven (15%) who have avoided attending religious services, cultural events, or celebrations, or who have moved to a different neighborhood or city (15%).

More Than Eight In Ten Adults Say They Have Taken At Least One Precaution To Protect Themselves Or Their Families From The Possibility Of Gun Violence

Public Awareness And Experiences Talking With Health Care Providers About Gun Safety

Few Adults Say A Health Care Provider Has Talked To Them About Gun Safety

In 2016, the American Medical Association (AMA) adopted a policy calling gun violence in the U.S. a “public health crisis” and since then, medical schools have increasingly offered gun-related content to train doctors about how to talk about gun safety with their patients. However, the latest KFF poll finds that more than eight in ten (86%) adults say they have never had a doctor or other health care provider ask if they own a gun or if there are guns in the home. Overall, 5% say a doctor or health care provider has talked with them about gun safety.

About one in four (26%) parents report that their child’s pediatrician has asked about gun ownership and guns in the home, yet, overall, less than one in ten (8%) say the pediatrician talked to them about gun safety.

Few Adults Say A Health Care Provider Has Asked About Guns In The Household Or Talked About Gun Safety

Three In Four Adults Living In A Household With A Gun Say It Is Stored Either Unlocked, Loaded, Or In The Same Location As Ammunition

About four in ten (41%) adults say they live in a household with a gun. Among this group, slightly more than half (52%) say at least one gun in their home is stored in the same location as ammunition, while about half (47%) say a gun is not stored in the same location as ammunition. More than four in ten (44%) say any gun in their house is stored in an unlocked location, and just over a third (36%) say any of the guns in their household are stored loaded. Collectively, three in four adults (75%) with guns in their household (31% of all adults) say any of the guns in their house are stored in the same location as ammunition, in an unlocked location, or loaded.

Three In Four Adults In Households With Guns Say Any Of Their Guns Are Stored Loaded, In An Unlocked Location, Or In The Same Location As Ammunition

About four in ten (44%) parents of children under age 18 report there is a gun in their household. Parents with guns in their homes are less likely than those without children to say they store their guns loaded or unlocked. About one-third of parents who have guns in their home say their guns are stored loaded (32%) or stored in an unlocked location (32%). More than half of parents (61%) say any gun in their homes are stored in the same location as ammunition. Taken as a whole, a majority (78%) of parents in gun-owning households say a gun is stored in any one of these ways.

Six In Ten Parents With Guns In Their Households Say A Gun Is Stored In The Same Location As Ammunition, One Third Say A Gun Is In An Unlocked Location Or Loaded

Knowledge On Some Gun Violence Facts Is Somewhat Limited

Despite the ubiquitous news of gun violence in this country and that so many people have experienced gun-related incidents, the public is largely unaware of the extent to which guns are responsible for the deaths of young people and the cause of death in many suicides. About half (49%) of the public is aware that guns are the leading cause of death for children and teenagers ages 1-19 in the U.S, which recently became the case in 2020 according to an analysis of data from the Centers for Disease Control and Prevention (CDC). Past KFF analysis of CDC and IMHME data has found that the U.S. is alone among peer countries in the number of deaths of children and teens by guns. In no other peer country are guns a top cause of childhood and teenage mortality. In the survey, Black adults (71%) and Hispanic adults (60%) are more likely than White adults (42%) to be aware that guns are the leading cause of death for those under the age of 20 in the U.S.

Slightly less than half (46%) of adults are aware that more than half of deaths in the U.S. involving guns are suicides. Indeed, in the U.S., about half of deaths (55%) in the U.S. involving guns are suicides according to the Centers for Disease Control and Prevention  and about half of suicides (52%) are committed by guns according to the National Institute of Health (NIH).

About Half Of The Public Is Aware Guns Are The Leading Cause Of Death For Those Under 20, More Than Half Of Deaths In U.S. Involving Guns Are Suicides

Appendix

Experiences With Gun-Related Incidents Among Black Adults, Hispanic Adults, White Adults

Methodology

This KFF Health Tracking Poll was designed and analyzed by public opinion researchers at KFF. The survey was conducted March 14-23, 2023, online and by telephone among a nationally representative sample of 1,271 U.S. adults in English (1,198) and in Spanish (73). The sample includes 986 adults reached through the SSRS Opinion Panel either online or over the phone (n=33 in Spanish). The SSRS Opinion Panel is a nationally representative probability-based panel where panel members are recruited randomly in one of two ways: (a) Through invitations mailed to respondents randomly sampled from an Address-Based Sample (ABS) provided by Marketing Systems Groups (MSG) through the U.S. Postal Service’s Computerized Delivery Sequence (CDS); (b) from a dual-frame random digit dial (RDD) sample provided by MSG. For the online panel component, invitations were sent to panel members by email followed by up to three reminder emails. 961 panel members completed the survey online and panel members who do not use the internet were reached by phone (25).

Another 285 (n=40 in Spanish) interviews were conducted from a random digit dial telephone sample of prepaid cell phone numbers obtained through MSG. Phone numbers used for the prepaid cell phone component were randomly generated from a cell phone sampling frame with disproportionate stratification aimed at reaching Hispanic and non-Hispanic Black respondents. Stratification was based on incidence of the race/ethnicity groups within each frame. Respondents in the phone samples received a $15 incentive via a check received by mail, and web respondents received a $5 electronic gift card incentive (some harder-to-reach groups received a $10 electronic gift card).

The online questionnaire included two questions designed to establish that respondents were paying attention. Cases that failed both attention check questions, those with over 30% item non-response, and cases with a length less than one quarter of the mean length by mode were flagged and reviewed. Cases were removed from the data if they failed two or more of these quality checks. Based on this criterion, no cases were removed.

The combined cell phone and panel samples were weighted to match the sample’s demographics to the national U.S. adult population using data from the Census Bureau’s 2021 Current Population Survey (CPS). Weighting parameters included sex, age, education, race/ethnicity, region, and education. The sample was weighted to match patterns of civic engagement from the September 2017 Volunteering and Civic Life Supplement data from the CPS and to match frequency of internet use from the National Public Opinion Reference Survey (NPORS) for Pew Research Center.  Finally, the sample was weighted to match patterns of political party identification based on a parameter derived from recent ABS polls conducted by SSRS polls. The weights take into account differences in the probability of selection for each sample type (prepaid cell phone and panel). This includes adjustment for the sample design and geographic stratification of the cell phone sample, within household probability of selection, and the design of the panel-recruitment procedure.

The margin of sampling error including the design effect for the full sample is plus or minus 3 percentage points. Numbers of respondents and margins of sampling error for key subgroups are shown in the table below. For results based on other subgroups, the margin of sampling error may be higher. Sample sizes and margins of sampling error for other subgroups are available by request. Sampling error is only one of many potential sources of error and there may be other unmeasured error in this or any other public opinion poll. KFF public opinion and survey research is a charter member of the Transparency Initiative of the American Association for Public Opinion Research.

GroupN (unweighted)M.O.S.E.
Total1,271± 3 percentage points
Race/Ethnicity
White, non-Hispanic706± 5 percentage points
Black, non-Hispanic206± 9 percentage points
Hispanic248± 8 percentage points

Endnotes

  1. A series of logistic regressions were run to examine which demographic variables were statistically significant predictors of both reported experiences of gun-related incidents, as well as worries about a loved one being a victim of gun violence. In each model, Black and Hispanic identity remained a strong predictor as well as education and age. Younger adults and those with lower levels of education were also more likely to report both personal and familial experiences with gun violence. Running a model with only White adults, income is also a significant predictor, as those with lower levels of income are more likely to report experiences with gun-related incidents. ↩︎
News Release

One in Five Adults Say They’ve Had a Family Member Killed by a Gun, Including Suicide, and One in Six Have Witnessed a Shooting; Among Black Adults, a Third Have Experienced Each

Three in Four Adults in Households with Guns Say at Least One Gun in Their Home is Either Unlocked, Loaded, or Kept with Ammunition

Published: Apr 11, 2023

Experiences with gun-related incidents are common across the country, with about one in five adults saying that they have personally been threatened with a gun (21%) or had a family member killed by a gun, including by suicide (19%), finds a new KFF survey about Americans’ experiences with gun-related violence and incidents. One in six (17%) say they personally witnessed someone being shot.

Smaller shares say that they have shot a gun in self-defense (4%) or personally been injured by one (4%). In all, slightly more than half (54%) of all adults say they have a connection to at least one of these gun-related incidents.  

Black adults (34%) are about twice as likely as White (17%) or Hispanic (18%) adults to say that they have a family member who was killed by a gun.  They are also about twice as likely as White adults to say they witnessed someone being shot (31% v. 14%), with Hispanic adults in between (22%).

Among the public overall, the vast majority say they worry at least “sometimes” that they or someone in their family will become a victim of gun violence. This includes small but important shares who say they worry about it “every day” (8%) or “almost every day” (10%).

About a third of both Hispanic (33%) and Black (32%) adults say they worry daily or almost daily that a family member will become a victim of gun violence, three times the share of White adults (10%). 

Parents of children under age 18 are more likely than other adults to say they worry daily or almost daily (24% v. 15%).

While most adults overall say they feel either “very” (41%) or “somewhat” (41%) safe from gun violence in their neighborhoods, significant shares say they feel “not too safe” (13%) or not safe at all (5%). One in six Black adults (17%) don’t feel at all safe in their neighborhoods, far greater than the share of White (2%) or Hispanic (9%) adults. 

About four in 10 adults (41%), and a similar share of parents with children at home (44%), say that they live in a household with guns. 

Among all adults with guns in their homes, three in four (75%) say that the guns are stored in ways that don’t reflect some common gun-safety practices.

Specifically, about half (52%) say that a gun in their home is stored in the same location as ammunition; more than four in 10 (44%) say that a gun is kept in an unlocked location; and more than third (36%) say that a gun is stored loaded.

Among parents in gun-owning households, about a third (32%) store a gun in an unlocked location, and the same share (32%) say a gun is stored loaded. Most (61%) store a gun in the same location as ammunition.

Small Shares Say Their Doctor or Child’s Pediatrician Talked to Them About Guns or Gun Safety

Amid a push for health professionals to treat gun safety as a public health issue, one in seven (14%) adults say that a health care provider has ever asked them if there were guns in their home, and 5% say that they talked about gun safety.

Among parents, a quarter (26%) say a pediatrician has ever asked them about guns in the home, and 8% say they talked about gun safety.Designed and analyzed by public opinion researchers at KFF, the survey was conducted from March 14-23, 2023, online and by telephone among a nationally representative sample of 1,271 U.S. adults, in English and in Spanish. The margin of sampling error is plus or minus 3 percentage points for the full sample. For results based on other subgroups, the margin of sampling error may be higher.

Strategies to Manage Unwinding Uncertainty for Medicaid Managed Care Plans: Medical Loss Ratios, Risk Corridors, and Rate Amendments

Authors: Elizabeth Hinton, Jada Raphael, and Kathleen Gifford
Published: Apr 10, 2023

Introduction

Managed care is the dominant delivery system for Medicaid enrollees with 72% of Medicaid beneficiaries nationally enrolled in comprehensive managed care organizations (MCOs), accounting for 52% of total Medicaid spending (or more than $376 billion) in FY 2021. States pay MCOs on a capitated basis – that is, a fixed per member per month payment that must be “actuarially sound” when set. Capitation rates are typically established prospectively for a 12-month rating period, regardless of changes in health care costs or utilization.1  However, as pandemic-related enrollment increases, utilization decreases, and other cost and acuity changes began to emerge, the Centers for Medicare & Medicaid Services (CMS) allowed states to modify managed care contracts and many states implemented COVID-19 related “risk corridors” (where states and health plans agree to share profit or losses), allowing for the recoupment of funds.

States and plans are now facing another period of heightened fiscal uncertainty due to the expiration of the continuous enrollment period (introduced at the start of the pandemic) on March 31, 2023. While millions could lose coverage during the unwinding – with some current enrollees no longer eligible, and others falling through the cracks due to renewal procedures — Medicaid MCOs may see overall average member acuity increase, since people who need more health care may be more likely to stay enrolled. This would result in higher per member utilization and costs. As they developed their 2023 MCO capitation rates, some states may have built in enrollment and acuity change assumptions related to unwinding, but considerable uncertainty remains.

This brief draws on data from KFF’s 22nd annual Medicaid budget survey to provide a high-level snapshot of states with minimum medical loss ratio (MLR) and remittance requirements and risk corridors (defined in Table 1 below) in place as of July 1, 2022 that may provide financial protection and limits on financial risk for states and plans as the unwinding unfolds. This brief also discusses states’ ability to amend capitation rates (during the rating period and retroactively) as the unwinding plays out.

Risk Mitigation Strategies and Rate Amendments

Background

As of July 2022, 41 states, including DC, contract with comprehensive, risk-based managed care plans to provide care to at least some of their Medicaid beneficiaries. Medicaid managed care organizations provide comprehensive acute care (i.e., most physician and hospital services) and in some cases long-term services and supports to Medicaid beneficiaries. MCOs accept a set per member per month payment for these services and are at financial risk for the Medicaid services specified in their contracts. Under federal law, payments to Medicaid MCOs must be actuarially sound.2 , 3  Actuarial soundness means that “the capitation rates are projected to provide for all reasonable, appropriate, and attainable costs that are required under the terms of the contract and for the operation of the managed care plan for the time period and the population covered under the terms of the contract.”

Unlike fee-for-service (FFS), capitation provides upfront fixed payments to plans for expected utilization of covered services, administrative costs, and profit. Plan rates are usually set for a 12-month rating period and must be reviewed and approved by CMS each year. States may use a variety of mechanisms to adjust plan risk, incentivize plan performance, and ensure payments are not too high or too low, including risk-sharing arrangements (including risk corridors), risk and acuity adjustments, medical loss ratios (MLRs, which reflect the proportion of total capitation payments received by an MCO spent on clinical services and quality improvement), or incentive and withhold arrangements.

In response to unanticipated COVID-19 costs and conditions that led to decreased utilization, CMS permitted states to make pandemic-related adjustments to managed care contracts and capitation rates to provide financial protection and limits on financial risk for states and plans. In 2021, more than half of MCO states reported implementing COVID-19-related risk corridors in their 2020 or 2021 contracts, and many states reported the recoupment of funds as a result. Since the start of the pandemic, Medicaid enrollment overall has grown substantially, resulting in increased MCO enrollment as well. Enrollment growth has been primarily attributed to the Families First Coronavirus Response Act (FFCRA) provision that required states to ensure continuous enrollment for Medicaid enrollees in exchange for a temporary increase in the Medicaid match rate.

The Consolidated Appropriations Act, 2023 ends the continuous enrollment provision and allows states to resume disenrollments starting April 1, 2023. States must initiate all renewals and other outstanding eligibility actions within 12 months. CMS has issued specific guidance allowing states to permit MCOs to update enrollee contact information and facilitate continued enrollment. The share of individuals disenrolled (and the pace of disenrollment) across states will vary due to differences in how states prioritize and process renewals. When states begin disenrollments, Medicaid managed care plans may see the acuity of their membership increase with implications for per member utilization and costs. In a recent KFF survey of non-profit safety net managed care plans, plans reported they expect the risk profile (or acuity) of members to increase (as a result of the unwinding), as plans anticipate “stayers” will be sicker than “leavers.” Plans also reported they expect MLRs to increase.

This brief describes minimum MLR and remittance requirements and risk corridors arrangements in place as of July 2022 that may provide financial protection and limits on financial risk for states and plans as another period of heightened uncertainty approaches. The brief also discusses states’ ability to amend previously certified and approved capitation rates already in place, including retroactive rate changes under certain circumstances. CMS requires states to document risk-sharing mechanisms (including MLR requirements and risk corridor arrangements) in health plan contracts and rate certification documents prior to the start of the rating period. States may be using a variety of other risk mitigation strategies and profit-sharing approaches, including profit caps, experience rebates, risk pools, reinsurance, and stop loss requirements, which are not covered in this issue brief.

Minimum Medical Loss Ratios (MLRs) and Remittance Requirements

WHAT ARE MLR AND REMITTANCE REQUIREMENTS?

The Medical Loss Ratio reflects the proportion of total capitation payments received by an MCO spent on clinical services and quality improvement, where the remainder goes to administrative costs and profits. To limit the amount that plans can spend on administration and keep as profit, CMS published a final rule in 2016 that requires states to develop capitation rates for Medicaid to achieve an MLR of at least 85% in the rate year.4 , 5  Plans must calculate and report an MLR and submit an annual MLR report to the state (within 12 months after the end of the contract year).6  A review conducted in 2020 by the HHS Office of Inspector General found that while most plans submitted required annual MLR reports, almost half were incomplete, while over a third of states indicated that they did not review all MLR data for accuracy. States are required to submit a summary of plans’ MLR reports annually to CMS with their rate certification and, as of October 1, 2022, are required to use the standard reporting template released by CMS. States are also required to submit an Annual Managed Care Program report that must include financial performance information for each MCO, including MLR experience.

While there is no federal requirement for Medicaid plans to pay remittances to the state if they fail to meet the MLR standard, states have discretion to require remittances. (A state and the federal government share in any remittances in proportion to the state’s federal matching rate—if the state requires remittances). For a limited time (from federal fiscal years 2021 through 2023), The Substance Use Disorder Prevention that Promotes Opioid Recovery and Treatment for Patients and Communities (SUPPORT) Act permits states to keep their regular state share of any remittances paid by Medicaid plans for expansion adults rather than only 10%.7  President Biden’s FY 2024 Budget proposes to require Medicaid managed care plans to meet an 85% minimum MLR and to require states to collect remittances if plans fail to meet the minimum MLR, estimating $20 billion in Medicaid savings over 10 years. Analysis of National Association of Insurance Commissioners (NAIC) data for the Medicaid managed care market show that average loss ratios in 2021 (in aggregate across plans) remained lower by three percentage points from 2019 (implying increased profitability).

WHAT ARE STATES DOING?

Nearly all MCO states reported a minimum MLR requirement is always in place for MCOs as of July 1, 2022 (Figure 1). While states must use plan reported MLR data to set future payment rates so that plans will “reasonably achieve” an MLR of at least 85%, states are not required to set a minimum MLR for their managed care plans. If states set a minimum MLR requirement, it must be at least 85%.8  Our findings represent a slight increase in the number of states that reported minimum MLR requirements compared to findings from OIG’s 2020 review. A few states noted that minimum MLRs may vary by program. Tennessee reported plans to implement a minimum MLR with remittance requirement in 2023 and Texas, a state with no state MLR requirement, reported an “experience rebate” requirement calculated on a graduated basis as a percentage of net income.

State Medicaid MCO Minimum Medical Loss Ratio (MLR) Requirements in Place as of July 1, 2022

More than two-thirds of MCO states report they always require remittance payments when an MCO does not meet minimum MLR requirements (Figure 2). Twenty-eight states reported that they always require MCOs to pay remittances, while five states indicated they sometimes require MCOs to pay remittances (Figure 2). States reporting that they sometimes require remittances may limit this requirement to certain MCO contracts. For example, Utah limits its remittance requirements to MCO contracts for the adult expansion population. Seven states do not require remittances (including four states that do not set a minimum MLR requirement).9 

State Medicaid MCO Minimum Medical Loss Ratio (MLR) Remittance Requirements in Place as of July 1, 2022

Risk Corridors

Nearly half of responding MCO states reported risk corridors were always in place in MCO contracts as of July 1, 2022 (Figure 3). Risk corridors provide financial protection to MCOs and limits on financial risk to states. Risk corridors allow states and health plans to share profit or losses (at percentages specified in plan contracts) if aggregate spending falls above or below specified thresholds (“two-sided” risk corridor). Risk corridor thresholds may be tied to a target MLR. Risk corridors may cover all/most medical services (and members) under a contract or may be more narrowly defined, covering a subset of services or members. States may introduce risk corridors on a time-limited basis – for example, following the expansion of coverage to new groups (e.g., ACA Medicaid expansion adults). Massachusetts reported an overall market risk corridor in addition to individual plan risk corridors. CMS allowed states to retroactively implement risk mitigation strategies, including risk corridors, in response to unanticipated costs and decreased utilization related to the COVID-19 pandemic.10 ,11  A few states reported implementing pandemic-related risk corridors beginning in 2020 but eliminated them in 2022 or 2023.

State Medicaid MCO Risk Corridors in Place as of July 1, 2022

Rate Amendments

Even if the risk mitigation strategies described above are in place, states may determine rate amendments are necessary if their actual unwinding experience differs significantly from the assumptions used for the initial certified rates. During the rating period, states may increase or decrease rates by 1.5% per rate cell (which apply to population subgroups with one or more common characteristics such as age, gender, eligibility category, and geographic region) without seeking CMS approval for the change (different rules apply for states with approved rate ranges per cell).12  To make a larger change, the state must submit a rate amendment for federal approval that addresses and accounts for all differences from the most recently certified rates. A state may also determine that a retroactive adjustment to capitation rates (i.e., change to previously paid rates) is necessary. Retroactive adjustments are permissible under certain circumstances but must be certified by an actuary and approved by CMS. In the preamble to its 2020 final rule, CMS noted that states can adopt retroactive rate adjustments when substantial coverage changes occur mid-year or adjustments are necessary to address disease outbreaks, launches of high-cost prescription drugs, or other unforeseen circumstances that increase benefit costs.

Looking Ahead

In a dynamic environment where future MCO enrollment and utilization levels are uncertain, risk mitigation tools – like MLR and remittance requirements and risk corridors – can help states and MCOs plan for the unknown, ensuring greater fiscal certainty for both. With the Medicaid continuous coverage requirement ending this spring, another period of Medicaid enrollment and utilization uncertainty is beginning. While all states are now resuming Medicaid redeterminations or will soon, the pace and timing of those redeterminations will vary by state resulting in fiscal implications that are unique to each state. Risk mitigation strategies may provide financial protection and limits on financial risk for states and plans as the unwinding unfolds. In its 2022-2023 Medicaid Managed Care Rate Development Guide, released in April 2022, CMS recommended that all states “implement a 2-sided risk mitigation strategy for rating periods impacted by the public health emergency.”

As the process plays out in each state, more current data may help inform states whether mid-year rate amendments may be needed. State Medicaid programs use the most recent and accurate enrollment, cost, and utilization data available to ensure that MCO capitation rates are actuarially sound and that MCOs are not over-paid or under-paid for the services they deliver. In most states, Medicaid redeterminations will occur over 10-12 months that will cross more than one MCO contracting year (as most states contract on a state fiscal year or a calendar year basis) and while MCO membership losses will be immediately apparent, new utilization and acuity trends may take longer to discern. As they developed their 2023 MCO capitation rates, some states may have built in enrollment and acuity change assumptions related to unwinding (e.g., like in Arizona), but considerable uncertainty remains. Executives of publicly-traded companies that operate Medicaid MCOs (including Elevance13  and UnitedHealth Group14 ) have expressed confidence in states and their 2023 Medicaid rate-setting actions to date; however, MCOs will likely closely monitor utilization and acuity changes going forward. Sarah London, CEO of Centene, noted during the Q4 2022 earnings call: “We are focused on ensuring that state program rates reflect any shifting of the risk pool created by membership changes. We recognize the dynamics in each market are different, so we are leveraging our data to support early collaborative discussions with our state partners.”15 

This brief draws on work done under contract with Health Management Associates (HMA) consultants Kathleen Gifford, Aimee Lashbrook, Mike Nardone, and Matt Wimmer.

  1. Medicaid and CHIP Payment And Access Commission, “Medicaid Managed Care Capitation Rate Setting,” March 2022; https://www.macpac.gov/wp-content/uploads/2022/03/Managed-care-capitation-issue-brief.pdf. ↩︎
  2. These requirements apply to comprehensive risk-based plans as well as limited-benefit plans (e.g., those providing only dental or behavioral health services). ↩︎
  3. The 2016 final rule on Medicaid managed care significantly strengthened the standards that states must meet in developing actuarially sound capitation rates and that CMS will apply in its review and approval of rates ↩︎
  4. Julia Paradise and MaryBeth Musumeci, CMS’s Final Rule on Medicaid Managed Care: A Summary of Major Provisions, (Washington, DC: KFF, June 9, 2016), https://modern.kff.org/medicaid/issue-brief/cmss-final-rule-on-medicaid-managed-care-a-summary-of-major-provisions/. ↩︎
  5. The 85% minimum MLR is the same standard that applies to Medicare Advantage and private large group plans. ↩︎
  6. Center for Medicare and Medicaid (CMS), “Medicaid Managed Care Regulations with July 1, 2017 Compliance Dates,” last updated June 30, 2017, https://www.medicaid.gov/federal-policy-guidance/downloads/cib063017.pdf. ↩︎
  7. Center for Medicare and Medicaid (CMS), “Medicaid Managed Care Frequently Asked Questions (FAQs) – Medical Loss Ratio,” June 5, 2020, https://www.medicaid.gov/sites/default/files/Federal-Policy-Guidance/Downloads/cib060520_new.pdf. ↩︎
  8. 42 CFR § 438.8(c). ↩︎
  9. Georgia House Bill 1013, signed into law by Governor Kemp on April 4, 2022, establishes an MLR remittance requirement for MCOs effective for contract rating periods beginning on and after July 1, 2023. According to a 2021 Report by the HHS Office of Inspector General, Georgia did not have a state minimum MLR or remittance requirement in place as of September 2020. Further, rate certification reports reviewed for FY 2022 indicate that no MLR requirements were in place for FY 2022. (See:  Medicaid Rates for the Georgia Families and the Planning for Healthy Babies Program, July 1, 2021─June 30, 2022 Contract Period, Guidehouse for the State of Georgia Department of Community Health, April 1, 2021, and Medicaid Rates for the Georgia Families 360° Program, July 1, 2021─June 30, 2022 Contract Period, Guidehouse for the State of Georgia Department of Community Health, April 1, 2021, accessed at HMA Information Services.) ↩︎
  10. Center for Medicare and Medicaid (CMS), “Medicaid Managed Care Options in Responding to COVID-19,” May 14, 2020, https://www.medicaid.gov/sites/default/files/Federal-Policy-Guidance/Downloads/cib051420.pdf. ↩︎
  11. CMS, COVID-19 Frequently Asked Questions (FAQs) for State Medicaid and Children’s Health Insurance Program (CHIP) Agencies (last updated June 30, 2020), https://www.medicaid.gov/state-resource-center/downloads/covid-19-faqs.pdf (pgs. 83-84 V.C.6). ↩︎
  12. During the rating period, states may increase or decrease rates by a “de minimis amount” per rate cell. Federal regulations define the de minimis amount as 1.5% per rate cell (§438.7(c)(3)). If, however, the state initially elects to certify a rate range for a rate cell, the state is not permitted to use this de minimis change authority but may increase or decrease a capitation rate within a rate range by up to 1% during the rating period without submission of a new rate certification as long as the resulting rate does not fall outside of the 5 percent range limit allow by federal regulations (42 CFR §438.4(c)(2)(iii)). ↩︎
  13. John Gallina, Executive Vice President and Chief Financial Officer of Elevance Health Inc., stated: “We’ve been working very closely with our state partners on Medicaid and feel very good about the rating actions.” ↩︎
  14. Tim Spilker, CEO of UnitedHealthcare Community and State, indicated that states had taken redeterminations into account when setting rates for 2023 and further noted: “[R]evenue is in line with our expectations and consistent with the outlook that we shared in November. So, we’re appreciative of the balanced rational view that our states have taken as they’ve looked ahead, knowing that we’ve got many factors coming forward.” ↩︎
  15. Centene Corporation 4th Quarter 2022 Earnings Call Transcript, February 7, 2023. ↩︎

Q & A: Implications of Two Conflicting Federal Court Rulings on the Availability of Medication Abortion and the FDA’s Authority to Regulate Drugs

Published: Apr 8, 2023

On June 13, 2024, the Supreme Court of the United States ruled in Alliance for Hippocratic Medicine (AHM) v. FDA that the AHM does not have standing to sue the FDA for injury. However, three state Attorneys’ Generals have intervened in this case in district court, and it is unclear how this action will shape the case when it goes back to the 5th Circuit Court of Appeals and then back to the originating federal district court.

On April 7, 2023, two conflicting rulings on the provision of mifepristone, the drug used for medication abortion, were issued by two separate federal court judges, one in Texas and one in Washington State. Judge Mathew Kacsmaryk, the judge in the US District Court for the Northern District of Texas Amarillo Division, issued a preliminary injunction in the case, Alliance for Hippocratic Medicine v. FDA, blocking the FDA’s approval of mifepristone dating back to 2000. The judge has stayed his decision for seven days to give the FDA time to appeal, but the ruling effectively impacts the entire nation and would effectively revoke the FDA approval granted to mifepristone in 2000.

On the same afternoon, Judge Thomas O. Rice from the United States District Court in the Eastern District of Washington ruled in a case that was filed by the Oregon and Washington Attorneys General joined by 16 other Attorneys General. The AGs are challenging the FDA’s decision to impose restrictions on prescribing and dispensing mifepristone through the Risk Evaluation and Mitigation System (REMS), claiming the restrictions on the dispensing of the drug imposed by the FDA are unnecessary and limit its availability. This ruling orders the FDA to maintain the current availability of mifepristone in the 17 states and DC, the plaintiffs in this case.

As a result, the FDA has conflicting orders: to suspend its approval mifepristone on one hand and not to alter its approval effective January 2023, on the other. Because these two federal court rulings conflict, the Supreme Court could be called upon to resolve this conflict and decide the merits of both cases. This Q&A summarizes some of the key issues related to these rulings.

Who are the plaintiffs that are suing to block medication abortion?

The plaintiffs in the Texas case, Alliance for Hippocratic Medicine (a newly formed anti-abortion advocacy coalition); the American Association of Pro-Life Obstetricians and Gynecologists; the American College of Pediatricians; and the Christian Medical and Dental Associations, as well as three individual doctors challenged the FDA’s approval of mifepristone, one of the drugs used in medication abortion. The plaintiffs are challenging the FDA’s approval process and subsequent modifications of the conditions for dispensing mifepristone (known as REMS) as being beyond the FDA’s authority. The plaintiffs also contend that an 1873 anti-obscenity law, the Comstock Act, prohibits the mailing of any medication used for abortion (for details on the case see: Legal Challenges to the FDA Approval of Medication Abortion Pills). The Judge’s ruling in this case directs the FDA to suspend its approval of the mifepristone while the litigation continues, but gives the FDA seven days to appeal the case to the 5th Circuit before the order takes effect. This ruling would block the sale and distribution of mifepristone in the entire country, and would also block access to the drug in states where abortion is legal and protected.

What is the lawsuit filed by Democratic State Attorneys General?

The Oregon and Washington Attorneys General joined by 16 other Attorneys General are also challenging the FDA’s decision-making about mifepristone, but rather than challenging the FDA approval process, the plaintiffs are calling into question the FDA’s decision to impose restrictions on prescribing and dispensing mifepristone through the Risk Evaluation and Mitigation System (REMS). As of January 3, 2023, mifepristone can only be prescribed by a certified provider and the drug can only be provided by a certified pharmacy or clinician. The judge in this case has issued a preliminary injunction blocking the FDA from changing any rules that would impact the availability of mifepristone in states bringing the lawsuit (WA, OR, CO, CT, IL, NV, AZ, RI, OR, DE, MI, NM, VT, HA, MD, ME, MN, PA, and DC).

What is medication abortion?

The most common medication abortion regimen in the United States involves the use of two different medications: mifepristone and misoprostol, which are FDA approved. Mifepristone, also known as the abortion pill, or RU-486 is sold under the brand name Mifeprex and through a generic manufactured by GenBioPro in the United States. The FDA has found that medication abortion is a safe and highly effective method of pregnancy termination. When taken up to 70 days of pregnancy, the medication abortion regimen successfully terminates the pregnancy 99.6% of the time, with a 0.4% risk of major complications, and an associated mortality rate of less than 0.001 percent (0.00064%). Mifepristone was first approved by the FDA in 2000, and by 2021, over half of abortions in the US were medication abortions. Despite being available for medication abortion for over two decades, there is still considerable confusion about the drug in this country. A KFF poll conducted in January 2023 found that about half of the public was unsure as to whether medication abortion is legal in their state, including four in ten (41%) women ages 18 to 49 and half of women living in states where abortion is legal.

A little-known fact is that mifepristone, under the brand name Korlym, was also FDA-approved in 2012 without any REMS to manage blood sugar levels (hyperglycemia) in adults with endogenous Cushing’s syndrome. Korlym is a higher dose of mifepristone than Mifeprex and is taken daily.

There is also a different medication abortion protocol using misoprostol alone that is more commonly used internationally. Misoprostol is frequently used in obstetrics and gynecology for procedures like the medical management of miscarriage, induction of labor, cervical ripening before surgical procedures, and the treatment of postpartum hemorrhage. While misoprostol is FDA approved for many medical uses, it has not been FDA approved for abortions, meaning it is used “off label” for this purpose in the US. The regimen is also recommended for up to 70 days (10 weeks) of pregnancy. Research has shown the misoprostol-only regimen to be a safe and highly effective method of pregnancy termination, however it may result in a higher incidence of side effects. Some U.S. telehealth organizations have been providing the misoprostol-only regimen as an option for medication abortion for several years.

Will medication abortion continue to be available?

It is too soon to tell what the impact will be on the availability of medication abortion. It’s not known how the FDA will act in response to the two conflicting rulings. The FDA approves drugs for the whole country and does not vary its approval by state. If the FDA is forced to suspend its approval of mifepristone, some clinics may respond to this ruling by switching from the mifepristone/misoprostol regimen to using a higher dose of misoprostol alone.

What is the next step in the litigation?

Hours after Judge Kacsmaryk’s ruling, the FDA filed a notice of appeal to the US Court of Appeals for the 5th Circuit and Attorney General Merrick Garland said the government would request a stay to block this ruling while the appeal is considered. If the 5th Circuit does not grant this request, the FDA is likely to appeal immediately to the Supreme Court of the United States to block the ruling during the appeal process. If the case is appealed but the courts do not provide a stay, then the distribution of mifepristone could be halted across the nation pending the final outcome of the case.

The FDA may not appeal Judge Rice’s decision as it directs the FDA to keep the status quo. The Attorneys General who brought the case may appeal the decision to the 9th Circuit to seek an injunction to block the enforcement of the REMS approved in January 2023.

As both of these cases involve the FDA approval and provision of mifepristone, it is likely that if they reach the Supreme Court, it will review the cases together.

Are there other lawsuits that involve mifepristone?

Some are questioning how the new state authority to regulate or ban abortion intersects with the Federal FDA’s authority to regulate drugs. There are currently two cases in federal court challenging state abortion prohibitions and restrictions on federal preemption grounds. The maker of a generic mifepristone medication, GenBioPro, Inc., is challenging West Virginia’s total abortion ban, and an ob-gyn, Dr. Amy Bryant, is challenging the abortion restrictions in North Carolina, which include requirements that mifepristone be dispensed in person by a physician following a state-mandated counseling session and a 72-hour waiting period. In both cases, plaintiffs argue that the FDA’s authorization and regulation of mifepristone preempt state law banning the use of the medication or regulating its use more strictly, and given this, enforcement of the state laws should be blocked. If these lawsuits are successful, people living in states where abortion is banned could access medication abortion.

What impact do these rulings have on the FDA’s approval of other drugs?

These rulings will likely have implications far beyond abortion, though it is still too soon to tell. Court challenges such as these could open the door for other actors to potentially sue to block the approval of existing or new drugs that may be considered controversial, such as vaccines or treatments for conditions that are at the crosshairs of so-called “culture wars.” Manufacturers may be reluctant to bring to market certain new drugs or treatments if they are concerned that a court ruling could block their approval in the future.

Medicaid and CHIP Eligibility, Enrollment, and Renewal Policies as States Prepare for the Unwinding of the Pandemic-Era Continuous Enrollment Provision

Authors: Tricia Brooks, Allexa Gardner, Peyton Yee, Jennifer Tolbert, Bradley Corallo, Sophia Moreno, and Meghana Ammula
Published: Apr 4, 2023

Executive Summary

Note: This report, originally published on March 16, 2023 and updated on April 4, 2023, presents policies and procedures that were in place as of January 1, 2023. However, state policies are evolving and the information here may not reflect current state policy. Some states have provided updated information and those responses are captured in data posted here.

In the third year of the COVID-19 public health emergency (PHE), Medicaid enrollment continued to increase albeit at a slower pace than in the first two years of the coronavirus pandemic. Since March 2020, states have provided continuous enrollment in Medicaid in exchange for enhanced federal funding. This continuous enrollment provision and enhanced federal funding were originally in place until the end of the COVID-19 public health emergency (PHE). In December 2022, the Consolidated Appropriations Act, 2023 (CAA) delinked the provision from the PHE and ends continuous enrollment on March 31, 2023. Beginning April 1, 2023, states may restart disenrollments after conducting a full review of eligibility. States that follow all federal Medicaid renewal requirements, take steps to update enrollee contact information, and attempt to reach enrollees via non-mail modes before terminating coverage for returned mail will qualify for ongoing enhanced federal funding that phases down until the end of 2023. States must also report to the federal government specific data needed to monitor the impact of the unwinding or risk financial penalties for not doing so.

As states begin to “unwind” the continuous enrollment provision, many people will likely be found to be no longer eligible for Medicaid. Others could face administrative barriers and lose coverage despite remaining eligible. Existing state enrollment and renewal procedures, as well as state approaches to the unwinding of the continuous enrollment provision, will have major implications for Medicaid enrollment and broader coverage. Some states are prioritizing maintaining coverage by implementing the unwinding more slowly and taking steps to make it easier for people to renew coverage, while others are emphasizing a quicker end to continuous enrollment that reduces budgetary costs.

The 21st annual survey of state Medicaid and CHIP program officials conducted by KFF and the Georgetown University Center for Children and Families in January 2023 presents a snapshot of actions states are taking to prepare for the lifting of the continuous enrollment provision, as well as key state Medicaid eligibility, enrollment, and renewal policies and procedures in place as of January 2023. The report focuses on policies for children, pregnant individuals, parents, and other non-elderly adults whose eligibility is based on Modified Adjusted Gross Income (MAGI) financial eligibility rules. All states and the District of Columbia responded to the survey, although response rates for specific questions varied.

State Policies and Actions Can Promote Continuity of Coverage During the Unwinding Period

Leading up to the end of the Medicaid continuous enrollment provision, CMS has issued guidance and granted states certain flexibilities designed to promote continued coverage during the unwinding period. We have identified ten key policies and actions that could affect continued enrollment in Medicaid. These policies include taking 12-14 months to complete renewals following the end of the continuous enrollment; taking steps to increase the share of ex parte renewals and completing more than 50% of renewals using ex parte processes; following up with enrollees when action is needed to complete a renewal, attempting to contact enrollees when mail is returned; and publishing comprehensive unwinding data on the state’s website. In addition, states have other policy levers, such as adopting the Medicaid expansion, extending 12-months postpartum coverage, and providing 12-months continuous eligibility for children that can also increase the number of people who will be able to retain coverage. State adoption of these policies varies. In states that are planning to move more quickly to complete renewals, have lower ex parte renewal rates, do not follow up with enrollees who have not responded to a renewal request, are less transparent with unwinding data, and have not adopted the Medicaid expansion or 12-month postpartum coverage or continuous eligibility for children, the risk of coverage loss during the unwinding period is higher, though budgetary costs from continued enrollment will likely be lower.

Plans and Preparations for the End of the Continuous Enrollment Provision

Most states are waiting until March or April to initiate their “unwinding” plans and plan to spread renewals over 12 to 14 months. States may start the unwinding process by initiating the first batch of renewals in February although they may not disenroll anyone before April 1. However, more than half of the states (28) are waiting until April to begin the process with 15 states starting in March and eight in February. Most states (43 of 49 reporting states) plan to take 12-14 months to complete the unwinding process and return to routine operations. Taking more time to initiate and complete the unwinding process can help to avoid overwhelming staff resources and prevent inappropriate terminations but could maintain enrollment for potentially ineligible people for longer.

More than two-thirds of the states (35 of 49 reporting states) are adopting an approach to prioritizing renewals that considers multiple factors, including time since last renewal and potential ineligibility. The approach a state chooses will determine how renewals are sequenced for various groups or cohorts. Using a hybrid or state-determined approach gives states greater flexibility to target potentially ineligible enrollees early in the process while delaying action on vulnerable groups or enrollees whose eligibility is unlikely to change. Fewer states (12) are adopting a time-based approach, which generally schedules renewals based on application or last renewal date. Only two states are taking a population-based approach that processes renewals by eligibility groups or cohorts.

A majority of states (43) have continued to process ex parte renewals over the past year. States are required to first try and complete renewals through ex parte processes by using reliable data sources to verify ongoing eligibility. Ex parte renewals reduce administrative burden on both states and enrollees and can lower the number of disenrollments that occur because an enrollee is unable to complete the renewal process. Among states that are continuing to process renewals, 32 states have also continued to send prepopulated renewal forms when the enrollee’s eligibility cannot be confirmed via ex parte.

Over half of the states (30) have taken steps to increase the share of renewals completed via ex parte. Achieving a high share of system- and data-driven renewals increases administrative efficiency, allowing eligibility and call center workers to concentrate on complex cases. However, it may require investments in systems upgrades that can be costly for states, even with enhanced federal funding available. Actions taken to increase ex parte rates include enhancing system programming rules and expanding data sources. Of the 38 states reporting ex parte rates, 18 states are successfully processing more than half of renewals using ex parte processes, up from 11 states in 2022.

About half of the states (27) have been flagging individuals who may no longer be eligible or who did not respond to renewal requests, including six states that are conducting data matches to identify these individuals. States that have continued processing renewals have been able to flag individuals who they have confirmed are no longer eligible or appear to no longer be eligible, although not all states have done so. However, only a small number of states indicated that they plan to prioritize renewals for “flagged” enrollees early in the process.

Among the just over one-third of states able to report, they estimate that about 18% of Medicaid enrollees will be disenrolled when the continuous enrollment provision ends. However, the estimates range widely across reporting states from about 7% to 33% of total enrollees. This estimated average disenrollment rate is slightly higher than the 13% reported by states in 2022, although it is consistent with other estimates indicating about 15-18 million people may lose Medicaid coverage over the coming year.

The unprecedented volume of work ahead comes at a time when most states face significant staffing challenges. More than half of reporting states have staff vacancy rates greater than 10% for frontline eligibility workers (16 of 26 reporting states) and slightly less than half for call center staff (13 of 28 reporting states). States are adopting multiple strategies to address eligibility staffing shortages, including approving overtime and hiring new staff, temporary workers, or contractors. It is less clear what actions are being taken to boost capacity in the nine states that rely on counties to conduct renewals, although several states noted that they are providing additional resources to counties to boost staff capacity.

All states have taken action to encourage enrollees to update their contact information with most states taking a multi-pronged approach. Having updated enrollee contact information will increase the likelihood that enrollees receive important renewal and other notices during the unwinding period. State actions include conducting comprehensive outreach and communications campaigns, including using social media (48 states); checking data from other assistance programs (34 states); working with MCOs (34 states); and using the USPS National Change of Address database (NCOA) (25 states). Thirteen states have created simple online change of address forms and 12 states have a dedicated phone number or option within the interactive voice response system to report changes. States must continue to take steps to update contact information and make a good faith effort to contact an individual before terminating coverage for returned mail to qualify for the enhanced federal funding available until the end of 2023.

Over two thirds of states (37) plan to follow-up with enrollees when action is required to maintain coverage. Reminders to return renewal forms and submit requested information will increase renewal response rates, reduce the number of procedural (non-eligibility related) disenrollments, and increase the share of account transfers to the Affordable Care Act (ACA) Marketplace for individuals who are no longer eligible. Most states (33) plan to follow-up by mail; 19 states will use individual phone calls, automated phone calls, or both; 24 states will follow-up through text messages and 19 states plan to use email.

A majority of states (41) are engaging managed care organizations (MCOs) to conduct outreach and assist members. With a majority of Medicaid enrollees in managed care, MCOs have an interest in retaining members and have resources to supplement the state’s capacity to update contact information, amplify state communications, and assist enrollees with renewals or transitions to other coverage. States are providing MCOs with advance lists of members up for renewal (33 states); advance lists of members who may be disenrolled because they have not responded to requests for information (26 states); and lists of members who have been disenrolled noting whether they were determined ineligible or disenrolled for procedural reasons (25 states). Also, the Centers for Medicare and Medicaid Services (CMS) has approved temporary waivers for 31 states to accept updated contact information verified by the MCOs without repeat verification by the state.

Most states collect the required unwinding monitoring data but less than half of the states (24) have committed to posting the data on their websites. An additional 21 states indicate a decision to post data has not yet been made. The data will aid in promoting transparency and accountability during the unwinding process. The CAA requires states to report specific unwinding data, as well as other data required by CMS, and failure to do so could result in financial penalties. While CMS is required to post state-level data, the timeliness of nationally reported data may be insufficient for rapid response. Posting more quickly at the state level could identify early problems, particularly if enrollees are losing coverage inappropriately.

Systems and Enrollment Policies

States continued to make incremental improvements to systems and enrollment policies as they prepare for the unwinding. Nearly all states allow enrollees to create online accounts and states have added features to their online accounts, including allowing enrollees to renew their coverage through their online account. Two-thirds of states (37) have integrated non-MAGI into the Medicaid systems, and over half of states use the Medicaid system for SNAP and TANF. All states have taken some steps to align renewal policies for non-MAGI and MAGI groups. Over half of the states (29) now have online portals that allow community partners and assisters to submit applications and assist applicants and enrollees with enrollment and renewal.

Eligibility Policies

South Dakota became the seventh state to approve a ballot initiative to adopt the Medicaid expansion, which will be implemented in July 2023. Legislators in North Carolina announced an agreement to move ahead with expansion that will be voted on later this year. Many low-income parents in the remaining non-expansion states who lose coverage during the pandemic will find themselves in the coverage gap without options to obtain affordable coverage. Most non-expansion states base eligibility for parents and caretakers on a dollar threshold, which is not routinely adjusted. As a result, the median eligibility for parents in non-expansion states, converted to an FPL equivalent level, declined from 39% FPL in 2022 to 37% FPL in 2023. In Medicaid expansion states, eligibility is extended up to 138% FPL for all adults, irrespective of family status.

States have taken action to improve maternal and immigrant coverage in Medicaid during the pandemic. More than two-thirds of states (37) have now extended or plan to extend postpartum coverage for a full 12-months post pregnancy. Kentucky and Oklahoma increased income eligibility levels for pregnancy coverage. Kentucky also removed the five-year bar for pregnancy coverage of lawfully-residing immigrants in Medicaid and CHIP. Connecticut and Maine adopted the CHIP unborn child option, effectively providing pregnancy coverage regardless of immigration status. Connecticut, Maine, New Jersey, Rhode Island, and Vermont are now using state funds to cover children regardless of immigration status while Illinois, Oregon and Vermont are also using state funds to newly cover some adults who are not eligible for Medicaid due to immigration status.

Nearly two-thirds (33) of states provide 12-month continuous eligibility to children in Medicaid and/or CHIP, while several states are moving toward multi-year continuous eligibility. Of these 33 states, 26 provide continuous eligibility in both Medicaid and CHIP to some or all children while seven states provide it in CHIP only. All states will be required to adopt 12-month continuous eligibility for children by January 2024. Additionally, several states are working to cover children for longer periods. Oregon became the first state to receive approval to cover children continuously until their sixth birthday; three other states, California, New Mexico, and Washington, have similar plans. Oregon also received approval to provide two-year continuous coverage for all other ages, a policy that Illinois is planning to adopt.

Looking Ahead

States are moving from planning for the end of the continuous enrollment provision to implementation of their unwinding plans, but the impact of the unwinding will vary by state. How the unwinding impacts Medicaid enrollees and state budgets will vary significantly from state to state depending on each state’s systems capabilities, including ex parte renewal rates; communications strategies; staff capacity; and adoption of operational policies that make it easier for people to stay enrolled.

It is likely that the uninsured rate will increase as states resume Medicaid disenrollments. Most people who are disenrolled from Medicaid because they are no longer eligible should have a path to other coverage options through the Marketplaces or an employer, but knowledge of how and where to apply as well as affordability concerns may remain a barrier for some. Research indicates that 65% of people disenrolled from Medicaid experience a period of uninsurance in the year following disenrollment. At the same time, disenrollments for procedural reasons among people who remain eligible are expected to be high. Boosting staff resources and consumer assistance capacity, actively monitoring the unwinding to identify issues, and rapidly responding to systemic or recurring problems can help avoid disenrollments that lead to coverage losses.

CMS is working to finalize rule changes to streamline eligibility and enrollment, promote access and improve quality, while at the same time, Congress may debate eligibility restrictions and cuts to Medicaid and other assistance programs. The Department of Health and Human Services (HHS) Regulatory agenda calls for finalizing changes relating to eligibility and enrollment, access and managed care, mandatory reporting of the child core set of healthcare quality measures, and anti-discrimination. In connection with the need to raise the government’s debt ceiling, interest in putting restrictions on Medicaid enrollment, such as work requirements, have resurfaced in Congress, along with strategies to slow the growth in Medicaid spending that largely shift increasing costs on the states by putting constraints on federal funding through per capital caps or block grants. How serious this debate is remains to be seen.

Report

Introduction

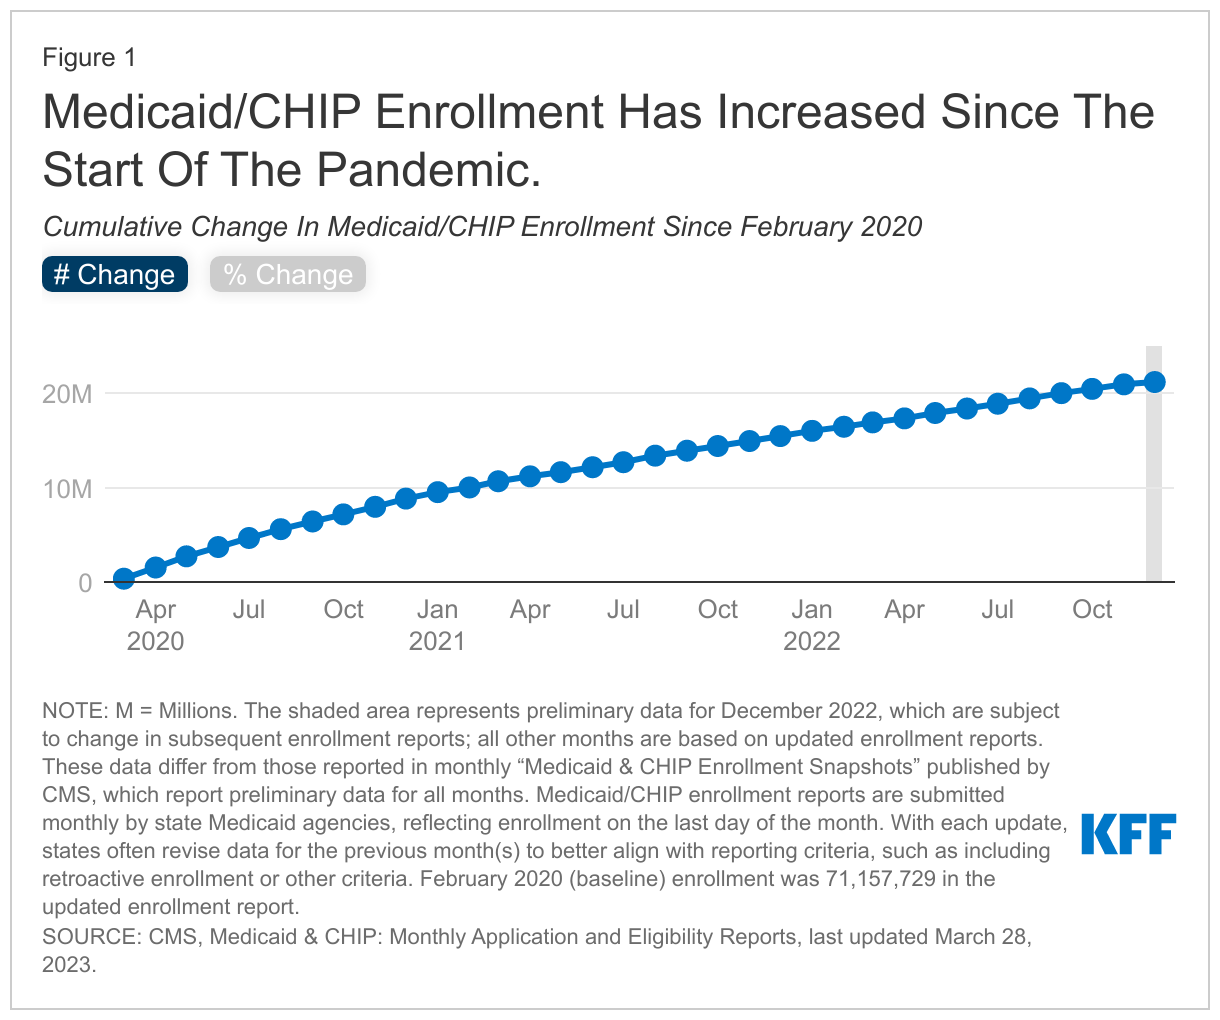
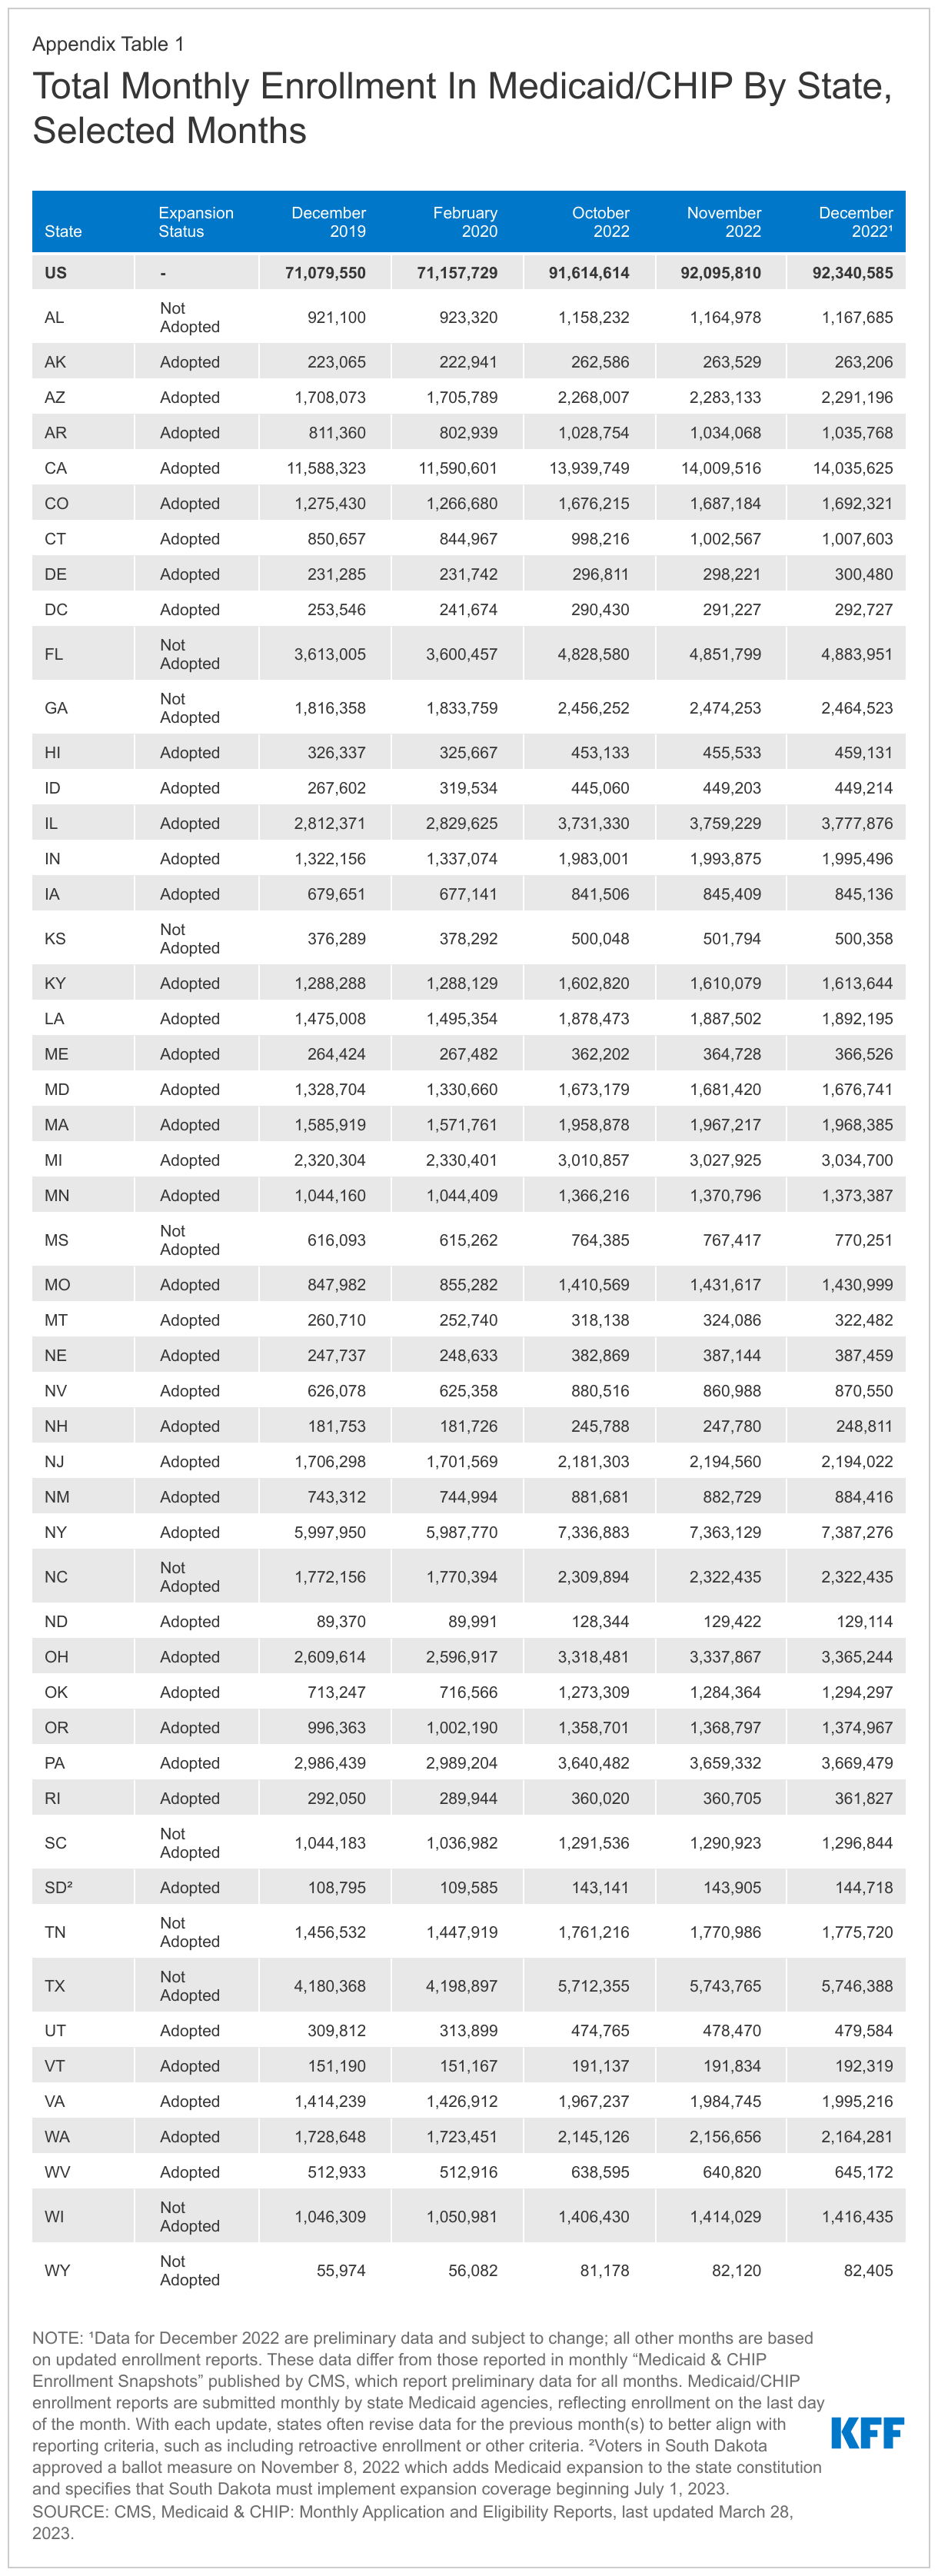
Throughout 2022, the coronavirus public health emergency continued to have significant impacts on states. Since its emergence in early 2020, the coronavirus’ dual economic and public health crises continued to expose significant disparities in the public health infrastructure and further highlighted the importance of health coverage. Provisions in the Families First Coronavirus Response Act (FFCRA) and the Coronavirus Aid, Relief and Economic Security Act (CARES), required states to maintain eligibility and enrollment standards and provide continuous enrollment in Medicaid until the end of the public health emergency (PHE) to qualify for a 6.2 percentage point increase in Federal Medical Assistance Percentage (FMAP). During this time, states also adopted temporary changes in their state Medicaid plans through disaster-related authorities and temporary waivers to streamline processes and connect individuals to coverage more quickly, such as by expanding the use of presumptive eligibility, waiving premiums and cost-sharing, and allowing self-attestation of certain eligibility criteria. Largely due to the continuous enrollment provision, KFF estimates that Medicaid and CHIP enrollment will have grown by 23.3 million or over 30% by the time the continuous enrollment provision ends.

The Consolidated Appropriations Act (CAA), enacted in December 2022 delinked the continuous enrollment provision from the PHE, ending continuous enrollment on March 31, 2023. The CAA also phases down the enhanced FMAP through December 2023; states must meet certain maintenance of eligibility, data reporting, and other requirements to continue to qualify for the enhanced funding. CMS quickly released  additional guidance on January 5, 2023 and January 31, 2023 on changes enacted by the CAA), in addition to providing technical assistance to states throughout 2022.

In this context and just after the CAA passed, KFF and the Georgetown University Center for Children and Families (CCF) fielded the 21st annual survey of Medicaid and CHIP program officials in the 50 states and the District of Columbia (DC) in January 2023. In anticipation of the end of the continuous enrollment provision, this year’s survey focuses on actions states are taking to prepare. It also provides data on state Medicaid and CHIP eligibility levels and presents a snapshot of key aspects of state enrollment and renewal procedures in place as of January 2023. The report focuses on policies for children, pregnant individuals, parents, and other non-elderly adults whose eligibility is based on Modified Adjusted Gross Income (MAGI) financial eligibility rules; it reports only limited policies for groups eligible through Medicaid pathways for adults over the age of 65 or on the basis of disability. All states responded to the survey although response rates for specific questions varied. The District of Columbia is counted as a state for purposes of this report.(Back to top)

Preparing for the End of the Continuous Enrollment Provision

Unwinding Planning

Passage of the CAA in late 2022 started the countdown to the end of the Medicaid continuous enrollment provision as of March 31, 2023, prompting states to finalize their unwinding plans and shift toward implementation of those plans in the first quarter of 2023. States were expected to submit a State Renewal Report to CMS by February 15, outlining how they plan to distribute renewals over the unwinding period and describing the processes and strategies the state is considering or has adopted to avoid inappropriate coverage loss during the unwinding period. There is no requirement for states or CMS to publicly post these reports, but this survey reflects state responses to questions that are similar to information contained in the State Renewal Reports.

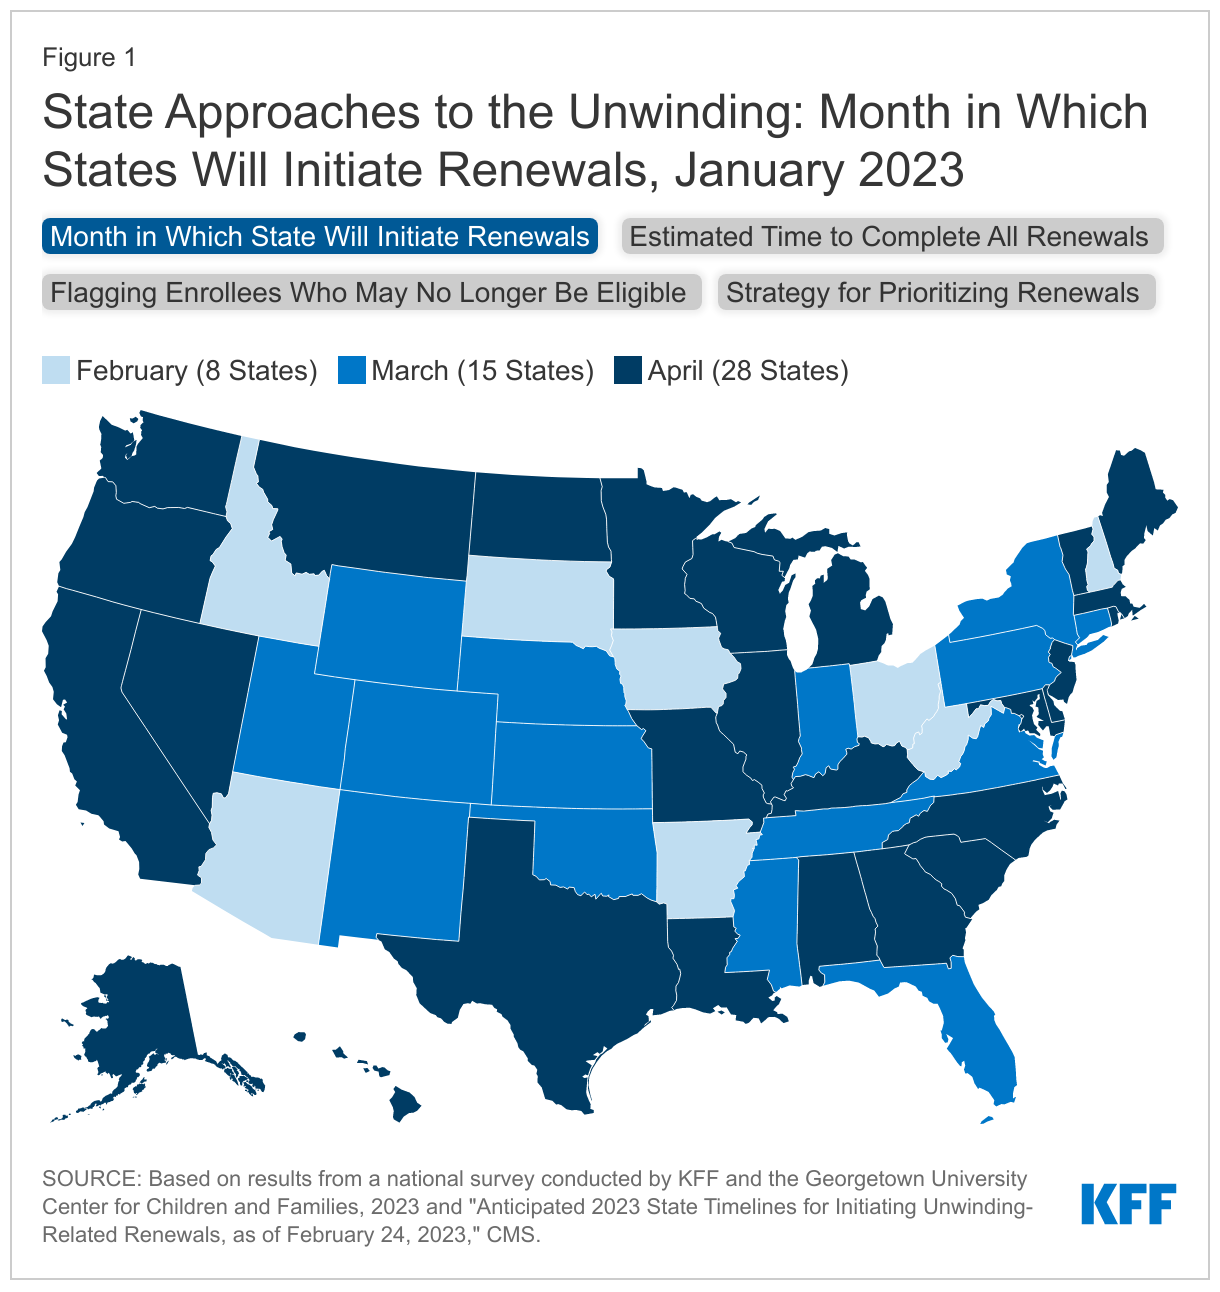
Over half of states are waiting until April to initiate their “unwinding” plans and most plan to spread renewals over 12 to 14 months. States may start the unwinding process (initiate the first batch of renewals) in February, March or April, but more than half of the states (28) are waiting until April to being the unwinding process, with 15 states starting in March and eight states in February (Figure 1). A majority of states (43) plan to take the full 12 to 14 months to complete the process and return to routine operations; five states plan to take 9 to 12 months, only one state plans to wrap up the process in less than 9 months, and two states did not report how long they plan to take. Spreading the work over a longer period will help states balance the unprecedented volume of work ahead with limited staff capacity, and more evenly distribute future renewals, but will also increase state spending as Medicaid enrollment remains higher for a longer period of time.

State Approaches to the Unwinding: Month in Which States Will Initiate Renewals, January 2023

Most states (35) are adopting an approach to prioritizing renewals that considers multiple factors, including time since last renewal and potential ineligibility. States are required to develop a plan for how they will prioritize renewals, taking into consideration the need to prevent inappropriate terminations and promote smooth transitions to other sources of coverage for people determined ineligible. Only two states are adopting a population-based approach that prioritizes cohorts of enrollees likely to be eligible for more expansive benefits or other coverage. Another 12 states are adopting a time-based approach using existing renewal dates, taking steps to distribute renewals evenly across the unwinding period, or processing renewals based on the length of time the renewal or change has been pending. But most states want more flexibility to mix and match approaches—16 states are taking a hybrid approach (a combination of population- and time-based approaches) and 19 states are using a state-determined approach (Figure 1). Several states will focus first on enrollees who have been flagged as potentially ineligible, followed by enrollees without a renewal in the past year. Some states are aligning Medicaid renewals with other programs, most often the Supplemental Nutritional Assistance Program (SNAP). Several states have also indicated they will take the health care needs of enrollees into account, prioritizing enrollees who are not utilizing health care services and deprioritizing individuals with more extensive health care needs.

About half of the states (27) have been flagging individuals who may no longer be eligible or who did not respond to renewal requests, including six states that are conducting data matches to identify these individuals (Figure 1). States that have continued processing renewals have been able to flag individuals who they have confirmed are no longer eligible or appear to no longer be eligible, although not all states have done so. However, only a small number of states indicated that they plan to prioritize renewals for “flagged” enrollees early in the process.

Staff Capacity

In over two-thirds of the states, the state is solely responsible for Medicaid eligibility determinations while a handful of states rely on counties to administer eligibility or share responsibility with the counties. Thirty-five states take full responsibility for processing Medicaid applications and 36 states process all Medicaid renewals. Eligibility determinations at application are delegated to the counties in 8 states and for renewals in 9 states. States and counties share responsibility for applications in 8 states and renewals in 6 states. In states that rely solely or partially on counties, Medicaid applicants and enrollees may have different experiences depending on where they live. Separate CHIP programs have more flexibility in using contractors to assist with eligibility determinations. In 23 of the 33 states with separate CHIP programs, the state is solely responsible for processing CHIP applications and renewals. Counties determine CHIP eligibility in one state for applications and three states for renewals. Two states use contactors for CHIP applications and renewals, and a few states use a combination of state, county, and contractor staff to determine eligibility for applications and renewals.

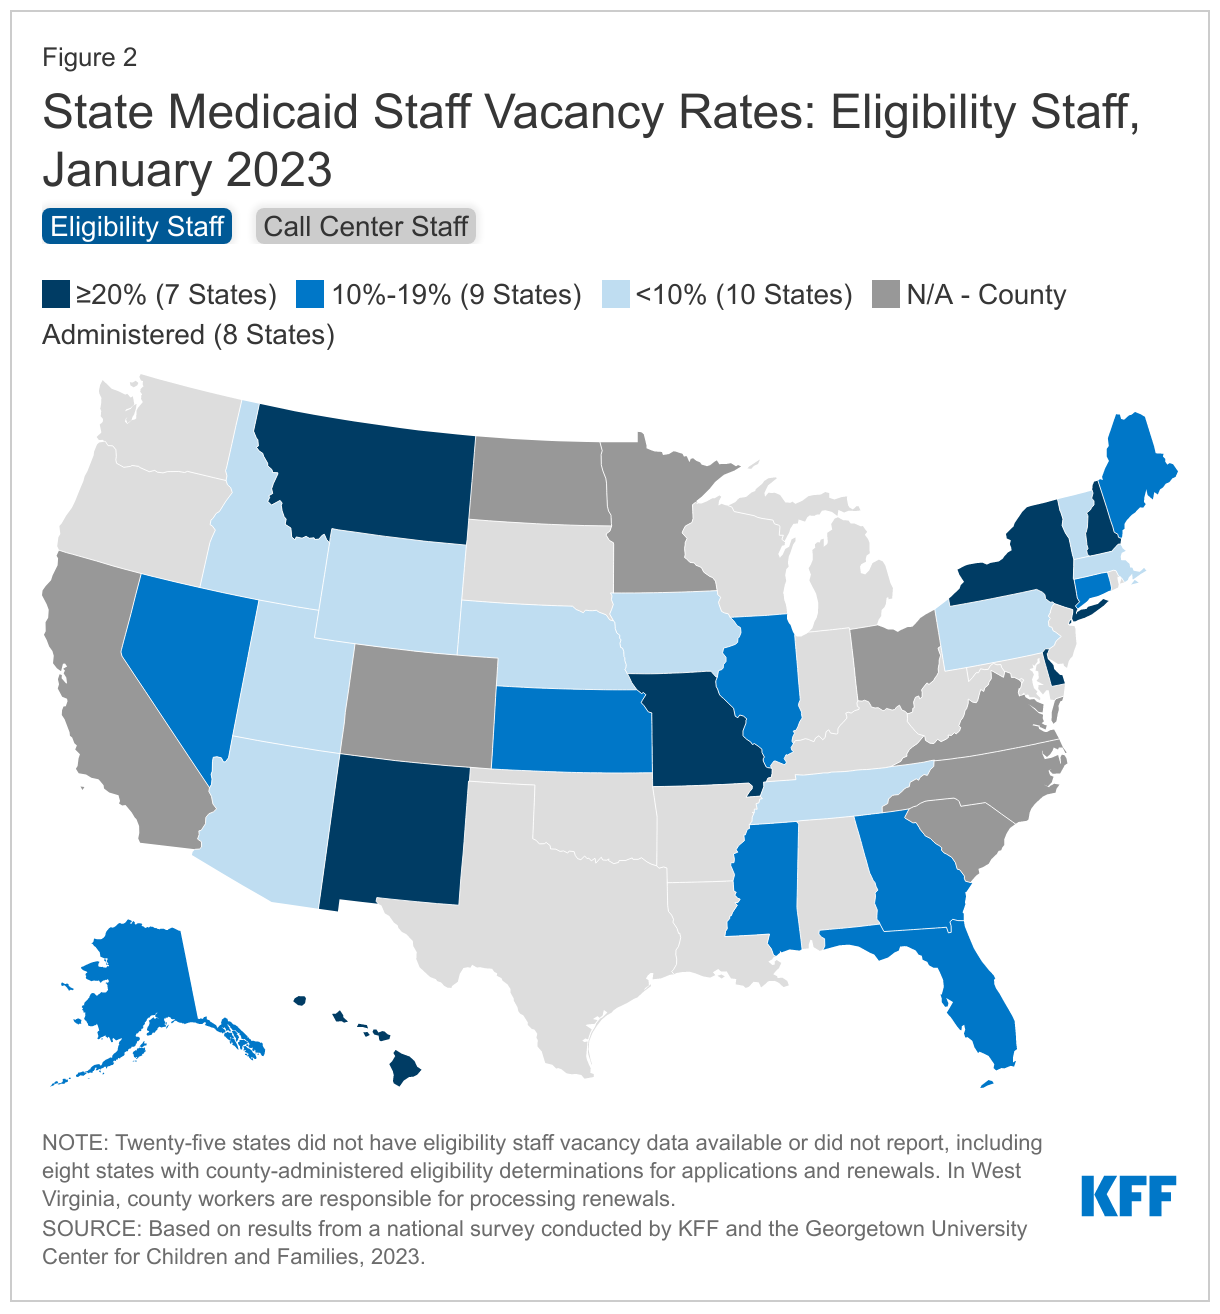
States face challenges in hiring critical eligibility and call center staff needed to process the unprecedented workload ahead. In 16 of 26 reporting states, eligibility worker vacancy rates exceed 10%, including seven states where more than 20% of eligibility positions are unfilled (Figure 2). In 13 of 28 reporting states, call center staff vacancy rates also exceed 10%, including five states where more than 20% of positions are unfilled. Some states report that call center contractors are responsible for staffing decisions. Several states also noted high turnover rates and time needed to train new workers as additional challenges.

State Medicaid Staff Vacancy Rates: Eligibility Staff, January 2023

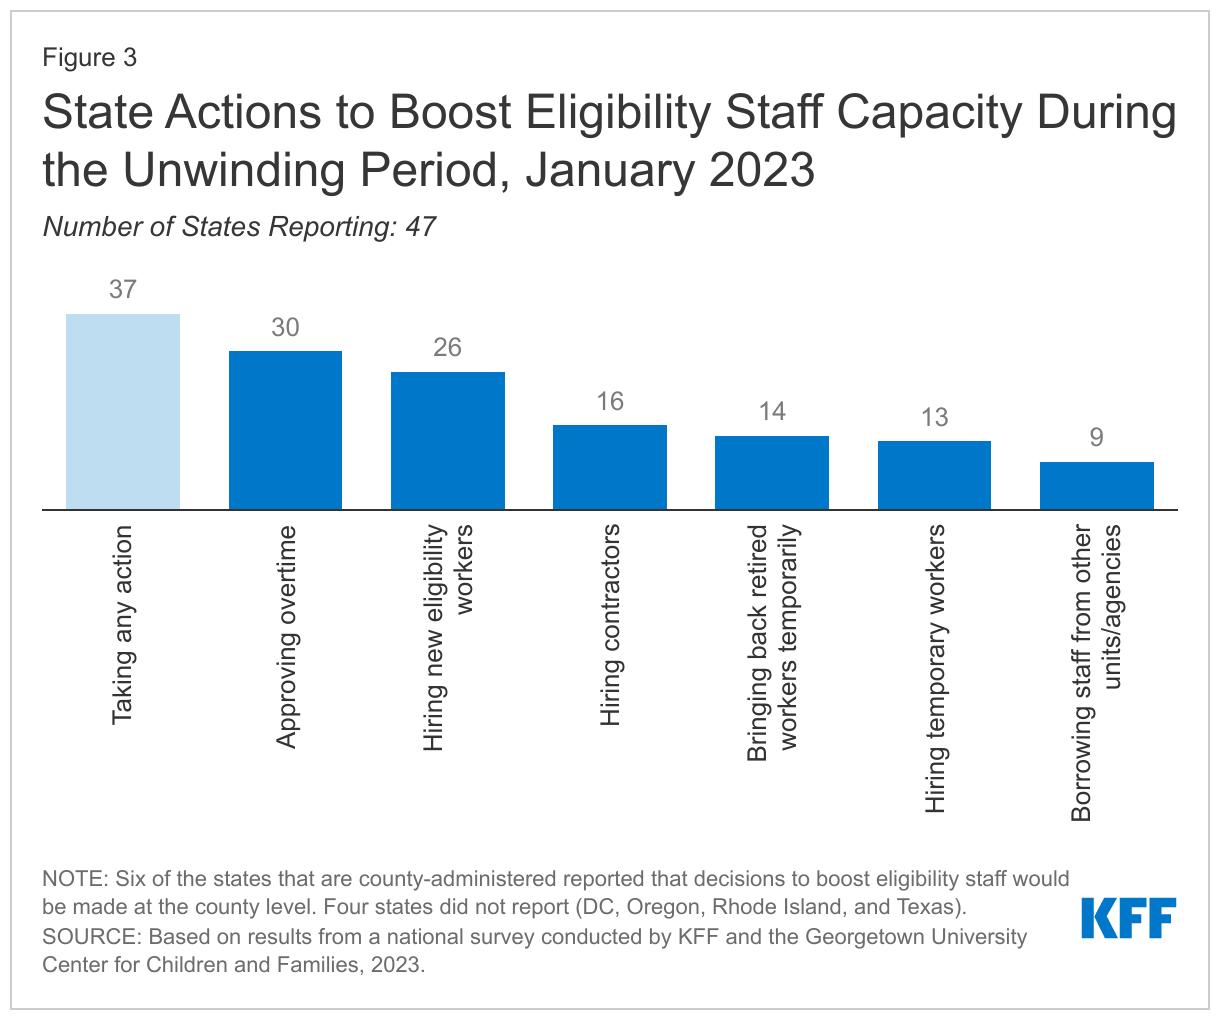
States are adopting multiple strategies to address eligibility staffing shortages, although it is less clear how counties that process eligibility are gearing up for the unwinding. State strategies include approving overtime (30 states) and hiring new staff (26 states), temporary workers (13 states), or contractors (16 states), and bringing back retirees (14 states, Figure 3). It is less clear what actions are being taken to boost capacity in the states that rely solely or partially on counties to conduct renewals, although several states noted that they are providing additional resources to counties to mitigate staff shortages.

State Actions to Boost Eligibility Staff Capacity During the Unwinding Period, January 2023

Updating Contact Information and Returned Mail

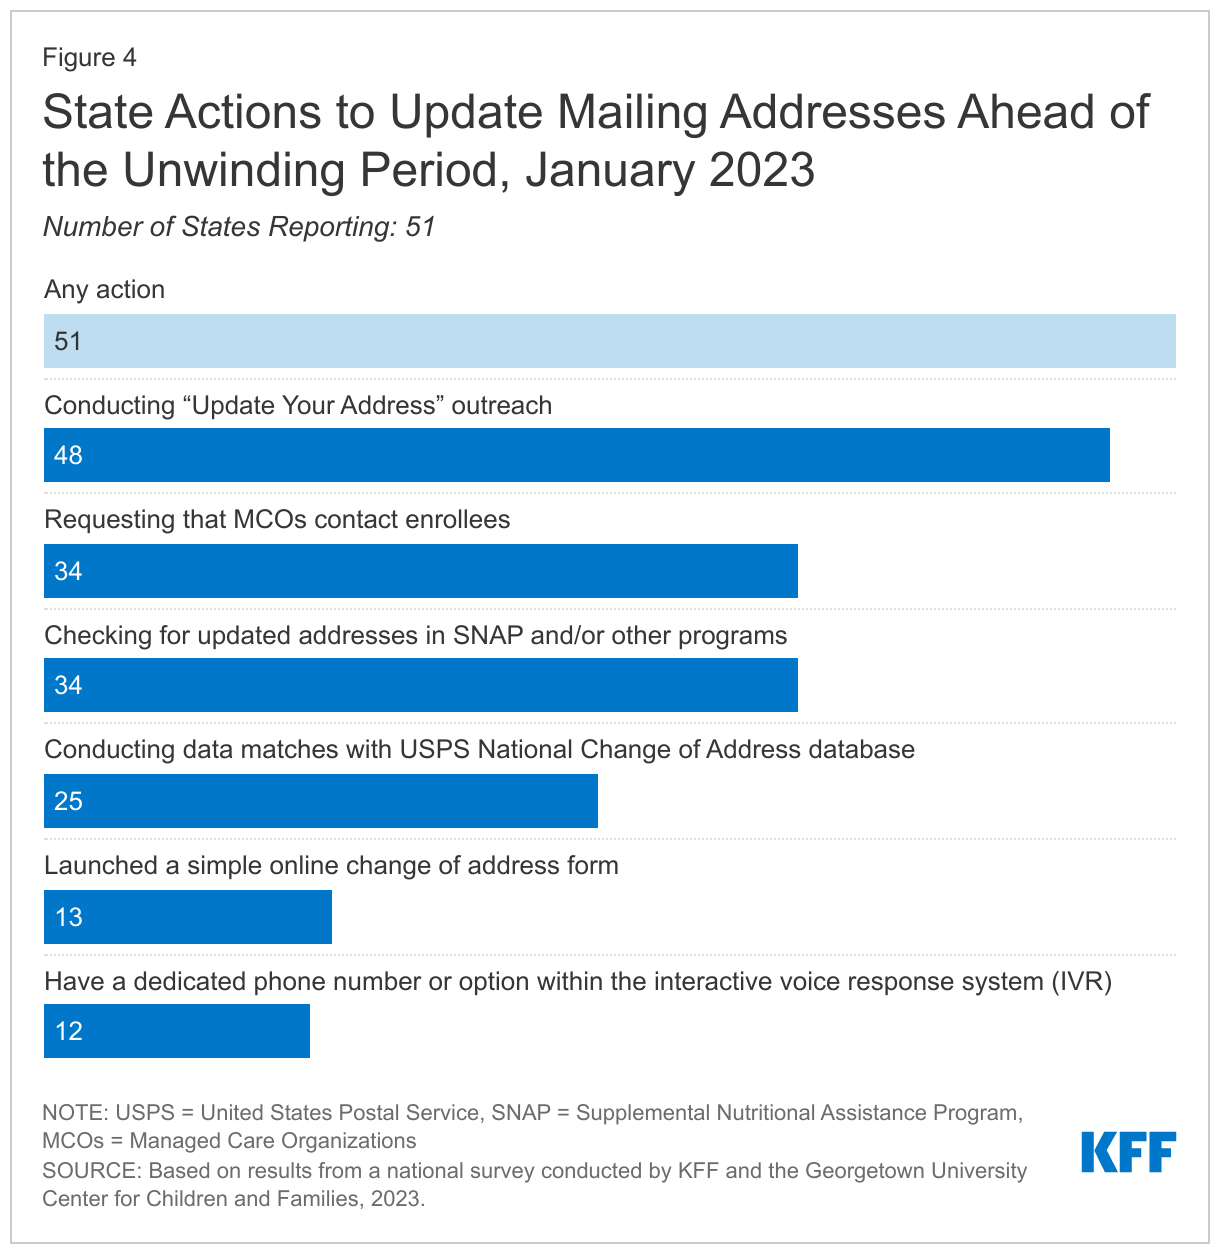
All states have taken steps to update enrollee contact information; two-thirds of states are using multiple strategies. Outdated contact information and returned mail have been longstanding problems in Medicaid and the impact of housing displacements during the three-year COVID-19 public health emergency has exacerbated difficulties in reaching enrollees by mail, the primary method states use to send renewals and requests for information. Ten states use a service or system, such as the USPS National Change of Address database (NCOA), to routinely update addresses for enrollees, but in anticipation of the unwinding states have been using a variety of tactics to update enrollee contact information. These include conducting data matches with the USPS NCOA (24 states); working with MCOs (34 states); checking for updated addresses in SNAP or other benefit programs (34 states); conducting “update your address” outreach campaigns (48 states); launching a simple online change of address form (13 states); and providing a dedicated a phone number or option within the interactive voice system for reporting updated information (12 states, Figure 4). To comply with the new CAA requirement, states must use recent and reliable information, or have recently attempted to obtain up-to-date contact information, before initiating a renewal.

State Actions to Update Mailing Addresses Ahead of the Unwinding Period, January 2023

Most states (40) attempt to contact enrollees when mail is returned; during the unwinding, all states are required to make a good faith attempt to contact an enrollee through at least two modalities prior to disenrolling when mail is returned. CMS has previously provided guidance to the states on dealing with returned mail, depending on whether mail is returned with an in-state, out-of-state, or no forwarding address. Of the 40 states taking action on returned mail through non-mail means, most states (33) follow up by telephone, 14 states use email, and 11 states use text to contact enrollees about the need to update their mailing address. The CAA requires states to make a good faith attempt to contact any enrollee through at least two modalities during the unwinding before disenrolling them based on returned mail. CMS guidance defines good faith attempt as 1) the state has a process in place to update mailing addresses and alternate contact information and 2) the state attempts to reach an individual whose mail is returned through at least two modalities using the state’s updated contact information, unless the state is unable to obtain any alternate contact information. States must also document their returned mail policies in their unwinding operational plan.

Other Unwinding Actions

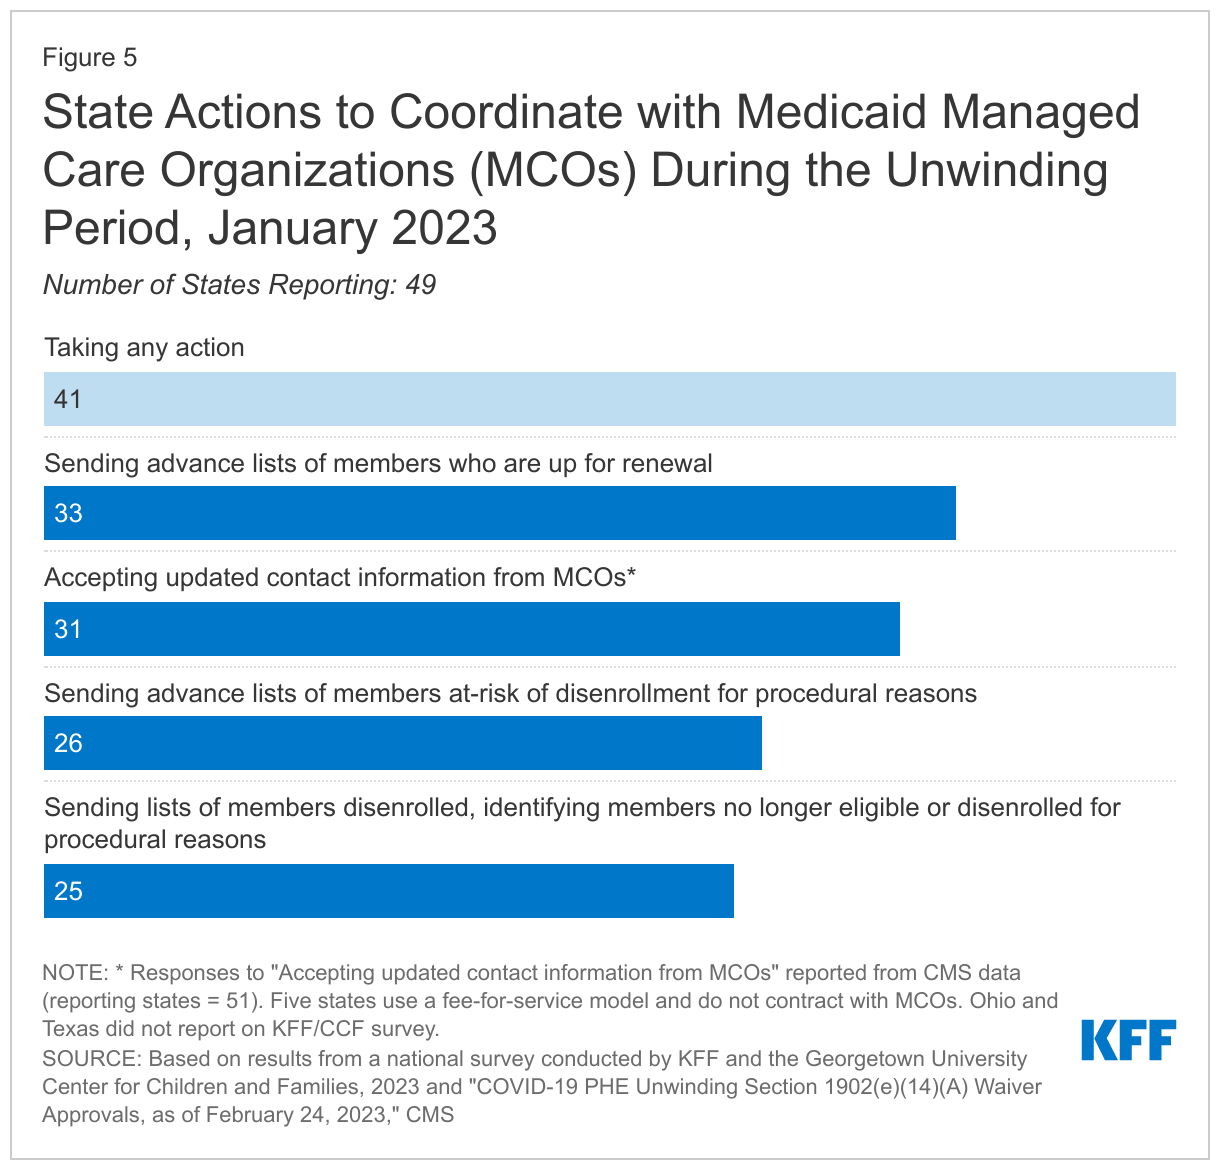
Most states (41) are engaging MCOs in conducting outreach and assisting members with renewals. A majority of Medicaid enrollees are covered through managed care arrangements, and MCOs have an interest in keeping eligible members enrolled. CMS has clarified how states may engage with MCOs, including providing states with temporary waiver authority to accept updated contact information from MCOs without re-verifying the information with enrollees; 31 states have received such approval (Figure 5). States are engaging MCOs in other ways, including by providing advance lists of members up for renewal (33 states), advance lists of members at risk for disenrollment because they have not responded to a renewal request (26 states), and lists of members who have been disenrolled noting if the member was determined ineligible or was disenrolled for procedural reasons (25 states).

State Actions to Coordinate with Medicaid Managed Care Organizations (MCOs) During the Unwinding Period, January 2023

Most states with state-based ACA marketplaces (SBM) are planning a variety of outreach, communications, and marketing strategies to smooth transitions from Medicaid to the Marketplace, but challenges remain in states without integrated Medicaid and Marketplace systems. Of the 18 SBM states with their own Marketplace systems, 16 states are planning specific outreach strategies aimed at ensuring a smooth transition between Medicaid and Marketplace coverage. Actions largely focus on deploying a variety of outreach, communications, and marketing strategies and using local partners to conduct outreach. In the eight SBM states that operate their own Marketplace system that is not integrated with Medicaid, account transfers are used to transition an individual from Medicaid to the Marketplace, much like the process in place for states that use the federal platform for eligibility and enrollment. In seven of those states (Colorado, DC, Maine, Nevada, New Jersey, New Mexico, and Pennsylvania), Medicaid will send a notice with information and instructions on how to apply for Marketplace coverage. Also, in seven states (Colorado, District of Columbia, Idaho, Maine, Nevada, New Jersey, and Pennsylvania) the SBM will call or send a /notice to enrollees that their information has been received by the Marketplace. In six states (District of Columbia, Maine, Nevada, New Jersey, New Mexico, and Pennsylvania), individuals may have to submit additional information or resubmit data already provided to Medicaid.

Monitoring the Unwinding and Estimating Coverage Impacts

States are required to report specific data needed to monitor the impact of the unwinding, and CMS is required to publish the state-level data. Having timely and reliable data from states on key metrics helps to monitor the unwinding process and assess if any state needs to take additional steps to avoid coverage losses among those who remain eligible. Unreasonable call wait times and high rates of disenrollments due to procedural reasons can signal early problems that could warrant oversight from CMS. The CAA requires states to report specific data relating to renewals, disenrollments, call center performance, and Marketplace transitions, as well as other data specified in the Unwinding Data Report and other Performance Indicator metrics required by CMS. While CMS is required to publish these monitoring data, there will likely be a lag in publishing the data, making it less useful when rapid response is needed. There is no requirement for states to report data publicly, and less than half of the states (24) indicate they will post some data on their websites, most often enrollment data, while 21 states indicated that they have yet to determine if they will post any data.

Among the just over one-third of states able to report, they estimate that about 18% of Medicaid enrollees will be disenrolled when the continuous enrollment provision ends. However, the estimates range widely across reporting states from about 7% to 33% of total enrollees. This estimated disenrollment rate is slightly higher than the 13% reported in 2022; however, it is consistent with other estimates indicating about 15 – 18 million people may lose Medicaid coverage over the coming year. Successfully transitioning individuals disenrolled who are no longer eligible into other coverage options, including CHIP and the Marketplace, could reduce the number who become uninsured.

Renewals

States must comply with all federal renewal requirements as a condition of receiving the enhanced federal funding enacted by the CAA through 2023. These requirements include accepting renewals through all four modes (online, phone, in-person, mail); using ex parte processes to automatically verify ongoing renewal before requiring the enrollee to submit forms or documents; sending pre-populated renewal forms (applies to MAGI groups); allowing a minimum of 30 days for a response; and re-processing eligibility if needed information is submitted within 90-day reconsideration period.

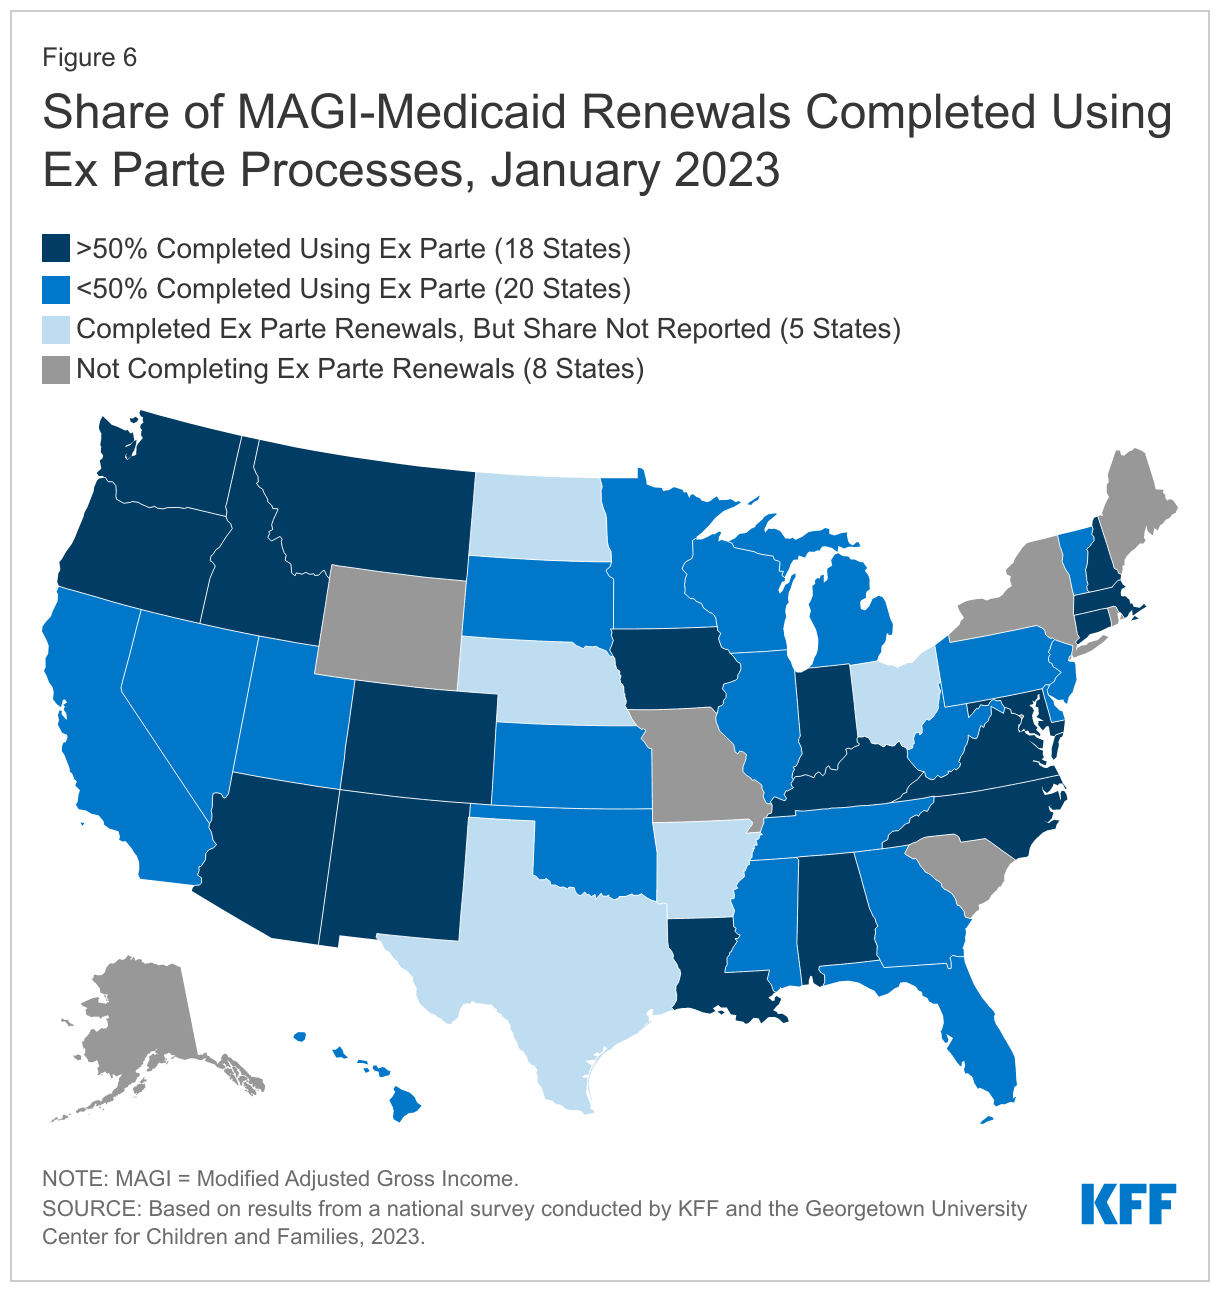
Most states (43) continue to process ex parte renewals. Federal regulations require states to attempt to automatically renew coverage for enrollees using reliable data available to the state, such as state wage or unemployment compensation data, before requiring an enrollee to complete a form or submit paper documentation. In the 43 states processing ex parte renewals, redeterminations are mostly conducted automatically by the system in 30 states. Four states report that most ex parte renewals require manual processing, and eight states indicate processing is a mix of manual and automated actions. Among states processing renewals, nearly two-thirds (32 states) are sending pre-populated renewal forms if they are unable to verify ongoing eligibility using electronic data sources. States with higher rates of renewals completed via ex parte will have fewer renewals to process manually, which eases the state’s administrative workload during a time when states face staffing challenges. Higher ex parte rates can also lower procedural disenrollments by removing barriers to renewal for enrollees, avoiding lost paperwork, and reducing manual processing errors. States that have also been sending prepopulated forms have been able to flag people who did not return renewal forms or respond to state requests for information, as well as those who were determined ineligible at the time of renewal.

Almost two-thirds of states (30) have taken steps to improve the share of renewals processed on an ex parte basis with 18 states reporting ex parte rates of over 50% as of January 2023, up from 11 states in January 2022 (Figure 6). During the pandemic CMS encouraged and assisted states in improving ex parte renewal rates, and 30 states have taken action to do so with most states (26) improving their system programming rules and seven states expanding the use of data sources. States also reported taking other steps including using temporary waiver authority to renew Medicaid based on SNAP or TANF data; automatically renewing enrollees with zero income; and increasing reasonable compatibility thresholds. Reasonable compatibility thresholds allow states to consider income as reasonably compatible if the difference between what an enrollee reports as income and what is found in data sources fall within a specific range.

Share of MAGI-Medicaid Renewals Completed Using Ex Parte Processes, January 2023

Most states (44) accept renewals through all four modes—online, in-person, by mail, and by phone. All states will assist enrollees with renewals in-person and 50 states accept paper renewals through the mail. In 48 states, individuals can renew online through their account, an online renewal form, or both, and 46 states process telephonic renewals using a telephone signature. CMS is working with states without all four modes on mitigation strategies that lead toward permanent compliance with all federal renewal regulations.

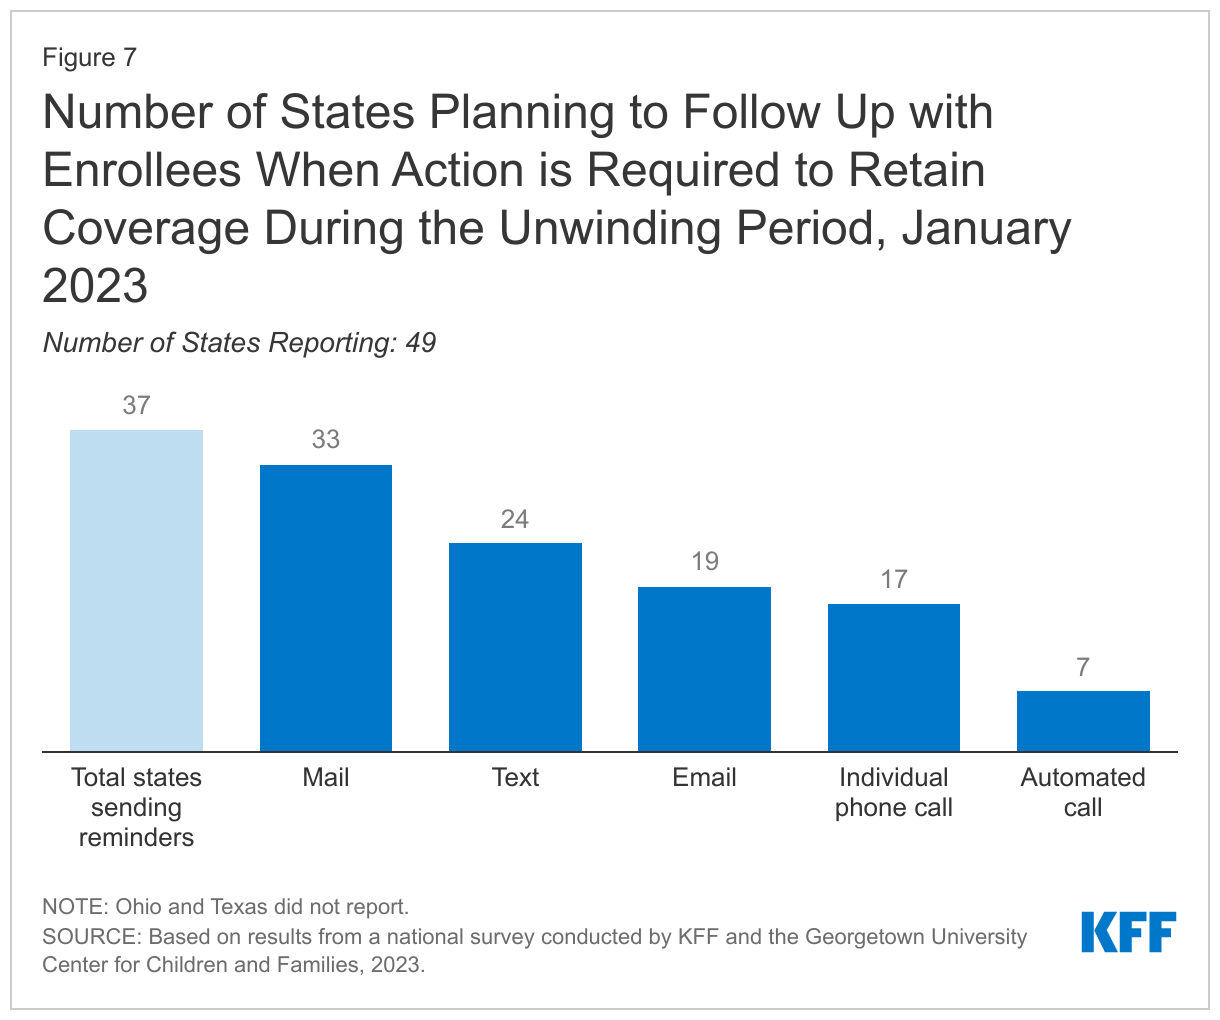
When the continuous enrollment provision is lifted, most states (37) plan to follow-up with enrollees when action must be taken to avoid a loss of coverage due to missing information. States must give MAGI-based enrollees 30 days to respond to a renewal request but there is no federal requirement for states to do more than send the renewal form, followed by a 10-day advance termination notice if the individual does not respond. However, sending reminder notices via mail, and through other communication modes, such as phone, text, and/or email, can increase the response rate to renewal requests. Follow-up reminders can also help reduce the number of people who remain eligible but are disenrolled at the end of the PHE because they did not respond to a request for information. Most of the states (33) plan to mail a reminder, 19 states will make individual or automated calls or both, 24 states will text reminders and 19 states will send email reminders (Figure 7). Overall, 30 states are planning to use multiple methods to follow up with enrollees.

Number of States Planning to Follow Up with Enrollees When Action is Required to Retain Coverage During the Unwinding Period, January 2023

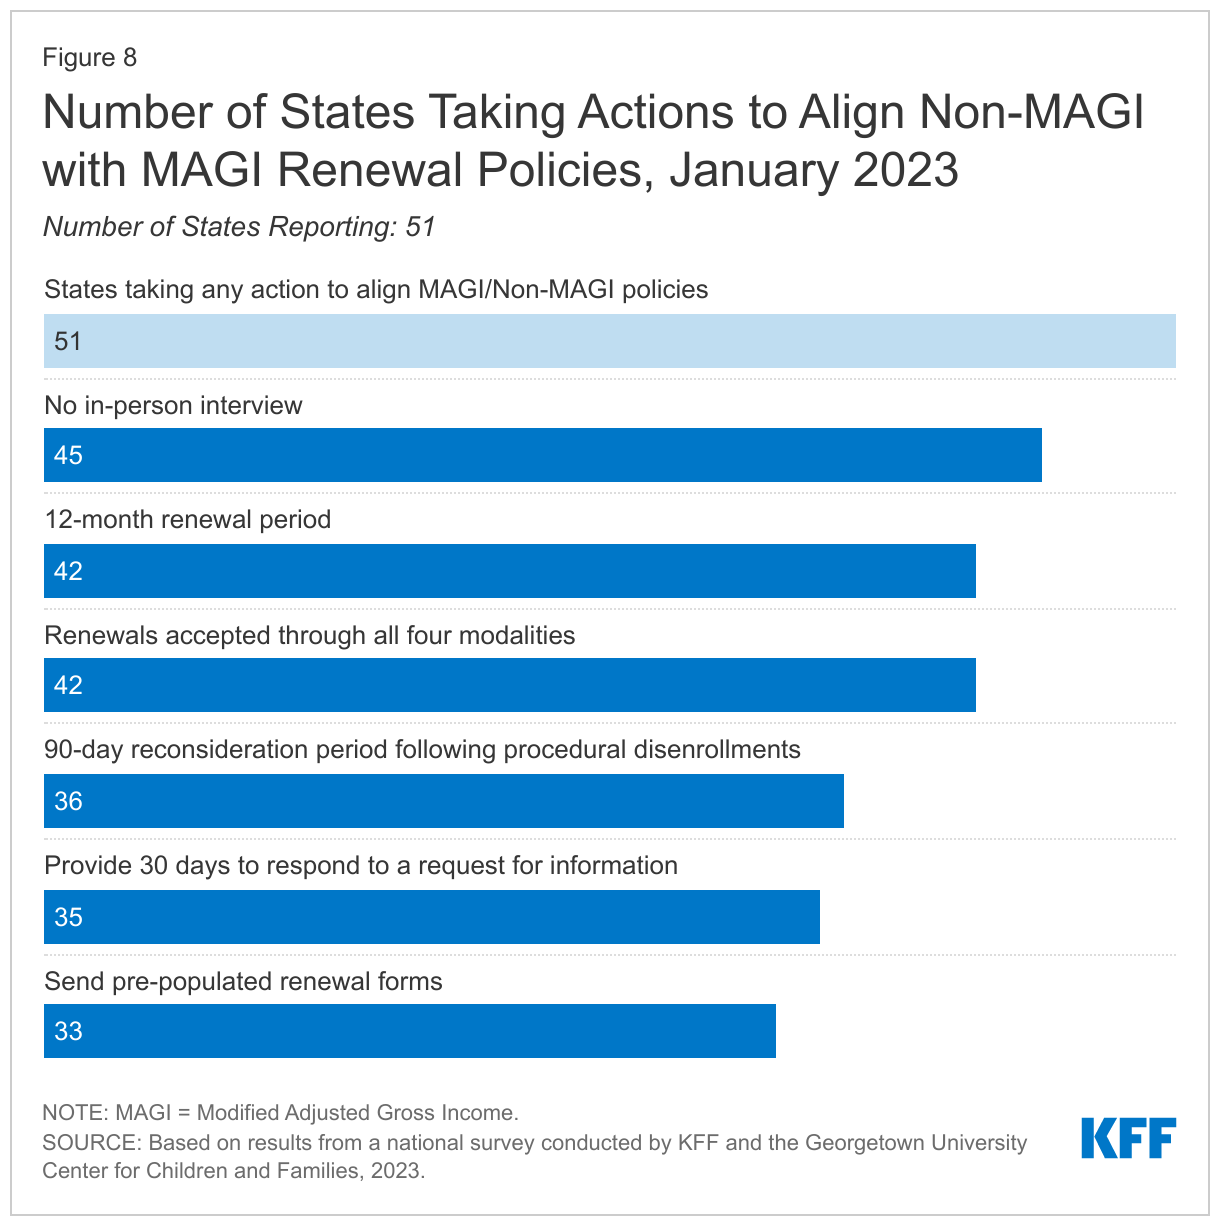
All states have taken at least one action to align renewal polices for non-MAGI groups with MAGI rules. Many of the renewal requirements enacted by the Affordable Care Act (ACA) applied only to coverage for children, pregnancy, parents, and expansion adults who are eligible under MAGI rules. In mid-2022, CMS proposed new eligibility and enrollment rules that will require states to align renewal policies, although most states have already taken steps to do so. State actions include eliminating in-person interviews (45 states); conducting annual renewals (42 states); sending pre-populated renewal forms (33 states); providing at least 30 days to respond to a request for information (35 states); accepting non-MAGI renewals through all four modalities (42 states); and extending the 90-day reconsideration period after procedural disenrollment (36 states, Figure 8).

Number of States Taking Actions to Align Non-MAGI with MAGI Renewal Policies, January 2023

(Back to top)

Systems and Enrollment Processes

Eligibility System Integration

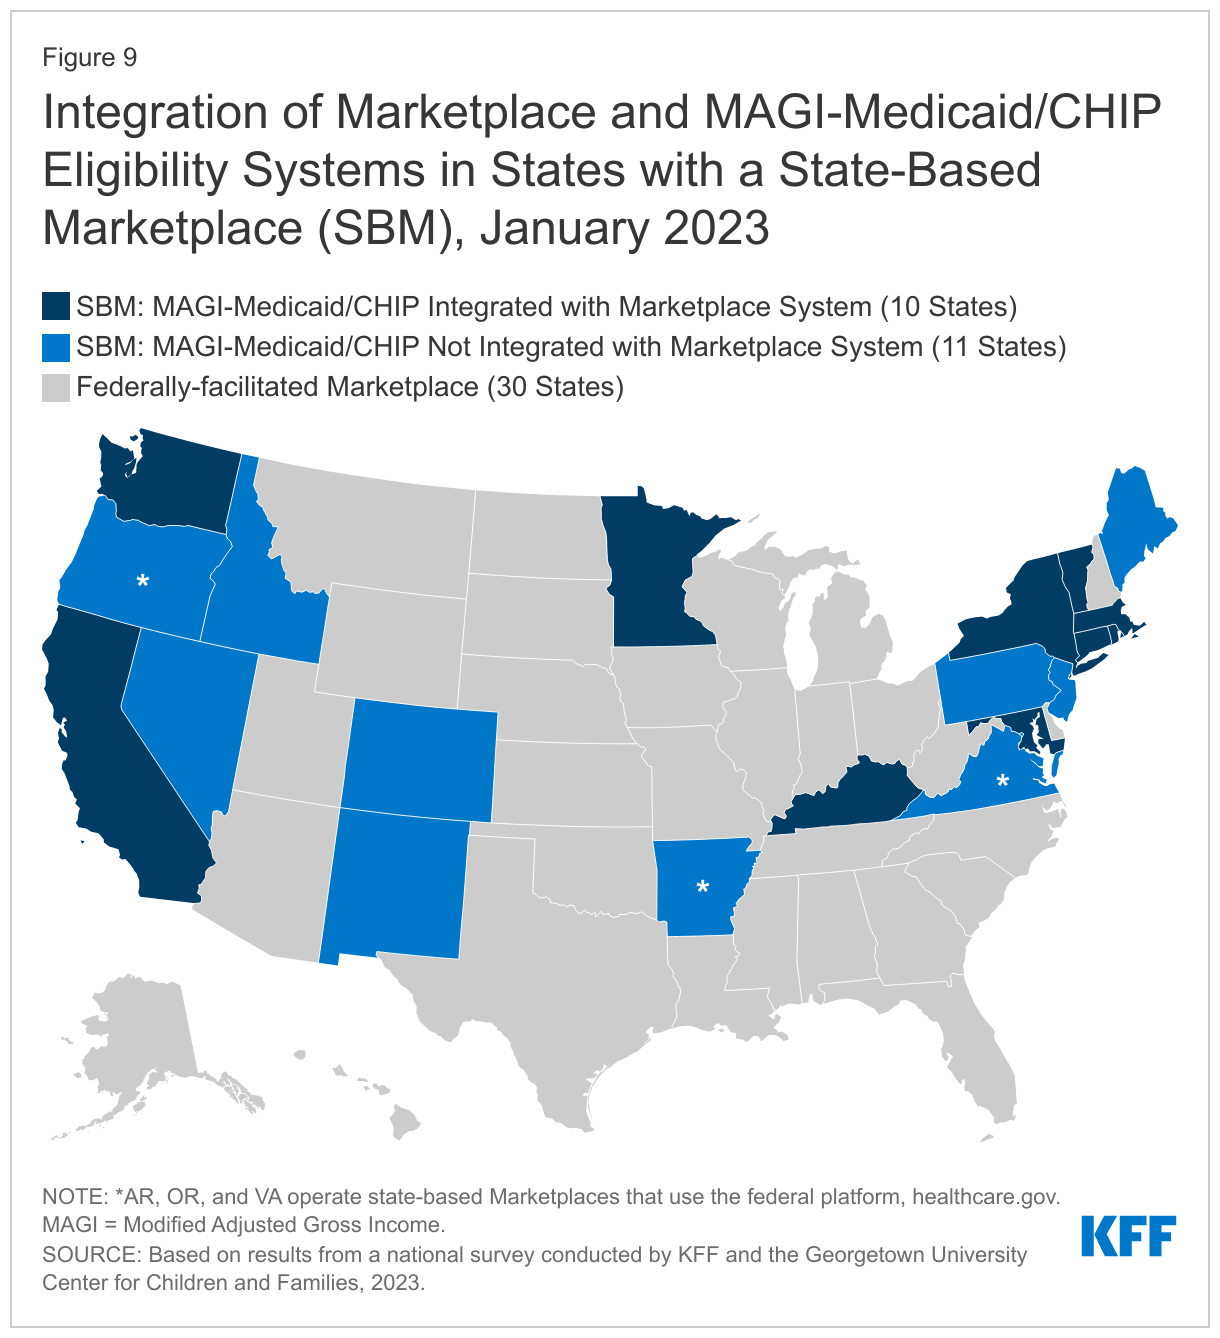
Some SBM states have integrated MAGI-based Medicaid and CHIP into the Marketplace eligibility and enrollment system. Of the 21 SBM states, 18 operate their own Marketplace eligibility and enrollment system while three SBM states (Arkansas, Oregon, Virginia) continue to use the federal healthcare.gov platform (SBM-FP) for Marketplace eligibility and enrollment. Of the states that operate their own Marketplace eligibility systems, ten also determine eligibility for MAGI Medicaid and CHIP (Figure 9). However, eight SBM states, along with the three SBM-FP states and 30 Federally-facilitated Marketplace (FFM) states using healthcare.gov for Marketplace eligibility and enrollment, operate separate systems for Medicaid and CHIP (41 states in total). Having integrated Marketplace and Medicaid systems can facilitate coverage transitions for people determined ineligible for Medicaid.

Integration of Marketplace and MAGI-Medicaid/CHIP Eligibility Systems, January 2023

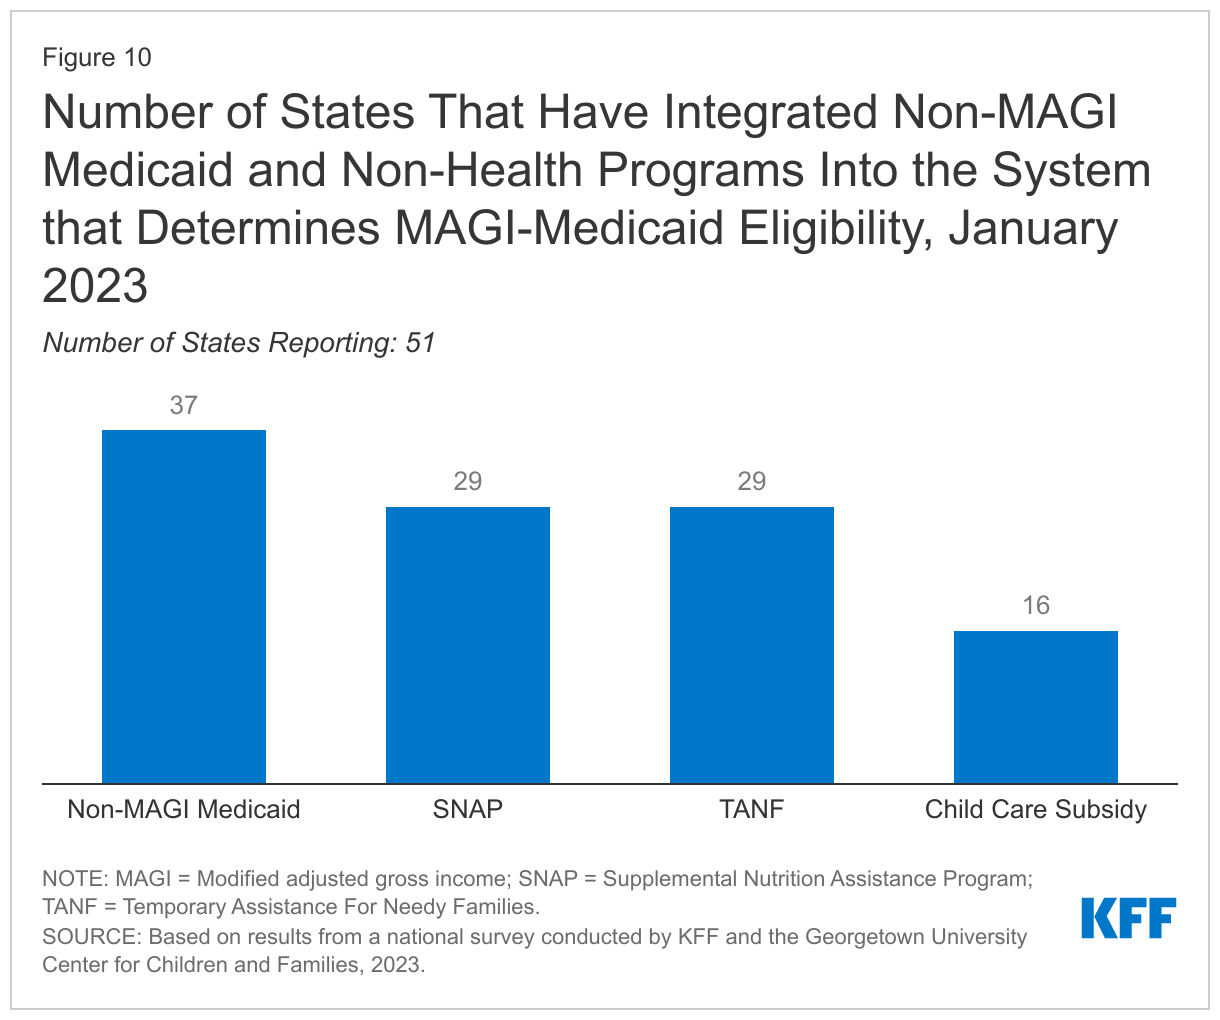
Over two-thirds of all states (37) have integrated non-MAGI Medicaid and over half of the states (29) have integrated SNAP and TANF into the system used to determine eligibility for MAGI-based Medicaid and CHIP (Figure 10). These counts include South Dakota that deployed a new integrated system in 2022. Ohio became the 16th state to integrate eligibility for childcare subsidies in their Medicaid systems. Of the ten states with integrated Marketplace and MAGI-based Medicaid system, only Kentucky and Rhode Island have integrated non-MAGI Medicaid and non-health programs with their SBM systems. System integration for health and non-health programs can smooth transitions between health coverage groups and make it easier for individuals to apply for multiple assistance programs. Integrated systems can also increase administrative efficiency by aligning eligibility tasks and sharing data that is used for multiple programs, such as contact information and income.

Number of States that Have Integrated Non-MAGI Medicaid and Non-Health Programs Into the System that Determines MAGI-Medicaid Eligibility, January 2023

Eligibility Verification Processes

All states use electronic data matches from a variety of reliable sources to verify income eligibility at application and renewal. States have long used data linkages to the Social Security Administration (SSA) and Department of Homeland Security (DHS) to verify certain types of income, birthdates, and citizenship or immigration status. The ACA accelerated state use of other data sources requiring states to first attempt to verify eligibility (both income and other criteria) before collecting documentation from the individual. States must verify income, but they have the option to accept an applicant’s attestation and verify income post-enrollment, as 11 states do. At renewal, states only need to verify eligibility criteria subject to change – most often income. In addition to the SSA income data, state income sources include the Federal Data Services Hub (45 states), state wage databases, (42 states), and state unemployment databases (45 states). Two-thirds of states also use SNAP income data (33), as well as commercial databases, like TALX or the Work Number (33) that provide wage information for large employers. Eight states also use state tax department data.

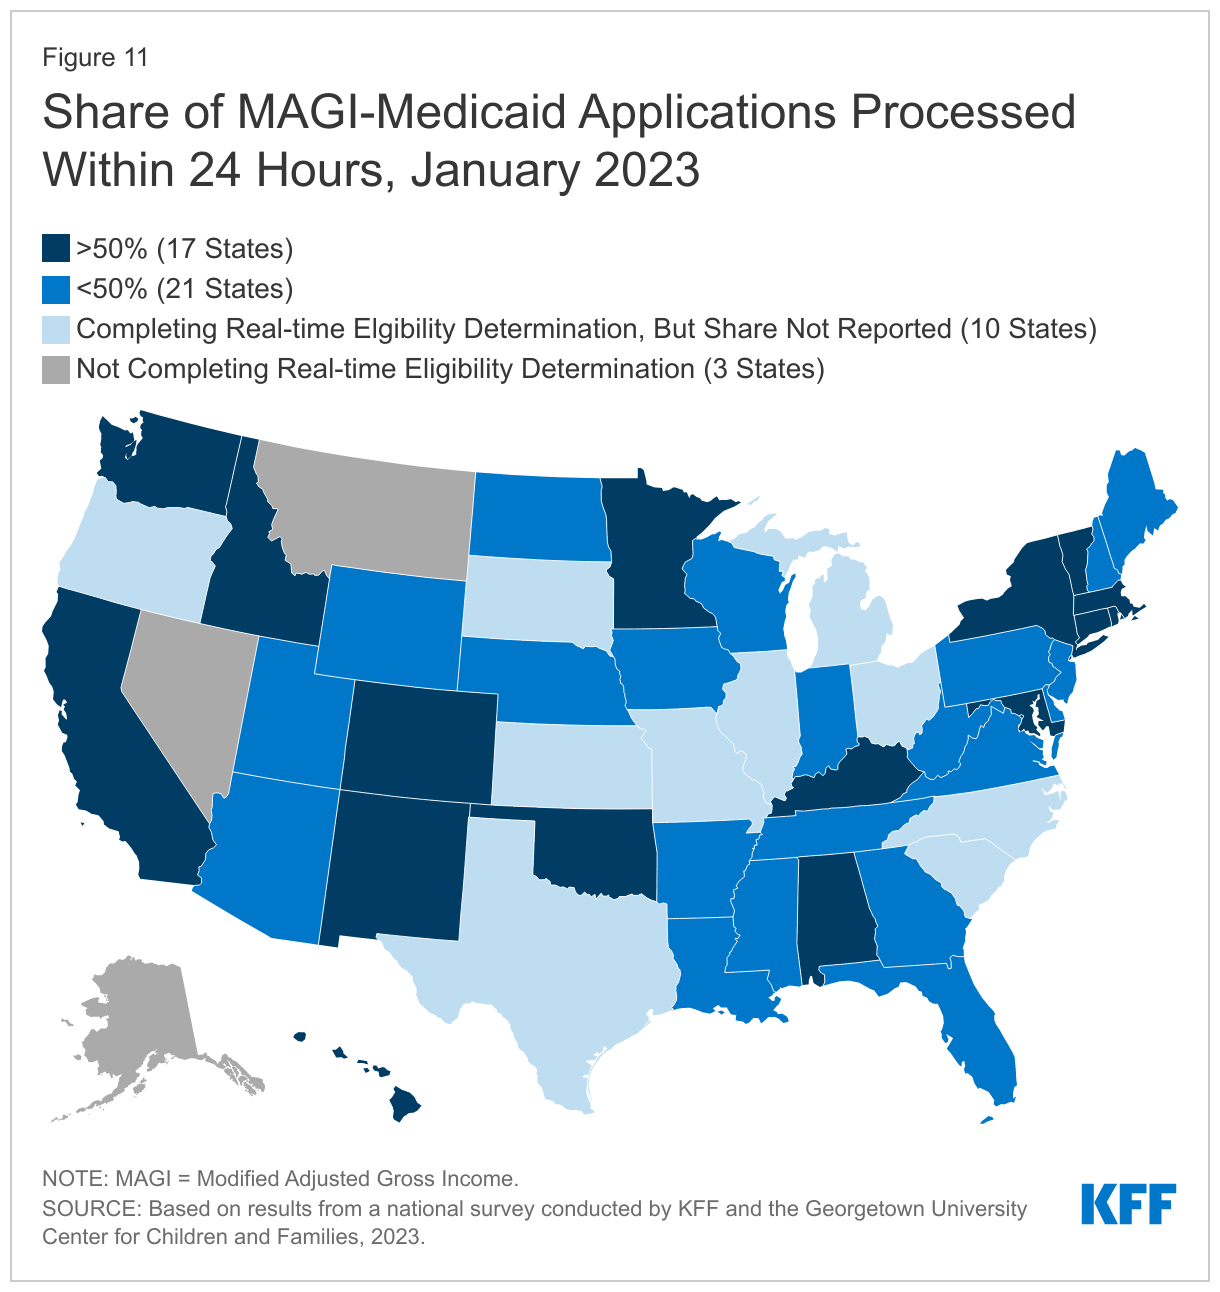
The use of electronic data enables most states to process at least a small number of applications in real-time (defined as within 24 hours); however, there is significant variation across states in the share of real-time determinations. A total of 48 states report being able to make real-time eligibility determinations, with 17 states determining eligibility for more than half of new applications within 24 hours, including 14 states that process more than 75% of applications in real time (Figure 11). Of the 48 states reporting the share of real-time determinations, 28 states indicate that most determinations are made automatically by the system. However, in 11 states, real time determinations generally require manual processing by an eligibility worker and may occur only when an individual applies in person with all documents needed to determine eligibility. In six states real-time determinations are a mix of automated and manual processes (three states did not report how real-time determinations are processed).

Share of MAGI-Medicaid Applications Processed Within 24 Hours, January 2023

Applications, Online Accounts, and Assister Portals

In almost all states, applications can be submitted online, by telephone, in person, or by mail. Since the ACA was implemented, there has been an effort to advance Medicaid IT systems to increase administrative efficiency and accuracy while making it easy to apply for coverage. However, federal rules require states to accept applications through all four modes even in states that attempt to drive most applications through online portals and limit in-person or telephonic applications. As of January 2023, all states accept applications online and in-person, while 50 states accept telephonic applications and paper applications through the mail. CMS has been working with states on mitigation strategies that will move the states toward permanent compliance with this requirement.

States continue to add non-MAGI Medicaid and non-health programs to their Medicaid applications. Applicants are able to apply for both MAGI and non-MAGI Medicaid through a single application in 40 states. Multi-benefit applications now include SNAP in 32 states and TANF in 30 states, including Idaho, Louisiana and North Carolina that added these programs to their applications in 2022, and 19 states include childcare subsidies in their multi-benefit applications, with the District of Columbia, Louisiana, and Ohio updating their applications in 2022. Among SBM states, 14 have joint applications for Marketplace premium tax credits and Medicaid. Only Kentucky and Rhode Island have joint applications that also include non-health programs. Multi-benefit applications are more common in states that have Medicaid eligibility systems that are integrated with non-MAGI Medicaid and non-health programs. Along with integrated systems, multi-benefit applications streamline the application process for both enrollees and the state.

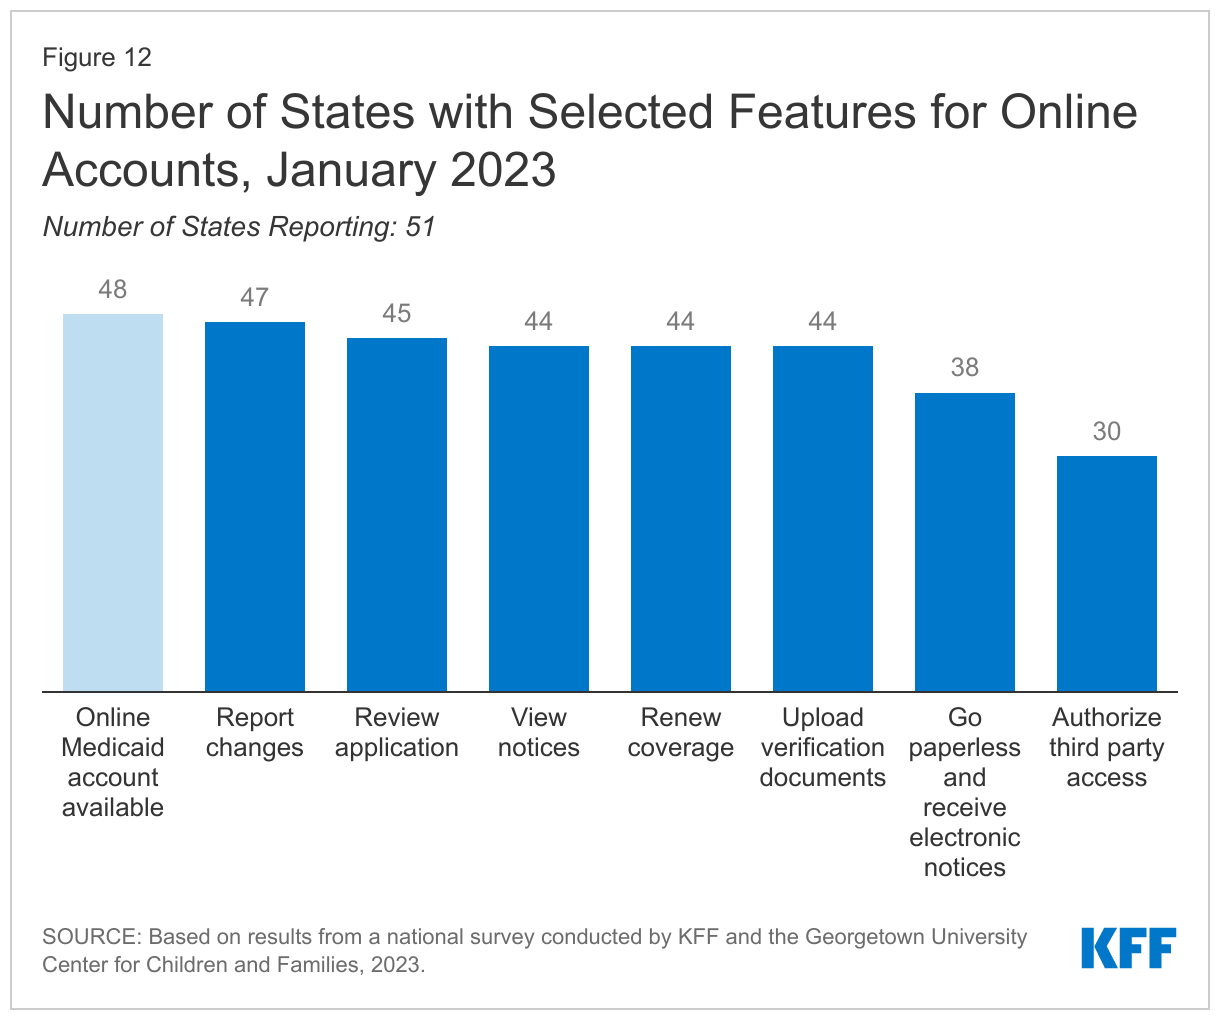
Nearly all states (48) offer online accounts for Medicaid and CHIP enrollees that make it easier for individuals to submit and access information about their coverage. Of 30 states reporting the share of enrollees with online accounts, 14 states report that more than 50% of enrollees have accounts. Most states with online accounts allow individuals to check application status (45 states); report changes (47 states); renew coverage (44 states); upload verification documents (44); and view notices (44 states). Slightly fewer states (38) permit individuals to go paperless and receive electronic notices and just over half of the states (29) allow individuals to authorize a third party to access their accounts (Figure 12).

Number of States with Selected Features for Online Accounts, January 2023

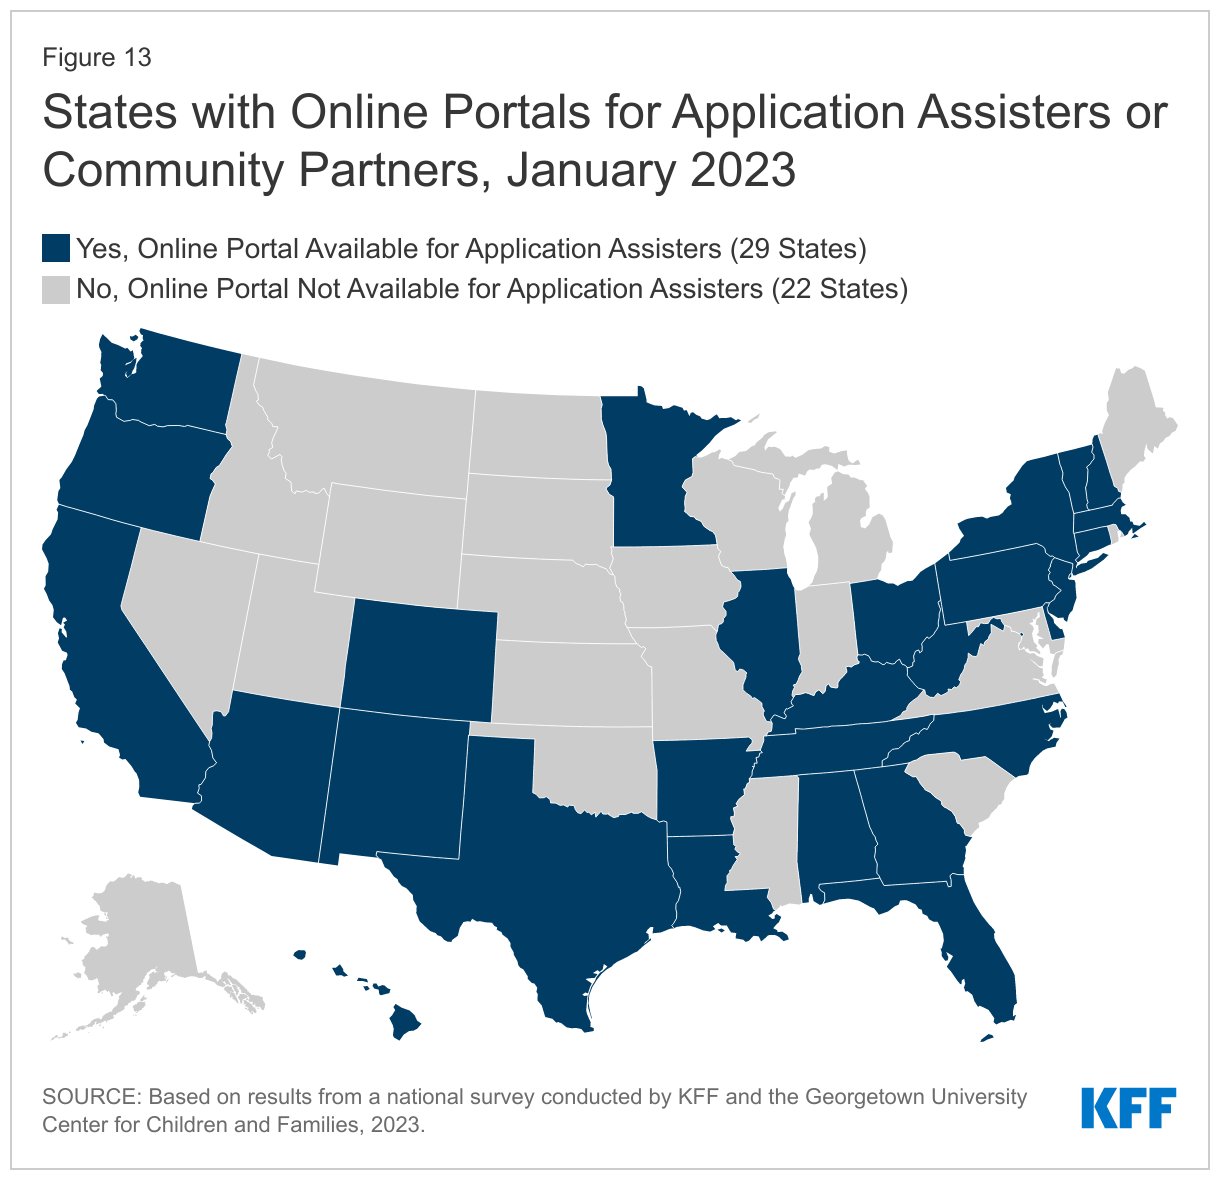
Over half of states (29) offer online portals for navigators, application assisters, and community partners to assist consumers with enrollment and renewal. Secure portals create administrative efficiencies by allowing assisters to perform administrative tasks that assist with enrollment and renewal and provide a mechanism for states to monitor assister performance. In the 27 states that reported the features available through the online portal, assisters are able to submit applications (27 states); review application status (26 states); report changes in circumstances (19 states); view notices (15 states); view pending actions (18 states); submit renewal information (18 states); upload documents (20 states); and update contact information (20 states, Figure 13).

States with Online Portals for Application Assisters or Community Partners, January 2023

(Back to top)

Medicaid and CHIP Eligibility

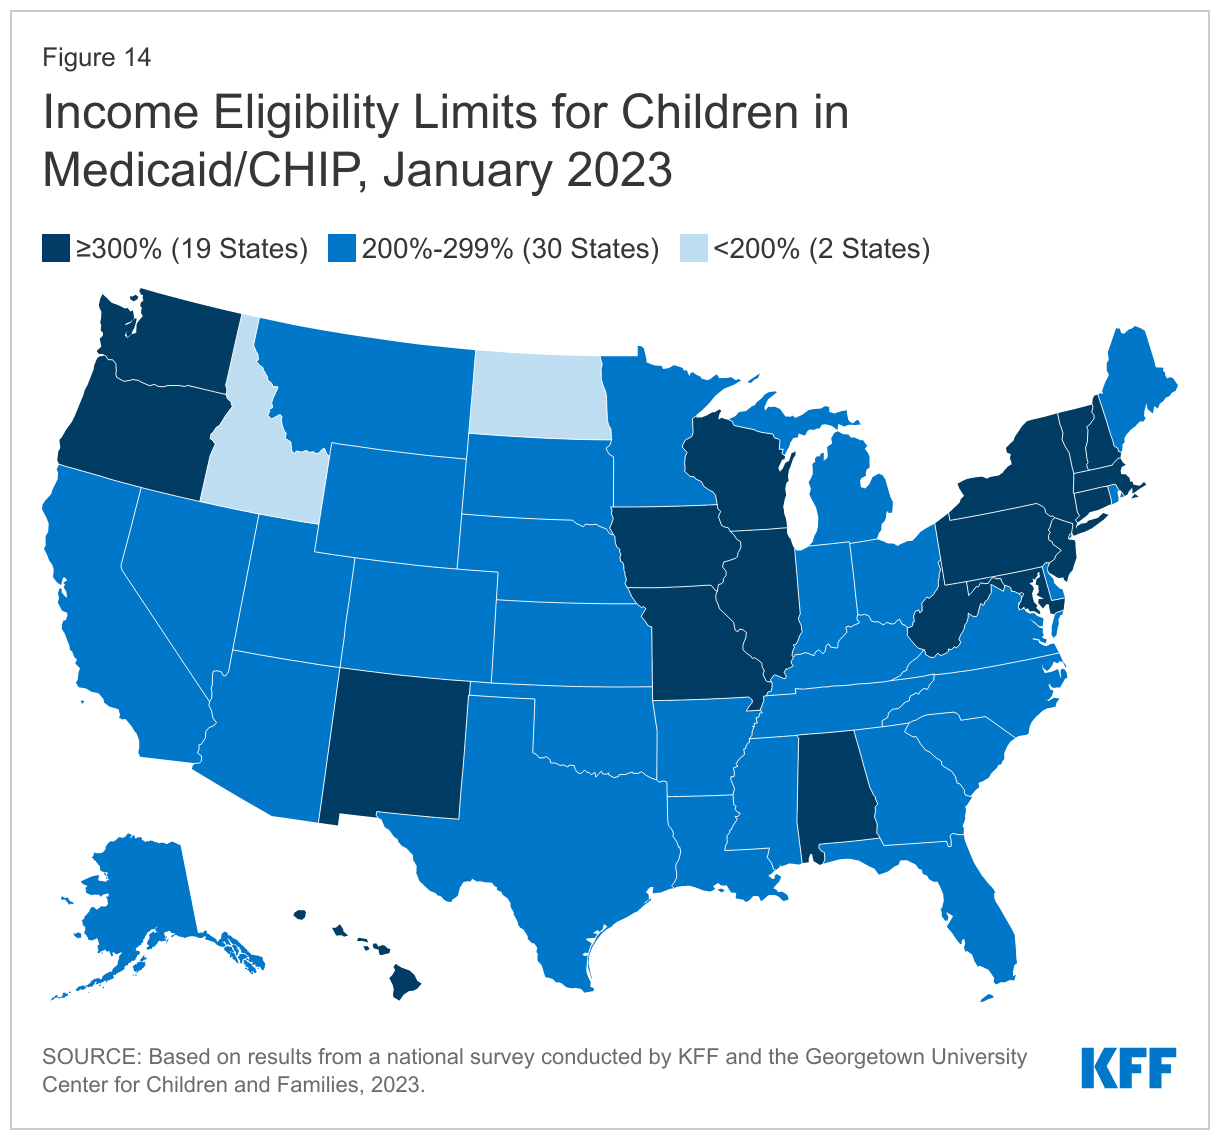
With enrollment standards protected in 2022, children’s upper income eligibility remained steady at a median eligibility level at 255% FPL, the highest of all eligibility groups. Eligibility levels range from a low of 175% FPL in North Dakota to a high of 405% FPL in New York. All but two states (Idaho and North Dakota) cover children at or above 200% FPL and more than a third of states (19) cover children at or above 300% FPL (Figure 14). The only change in eligibility levels for children’s coverage was in Kansas, where the legislature increased CHIP eligibility to 255% FPL in July 2022 for a twelve-month period. Illinois transitioned coverage of uninsured children eligible for CHIP from a separate CHIP program to a CHIP-funded Medicaid expansion (M-CHIP). As of January 2023, 18 states use an M-CHIP structure for their CHIP program. North Carolina plans to transition its separate CHIP program into an M-CHIP program in 2023.

Income Eligibility Limits for Children in Medicaid/CHIP, January 2023

Four states took steps to expand access to pregnancy coverage, including for pregnant immigrants, increasing the median eligibility limit for pregnancy coverage in Medicaid and CHIP to 207% FPL. Most states provide pregnancy coverage at higher income levels than those for parents or other adults, ranging from a low of 138% (the federal minimum level) in Idaho and South Dakota to a high of 380% FPL in Iowa. Roughly two-thirds of states (35) cover pregnant individuals at or above 200% FPL. Oklahoma has submitted a SPA to increase its eligibility level for pregnancy coverage in Medicaid to 210% FPL, from 138% FPL previously, with a retroactive effective date of January 1, 2023. All states cover pregnant youth under age 19 in CHIP, but states that cover pregnancy in Medicaid up to 185% FPL can also use CHIP funds to expand pregnancy coverage to individuals over age 19. In July 2022, Kentucky expanded pregnancy coverage to 218% FPL through CHIP, becoming the seventh state to do so. Since CHIP’s enactment in 1997, states have had the option to provide CHIP coverage from conception to birth, known as the unborn child option, effectively extending pregnancy coverage regardless of immigration status. Connecticut and Maine adopted the option in 2022, bringing the total number of states that have adopted the option to 20 (Figure 15). Several additional states, including Colorado, Maryland, New York, and the District of Columbia, are taking steps to adopt the policy in 2023 or later. Vermont also extended pregnancy coverage regardless of immigration status using state-only funds.

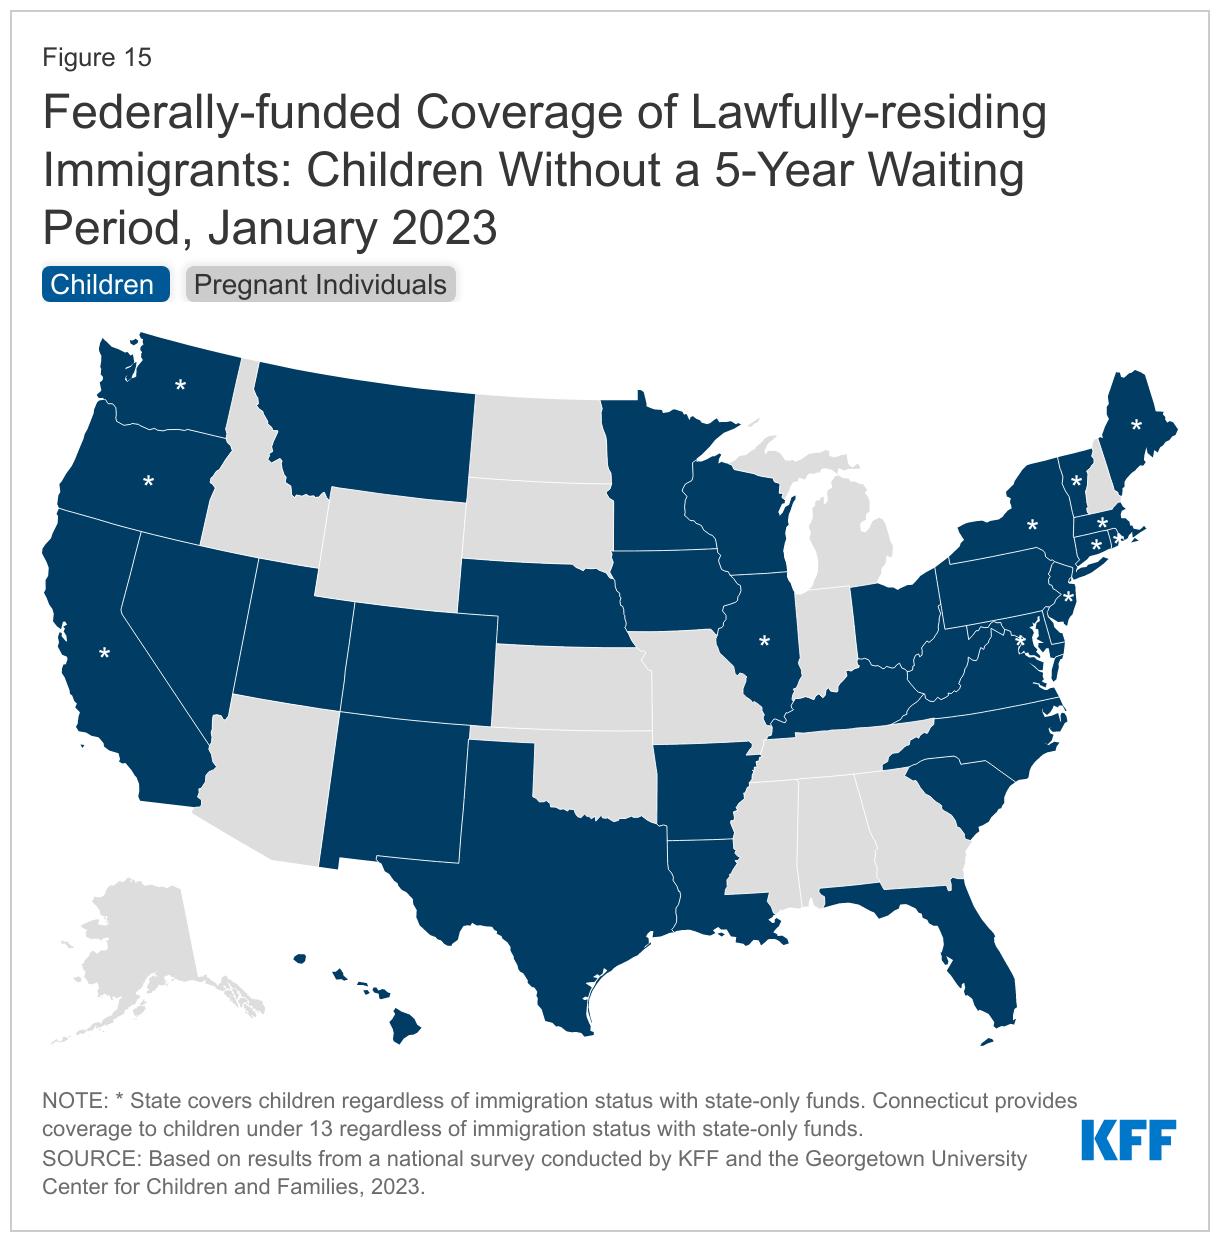
As of January 2023, 40 states have adopted federally-funded options to extend coverage to some immigrant children and/or pregnant individuals without the five-year waiting period. The 2009 CHIP Reauthorization Act, or CHIPRA, offers states the option to waive the five-year waiting period for lawfully-residing children and pregnant people. In the last decade and a half, 35 states have adopted the CHIPRA option for children in Medicaid and all of those states with separate CHIP programs (23 states) cover eligible immigrant children in CHIP (Figure 15). As of January 2023, 26 states cover lawfully-residing pregnant people in Medicaid without a five-year waiting period, as do five of the seven states using CHIP to cover pregnant adults (both counts include Kentucky which adopted the policy in 2022). All states covering recent lawful residents during pregnancy, except Wyoming, have adopted the option for children as well.

States are increasingly using state-only funds to extend coverage or limited benefits to some immigrant children, pregnant individuals, and other adults who do not have federal pathways to coverage. A dozen states (12) now cover all income-eligible children regardless of immigration status, using state funds, although Connecticut only covers children under age 13. Connecticut, Maine, New Jersey, Rhode Island, and Vermont extended this coverage in 2022 (Figure 15). Vermont also extended state-funded coverage to pregnant people who do not qualify for federal funding. With the permanent option to extend postpartum coverage for a full twelve months, there is growing interest in providing extended postpartum services to immigrant populations who are not eligible due to immigration status. A total of 12 states do so, with seven states (Connecticut, District of Columbia, Massachusetts, Minnesota, New York, Rhode Island, and Washington) using state-only funds and four states (California, Illinois, Minnesota, and Virginia) using CHIP health service initiative (HSI) funding. As of January 2023, 11 states use state-only funds to cover other immigrant adults who are otherwise ineligible, including four states (Illinois, New Jersey, Oregon, and Vermont) that newly extended coverage to targeted immigrant adult groups in 2022.

Federally-funded Coverage of Lawfully-residing Immigrants: Children Without a 5-Year Waiting Period, January 2023

In 2022, South Dakota voters passed a ballot initiative to adopt the ACA Medicaid adult expansion, leaving 11 states where a coverage gap will remain for low-income adults. South Dakota will implement Medicaid expansion in July 2023, making it the seventh state where voters have approved ballot initiatives to adopt Medicaid expansion. North Carolina is now poised to become the 41st state to adopt Medicaid expansion after legislators in the state reached a deal that is expected to be voted on soon. As of January 2023, 39 states cover parents and adults without dependent children with incomes at least up to 138% FPL (the FPL is $14,580 per year for an individual; $24,860 for a family of three in 2023). When Medicaid expansion coverage began in January 2014, only half of the states (26) adopted the option. Following implementation in South Dakota, the total number of expansion states will increase to 40.

Median Medicaid Income Eligibility Limits Based on Implementation of Medicaid Expansion, January 2023

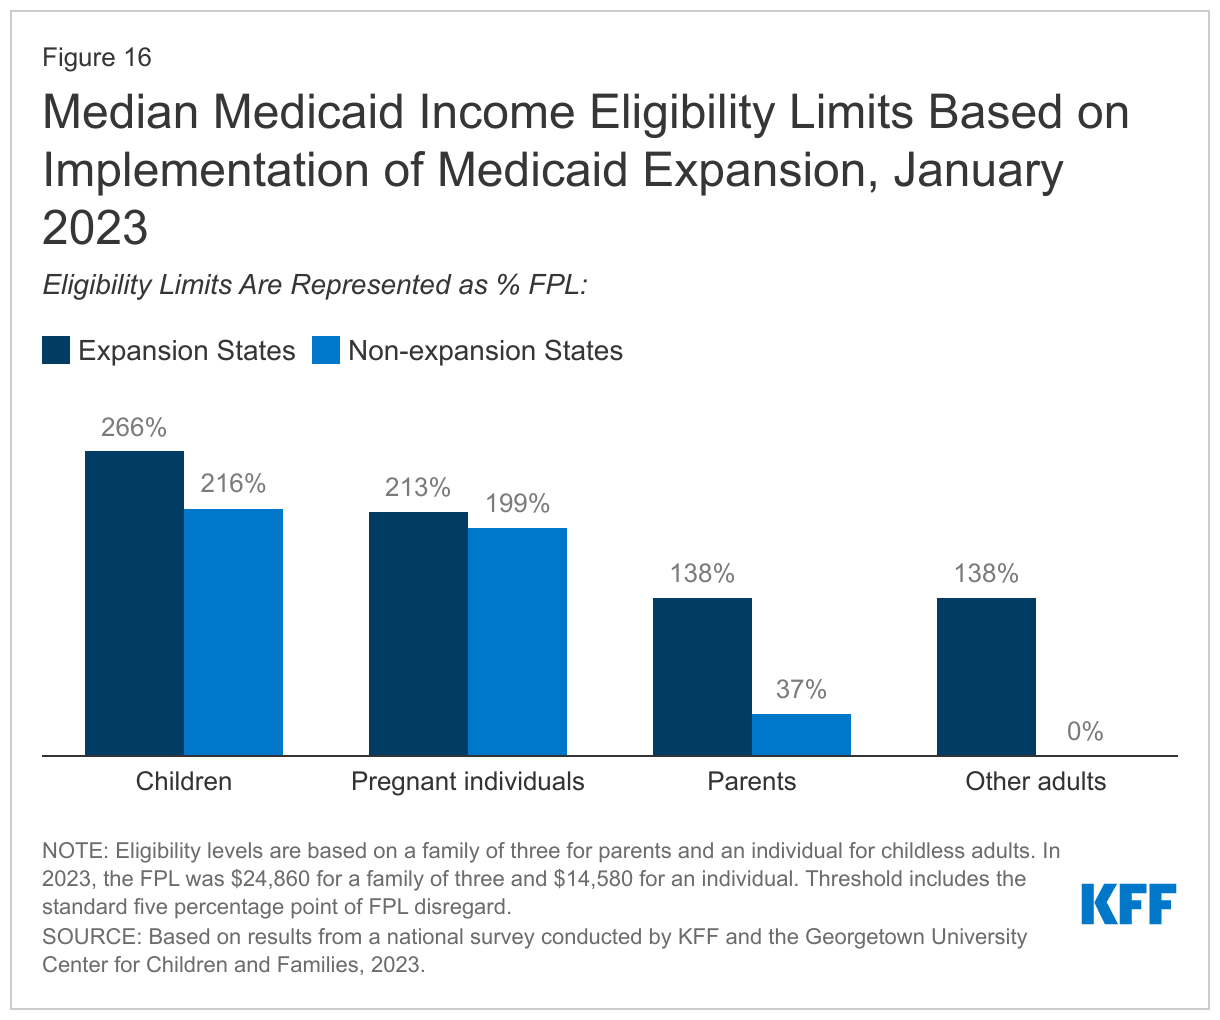
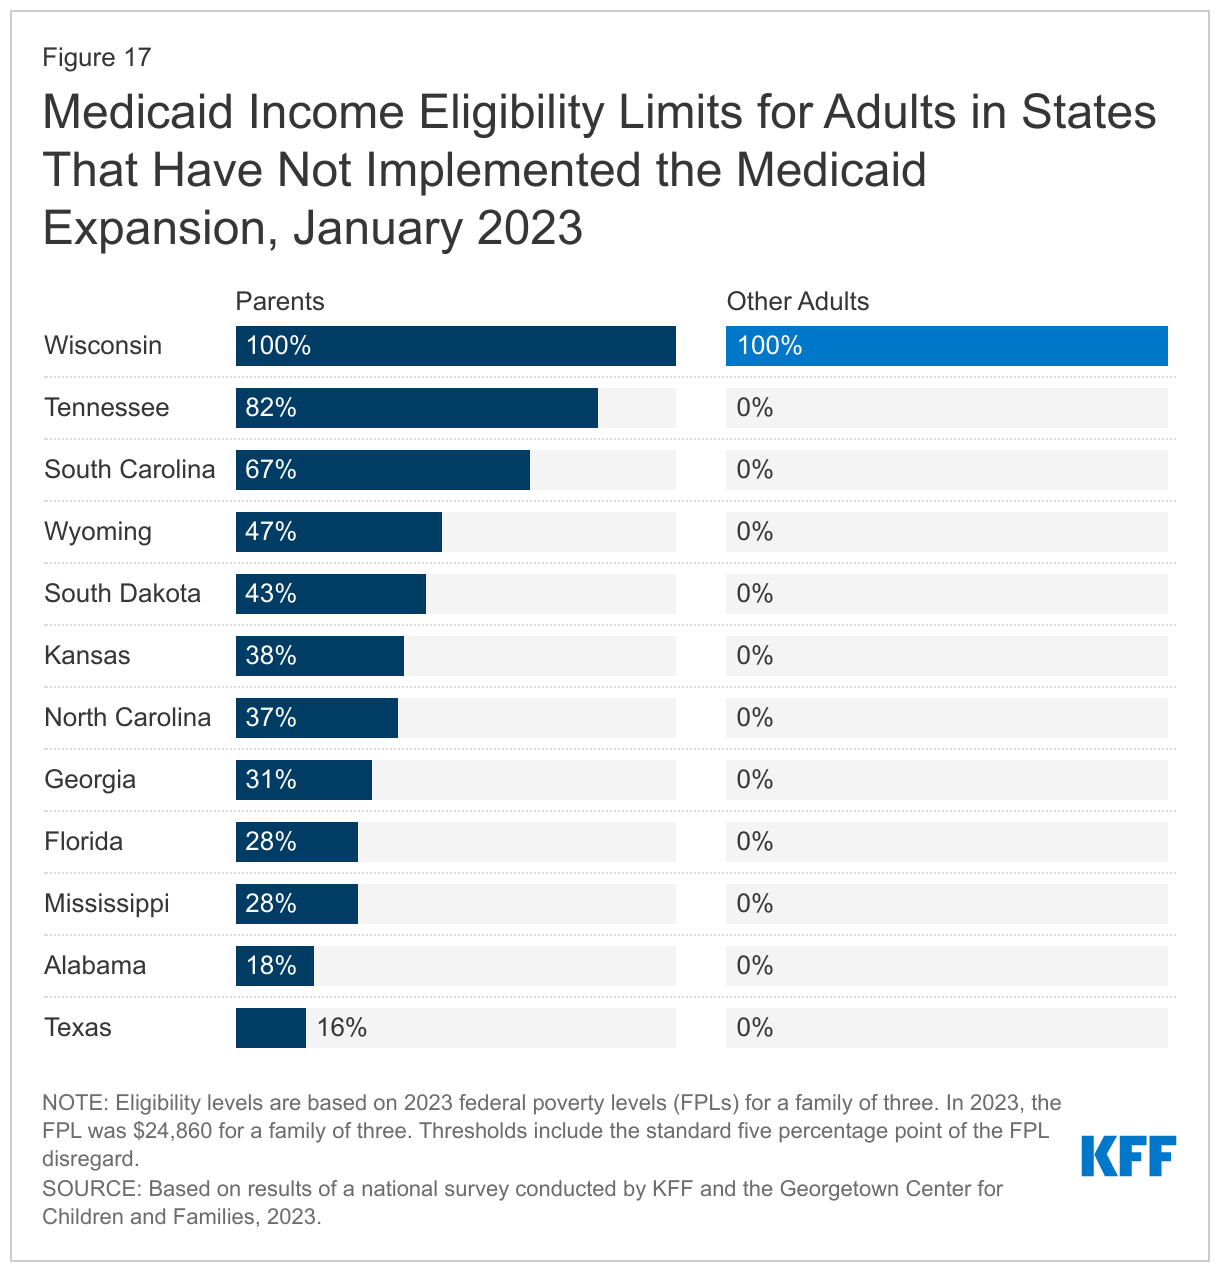
Eligibility remains extremely low in the states that have not implemented the Medicaid expansion as of January 2023 with the median income eligibility dropping to 37% FPL (Figures 16 and 17). Eight non-expansion states as of January 2023 (Florida, Georgia, Mississippi, North Carolina, South Dakota, Tennessee, Texas, and Wyoming) base income eligibility on dollar thresholds that are not routinely updated. Mississippi was the only state of those seven to update its fixed dollar threshold for a family of three from $384 per month in 2022 to $480 per month in 2023. Over time, the equivalent federal poverty level eligibility level decreases as the federal poverty threshold is adjusted upward to account for inflation. In 2023, the FPLs rose significantly from between 7.3% and 8.4% depending on household size, so the erosion is more evident. For example, Tennessee’s parent eligibility declined from 88% FPL in 2022 to 82% FPL in 2023. The median eligibility level for parents and caretakers in the 12 non-expansion states is now 37% FPL ($9,198 annually for a family of three), ranging from a low of 16% FPL in Texas to 100% FPL in Wisconsin. Wisconsin is the only non-expansion state that provides coverage to adults without dependent children, aligning eligibility with that for parents at 100% FPL, through a waiver.

Medicaid Income Eligibility Limits for Adults in States That Have Not Implemented the Medicaid Expansion, January 2023

The median eligibility level for family planning services held steady at 206% FPL, but eligibility levels range from 138% FPL in Louisiana and Oklahoma to a high of 306% FPL in Wisconsin. In July 2022, Colorado became the 31st state to use federal funds, through a state plan option or waiver, to provide family planning only services to people who do not qualify for full Medicaid through another pathway.

Continuous Eligibility Policies

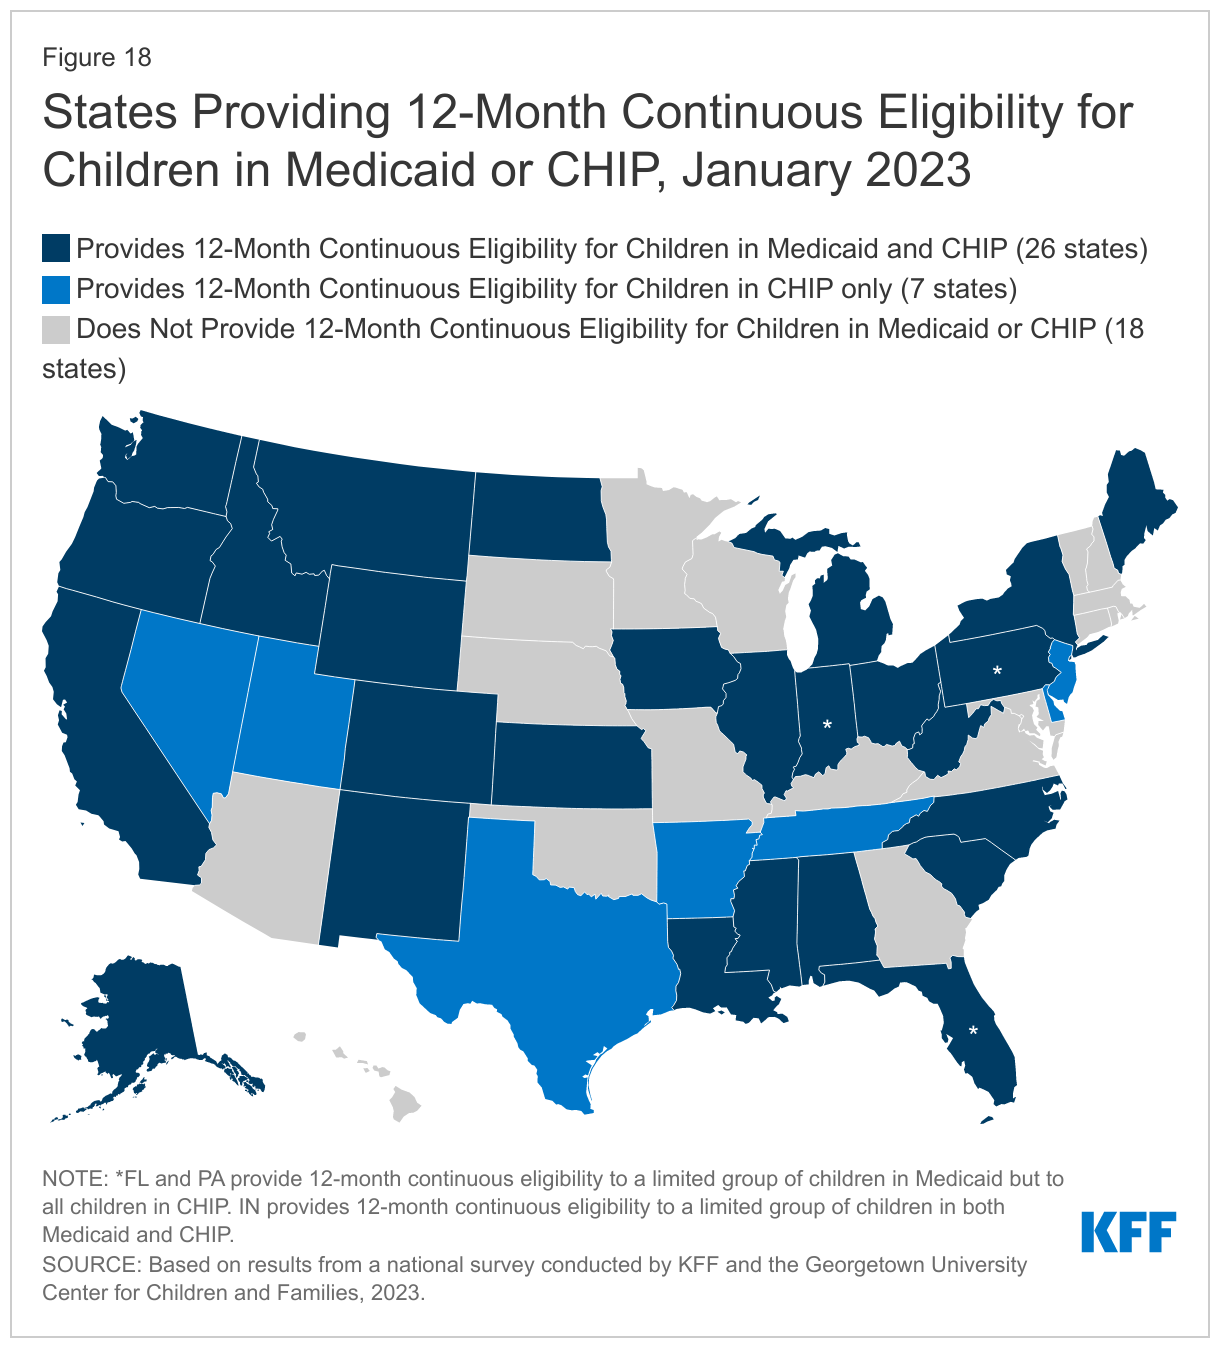
As of January 2023, 33 states provide 12-month continuous eligibility for some or all children in Medicaid and/or CHIP; all states will be required to do so starting in 2024. Continuous eligibility is more prevalent in CHIP with 24 states of the 33 states with separate CHIP programs providing a full year of coverage compared to 26 of the 51 Medicaid programs (Figure 18). These counts include states that provide 12-month continuous coverage to an age-limited group (Florida, Indiana, and Pennsylvania). The CAA requires all states to provide 12-month continuous coverage to all children in Medicaid and CHIP, beginning January 1, 2024. Oregon became the first state to receive approval to cover children continuously until their sixth birthday; three other states, California, New Mexico, and Washington, have similar plans. Oregon also received approval to provide two-year continuous eligibility for older children. Illinois is developing a proposal to provide two-year continuous eligibility for all children.

States Providing 12-Month Continuous Eligibility for All Children in Medicaid or CHIP, January 2023

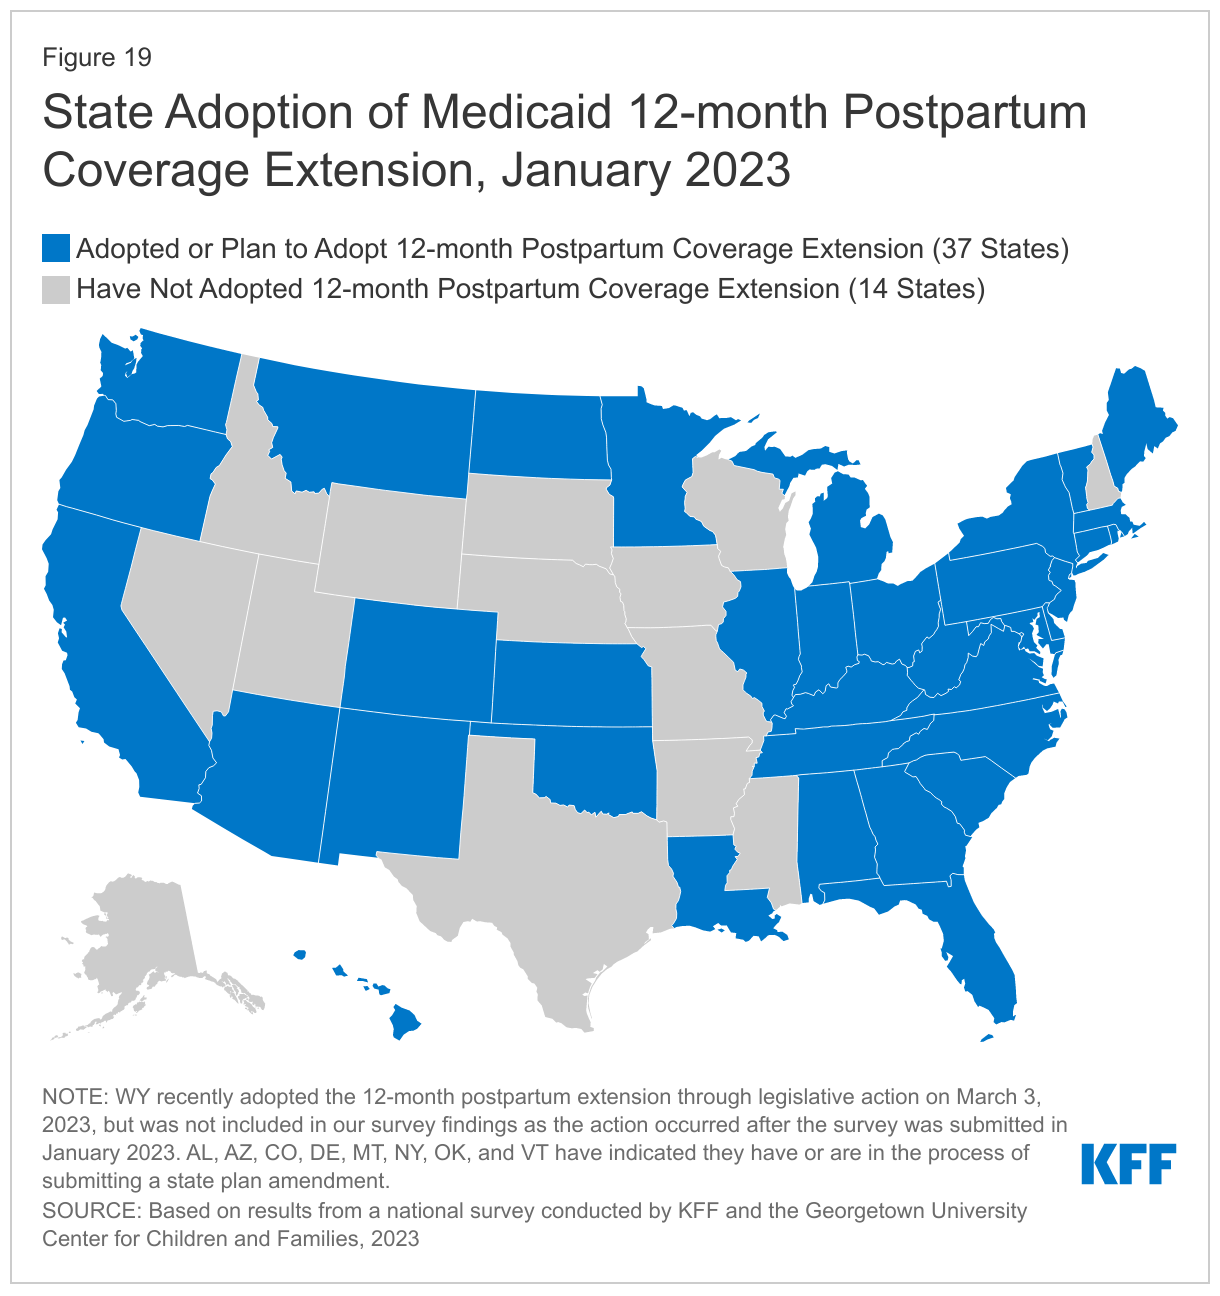
More than two-thirds of states (37) have extended or plan to extend postpartum coverage following pregnancy for 12 months, as of January 2023. The American Rescue Plan Act of 2021 gave states the option to provide 12-month postpartum coverage in Medicaid and CHIP via a state plan amendment (SPA) for five years; however, the CAA made the option permanent. As of January 2023, 29 states have implemented the option, with an additional eight states in various stages of seeking approval to do so (Figure 19). The quick take-up of this option, with 37 states moving forward in less than two years and additional states currently debating legislation to adopt the coverage extension, is a reflection of the country’s increased focus on maternal health and health disparities.

State Adoption of Medicaid 12-month Postpartum Coverage Extension, January 2023

Several states have received Section 1115 waiver authority to provide continuous eligibility to adults. Oregon became the first state to receive approval to provide two-year continuous eligibility for all adults. New York provides 12-month continuous eligibility for all adults, while Kansas covers section 1931 parents and caretakers for a full year under waiver authority. Massachusetts provides 12-month continuous eligibility for individuals released from correctional settings and two-year continuous eligibility for people who are chronically homeless. Utah also provides 12-month continuous eligibility for a targeted group of very low-income adults.

Waiting Periods and Premiums for Children

Some states continue to require that children be uninsured for a period of time before enrolling in CHIP. CHIP funding can only be used to cover “uninsured” children. States are required to take steps to discourage the substitution of CHIP for private group insurance and early on many states chose to do so by requiring a period of time that a child must be uninsured before enrolling in CHIP. However, the ACA introduced several federally required exemptions to the waiting periods, such as loss of employer coverage or job loss, that has led states to drop their waiting periods because most children qualify for an exemption. The ACA also limited waiting periods to less than 90 days. Two states (Indiana and Maine) waived CHIP waiting periods during the pandemic, and Maine has decided not to reinstate. Going forward nine states (Arizona, Arkansas, Florida, Indiana, Iowa, Louisiana, South Dakota, Texas, and Utah) will continue to impose waiting periods ranging from one month to 90 days.

Two-thirds of states (19 of 30 states) that charge premiums or enrollment fees to children waived those charges during the PHE. States may not charge premiums to Medicaid enrollees with income below 150% FPL but have more flexibility in charging premiums or enrollment fees to children in CHIP. In 2020, 26 states charged quarterly or monthly premiums and four states required enrollment fees. Of the 30 states charging premiums or enrollment fees, 19 states suspended premiums temporarily during the PHE. Six states (California, Colorado, Illinois, Maine, New Jersey, and North Carolina) do not plan to resume premiums after the PHE ends or have already eliminated them and New York eliminated the premium tier for the lowest-income children on CHIP. About half of the states that plan to resume premiums will do so at the end of the PHE; others plan to wait a few months or until the end of the unwinding period.(Back to top)

Looking Ahead

States are moving from planning for the end of the continuous enrollment provision to implementation of their unwinding plans, but the impact of the unwinding will vary by state. Passage of the CAA propelled states into the final planning stages, with several states moving as quickly as allowed to initiate the unwinding period. How the unwinding impacts Medicaid enrollees and state spending will vary significantly from state to state depending on each state’s systems capabilities, including ex parte renewal rates; communications strategies; staff capacity; and operational policies that make it easier for people to stay enrolled.

After achieving historically low rates of uninsurance, largely spurred by the Medicaid continuous enrollment provision as well as enhanced subsidies in the ACA marketplace, it is likely that the uninsured rate will increase as states resume Medicaid disenrollments. Most people who are disenrolled from Medicaid because they are no longer eligible should have a path to other coverage options through the Marketplaces or an employer, but even with zero premium ACA plans available for some, affordability may remain a barrier for others. Enhancing systems to facilitate coverage transitions and increasing the availability of consumer assistance can help increase the number of people who gain other coverage. Still, disenrollments for procedural reasons are expected to be high. The Office of the Assistant Secretary for Planning and Evaluation (ASPE) estimated that 45% of people disenrolled during the unwinding will lose coverage despite remaining eligible, which will disproportionately impact children and people of color. Boosting staff resources, actively monitoring the unwinding to identify issues, and rapidly responding to systemic or recurring problems can help avoid procedural disenrollments that lead to coverage losses.

While the Biden Administration works to finalize rules and policy to help promote and expand coverage, Republicans in Congress may push for cuts to Medicaid. The HHS Regulatory Agenda for 2023 includes finalizing rule changes relating to eligibility and enrollment, access and managed care, mandatory reporting of the child core set of healthcare quality measures, and anti-discrimination. The eligibility and enrollment rule would strengthen coordination between Medicaid and CHIP; require states to improve processes for handling returned mail; set new time standards for processing applications and renewals; and align non-MAGI and MAGI application and renewal policies. While the effective dates of the requirements in the eligibility and enrollment rule may be staggered over time, states will be challenged to implement significant changes amid the unwinding. Other rules likely to be finalized will also require the attention of Medicaid leadership at a pivotal time for the agency. At the same time, Congressional debate over the debt ceiling has given rise to talk of cuts to Medicaid and other assistance programs. Interest in putting restrictions on Medicaid enrollment, such as work requirements, have resurfaced, as well as strategies to slow the growth in Medicaid spending that largely shift increasing costs on the states by putting constraints on federal funding. How serious this debate is remains to be seen.(Back to top)

Tables

Note: This report, originally published on March 16, 2023 and updated on April 4, 2023, presents policies and procedures that were in place as of January 1, 2023. However, state policies are evolving and the information here may not reflect current state policy. Some states have provided updated information and those responses are captured in data posted here.

Table A: Trends in State Medicaid and CHIP Eligibility, Enrollment, and Renewal Policies, December 2009-January 2023

Table 1: Income Eligibility Limits for Children’s Health Coverage as a Percent Of The Federal Poverty Level, January 2023
Table 2: Medicaid and CHIP Coverage for Pregnant Individuals and Medicaid Family Planning Expansion, January 2023
Table 3: State Adoption of Options to Cover Immigrant Populations, January 2023
Table 4: Medicaid Income Eligibility Limits for Adults as a Percent of the Federal Poverty Level, January 2023
Table 5: State Adoption of 12-Month Continuous Eligibility for Selected Populations, January 2023
Table 6: Integration of MAGI-Medicaid Eligibility Systems with Marketplace Systems, Non-MAGI Medicaid, and Non-Health Programs, January 2023
Table 7: Modes For Submitting Medicaid Applications and Features of Online Applications, January 2023
Table 8: Real-Time Eligibility Determinations, January 2023
Table 9: Staff Responsible for Processing Applications and Renewals in Medicaid and CHIP, January 2023
Table 10: Features of Online Medicaid Accounts, January 2023
Table 11: Features of Portals for Application Assisters/Community Partners, January 2023
Table 12: Databases Used to Verify Income, In Addition to the Social Security Administration Database, January 2023
Table 13: Medicaid Ex Parte Renewals for Children, Pregnant Individuals, Parents, and Expansion Adults, January 2023
Table 14: Steps to Increase Ex Parte Renewals Rates in the Past Year, January 2023
Table 15: Modes For Submitting Medicaid Renewals, January 2023
Table 16: Actions to Align Non-MAGI with MAGI Renewal Policies, January 2023
Table 17: State Approaches to the Unwinding Period, January 2023
Table 18: State Actions to Coordinate with Medicaid Managed Care Organizations During the Unwinding Period, January 2023
Table 19: Medicaid Renewal Communications During the Unwinding Period, January 2023
Table 20: Ongoing or Planned Actions to Update Mailing Addresses Before the End of the Continuous Enrollment Provision, January 2023
Table 21: State Follow-Up on Returned Mail, January 2023
Table 22: Eligibility and Call Center Staff Vacancy Rates, January 2023
Table 23: Planned Actions to Increase Eligibility Staff Capacity for Processing Renewal During the Unwinding Period, January 2023
Table 24: State Plans for Publishing Selected Data Measures on State Websites During the Unwinding Period, January 2023

Q&A: Implications of the Ruling on the ACA’s Preventive Services Requirement

Published: Apr 4, 2023

Note: This post was updated on April 4, 2023, to include additional details and a table showing potentially affected preventive services.

On June 21, 2024, the 5th Circuit Court of Appeals affirmed the district court’s ruling that the ACA’s requirement to cover without cost-sharing services recommended by United States Preventive Services Task Force (USPSTF) is unconstitutional. However, the 5th Circuit ruled that a nationwide remedy was not proper and that only the plaintiffs are permitted to exclude USPSTF recommended services from their plans. The Appeals Court sent back to the district court the plaintiffs’ claim that the Secretary of Health and Human Services’ ratification of HRSA and ACIP recommendations violates the Administrative Procedure Act for further briefing and a judgment.

On March 30, 2023, a judge in the U.S. District Court in the Northern District of Texas issued a final judgment in a court case challenging the provision of the Affordable Care Act (ACA) that requires most private health plans to cover a range of preventive services without any cost-sharing for their enrollees. Having concluded in September that aspects of the requirement were unconstitutional and violated religious rights, the judge’s remedy in the Braidwood Management v. Becerra imposes new limits on the government’s ability to enforce those requirements nationwide. This Q&A summarizes some of the key issues related to the ruling.

What does the ruling mean for the public?With about 100 million privately insured people using preventive services required by the ACA to be covered without out-of-pocket costs, the preventive services coverage requirement is the provision of the ACA that affects the broadest number of people, and it has been enormously popular with the public. Because of the ACA requirement, the vast majority of private health plans have to cover a range of preventive services and cannot impose deductibles or copays for them. If the ruling stands, over time, millions of people could end up paying more for preventive care and some may lose access to certain services. However, as sweeping as the ruling is, it does not completely and immediately wipe out preventive services coverage under the ACA.

That’s because the ruling applies specifically to services recommended by the US Preventive Services Taskforce (USPSTF) that were made after 2010 when the ACA was enacted. The ruling would not overturn coverage requirements for vaccines recommended by the Advisory Committee on Immunization Practices (ACIP), women’s preventive health services (such as contraception, well women care and prenatal care, breastfeeding support services, and intimate partner violence screening) recommended by the Health Resources and Services Administration (HRSA),  or services for children and young adults recommended by Bright Futures, though the plaintiffs had asked that those be struck down as well and that decision could be appealed. The ruling also only applies to updates to or new USPSTF recommendations issued since March 2010, when the ACA was enacted. It would effectively lock in place coverage requirements based on evidence from 13 years ago.

The ruling separately finds that the mandate to cover pre-exposure prophylaxis (PrEP), a medication taken to prevent HIV, violates the plaintiffs’ religious rights under the Religious Freedom Restoration Act (RFRA). While the RFRA remedy is limited specifically to the plaintiffs, because PrEP was recommended by the USPSTF after 2010, the medication and certain ancillary lab services can now be subject to out-of-pocket costs across all health plans and plans could elect to drop coverage altogether.

Coverage will not necessarily change immediately. Although the ruling is effective immediately, in many cases, health plan contracts are in place for the calendar year, and employers do not typically make changes to coverage or cost midyear. (It may be easier for plans to change formularies to allow for cost-sharing with respect to impacted drugs.)

Will cancer screenings be covered by insurance plans without out-of-pocket costs?

Screenings like mammography and cervical cancer screening would still be covered without out-of-pocket costs because they were recommended by the USPSTF prior to March 2010. Although colorectal cancer screening was included as a recommended service in 2010, it was limited to adults ages 50 to 75. In 2021, the USPSTF expanded their colorectal cancer screening recommendation to also include adults ages 45 to 49. Therefore, because of this ruling, people in their late 40s may begin to face cost barriers to colorectal screening. Similarly, lung cancer screening with low dose CT scans for adults aged 50 to 80 years with a 20 pack-year smoking history and currently smoke or have quit within the past 15 years was recommended in 2021 and could therefore be subject to out-of-pocket costs.

What are some examples of services that may now be subject to out-of-pocket costs?

Any service that was first recommended by USPSTF after March 2010 (and is not also recommended by another group like HRSA or ACIP) would no longer be required to be covered without out-of-pocket costs. For example, services and medications like statins to prevent heart disease, lung cancer screening, PrEP to prevent HIV, and medications to lower the risk of breast cancer (e.g., tamoxifen) for high-risk women may now be subject to copays, deductibles, or coinsurance.

Major Additions and Revisions to USPSTF Recommendations Made On or After March 23, 2010

Additionally, because some USPSTF recommendations that were in place before March 2010 have since been changed, there could be some groups of people who lose access to certain types of no-cost preventive care.  The USPSTF typically updates its recommendations every five years so that some of the recommendations could have changed slightly from the recommendation that was in place in 2010. This is the case with colorectal cancer screening discussed above and with HIV screening which was initially only recommended for high risk individuals and is now recommended for the general population.

Why were these preventive services originally included in the ACA?

One of the reasons this provision was included in the ACA was because research showed that cost-sharing, even in small amounts, reduces the likelihood that people use preventive services. Millions of people each year report delaying or forgoing needed health care due to costs.

The USPSTF is a group of independent experts that use a rigorous evidence-based process to review research, weighing both the benefits and risks of services. The group recommends services where there is sufficient evidence that the benefits of screening or other preventive care outweigh the risks associated with those interventions.

In the ACA, the preventive care coverage mandate was tied to recommendations by the USPSTF and other groups as a way of having a standard definition of what preventive care means, including changes over time as new evidence becomes available.

What is PrEP and how will the ruling affect access to it?PrEP is a medication that is 99% effective at preventing HIV through sex and at least 74% effective at prevention through injection drug use. Because of its effectiveness, PrEP has been a cornerstone of the federal plan to address HIV in the U.S.

While some health plans could opt to drop PrEP coverage altogether, we are more likely to see plans requiring copays, coinsurance, or deductibles. For generic PrEP, out-of-pocket costs might be nominal (the cash price for the drug is about $30 per month); for a brand name drug, particularly the new long acting injectable formation, cost-sharing could be substantial. For example, some enrollees could face a 20% or 50% cost in coinsurance for a $2,000 per month drug. Enrollees may also face cost-sharing for some of the ancillary care that is necessary for PrEP users, such as certain labs and provider visits. Before the ruling, these had been covered without cost-sharing following a 2021 clarification from the federal government that the PrEP recommendation encompassed those ancillary services.

Can states preserve coverage for these benefits?

There’s a long history of states regulating private insurance and mandating coverage of certain services, including some of these preventive services before the Affordable Care Act took effect. But there are real limits to what states can do—for example, they cannot regulate self-insured employer plans, which cover most people with private insurance, including 64% of people with employer-based coverage. So while states can, and are moving to, fill in some of the gaps that this ruling leaves, big gaps would likely remain.

Are these rulings final or will there be more legal action ahead?The Biden administration is appealing this ruling and will seek a stay of this remedy from the Fifth Circuit Court of Appeals. The Fifth Circuit may or may not issue that stay or do so in an expedient way, and the rulings could be appealed to the Supreme Court, specifically to what is known as the “shadow docket,” which means that the Supreme Court would review the issue of the stay, not the merits of the case as a whole. However, the merits of the case itself could eventually be reviewed by the Supreme Court.

What broader implications does this ruling have for the ACA?This is not the potentially fatal blow to the ACA like previous court cases, but it would limit a very popular benefit that millions of people use. For people who use preventive services, a key to access is what people have to pay out of their own pockets. Regardless of your plan, these ACA-required preventive services were covered without cost-sharing, meaning that the individual didn’t pay for the services. But if these rulings hold, individuals may have to pay something for the affected services as insurers review what is covered and by how much. This is the first time a court has ruled that the ACA preventive services coverage requirement other than the contraceptive coverage requirement violates employers’ religious rights. This has the potential to open the door to employers objecting to other services, such as vaccines.

Additional Resources:

Preventive Services Use Among People with Private Insurance Coverage

Explore an analysis of preventive services that finds roughly 100 million people received ACA-required preventive services with no patient cost-sharing in a typical year.

Explaining Litigation Challenging the ACA’s Preventive Services Requirements: Braidwood Management Inc. v. Becerra

Learn about the implications of the most recent legal challenge contesting the ACA requirement that most private insurance plans cover specific preventive care items and services at no cost to patients.

PrEP FAQs

Answer key questions about pre-exposure prophylaxis (PrEP) and its coverage, which prompted the court challenge.

Many Women Use Preventive Services, but Gaps in Awareness of Insurance Coverage Requirements Persist: Findings from the 2022 KFF Women’s Health Survey

Review findings on women’s receipt of cancer screenings and other preventive services as well as knowledge of insurance coverage requirements for these services.

Preventive Services Covered by Private Health Plans under the Affordable Care Act

Read a summary of the federal requirements for coverage for preventive services in private plans, major updates to the requirement, and recent policy activities.

Preventive Services Tracker

Explore the adult preventive services most private plans must cover, including a summary of the recommendation, the target population, and related federal coverage clarifications.

Analysis of National Trends in Medicaid and CHIP Enrollment During the COVID-19 Pandemic

Authors: Bradley Corallo and Sophia Moreno
Published: Apr 4, 2023

Note: To get the latest data on Medicaid enrollment, disenrollment, and procedural disenrollments, visit KFF’s Medicaid Enrollment and Unwinding Tracker. The analysis below uses CMS data about Medicaid and CHIP enrollment through December 2022, providing information about Medicaid enrollment levels during the pandemic.

This data note looks at national and state-by-state Medicaid and CHIP enrollment data through December 2022. After declines in enrollment from 2017 through 2019, preliminary data for December 2022 show that total Medicaid/CHIP enrollment grew to 92.3 million, an increase of 21.2 million from enrollment in February 2020 (29.8%), right before the pandemic and when enrollment began to steadily increase (Figure 1).1  Increases in enrollment may reflect changes in the economy, changes in policy (like recent adoption of the Medicaid expansion in the Affordable Care Act), and the temporary continuous enrollment provision created by the Families First Coronavirus Response Act (FFCRA). Under the continuous enrollment provision, states generally cannot disenroll Medicaid enrollees while the provision is still in effect and in exchange, states receive a temporary increase in the federal Medicaid match rate. The continuous enrollment provision has halted churning in Medicaid – the temporary loss of coverage in which enrollees disenroll and then re-enroll within a short period of time – in addition to preventing Medicaid coverage loss during the pandemic. As part of the Consolidated Appropriations Act, signed into law in December 2022, Congress set an end to the continuous enrollment provision on March 31, 2023, and will phase down the enhanced federal Medicaid matching funds through December 2023. States that accept the enhanced federal funding can resume disenrollments beginning in April 2023 but must meet certain reporting and other requirements during the unwinding process. KFF estimates that Medicaid/CHIP enrollment will reach roughly 95 million enrollees in March 2023 before states may resume disenrollments during the “unwinding” of the continuous enrollment provision.

Medicaid/CHIP Enrollment Has Increased Since The Start Of The Pandemic

The information in this data note is based on KFF analysis of the Centers for Medicare and Medicaid Services (CMS) Performance Indicator Project Data. Medicaid/CHIP enrollment data are submitted monthly by state Medicaid agencies and, with each monthly update, states often revise the previous months’ enrollment to include retroactive enrollment and to better align with reporting criteria. Except for the latest month’s enrollment (December 2022), this brief reports data from the updated enrollment reports for all other months to reflect the most current enrollment data possible. However, the data presented in this brief will differ from those presented in monthly Medicaid and CHIP Enrollment Snapshots published by CMS, which use exclusively preliminary enrollment reports for all months.

Medicaid/CHIP enrollment increased following the implementation of the Affordable Care Act (ACA) but was declining in the two years prior to the pandemic. Following the implementation of the ACA Medicaid expansion to low-income adults in 2014, there were large increases in Medicaid and CHIP enrollment across states that followed steady growth in coverage of children over the past decade. These increases reflected enrollment among newly eligible adults in states that implemented the expansion as well as enrollment among previously eligible adults and children due to enhanced outreach and enrollment efforts and updated enrollment procedures tied to the ACA. This trend began reversing when enrollment started to decline in 2018 and continued to decline in 2019. Total enrollment fell from 73.3 million in December 2017 to 71.0 million in December 2019, a decline of 2.3 million people or 3.1%. Month-to-month enrollment declines slowed but continued until February 2020. The declines in enrollment, in part, reflected a robust economy, but experiences in some states suggested that they may have also reflected enrollment losses among people who were still eligible for coverage due to challenges completing enrollment or renewal processes.

Data show that Medicaid/CHIP enrollment is increasing amid the coronavirus pandemic, growing by 21.2 million enrollees or 29.8% from February 2020 to December 2022. Over this period, all states experienced total Medicaid/CHIP enrollment growth ranging from 18.1% to 80.6% (Figure 2).2  The state with the largest growth since February 2020, Oklahoma, implemented the Medicaid expansion on July 1, 2021. Four other states have implemented expansion since 2020 – Utah and Idaho in January 2020, Nebraska in October 2020, and Missouri (where the state began to process applications3  in October with coverage retroactive to 7/1/2021) – contributing to higher-than-average rates of enrollment growth in these states as well.

Enrollment From February 2020 To June 2021 Has Increased In Every State.

Virtually all growth was concentrated in Medicaid, which grew by 32.6% (21.0 million enrollees) from February 2020 to December 2022 data (Figure 3). Conversely, CHIP has seen less enrollment growth since February 2020 (3.1% or 211,000 enrollees) and several states (17) have seen declines in CHIP enrollment from February 2020 through December 2022 reports. These declines in CHIP enrollment for some states could reflect changes in family income, causing children to move from CHIP to Medicaid coverage. As discussed below, all states reported increases in child enrollment for Medicaid/CHIP overall during this time period.

Medicaid Enrollment Growth Has Greatly Outpaced CHIP Enrollment During The Pandemic.

Adult enrollment in Medicaid/CHIP has increased rapidly during the pandemic, growing by 41.5% from February 2020 through December 2022 enrollment reports (Figure 4). This growth amounts to an additional 14.2 million adults in the 49 states and DC that report adult/child monthly enrollment (Arizona does not report children or adults separately). As mentioned above, five states began newly enrolling expansion adults since January 2020 (Idaho, Missouri, Nebraska, Oklahoma, and Utah), contributing to increased adult enrollment. Child enrollment grew as well, but at a slower pace: 18.2% or 6.4 million enrollees in the same period. Still, every state reporting these data saw an increase in child Medicaid/CHIP enrollment from February 2020, despite declines in CHIP enrollment in some states (as discussed above).

Adult Enrollment In Medicaid/CHIP Has Outpaced Child Enrollment During The Pandemic.

Many could lose coverage as states resume disenrollments starting in April 2023, once the continuous enrollment provision expires. As part of the Consolidated Appropriations Act, signed into law in December 2022, Congress set an end to the continuous enrollment provision on March 31, 2023, allowing states to resume disenrollments in April 2023, though states must meet certain reporting and other requirements during the unwinding process. plan to take the full 12 to 14 months allowed by CMS for completing redeterminations and returning to normal operations, though some states will complete the process more quickly, with five states planning to take 9 to 12 months and one state planning to take less than 9 months (data are currently unavailable for two states, Ohio and Texas). During this time, millions could be disenrolled from Medicaid if they no longer qualify or if they face administrative barriers during renewal even if they continue to be eligible. How states manage the large volume of redeterminations during the “unwinding” of the continuous enrollment provision, as well as how states engage with enrollees and other stakeholders, will impact the continuity of coverage for millions of Medicaid enrollees.

Appendix Table 1: Total Monthly Enrollment In Medicaid/CHIP By State, Selected Months
  1. Medicaid/CHIP enrollment reports are submitted monthly by state Medicaid agencies, reflecting enrollment on the last day of the month. With each update, states often revise data for the previous month(s) to better align with reporting criteria, such as including retroactive enrollment or other criteria. December 2022 data are preliminary and subject to change; all other months presented in this brief are based on updated enrollment reports. The data presented in this brief differ from those reported in monthly “Medicaid & CHIP Enrollment Snapshots” published by CMS, which use exclusively preliminary enrollment reports for all data reported. ↩︎
  2. Although all states report an increase in Medicaid/CHIP enrollment from February 2020 through December 2022, some states have occasionally reported month-to-month decreases in their updated enrollment reports starting in late 2020 and into 2022 (AK, CT, DE, ID, IL, IN, KS, KY, LA, MT, NM, ND, PA, RI, UT, and WV). Generally, these month-to-month declines appear sporadic and so do not likely represent a trend. In July 2021, Kentucky’s total Medicaid/CHIP enrollment decreased by 6.7% and the state attributed the decrease to removing individuals who had been receiving temporary coverage under the state’s presumptive eligibility policy during the pandemic, according to the CMS Enrollment Snapshot for July 2021. Month-to-month decreases in Medicaid/CHIP enrollment generally represent data reporting issues that have not yet been resolved by states, or they may represent data reporting corrections where historical data has not yet been corrected. Nine states (AK, GA, IA, KS, MD, MO, MT, NJ, and ND) reported a decline in total Medicaid/CHIP enrollment from the updated November 2022 report to the preliminary December 2022 report. These declines were generally small and reflect preliminary enrollment data for December 2022, which is typically updated in subsequent enrollment reports as states update their enrollment counts (for example, to better capture retroactive enrollment or to better align with CMS’s reporting criteria). In many cases, updated reports show slight increases in enrollment from preliminary reports. ↩︎
  3. Missouri has also expanded Medicaid since 2020. Medicaid coverage under expansion began when the state started processing applications in October 2021, with coverage retroactive to July 1, 2021, consistent with a state supreme court order. However, news reports indicate that the state was slow to process applications and enroll newly eligible expansion adults, although the state has worked with CMS to streamline the enrollment process and had made improvements in average application processing times as of September 2022. The state has still had higher-than-average enrollment increases from February even prior to implementing expansion. ↩︎
News Release

After Dobbs, Survey Seeks to Understand Telecontraception Clients Better

Published: Apr 4, 2023

According to a new KFF survey with a nonprobability sample of clients from four online sources of contraception, one in four clients said they got emergency contraception to have on hand because of the Supreme Court’s decision to overturn Roe v. Wade. Additionally, more than a fifth (22%) said they have considered sterilization, 12% reported that they considered switching to or started using a more effective method of birth control, and eight percent said that they began to use birth control because of the Dobbs decision. These findings were consistent across states regardless of whether or not abortion was banned.

Respondents said they turned to telecontraception companies for birth control for various reasons, but the most frequently cited reason is that the birth control is delivered to their home (26%). Others noted privacy, difficulties getting appointments, and prior negative interactions with in-person care. Larger shares of LGBT+ individuals compared to non-LGBT+ cited a previous negative experience with an in-person provider as their main reason for getting their most recent birth control prescription online (11% vs. 7%).  Nearly one in five (18%) respondents cited the COVID-19 pandemic as the reason they first accessed birth control online.

These findings come from the KFF Survey of Online Contraception Clients, which was sent to active contraceptive clients over the age of 18 who had received contraception from their company in the past year (272,800 clients) by each of the four participating telecontraception companies. The survey was fielded from October 13 to December 8, 2022. A total of 5,925 telecontraception clients participated in the survey. This survey is based on a nonprobability sample and so its results are not generalizable to all telecontraception users. Learn more about who uses telecontraception and why in the brief, “Who Uses Telecontraception and Why? A Closer Look at Clients of Four Telecontraception Companies.”

Who Uses Telecontraception and Why? A Closer Look at Clients of Four Telecontraception Companies

Published: Apr 4, 2023

Key Takeaways

  • Based on the findings of a non-probability sample of 6,000 survey respondents from four telecontraception companies, the leading reason respondents cite for getting their most recent birth control via telecontraception is that it is delivered to their home (26%). Others cite privacy, difficulties getting appointments, and prior negative interactions with in-person care. Nearly one in five (18%) of respondents cited the COVID-19 pandemic as the reason they first accessed birth control online.
  • The vast majority of respondents using telecontraception are women and two-thirds are 35 and younger, including larger shares who don’t have health insurance or who are LGBT+ compared to a nationally representative sample of contraceptive users in U.S. population.
  • The most frequently received contraceptive method reported by telecontraception respondents is oral contraceptives (91%), followed by emergency contraceptive pills (9%). Nearly three in ten (29%) respondents overall say they purchased emergency contraception through an online company in the last 12 months.
  • About three in four respondents with private insurance or Medicaid who tried to use their insurance for telecontraception paid nothing out-of-pocket for their birth control method. Half (51%) of those who did not use insurance paid between $31 and $50 and about a quarter (24%) paid over $50 for their birth control. The companies do charge a consultation or membership fee for all of their users and this cost is not covered by insurance.
  • Four in ten (43%) respondents say they do not have a regular doctor and one in five (20%) have never had an in-person birth control visit.
  • Almost a quarter (24%) of respondents report they have gotten emergency contraception to have on hand and over a fifth (22%) have considered sterilization in response to the Supreme Court’s decision to overturn Roe v Wade. These findings were fairly consistent across states regardless of whether abortion was banned or not.

Introduction

In recent years there has been increased interest in making contraception more accessible, particularly outside of traditional clinical settings. These efforts have gained urgency in wake of the Supreme Court decision in Dobbs v Jackson Women’s Health, which overturned Roe v. Wade, and the COVID-19 pandemic. However, even prior to both of these events, online companies had started to offer consumers the option of having contraceptives delivered to their home without needing to go for an in-person healthcare visit. While only a small share of people say they have used these online platforms, companies have reported a rapid growth in clients during the COVID-19 pandemic and an increase in emergency contraception orders since the Dobbs decision. There has been very little research to date on who uses telecontraception and why they choose to get their birth control online aside from a recent study focused on one online platform. In order to learn more about who is using telecontraception in the Fall of 2022, KFF conducted a survey of current clients from four telecontraception companies. The responses from individuals who responded to the survey across the four companies have been combined to give a snapshot of who is using telecontraception.

Methods

The KFF Survey of Online Contraception Clients was designed and analyzed by researchers at KFF. The survey was conducted via SurveyMonkey using a unique survey link that was sent to four telecontraception companies who then sent the link to their active contraceptive clients over the age of 18 who had received contraception from their company in the past year (272,800 clients). The survey was fielded from October 13 to December 8, 2022. A total of 5,925 telecontraception clients participated in the survey. Clients had an opportunity to be entered into a drawing for twelve $100 Amazon gift cards (three for each company) by submitting their email after completing the survey.

This survey is a non-probability sample based on telecontraception clients that responded to the survey from the four companies. There were not large differences in demographics and survey responses across the four companies surveyed, so the data for survey respondents from all four companies were combined to give an overall picture of telecontraception clients. These data were collected using a non-probability sampling frame, and the results are not necessarily representative of the broader population that receives online contraception.  However, the overall demographics of telecontraception clients from this sample closely matched a similar sample of women who said they have received a prescription or obtained a health care service from an online company in the prior 12 months obtained from KFF’s 2022 Women’s Health Survey, a nationally representative sample of women (See Appendix Table 1). Therefore, no additional adjustments, such as weighting, were made to the sample.

Demographics of Telecontraception Survey Respondents

This report presents a snapshot of telecontraception clients of four companies who responded to the KFF survey. The vast majority (97%) of responding telecontraception clients identify as women, while 2% are non-binary, 1% prefer not to say, and less than 1% identify as men, transgender or another gender. The four companies surveyed for this project do not offer male condoms, which explains why there are so few male clients in the sample.

Telecontraception clients responding to this survey ranged in age from 18-54. The largest share of those using telecontraception are between the ages of 26-35 (46%), about a third are ages 18-25 (32%), and over one in five are ages 36-54 (22%). Compared to females using short acting reversible contraception (such as the pill, injectables, patches or condoms, (SARC)) from the nationally representative KFF Women’s Health Survey, larger shares of telecontraception respondents fell in the 26-35 age range (46% vs. 35%) and smaller shares fell in the 36-54 age range (22% vs. 35%).

The majority of telecontraception survey respondents are White (66%), 17% are Hispanic, less than one in ten are Asian (9%), Black (8%), and American Indian/Alaska Native (1%). Larger shares of telecontraception respondents were White compared to those using SARC nationally (66% vs. 55%). Nearly two-thirds (65%) of telecontraception survey respondents earn more than $25,000 a year, while over one in four (27%) earn less than $25,000 a year, and another 9% prefer not to say (Figure 1).

Figure 1: Key Demographics of Telecontraception Survey Respondents

Seven in ten respondents have private insurance (73%), about one in ten (9%) have Medicaid coverage, and almost one in five (19%) are uninsured. Compared to our nationally representative sample of SARC users, the share of those in the survey who have Medicaid coverage is smaller (9% vs. 20% nationally) and those who are without insurance is larger (19% in this survey vs. 9% nationally).

Figure 2: Insurance Coverage of Telecontraception

The largest share of respondents live in the South (40%), nearly a quarter are in the West (23%), one in five reside in the Midwest (20%), and 17% live in the Northeast United States, which is very similar to SARC users in our nationally representative sample (Appendix Table 1).

Nearly a quarter (23%) of respondents are LGBT+, three-quarters are non-LGBT+ (75%), and 3% prefer not to say. The share of respondents who are LGBT+ is slightly higher than the share of females who use SARC and identify as LGBT+ (23% vs. 17%).

Finally, a larger share of respondents are single, separated, widowed, or divorced compared to married or living with a partner (56% vs. 44%) and eight in ten have some college education compared to 15% with less than a college education (85% vs. 15%) (Table 1).  Smaller shares of SARC users nationally are single, separated, widowed or divorced (42% vs. 56%) and larger shares of telecontraception respondents have some college education compared to SARC users nationally (85% vs. 75%).

Additional Demographics of Telecontraception Survey Respondents

Experiences with Telecontraception

While telecontraception may be a new avenue for accessing contraception for many, nearly half (49%) of all telecontraception clients who responded to the survey say this is not the first time they have received their birth control from an online contraception company. Among those who have received birth control multiple times from an online contraception provider, the majority (86%) have been clients at the company for which they completed the survey for at least a year (Figure 3). The length of time people had been clients varied by company, with the majority of respondents at two of the companies saying they had been clients for at least a year (Company A = 85% and Company B = 95%), while about half of respondents at the other two companies say they have been clients for at least a year (Company C = 45% and Company D = 51%). All of the participating companies have been in business for a number of years.

Figure 3: Almost Half of Telecontraception Respondents Are Repeat Clients and Most Repeat Clients Have Been Customers For At Least a Year

One in five (20%) respondents say they have received birth control from at least one additional telecontraception company. This also differed by company, with Company A and Company B having smaller shares of respondents who have received birth control from a different online company (18% and 14%, respectively) compared to respondents at Company C and Company D (54% and 65%, respectively).

Many telecontraception companies utilize paid search engine marketing and social media to advertise and the majority of respondents say they first found out they could be prescribed birth control online through social media (59%), followed by Google search (19%), friends (9%), family (4%), and a healthcare provider (2%) (Figure 4).

Social Media Is the Main Way Respondents Find Out About Telecontraception

Reasons for Accessing Birth Control Online

Although, telecontraception companies have reported they have seen a proliferation of clients due to the COVID-19 pandemic, most (82%) respondents say the pandemic was not the reason they accessed birth control online. Only one in five (18%) respondents say they first accessed birth control online because of the COVID-19 pandemic. Among those who first accessed birth control online because of the COVID-19 pandemic, the most widely cited reason was they could not get an in-person appointment (42%), followed by just over a quarter (27%) who were scared or nervous to go for in-person care, and 16% did not want to go to a pharmacy to pick-up their birth control prescription. A small share (5%) say they decided to start using birth control because of the pandemic and another one in ten cited another reason (Figure 5).

Figure 5: Nearly One in Five Telecontraception Clients Accessed Birth Control Services Online Because of the COVID-19 Pandemic

Among all respondents, the most frequent reason people cite for getting their most recent birth control via telecontraception is that the birth control is delivered to their home (26%). The second most frequent reason they say is they didn’t have insurance and couldn’t afford a doctor’s appointment (15%). Other reasons include not being able to get a doctor’s appointment (12%) or not having time for a doctor’s appointment (10%), as well as not wanting to interact with a provider (13%) or having a previous negative experience with an in-person provider (8%). Larger shares of LGBT+ individuals compared to non-LGBT+ cite a previous negative experience with an in-person provider as their main reason for getting their most recent birth control prescription via telecontraception (11% vs. 7%).

Among all respondents, smaller shares say the cost of birth control was more affordable (6%), they had privacy concerns (3%), a pharmacy is too far (1%), or they have always gotten birth control online (1%), and 5% cite some other reason (Figure 6).

Main Reason for Getting Most Recent Birth Control From Telecontraception Company

Individuals accessing telecontraception can get new prescriptions for contraception via a telehealth visit (typically asynchronous) with an online provider or refill an existing prescription. The majority of respondents (66%) say they most recently refilled or renewed a birth control prescription they were already using. Just over one in five (21%) say they obtained a different brand of their previous birth control method, like an oral contraceptive brand, or possibly a generic. Only 7% of respondents say they received a new birth control method and another 7% say the prescription they most recently received was their first time ever using birth control.

Compared to respondents who had previously received birth control online, smaller shares of respondents receiving birth control for the first time from a telecontraception company say their most recent birth control method was a refill or renewal (52% vs. 79%). Larger shares of new telecontraception clients compared to returning clients say they got a different brand of their previous method (26% vs. 15%) or got a new birth control method (10% vs. 4%). Just over one in ten (11%) new telecontraception clients say this was their first time ever using birth control (Figure 7).

Majority of Telecontraception Respondents Receive a Birth Control Prescription Refill or Renewal

Contraceptive Methods Prescribed

Among respondents, the most frequently obtained contraceptive method is oral contraceptives (91%), followed by emergency contraceptive pills (9%) (Figure 8). Five percent of respondents received female condoms, 4% monthly contraceptive rings, 3% injectable contraception, 2% contraceptive patch, and 1% received the one-year ring, Annovera. One in ten (10%) respondents most recently obtained more than one contraceptive method and 95% of those who got more than one contraceptive method received emergency contraception and almost one third (31%) got female condoms. Female condoms and emergency contraception are often included as add-ons at the end of an order. Nearly three in ten (29%) respondents overall say they purchased emergency contraception through an online company in the last 12 months.

Figure 8: The Majority of Telecontraception Survey Respondents Got a Prescription for Oral Contraceptives

Cost and Coverage

Since 2012, the ACA’s contraceptive coverage requirement has required all new private plans to cover FDA-approved contraceptive methods for women without cost-sharing from a participating provider. For individuals with Medicaid coverage, family planning services have been a mandatory benefit category that all state programs must cover without any cost-sharing, but services must be obtained from a Medicaid-participating provider. One of the companies that participated in this survey does not accept Medicaid and the other three do, but do not accept Medicaid in all states.

When asked how much they had to pay out-of-pocket, including co-pays, for their most recent birth control prescription or product, the majority of respondents say they did not have to pay anything (55%). For those with some out-of-pocket costs, just over one in five (21%) paid $31-50, 9% paid more than $50, 8% paid $1-15, and 7% paid $16-30 (Figure 9). However, this varied significantly among those with some type of health insurance coverage and those without insurance (See Insurance Coverage of Telecontraception above). About three in four individuals with private insurance or Medicaid who tried to use their coverage paid nothing out-of-pocket for their birth control compared to only 6% of individuals without insurance who had no out-of-pocket costs. Some companies provide free birth control for women without insurance who are in financial need. The largest share of those without insurance (51%) paid $31-50 and about a quarter (24%) paid over $50 for their birth control prescription or product. Individuals without insurance could get free or low-cost birth control from a federally funded Title X clinic or federally qualified health center, however, they may choose to pay for telecontraception for other reasons like convenience.

Out-of-Pocket Costs for Telecontraception Prescriptions

Despite the requirement that most private insurance plans cover contraceptive services and supplies free of cost-sharing, there may be multiple reasons individuals with private insurance may have out-of-pocket costs. The telecontraception company may not have had a contract with their insurance plan, the telecontraception company could have been considered out of network, or the client might be enrolled in a plan that is exempt from the contraceptive coverage requirements, such as those that are grandfathered, or those with coverage through an employer that is exempt on religious grounds.

When asked about the last time they got a birth control method from a telecontraception company, the majority (87%) of insured respondents tried to use their insurance, while 13% did not (Figure 10). The top reason for not trying to use insurance was it was too complicated (18%). Another 16% of those who did not try to use their insurance say they did not know they could use their coverage. One in seven (14%) say the telecontraception company did not accept their insurance, while 12% did not try to use their insurance because they were concerned their parents or partner would see a charge for birth control. Seven percent say the brand of birth control they wanted was not covered by their insurance. Other reasons specified for not trying to use insurance included: the price was affordable without insurance, they hadn’t had a chance to update their insurance information, and they didn’t want their insurer to know about their birth control use.

Figure 10: Most Respondents With Insurance Tried to Use Their Plans, but Among Those Who Didn’t, One in Five Said It Was Too Complicated

For individuals who tried to use their insurance for their telecontraception prescription, one in five (21%) say their insurance imposed limitations on the number of months of birth control they could get, while the majority (55%) did not experience limitations (Figure 11). About a quarter of respondents who tried to use their insurance did not know if they experienced limitations on the number of months of birth control they could get. The share reporting that they experiencing limitation did not differ between those with private insurance or Medicaid (data not shown).

Insurance Limitations on Number of Months of Birth Control Received Via Telecontraception

The largest share of respondents (65%) prescribed oral contraceptives say they receive three to five packs of pills at a time. While research has shown that best practice is to offer oral contraceptive users an extended supply of oral contraceptive pills such as a 12 month supply, few women receive a 12-month supply of contraceptives. Eight percent of respondents say they get 6 or more packs at a time, while 27% receive one to two packs at a time.

However, there are significant differences between those without insurance and those with Medicaid coverage compared to private insurance. Larger shares of respondents who used their Medicaid coverage (14%) or those that did not use insurance (13%) received six or more packs of pills compared to just 5% of those using private insurance (Figure 12). Currently, Medicaid programs in sixteen states and DC cover a 12-month supply of oral contraceptives at a time, which likely explains the larger share of individuals with Medicaid coverage receiving a 12-month supply. Some of the telecontraception companies also offer contraception at a discounted price if a larger number of packs at purchased at one time, which may be why a larger share of individuals without insurance received 6 or more packs. Twenty states and DC require state regulated insurers to cover an extended supply of contraceptives at one time, but this policy doesn’t include all plans (such as those that are self-funded) and there are still issues with implementation in getting insurance to cover more than 1 to 3 months of contraception at a time due to health plans’ concern over waste and increased costs.

Months of Oral Contraception Received via Telecontraception by Insurance Used

Experiences Using Telecontraception

The telecontraception clients responding to this survey were largely satisfied with the services they received and felt that telecontraception made it easier for them to take and refill their birth control. Ninety-one percent of survey respondents report that getting their contraception through an online company has made it easier for them to take or get refills for their birth control, while only 1% report it has made it harder. Eight percent say there has been no change (Figure 13). Individuals that are able to continuously take and refill their birth control with little to no barriers are less likely to have an unwanted pregnancy.

Most Telecontraception Respondents Say Getting Birth Control Online Has Made it Easier for Them to Take and Refill

The majority (98%) of respondents report they are satisfied with the birth control care they received from the telecontraception companies (Figure 14). Across the four companies, between 93% to 98% say they were satisfied with their care. Two percent of respondents report they are dissatisfied with the care they received, and 1% report they are neither satisfied nor dissatisfied.

Most Telecontraception Respondents Are Satisfied with the Birth Control Care They Receive from Online Companies

Most respondents say they received enough information about different birth control methods from a medical provider at the company of their choice. Half (53%) report they got enough information, and another 43% report they received more than enough information. Only 4% report they did not get enough information—across companies, this share ranged from 4% to 11%. However, a higher share of respondents who were using a birth control method for the first time report they did not get enough information (8%) compared to those getting a different brand (5%), a new method (5%), or a refill (4%) (Figure 15).

A Higher Share of First Time Birth Control Users Report Not Receiving Enough Information About Different Contraceptive Methods

Telecontraception clients generally receive birth control prescriptions by filling out a health questionnaire meant to screen for birth control contraindications, such as high blood pressure, smoking status, or a history of strokes. These questionnaires are then reviewed by healthcare providers, and depending on the policies of the state they reside in, the provider will communicate with the patient via text or chat or will have a video call with the patient to determine whether they are a good candidate for birth control and what method or brand they should use. Survey respondents were asked how they would prefer to engage with online medical providers when obtaining a new birth control prescription, and 57% prefer to message the online medical provider directly. Thirteen percent prefer video calls and 13% prefer phone calls. Sixty-six percent report they prefer filling out an online questionnaire that was reviewed by the medical provider. Four in ten (43%) would prefer to be able to engage with an online medical provider in more than one of these ways (Figure 16).

Most Telecontraception Respondents Prefer to Engage with Online Medical Providers through Direct Messages or Online Questionnaires

A somewhat higher share of Black respondents said they prefer to primarily engage with online medical providers via direct message compared to White respondents, and higher shares of Black, Hispanic and Asian respondents prefer to engage providers via video calls or phone calls. Somewhat higher shares of White respondents said they preferred to primarily engage with providers via a questionnaire (Table 2).

Preferences for Modes of Engaging with an Online Medical Provider Differ by Race/Ethnicity

Overall, 14% of respondents report that they had had concerns or complications with a birth control method they had been prescribed through an online platform and wanted additional information or a follow with a medical provider (Figure 17). Among those who had concerns or complications, 72% report they were able to follow up with a provider at the company and another 20% say they never tried to follow up, and eight percent say they were not able to follow up. Larger shares of Asian respondents (20%) and respondents ages 18-25 (18%) report having a concern or complication with a birth control method prescribed through an online platform compared to White respondents (13%) and older respondents (10% of those over age 36) (Table 3). Additionally, larger shares of those getting birth control for the first time or getting a new method or different brand say they had concerns or complications with their method compared to those getting a refill or renewal.

Figure 17: Most Telecontraception Respondents with Concerns or Complications Regarding Their Prescribed Birth Control Were Able to Follow-up With a Company Provider
The Share of Telecontraception Respondents Experiencing Concerns or Complications with Birth Control Methods Vary Across Groups

Connections to the Health Care System

For some, interacting with a telecontraception provider may be their only interaction with a health care provider, while others may use telecontraception for a convenient way to get birth control, but have other connections to the health care system through a brick-and-mortar clinic. Over half (55%) of respondents report they have a regular doctor or health care provider they usually see when they are sick or need routine care. Four in ten (43%) say they do not have a regular doctor, and another 3% say they were not sure. The share without a regular doctor is much higher than women overall in the U.S. (43% vs. 18%). Larger shares of younger respondents compared to older and LGBT+ individuals compared to non-LGBT+ do not have a regular doctor or health care provider. Nearly seven in ten respondents without insurance say they do not have a regular health care provider. Larger shares of Black respondents compared to White respondents and respondents in the Northeastern part of the U.S. compared to all other regions of the country say they have a regular doctor.

Regular check-ups give patients the opportunity to talk with their health care providers about a broad range of issues, such as preventive health services, role of lifestyle factors on health, and management of chronic health issues. Fifty-two percent of respondents say they have received an in-person annual wellness exam or check up in the past twelve months, while 46% have not. Among those who have a regular doctor or health care provider, 70% report they received an in-person annual exam or check-up in the past 12 months compared to just 30% of those without a regular doctor or health care provider (Figure 18 and Table 4).

Figure 18: A Larger Share of Those With a Regular Health Provider Have Had a Wellness Exam in the Past 12 Months
Only Half of Telecontraception Survey Respondents Have a Regular Health Care Provider

Eighty percent of respondents say they have had had an in-person birth control care visit where a doctor or health care provider had talked to them about their different birth control options at some point in their lives. Among this group, 17% say their last in-person visit was in the past year and 31% say it was one to two years ago. Another 35% report their last visit was in the last three to five years, and 16% say it was more than five years (Figure 19).

Figure 19: Majority of Telecontraception Respondents Have Had an In-Person Birth Control Visit With a Healthcare Provider to Discuss Different Birth Control Options

One in five (20%) telecontraception respondents report they have never had an in-person birth control visit (Figure 20). Higher shares of respondents ages 18-25 (36%), respondents who identify as LGBT+ (24%), those with Medicaid coverage (22%), and those who are uninsured (24%) report they had never had an in-person visit compared to respondents ages 26–35 and 36–49, those who identify as non-LGBT+, and those with private insurance. Over a third (32%) of Asian respondents and 28% of Hispanic respondents also say they have never had an in-person birth control visit, compared to 22% of Black respondents and 16% of White respondents.

One in Five Telecontraception Respondents Have Never Had an In-Person Birth Control Visit and Shares are Higher Among Certain Groups

Post-Roe Actions

On June 24, 2022 the Supreme Court issued their decision in Dobbs vs Jackson Women’s Health, and overturned Roe v Wade, which eliminated the federal constitutional standard that had protected the right to abortion. Now states can set their own policies banning or protecting abortion rights. As of April 2023, 13 states have banned abortion. After the Dobbs decision, telecontraception companies reported an influx of emergency contraception orders.

In response to the ruling, almost a quarter (24%) of respondents report that they have gotten emergency contraception to have on hand and over a fifth (22%) have considered sterilization. Twelve percent report that they have considered switching to or have started a more effective method of birth control, and eight percent have started using birth control due to the Dobbs decision (Figure 21).  These findings were fairly consistent across states regardless of whether abortion was banned or not.

A Quarter of Telecontraception Respondents Have Gotten Emergency Contraception to Have on Hand Since the Supreme Court's Dobbs Decision

There were some differences in these contraceptive considerations or actions by certain subgroups like race/ethnicity, income, insurance type, and sexual orientation (Table 5). Smaller shares of Black and Hispanic respondents (14% and 21%) compared to White respondents (26%) say they had considered sterilization in the wake of the Dobbs decision, but larger shares of Black and Hispanic respondents say they started birth control (15% and 12%) compared to White respondents (7%). Larger shares of those with lower incomes compared to higher incomes (14% vs. 6%) and those with Medicaid coverage or those without insurance (14% and 11% vs. 7%) compared to those with private insurance say they started birth control. A larger share of LGBT+ individuals compared to non-LGBT+ individuals say they got emergency contraception to have on hand (33% vs. 23%), considered sterilization (43% vs. 17%), and considered switching to or starting a more effective birth control method (20% vs. 10%) after Roe v Wade was overturned.

Certain Subgroups Have Made Different Contraception Considerations as a Result of the Dobbs Decision

Looking Forward

While telecontraception remains a relatively new avenue for accessing contraception and only a small share of people say they have accessed services through these platforms, it has been difficult to know the characteristics of telecontraception users and what their experience has been like. Those who responded to this survey are generally satisfied with their experience, say telecontraception has made it easier for them to get their birth control, and they appear to be getting enough information about different birth control methods. However, this is a limited convenience sample and may not be representative of the larger population of telecontraception clients. Telecontraception has provided a way for people to get their birth control without having to leave their home, which has been helpful for many during the COVID-19 pandemic. However, some are left paying out-of-pocket, especially those without insurance, for birth control methods that would otherwise be covered free of charge at a federally funded clinic or through their insurance. In addition, all users must pay a membership or consultation fee, even though their insurance or Medicaid would cover the full cost of a visit and supply if they went to an in-network provider. Many of those accessing contraception online do not have a regular doctor or have never had an in-person birth control visit, so this may be the only information they are getting about birth control methods. Because there are a limited number of birth control methods for them to choose from, telecontraception may not be a good fit for those wanting long-acting reversible contraceptive methods or more comprehensive contraceptive counseling.  However, for those who use reversible hormonal methods or seek emergency contraceptive pills, telecontraception offers privacy and convenience, which is valued by the respondents of this survey.

As reproductive health policies and abortion access becomes more restrictive in some states, online companies may play a greater role in expanding access to sexual and reproductive health care.

This work was supported in part by Arnold Ventures. We value our funders. KFF maintains full editorial control over all of its policy analysis, polling, and journalism activities.

We would like to thank Nurx, The Pill Club, Twentyeight Health, and Pandia Health for working with us on this project.

Demographics of Telecontraception Survey Clients Compared to Nationally Representative KFF Women's Health Survey

Access Problems And Cost Concerns Of Younger Medicare Beneficiaries Exceeded Those Of Older Beneficiaries In 2019

Published: Apr 3, 2023

Medicare is a primary source of health insurance coverage for several million people younger than age sixty-five who have long-term disabilities.

Published in the journal Health Affairs, this analysis compared measures of access to care, cost concerns, and satisfaction with care for beneficiaries younger than age sixty-five versus those ages sixty-five and older, using the 2019 Medicare Current Beneficiary Survey. It also compared beneficiaries in traditional Medicare with those in Medicare Advantage, given that a growing share of younger beneficiaries with disabilities are enrolled in private plans.

It finds that Medicare beneficiaries younger than age sixty-five reported worse access to care, more cost concerns, and lower satisfaction with care than beneficiaries ages sixty-five and older, regardless of their type of Medicare coverage. Among beneficiaries younger than age sixty-five in traditional Medicare, the share reporting cost concerns was highest among those without supplemental coverage.