Alcohol Deaths: National Trends and Variation by Demographics and States
Alcohol use disorder (AUD) is the most prevalent non-tobacco substance use disorder in the United States and over half of US adults (54%) say that someone in their family has struggled with an alcohol use disorder. Federal data show that 1 in 10 Americans (ages 12+) had an AUD in the past year and over 40% of drinkers reported binge drinking in the past month, yet only one-third of adults view alcohol addiction as a “crisis,” compared to over half who see opioids as such.
In early January 2026, the Department of Health and Human Services (HHS) released the updated 2025-2030 Dietary Guidelines for Americans (DGA). The report marks a departure from decades of guidelines that set recommendations to limit intake to specific daily caps (formerly one drink for women and two for men), instead advising people to “drink less for better overall health.” Without clear thresholds, it may be harder for individuals and clinicians to identify when clinical screening or treatment is warranted. This challenge is compounded by low public awareness of alcohol’s health risks. For example, fewer than 40% of US adults are aware that alcohol is a carcinogen, compared to over 90% awareness of tobacco’s link to cancer. In addition, clinical screening for AUD is inconsistent and treatment rates for AUDs are low. For those receiving or seeking treatment, a range of recent federal policy actions may affect future treatment access, including substantial coverage losses in Medicaid and Marketplace coverage.
This analysis largely focuses on the narrowest definition of alcohol deaths known as “alcohol-induced deaths” (referred to as “alcohol deaths” throughout the brief). These alcohol deaths are caused by conditions directly attributable to alcohol consumption, such as alcohol-associated liver diseases. Broader definitions of alcohol deaths extend this definition to also encompass cases where an alcohol-induced condition was a contributing factor, but not the underlying cause of death. Key takeaways from this analysis of CDC WONDER data from 2014 to 2024 include the following:
Key takeaways:
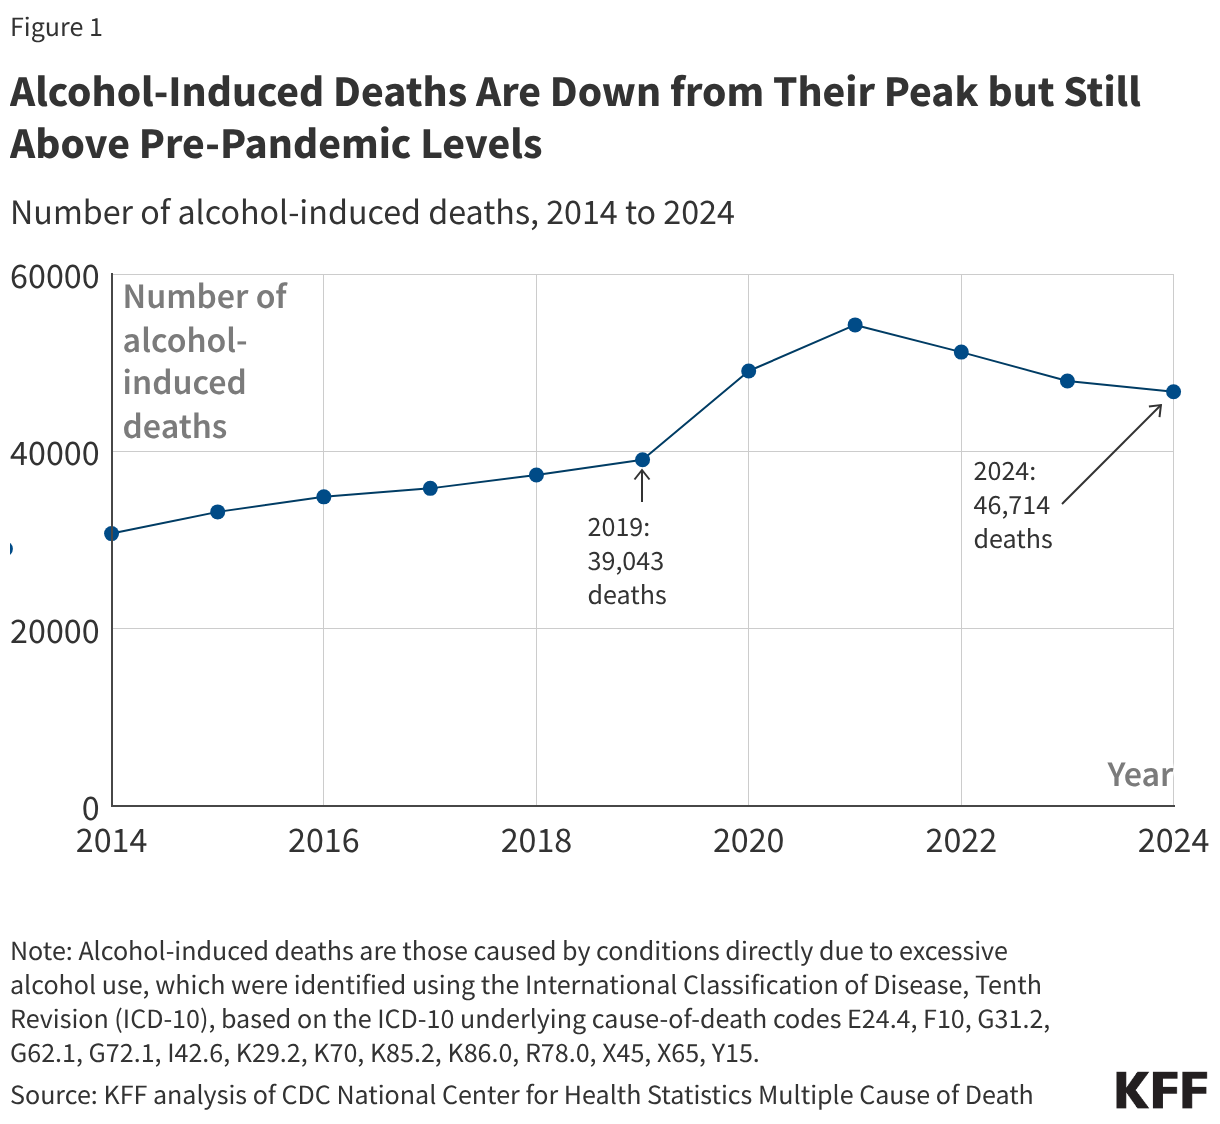
Overall trends: Alcohol deaths increased gradually before the pandemic, jumped in 2020 and 2021, and have fallen somewhat since then. Even after these declines, deaths remained above 2019, the year before the pandemic.
Demographic variation: In 2024, alcohol deaths were highest among adults ages 45 to 64, American Indian and Alaska Native (AIAN) people, and males. By 2024, alcohol death rates remained above 2019 levels for several groups; the groups most above their 2019 rates were adults ages 26 to 44, 65+, White people, and females.
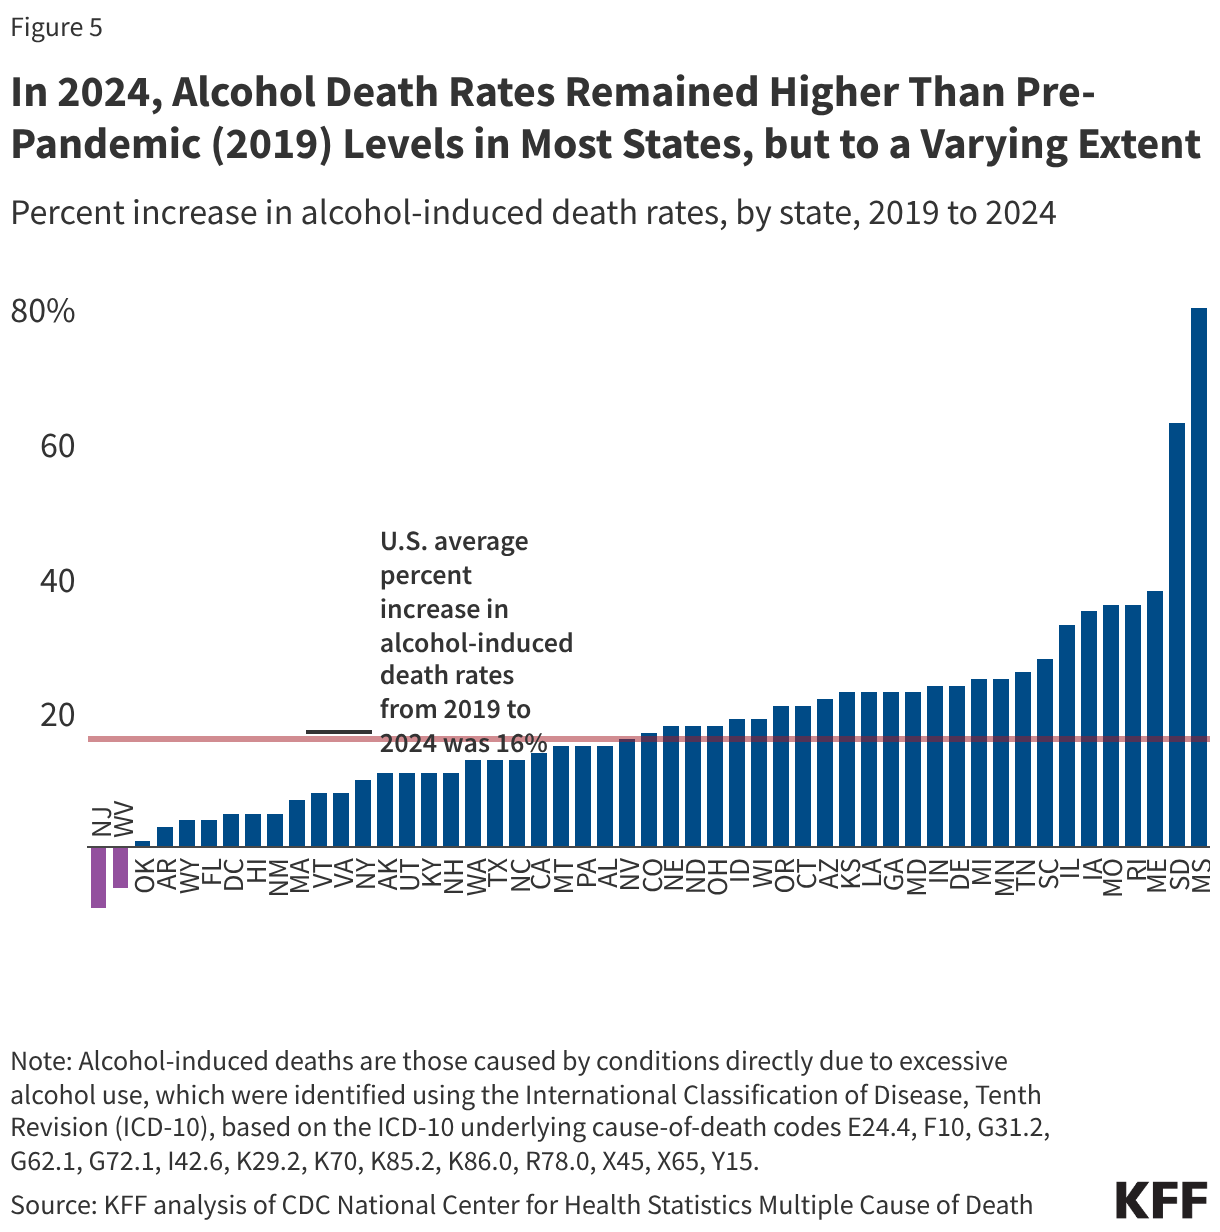
State variation: State rates in 2024 ranged from 6.1 per 100,000 in New Jersey to 35.9 per 100,000 in New Mexico. In 2024, alcohol death rates remained higher than 2019 rates for most states. Changes ranged from declines in New Jersey (-9%) and West Virginia (-6%) to an 80% increase in Mississippi.
What are the trends in alcohol deaths?
Alcohol deaths are down from their peak but still above pre-pandemic levels (Figure 1). Alcohol deaths increased gradually before the pandemic, jumped in early pandemic years, and have declined somewhat since then. From 2014 to 2024, the year-over-year rise in alcohol deaths averaged about 5% per year, with the largest single-year jump from 2019 to 2020 (+26%). Deaths peaked in 2021 (54,258) and have fallen since. Even with declines after 2021, in 2024 alcohol deaths were still about 50% higher than a decade ago and about 20% higher than in 2019, the year before the pandemic.
How do alcohol death rates vary across demographics?
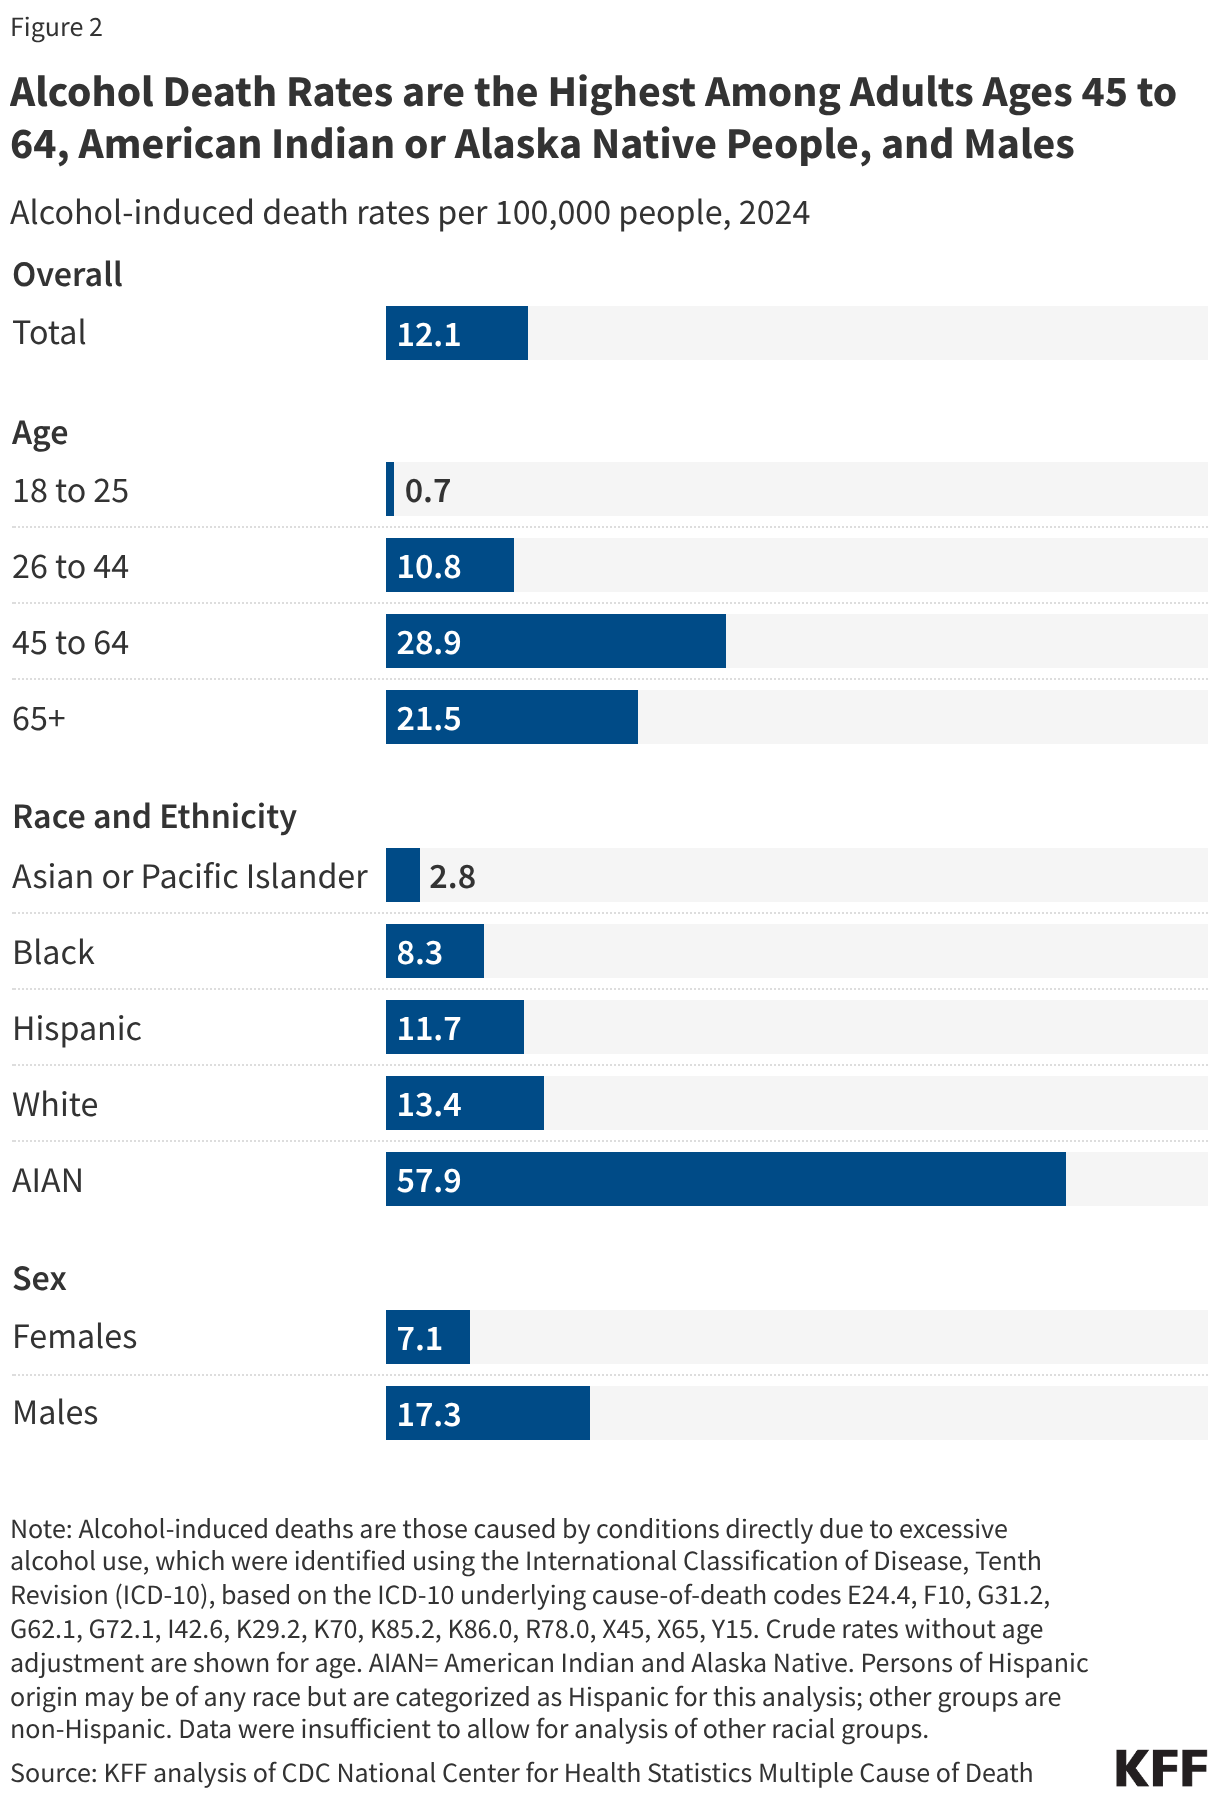
Alcohol deaths in 2024 were highest among adults ages 45 to 64, American Indian and Alaska Native (AIAN) people, and males (Figure 2). By age, alcohol death rates peaked among adults ages 45 to 64 (28.9 per 100,000) and were next highest among adults 65 and older (21.5 per 100,000). AIAN people had the highest alcohol death rate across all demographic groups (57.9 per 100,000), more than four times the rate among White people, the racial group with the next highest rate. Because White people make up a much larger share of the population, the total number of deaths was higher among White people (32,849 vs. 1,424), even though AIAN people had the higher death rate. Alcohol death rates among males (17.3 per 100,000) were more than double those among females.
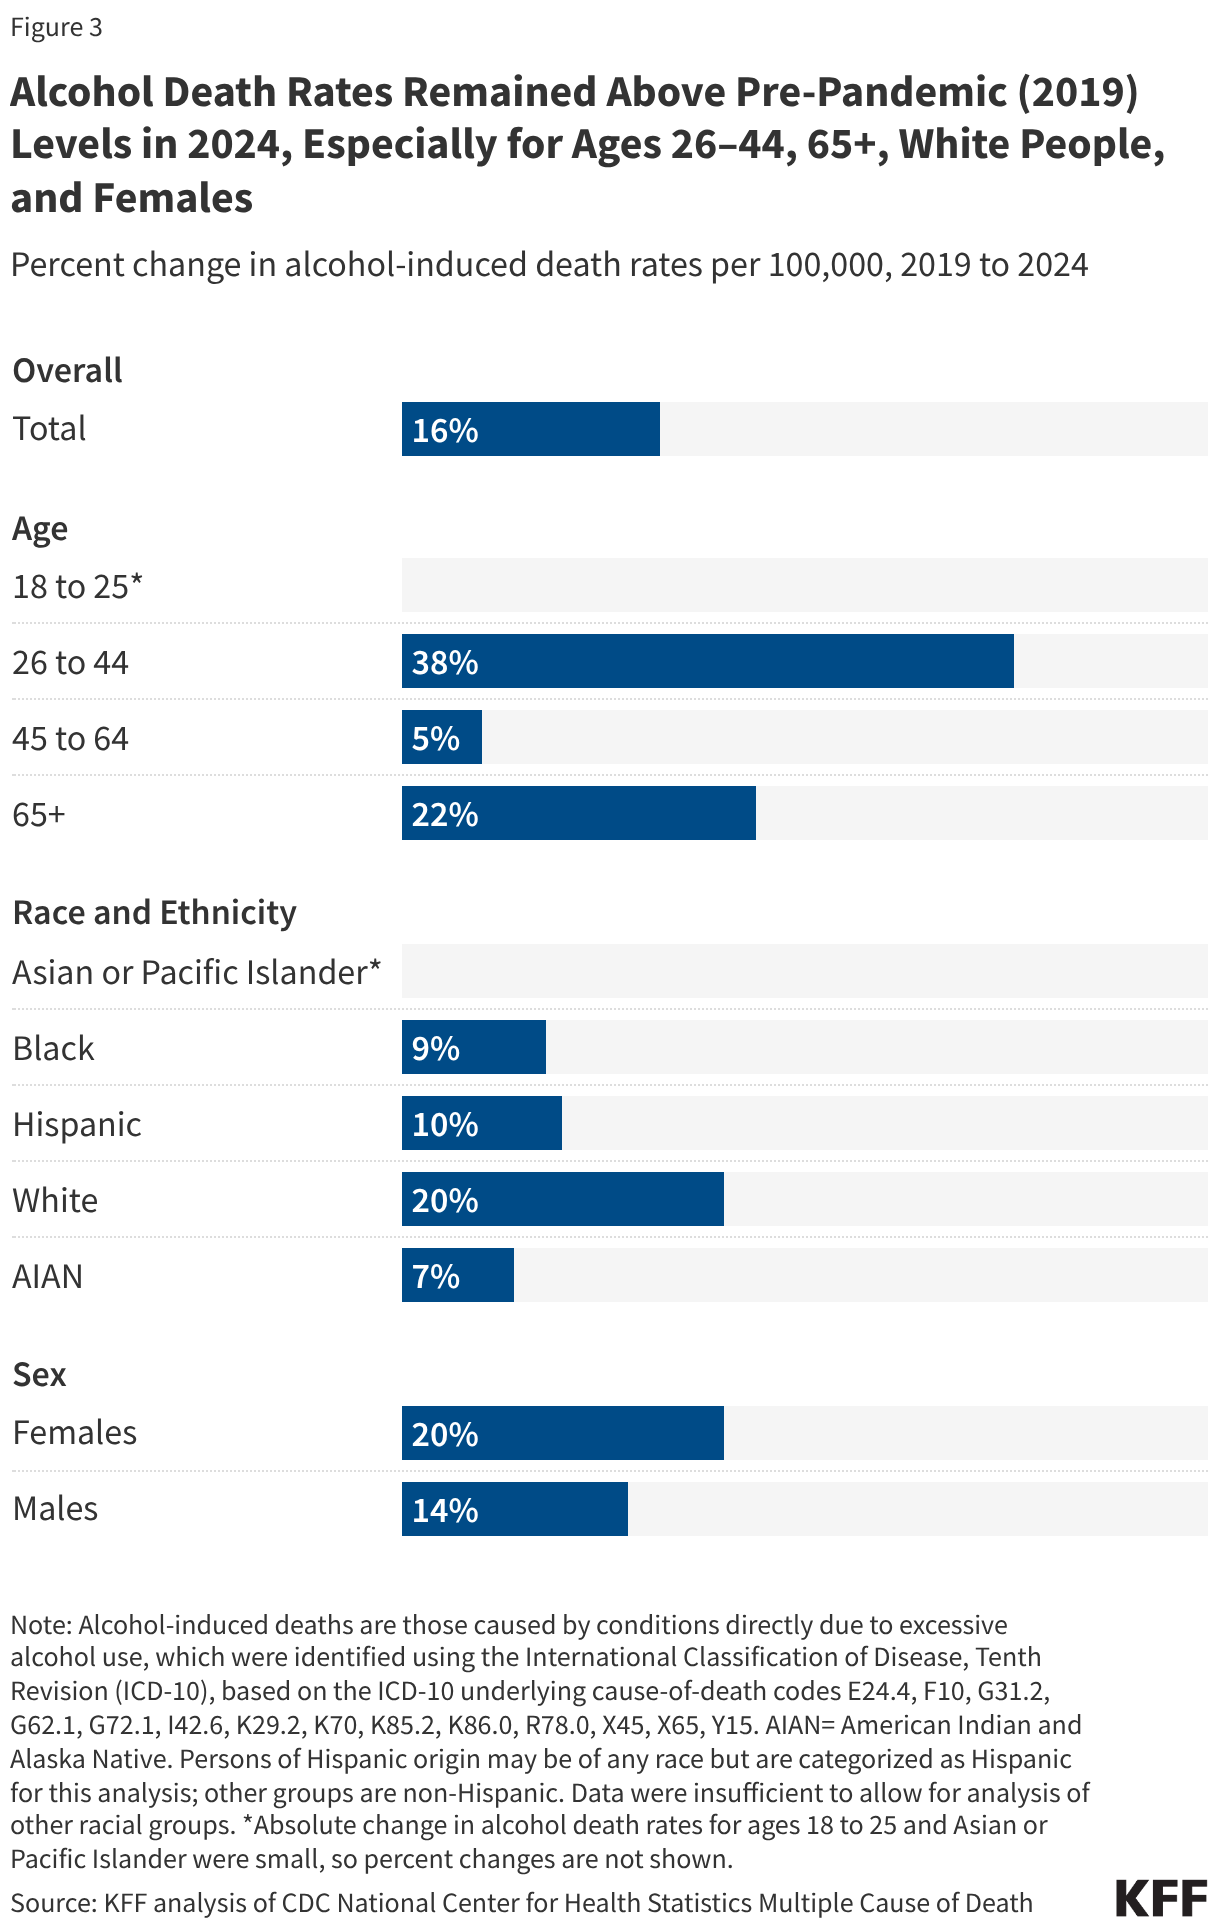
Alcohol death rates remained above pre-pandemic (2019) levels in 2024, especially for adults ages 26-44, 65+, White people, and females (Figure 3). Rates increased gradually before the pandemic, rose sharply in 2020 and 2021, and then declined from their peak, but not enough to return to 2019 levels. Adults ages 26 to 44 had the largest continued increases, with 2024 rates 38% higher than in 2019. Adults ages 65 and older also remained elevated, with 2024 rates about 22% higher than in 2019. Rates among White people remained about 20% higher than pre-pandemic levels and higher than rates among other race and ethnicity groups. Female alcohol death rates were still about 20% above 2019 levels, while male rates were closer to pre-pandemic levels.
How do alcohol death rates vary across states?
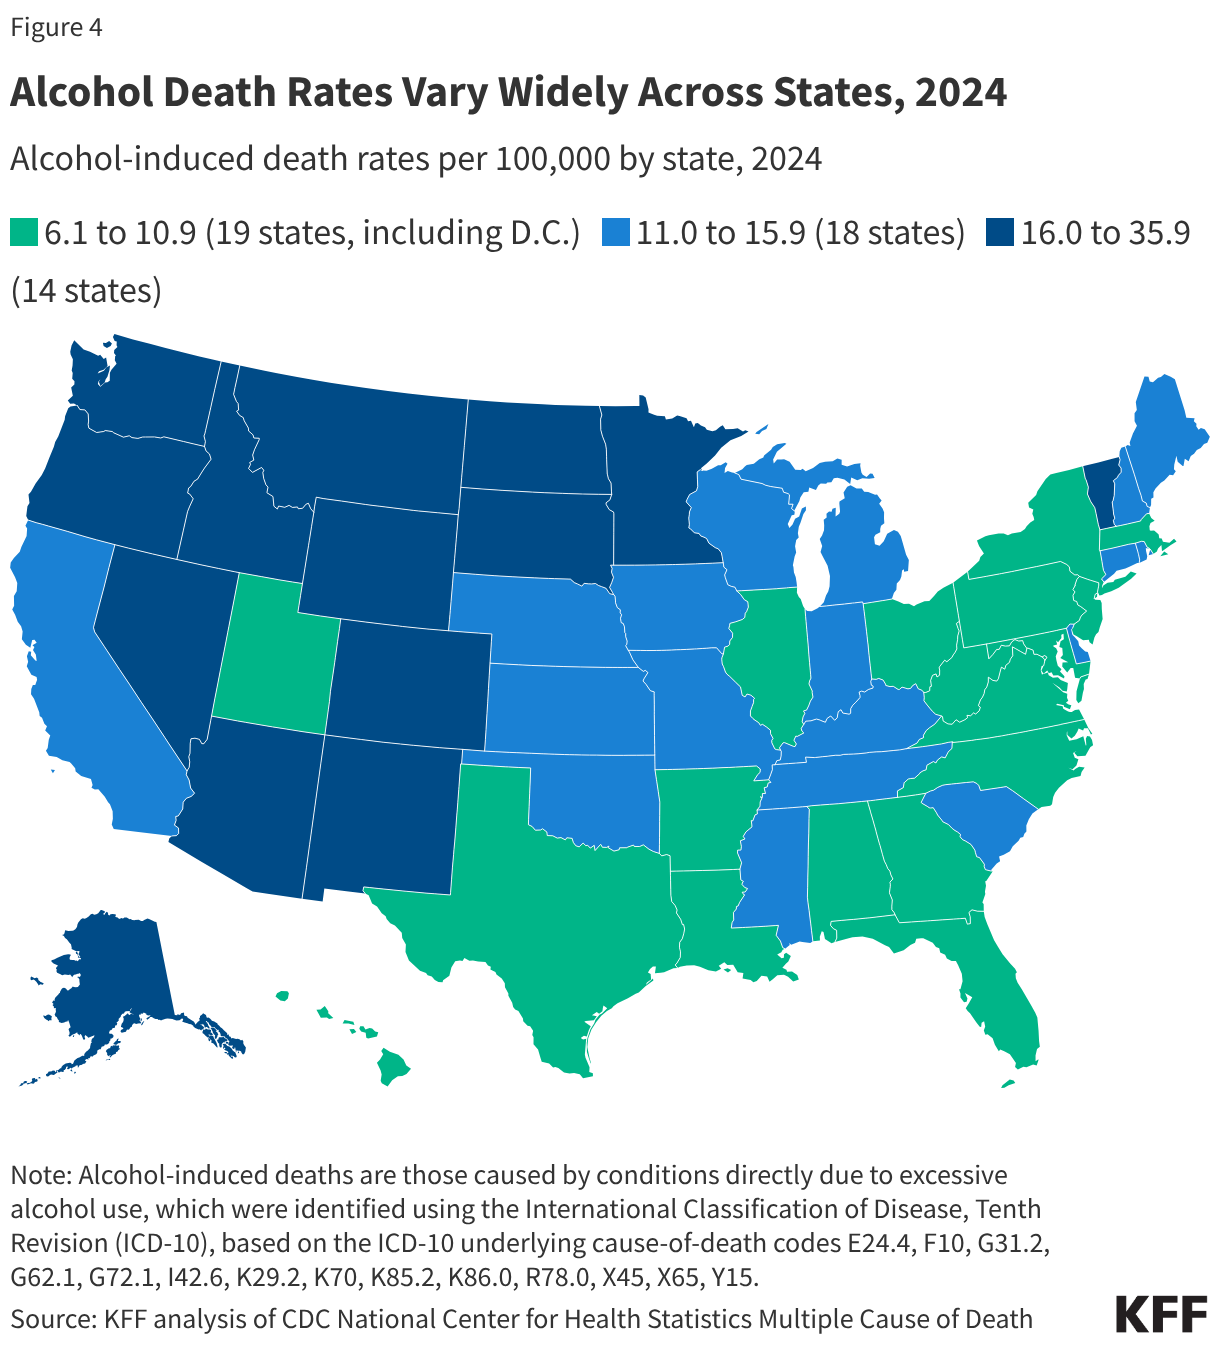
Alcohol death rates varied widely across states in 2024 (Figure 4). Alcohol-induced death rates ranged from 6.1 per 100,000 in New Jersey to a 35.9 per 100,000 in New Mexico. Higher rates tended to be concentrated in the West, particularly in the Mountain West (and Alaska), while lower rates were more common across parts of the South and the Northeast. Many factors may contribute to the differences in alcohol mortality rates across states, some of which may include differences in alcohol consumption, cultural attitudes, state-specific alcohol policies, and treatment rates.
In 2024, alcohol death rates remained higher than pre-pandemic (2019) levels in most states, though the magnitude varied widely (Figure 5). Changes from 2019 to 2024 ranged from declines in New Jersey (-9%) and West Virginia (-6%) to large increases in Mississippi (+80%) and South Dakota (+63%). Leading up to the pandemic, most states had modest steady increases, though growth was faster in some more rural states, including Wyoming, Montana, Arkansas, and North Dakota. Consistent with national patterns described above, many states experienced their sharpest increases in 2020 and 2021 and then declined somewhat from their peak, but in most states, 2024 rates remained above 2019 levels. South Dakota and Mississippi saw especially large early-pandemic increases and only modest declines afterwards, leaving them with the largest percent increases in alcohol death rates from 2019 to 2024.
What factors may contribute to alcohol deaths?
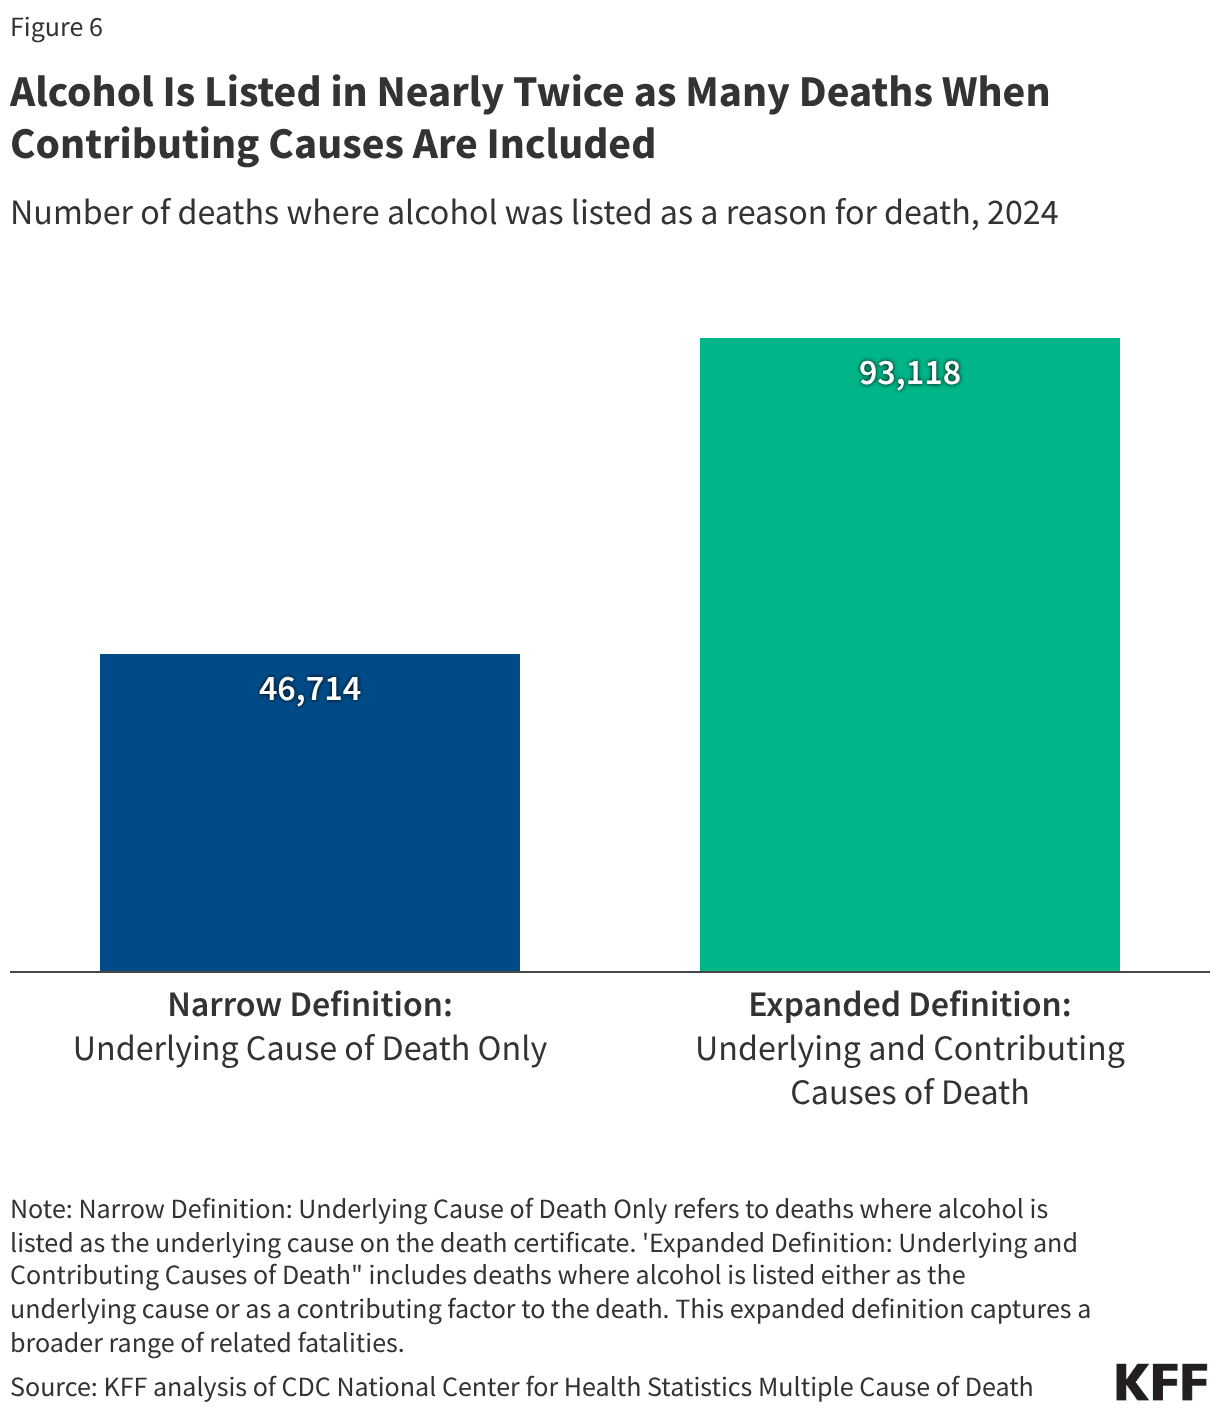
Alcohol is linked to far more deaths when broader definitions are used (Figure 6). Many alcohol-related conditions develop over time, and alcohol can also worsen other health problems or contribute to injuries, which complicates how alcohol deaths are counted. This analysis uses a narrow definition, counting only deaths where alcohol is listed as the underlying cause on the death certificate, such as alcohol-related liver disease. When deaths are also counted where alcohol is listed as a contributing cause on the death certificate (“alcohol-related deaths”), the total number of deaths nearly doubles, reaching 93,118 in 2024 (Figure 5). Under this broader definition, alcohol-related deaths exceeded opioid overdose deaths (55,535 opioid deaths when underlying and contributing cause are included), and opioid deaths change little when moving from the narrow to broader definition (54,045 under the narrow definition). Others methods can produce even higher estimates of alcohol deaths by accounting for deaths that alcohol increases the risk of, even when alcohol is unlikely to be recorded on the death certificate, such as certain cancers.
Alcohol treatment rates are low, reflecting a mix of provider, patient, and financial barriers. In 2022, only 7.6% of people ages 12 and older with a past-year alcohol use disorder (AUD) received any treatment, and fewer (2.1%) received evidence-based AUD medication. Providers may lack confidence or knowledge in treating AUD and prescribing AUD medication, which can reduce treatment initiation or referrals. On the patient side, limited understanding of what constitutes problematic drinking and attitudes towards seeking treatment can hinder recognition of need for help. Among adults who meet the criteria for SUD—which may include symptoms like increased tolerance, repeated attempts to quit or control use, or social problems related to use--95% did not seek treatment and didn’t think they needed it. Even when people want care, practical constraints such as coverage limits, treatment availability, paid leave, and out-of-pocket costs can affect decisions about whether they start or stay in treatment.