Medicare Households Spend More on Health Care Than Other Households
Medicare provides health insurance coverage to 66 million adults, including 59 million adults ages 65 and older and more than 7 million adults under age 65 with disabilities. While the vast majority (91%) of Medicare beneficiaries give their Medicare coverage an overall positive rating, health care cost-related problems are not uncommon. Medicare beneficiaries contribute to the cost of their health care coverage through monthly premium payments, deductibles, and other cost-sharing requirements. Additionally, people on Medicare may face additional premiums for Medicare Part D prescription drug coverage and supplemental insurance. Further, there is no limit on out-of-pocket spending for beneficiaries in traditional Medicare, and beneficiaries often incur out-of-pocket costs for services not covered under traditional Medicare, such as dental, hearing, and vision services. Medicare Advantage plans have a cap on out-of-pocket costs and typically offer reduced cost-sharing for no premium, but enrollees can still have substantial expenses.
In 2022, the Consumer Price Index (CPI) for all Urban Consumers, a closely tracked measure of price inflation, increased to its highest annual rate since 1981, which translated to higher costs for housing, food, transportation, and other household expenditures, including health care costs. The inflation rate has come down since then, but prices for many household expenses are still substantially higher than they were previously. In this analysis, we assess the financial burden of health care spending among households where all members are covered by Medicare (referred to as Medicare households) compared to households where no members are covered by Medicare (referred to as non-Medicare households), based on data from the 2022 Consumer Expenditure Survey. We also assess trends in household spending and the financial burden of health care spending over the 10-year period from 2013 to 2022. (See Methods for details on the analysis.)
The health spending burden was twice as large among Medicare households than non-Medicare households in 2022
Average health-related expenses accounted for 13.6% of Medicare households’ total spending in 2022 compared to 6.5% for non-Medicare households.
Medicare households spent more on health care than non-Medicare households in 2022, both as an annual dollar amount and as a share of total household spending. Medicare households spent an average of $7,000 on health care, accounting for 13.6% of their total household spending ($51,800), while non-Medicare households spent $4,900 on their health care, accounting for 6.5% of their total household spending ($74,100) (Figure 1). Health care expenses include health insurance premiums, medical services (e.g., hospital and physician services), prescription drugs, and medical supplies (e.g., crutches, eyeglasses, hearing aids).
The larger burden of health care spending among Medicare households than non-Medicare households is a function of both lower average total household spending for Medicare households than non-Medicare households and higher health care use, which results in higher health care spending by Medicare households.
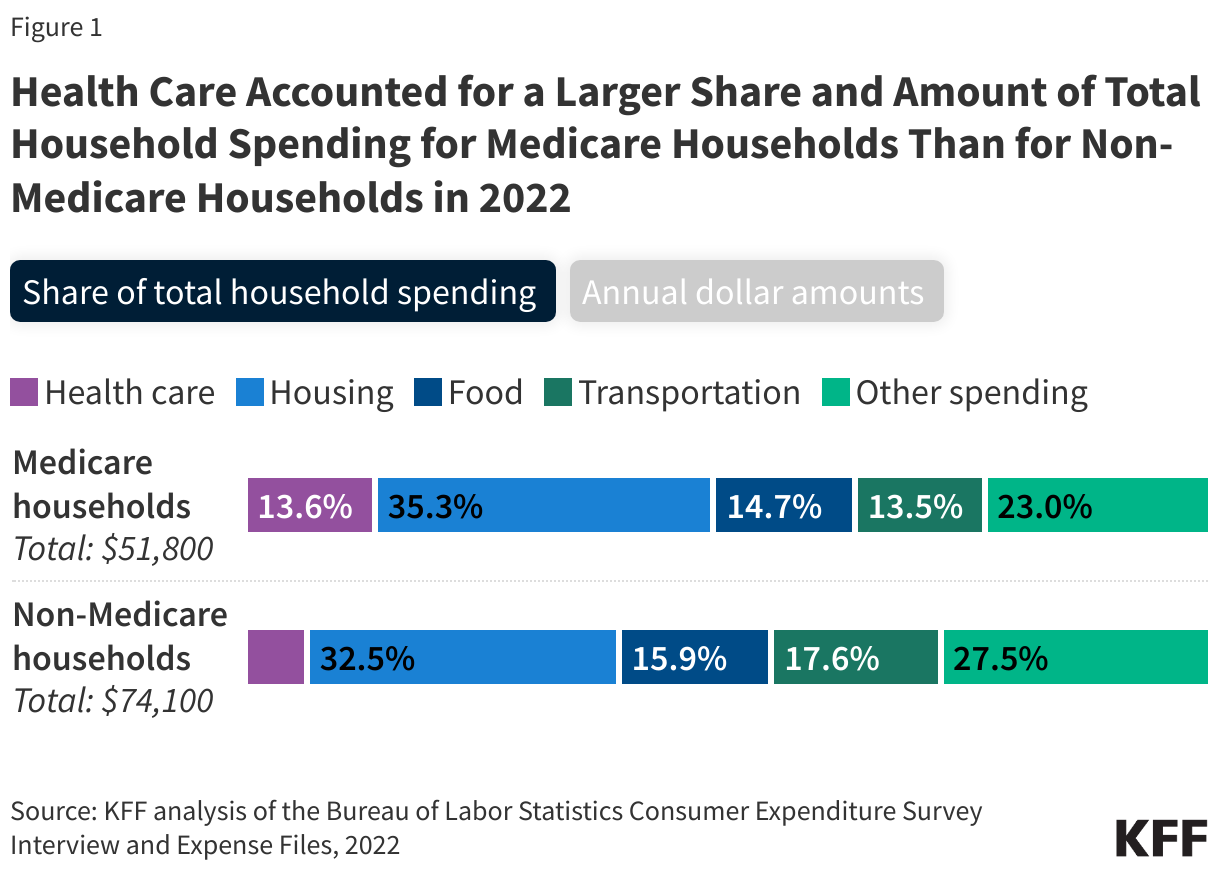
Across all household spending categories, housing accounted for the largest share of total spending for both Medicare and non-Medicare households (35.3% for Medicare households and 32.5% for non-Medicare households). Across other major categories of household spending – transportation, food, and other expenses such as education and clothing – Medicare households devoted a smaller share of their household spending (and less in dollar terms) to these items than non-Medicare households. This may be a function of both smaller average family sizes in Medicare households than non-Medicare households (1.4 vs. 2.6 people), as well as lower median household income ($31,700 vs $76,600).
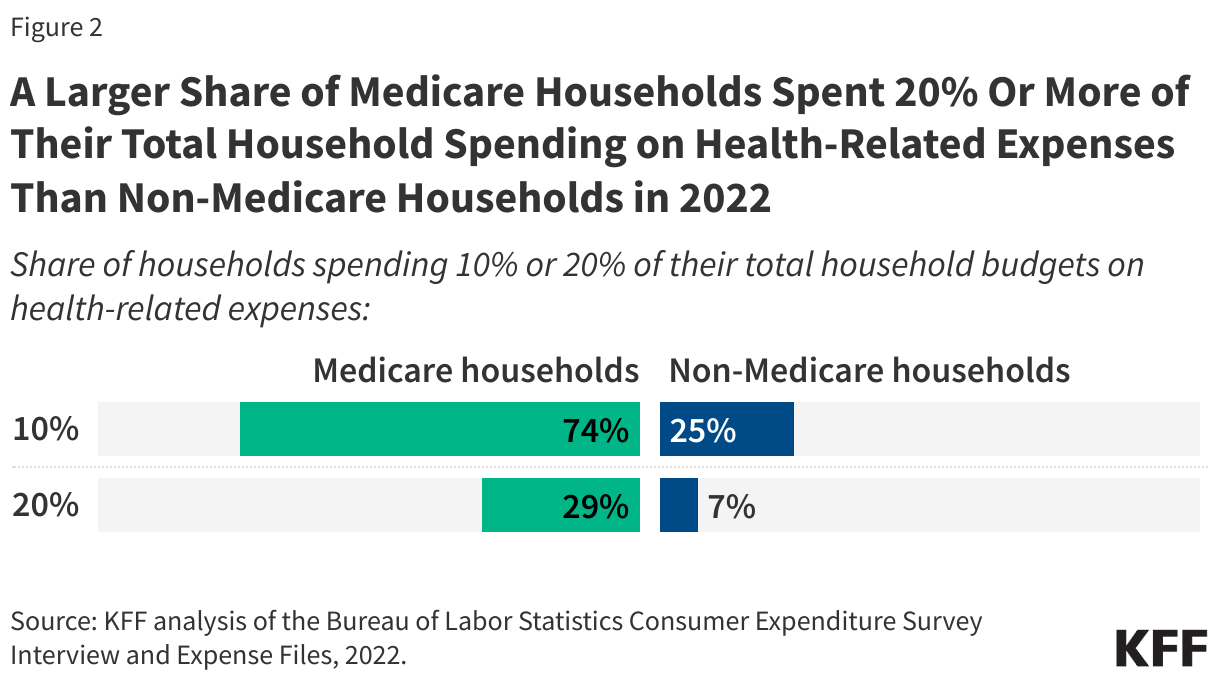
In 2022, nearly 3 in 10 Medicare households spent 20% or more of their total household spending on health-related expenses, compared to 7% of non-Medicare households
Consistent with the higher average health care spending burden among Medicare households compared to non-Medicare households, a larger share of Medicare households than non-Medicare households spent 20% or more of their total household spending on health-related expenses than non-Medicare households – nearly 3 in 10 (29%) Medicare households versus 7% of non-Medicare households. Nearly three out of four Medicare households (74%) spent 10% percent or more of their total household spending on health expenses, compared to a quarter (25%) of non-Medicare households (Figure 2).
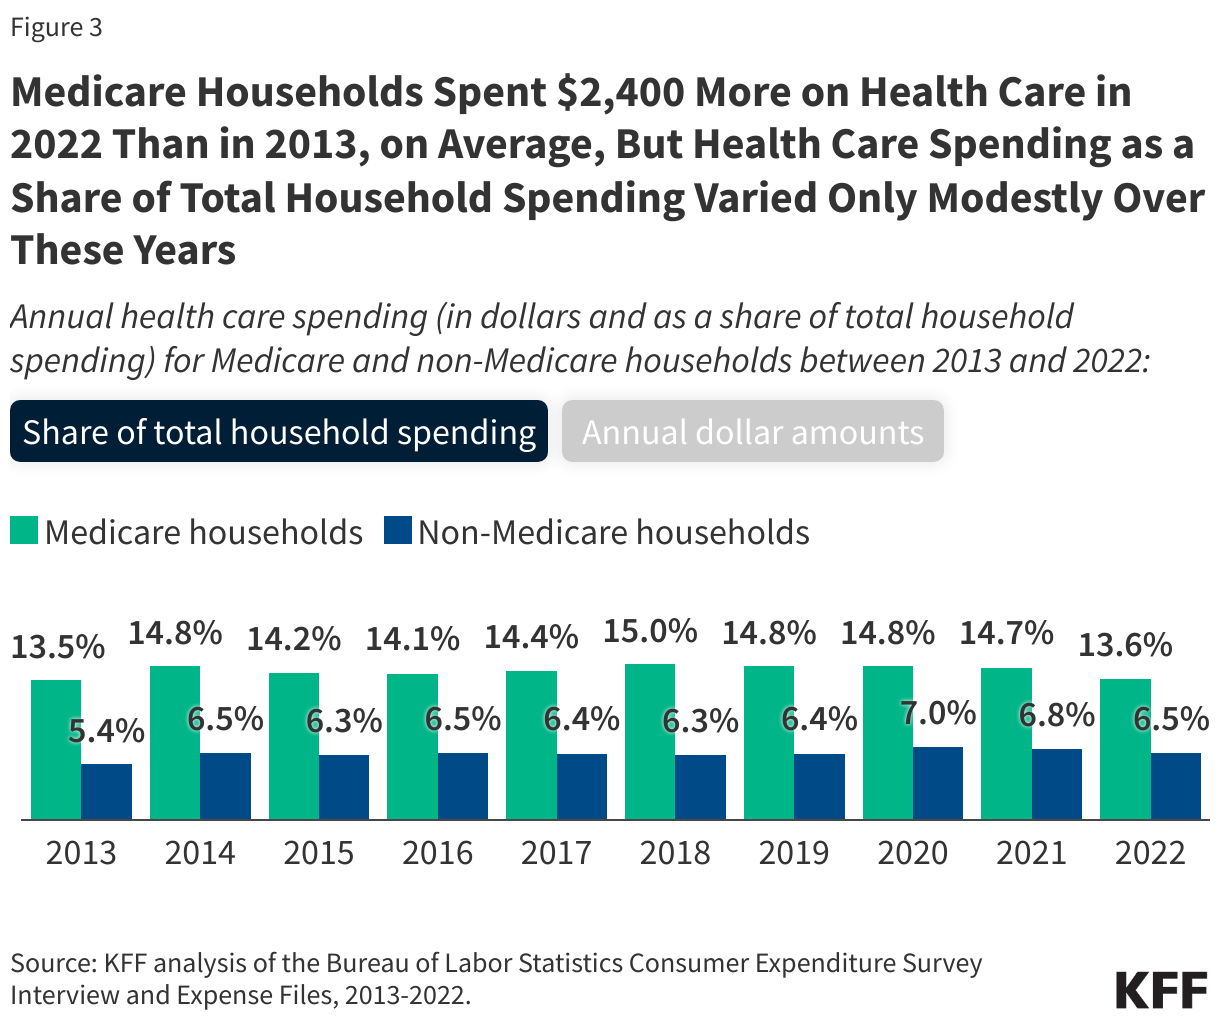
Health care spending by Medicare households increased by 53% between 2013 and 2022, but health care as a share of total household spending changed very little over these years
In 2022, Medicare households spent an average of $7,000 on health care—$2,400 or 53% higher than the amount spent on health care in 2013 ($4,600) (Figure 3). With total household spending by Medicare households growing at nearly the same rate as the growth in health care spending over these years, health care as a share of total household spending was nearly the same in 2022 (13.6%) as in 2013 (13.5%).
Similarly, non-Medicare households also spent more on health care in 2022 ($4,900) than in 2013 ($2,800), a 71% ($2,100) increase. Health care as a share of total household spending for non-Medicare households was somewhat higher in 2022 (6.5%) than in 2013 (5.4%).
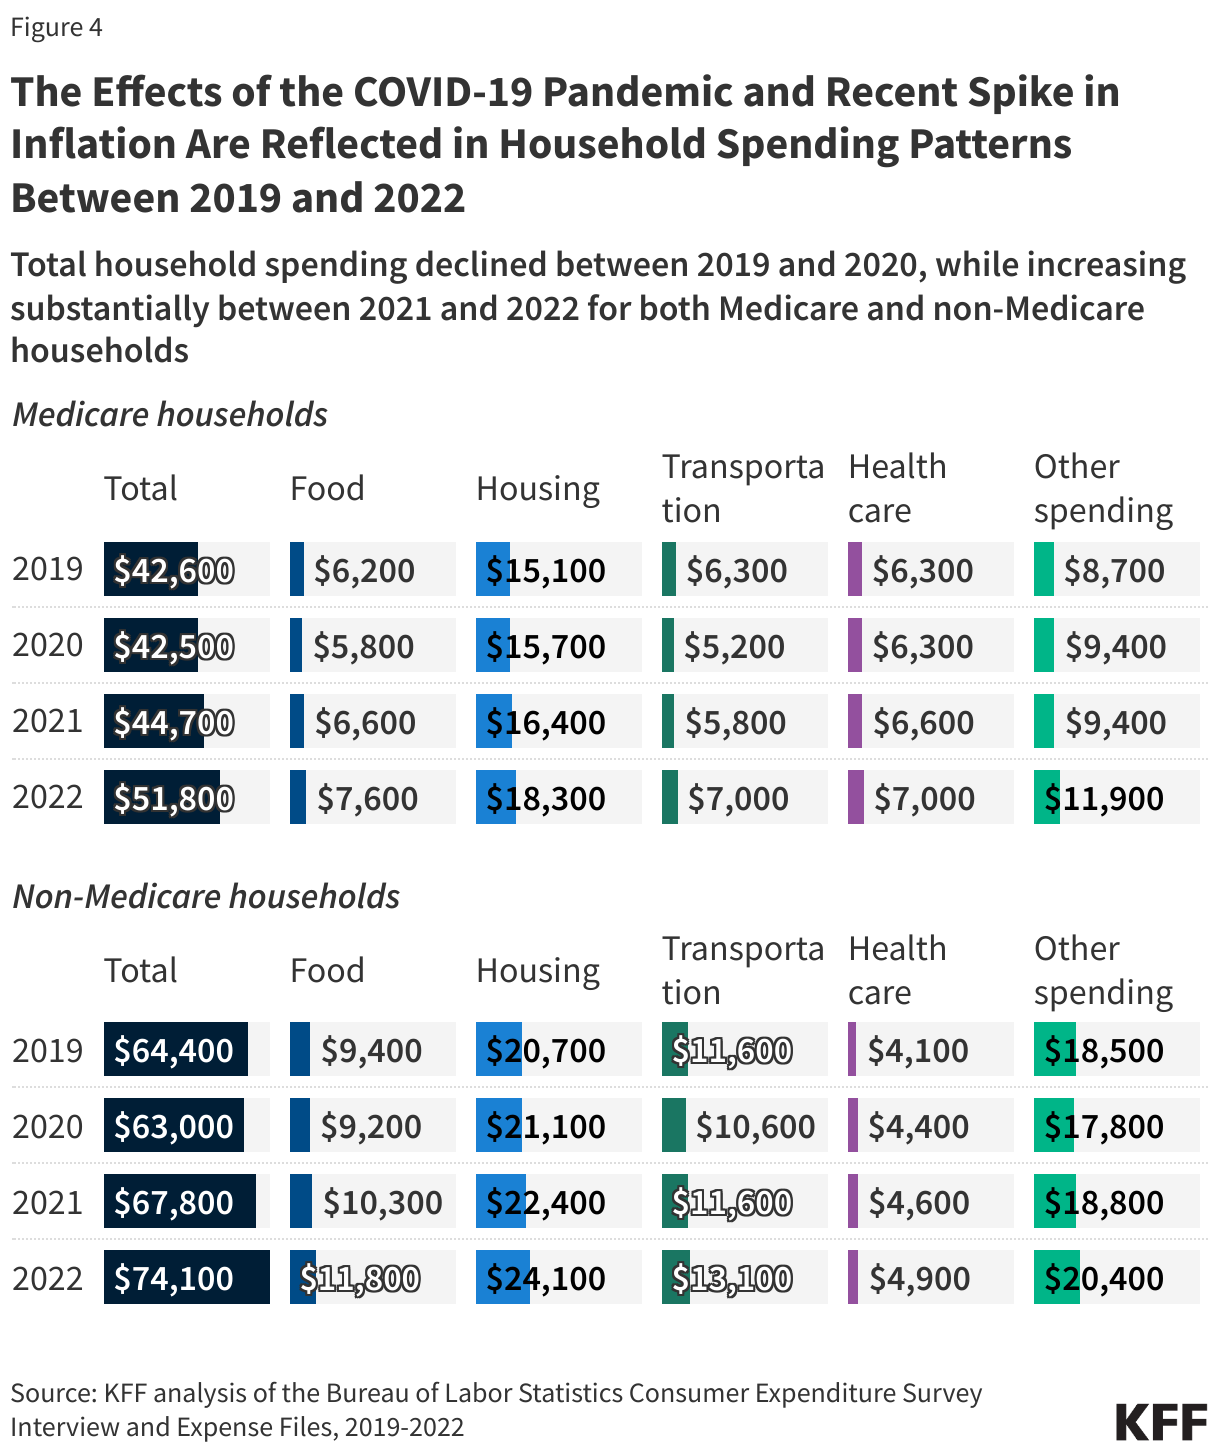
Focusing on household spending trends between 2019 and 2022 shows the dual effects of the COVID-19 pandemic and price inflation.
Between 2019 and 2020, spending by Medicare households on food and transportation fell, likely reflecting stay-at-home policies established at the outset of the COVID-19 pandemic, and total household spending declined somewhat (Figure 4). By contrast, between 2021 and 2022, total household spending increased substantially, reflecting increases in all categories of household spending, as price inflation hit its highest level since 1981 in 2022. This was true for both Medicare households and non-Medicare households.
Discussion
The health care spending burden was twice as large for Medicare households than for non-Medicare households in 2022, measured by average health care spending as a share of total household spending, and a larger share of Medicare households spent at least 20% of their household budgets on health care than non-Medicare households. Of note, this analysis underestimates the health care spending burden for households that incur long-term care facility costs because the Consumer Expenditure Survey does not include people who reside in facilities. This exclusion is more likely to affect the spending burden estimates for Medicare households than non-Medicare households since spending on long-term care facilities is a significant share of average out-of-pocket health care costs for people with Medicare.
With health care use increasing with age and with most Medicare beneficiaries living on relatively low incomes and modest financial assets to draw upon in retirement, it’s not unexpected that health care is a bigger cost burden for Medicare households. This cost burden has important implications for policy debates, including the level of cost-sharing and premiums in Medicare. Policies aimed at improving financial protections for Medicare beneficiaries have been proposed in recent years. The Inflation Reduction Act of 2022 includes several provisions that lower prescription drug costs for people with Medicare, including a cap on Medicare beneficiaries’ out-of-pocket spending under the Medicare Part D benefit; a limit on insulin cost sharing to $35 a month in Medicare Part B and Part D; and expanded eligibility for full Part D Low-Income Subsidies. Policy makers have also considered other proposals that would improve the affordability of health care for Medicare beneficiaries, such as expanding income eligibility thresholds for the Medicare Savings Programs to enable more people to qualify for these financial supports, and adding an out-of-pocket cap on cost sharing for benefits covered under traditional Medicare. Adopting such changes, however, would require additional federal spending.
This work was supported in part by AARP. KFF maintains full editorial control over all of its policy analysis, polling, and journalism activities.
Nancy Ochieng and Juliette Cubanski are with KFF. Anthony Damico is an independent consultant.
Methods
This analysis uses 2013-2022 data from the Bureau of Labor Statistics Consumer Expenditure Survey (CE). The CE provides data on expenditures, income, and demographic characteristics of consumers in the United States.
The CE is a survey of households (“consumer units”), excluding people residing in institutions such as long-term care facilities. A consumer unit consists of any of the following: (1) all members of a particular household who are related by blood, marriage, adoption, or other legal arrangements; (2) a person living alone or sharing a household with others or living as a roomer in a private home or lodging house or in permanent living quarters in a hotel or motel, but who is financially independent; or (3) two or more persons living together who use their incomes to make joint expenditure decisions. Financial independence is determined by spending behavior with regard to the three major expense categories: housing, food, and other living expenses.
Total expenditures include the following components of household expenditures: food; housing; transportation; health care; entertainment; personal care products and services; reading; education; tobacco products and smoking supplies; cash contributions: life, endowment, annuities, and other personal insurance; contributions to retirement pensions and Social Security. Note that total expenditures for each consumer unit does not include tax expenditures, such as income tax.
Total health care expenditures include spending on four subcomponents of health care: health insurance premiums, medical services, prescription drugs, and medical supplies.
The estimates presented in this analysis are averages for demographic groups of consumer units, not per capita estimates, and thus are not comparable to estimates based on other surveys that report per capita estimates, such as out-of-pocket health care spending reported in the Medicare Current Beneficiary Survey. Expenditures by individuals would differ from the average even if the characteristics of the group are similar to those of the individual. Another source of differences between averages reported here and elsewhere is that the spending data are based on survey self-reports and therefore are subject to nonsampling error, including the inability or unwillingness of respondents to provide accurate data.
Unless otherwise noted, all differences discussed in the text are significant at the 95% confidence level.