Aiming for Fewer Hospital U-turns: The Medicare Hospital Readmission Reduction Program
Issue Brief
For Medicare patients, hospitalizations can be stressful; even more so when they result in subsequent readmissions. While many readmissions are unavoidable, researchers have found wide variation in hospitals’ readmission rates, suggesting that patients admitted to certain hospitals are more likely to experience readmissions compared to other hospitals.1 A number of studies show that hospitals can engage in several activities to lower their rate of readmissions, such as clarifying patient discharge instructions, coordinating with post-acute care providers and patients’ primary care physicians, and reducing medical complications during patients’ initial hospital stays.2
Through Congressional direction and previous Administration initiatives, Medicare has begun implementing incentives to reduce hospital readmissions. One example, and the focus of this Issue Brief, is the Hospital Readmission Reduction Program (HRRP), which financially penalizes hospitals with relatively high rates of Medicare readmissions.3 This Issue Brief, updated with new estimates for 2017, describes the HRRP, analyzes the program’s impact on Medicare patients and hospitals, examines the decline in national readmission rates, and discusses implementation issues that policymakers have raised.
Main Findings
- Total Medicare penalties assessed on hospitals for readmissions will increase to $528 million in 2017, $108 million more than in 2016. The increase is due mostly to more medical conditions being measured. Hospital fines will average less than 1 percent of their Medicare inpatient payments.
- For 2017, 78 percent of Medicare patient admissions are projected to be in hospitals receiving either no readmission penalty or penalties of less than 1 percent of the hospital’s Medicare inpatient payments. Fewer than 2 percent of Medicare patient admissions will be in hospitals receiving the maximum financial penalty.
- Nationally, beneficiary readmission rates started to fall in 2012, and have continued to drop since then, suggesting that hospitals and clinicians may have adopted new, system-wide interventions soon after the HRRP was enacted by the ACA.
- Across all five years of the HRRP, certain types of hospitals are more likely than others to incur penalties. These include hospitals with relatively higher shares of low-income beneficiaries and major teaching hospitals. Congress recently enacted legislation to incorporate a socioeconomic adjustment in how hospital performance is measured, based on each hospital’s share of inpatients who are dually qualified for Medicare and full Medicaid. The implementation of this methodology will need to consider several key policy issues.
Background: Defining a hospital readmission
Generally speaking, a hospital readmission occurs when a patient is admitted to a hospital within a specified time period after being discharged from an earlier (initial) hospitalization. For Medicare, this time period is defined as 30 days, and includes hospital readmissions to any hospital, not just the hospital at which the patient was originally hospitalized. Medicare uses an “all-cause” definition of readmission, meaning that hospital stays within 30 days of a discharge from an initial hospitalization are considered readmissions, regardless of the reason for the readmission. This all-cause definition is used in calculating both the national average readmission rate and each hospital’s specific readmission rate. Starting in 2014, CMS began making an exception for planned hospitalizations (such as a scheduled coronary angioplasty) within the 30-day window; these are no longer counted as readmissions.
The current focus in the HRRP is on readmissions occurring after initial hospitalizations for selected conditions—namely, heart attack, heart failure, pneumonia, chronic obstructive pulmonary disease (COPD), elective hip or knee replacement, and coronary artery bypass graft (CABG). CMS also collects hospitals’ overall readmission rates (regardless of initial diagnoses), but these overall rates are not currently used in the HRRP to calculate readmissions penalties.
The first five years of the Hospital Readmission Reduction Program
The HRRP was established by a provision in the Affordable Care Act (ACA) requiring Medicare to reduce payments to hospitals with relatively high readmission rates for patients in traditional Medicare. Starting in 2013 as a permanent component of Medicare’s inpatient hospital payment system (i.e., not a temporary demonstration project), the HRRP applies to most acute care hospitals. Exempt hospitals include psychiatric, rehabilitation, long term care, children’s, cancer, and critical access hospitals, as well as all hospitals in Maryland.4
Under the HRRP, hospitals with readmission rates that exceed the national average are penalized by a reduction in payments across all of their Medicare admissions—not just those which resulted in readmissions. Before comparing a hospital’s readmission rate to the national average, CMS adjusts for certain demographic characteristics of both the patients being readmitted and each hospital’s patient population (such as age and illness severity). After these adjustments, CMS calculates a rate of “excess” readmissions, which links directly to the hospital’s readmission penalty—the greater each hospital’s rate of excess readmissions, the higher its penalty.5 Each year, CMS releases each hospital’s penalty for the upcoming year in the Federal Register and posts this information on its Medicare website.
For the first year, fiscal year 2013, the maximum penalty was 1 percent of the hospital’s base Medicare inpatient payments, increasing to 2 percent for 2014, and was fully phased-in at 3 percent starting in 2015 (Table 1).6 When calculating each hospital’s readmission rate, CMS uses three full years of hospital data. Accordingly, the upcoming 2017 penalties were based on hospital readmissions that occurred from July 2012 through June 2015.
| Table 1: The first five years of the Hospital Readmission Reduction Program | |||||
| Year penalties applied | FY 2013 | FY 2014 | FY 2015 | FY 2016 | FY 2017 |
| Performance (measurement) period | June 2008-July 2011 | June 2009-July 2012 | June 2010-July 2013 | June 2011-July 2014 | June 2012-July 2015 |
| Diagnoses of initial hospitalization | Heart attackHeart failurePneumonia | Heart attackHeart failurePneumonia | Heart attackHeart failurePneumoniaCOPDHip or knee replacement | Heart attackHeart failurePneumoniaCOPDHip or knee replacement | Heart attackHeart failurePneumonia (expanded)*COPDHip or knee replacementCABG |
| Penalties: Percentage reduction in base payments on all Medicare inpatient admissions | |||||
| Maximum rate of penalty | 1% | 2% | 3% | 3% | 3% |
| Average hospital payment adjustment(among all hospitals) | -0.27% | -0.25% | -0.49% | -0.48% | -0.58% |
| Average hospital penalty(among penalized hospitals only) | -0.42% | -0.38% | -0.63% | -0.61% | -0.74% |
| Percent of hospitals penalized | 64% | 66% | 78% | 78% | 79% |
| Percent of hospitals at max penalty | 8% | 0.6% | 1.2% | 1.1% | 1.8% |
| CMS estimate of total penalties | $290 million | $227 million | $428 million | $420 million | $528 million |
| NOTES: *Additional types of pneumonia diagnoses added for 2017. Penalties are applied to each hospital in the year shown, based on performance during the preceding 3-year measurement period. Penalties assessed as reductions in base payments on all Medicare inpatient admissions, and do not apply to added payment adjustments, such as graduate medical education payments. Analysis excludes hospitals not subject to HRRP, such as Maryland hospitals and other hospitals not paid under the Medicare Hospital Inpatient Prospective Payment System, such as psychiatric hospitals. COPD: Chronic obstructive pulmonary disease. Estimates of total penalties reflect CMS’s published corrections for 2013 and 2014. CABG: coronary artery bypass grafting. FY: fiscal year.SOURCE: Kaiser Family Foundation analysis of CMS Final Rules and Impact files for the Hospital Inpatient Prospective Payment System. | |||||
For penalties levied in 2013 and 2014, CMS focused on readmissions after initial hospitalizations for three selected conditions: heart attack, heart failure, and pneumonia. For penalties levied in 2015, CMS added COPD, and elective hip or knee replacement. For 2017 penalties, CMS expanded the types of pneumonia cases that were assessed and calculated readmission rates following CABG surgery.
total fines will increase in 2017 to over $500 million, due to higher average penalties resulting from more medical conditions being measured
Across all hospitals, the average 2017 penalty will be a 0.58-percent reduction in base Medicare payments for all inpatient admissions. Among only penalized hospitals, the average fine will be a 0.74-percent reduction in Medicare inpatient payments, a 13-percentage point increase from the prior year (Table 1). With these increases, CMS estimates that total penalties across all hospitals will total $528 million, $108 million more than in 2016. The share of hospitals receiving a penalty has remained relatively flat (78 to 79 percent) over the past three years.
The increase in average and total penalties for 2017 is due mostly to a larger number of medical conditions included in the calculations for the 2017 readmission penalty. Specifically, as described above, CMS added CABG and expanded the cohort of pneumonia diagnoses to the list of initial diagnoses eligible for assessing hospital performance on readmissions. A similar increase in average penalties occurred in 2015 when CMS added two diagnoses (COPD and hip or knee replacement) to the list of initial diagnoses being assessed for readmission, which was found to play a larger role in penalty increases than phasing in the maximum penalty.
A second reason that average penalties have not fallen stems from the statutory requirement that penalty assessments be based on average hospital performance, rather than on fixed targets. In other words, CMS assesses hospital penalties based on a curve, resulting in a certain percentage of hospitals always be penalized, regardless of improvements in national readmission rates. Advantages and disadvantages of changing this formula are discussed later in this brief.
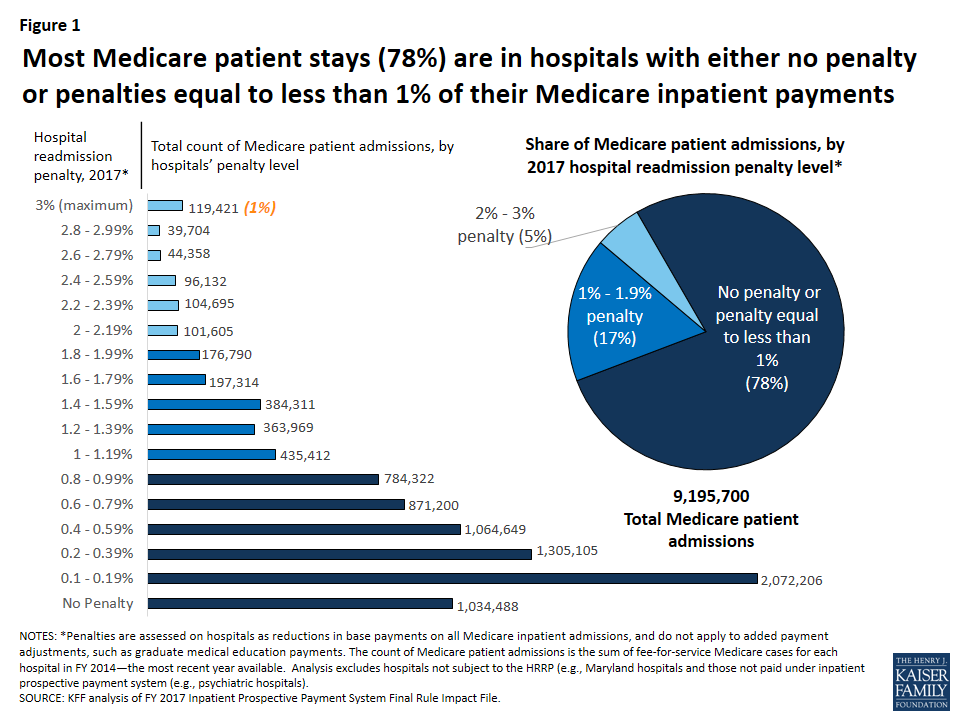
Most Medicare patients stay in hospitals with either no penalty or penalties less than 1 percent of their Medicare inpatient payments
For a patient perspective, our analysis finds that for 2017, most beneficiaries will stay in hospitals with low to no penalties. Specifically, we estimate that 78 percent of beneficiary stays in 2017 will be in hospitals that scored well enough during their previous measurement period to receive either no penalty or penalties equaling less than 1 percent of the hospital’s Medicare inpatient payments. (Figure 1). Conversely, 22 percent of beneficiary stays will be in hospitals that will receive fines greater than 1 percent of their Medicare payments for inpatient admissions. About 1 percent of Medicare admissions will occur in hospitals that will receive the maximum penalty, a 3-percent reduction in Medicare payments across all inpatient admissions.
Readmission penalties continue to vary by hospital characteristics
Analysis of the variation in penalties by type of hospital suggests that Medicare beneficiaries who go to certain types of hospitals—namely major teaching hospitals and hospitals with relatively greater shares of low-income beneficiaries—are more likely to stay in penalized hospitals and hospitals with higher penalties (Table 2). This finding is consistent with previous research.7 To some degree there is overlap among these two types of hospitals, as major teaching hospitals often serve as safety-net hospitals with higher proportions of low-income patients. Across all years, hospitals with the smallest share of low-income beneficiaries (quartile 1) are the least likely to be assessed any penalty at all. For 2017, 66 percent of hospitals in the lowest quartile of low-income patients (as determined by beneficiaries with Social Security Income) will be fined a readmission penalty compared with 86 percent among hospitals with the highest share of low-income beneficiaries. Rural hospitals also have higher rates of being penalized and higher average penalties. Variations in penalty rates by hospital characteristics have persisted across all five years of the program, although differences were greater in the first year when the maximum penalty was only 1 percent (see Appendix Table for analysis of earlier years).
| Table 2: Variation in penalties by hospital characteristics, 2017 | |||||
| Hospital type | % of hospitals | % of Medicare patient admissions | Average hospital penaltyPenalty:% reduction inbase payments on all Medicare inpatient admissions | % of hospitals with any penalty | % of hospitals at maximum penalty |
| All | 100% | 100% | -0.58% | 79% | 1.8% |
| Rural/urban | |||||
| Urban | 75% | 89% | -0.57% | 80% | 1.5% |
| Rural | 25% | 11% | -0.64% | 77% | 2.7% |
| Teaching status | |||||
| Major teaching | 9% | 18% | -0.66% | 93% | 1.0% |
| Other teaching | 22% | 37% | -0.57% | 84% | 1.1% |
| Nonteaching | 68% | 45% | -0.58% | 75% | 2.2% |
| Size | |||||
| <100 beds | 39% | 10% | -0.50% | 65% | 2.6% |
| 100-299 beds | 42% | 42% | -0.67% | 87% | 1.6% |
| 300+ beds | 20% | 49% | -0.57% | 90% | 0.6% |
| Proportion of patients who are low-income, Medicare | |||||
| Quartile 1 (Lowest) | 24% | 20% | -0.47% | 66% | 2.3% |
| Quartile 2 | 25% | 30% | -0.56% | 81% | 1.5% |
| Quartile 3 | 25% | 30% | -0.64% | 86% | 1.1% |
| Quartile 4 (Highest) | 25% | 20% | -0.69% | 86% | 2.5% |
| NOTES: The low-income Medicare patient proportion is derived from hospital ratios of Supplemental Security Income (SSI) patient days, with the 4th quartile having the highest ratio of low-income patient days. The percent of hospitals in each group is for 2016. The percent of patient admissions is from based on the March 2015 update of the FY 2014 MedPAR. Analysis excludes hospitals not subject to HRRP because they are not paid under the Medicare Hospital Inpatient Prospective Payment System (e.g., Maryland hospitals, psychiatric hospitals). Penalties assessed as reductions in base payments on all Medicare inpatient admissions, and do not apply to added payment adjustments, such as graduate medical education payments.SOURCE: Kaiser Family Foundation analysis of CMS Final Rules and Impact Files for the Hospital IPPS; CMS SSI calculations are from 2014 claims run out. | |||||
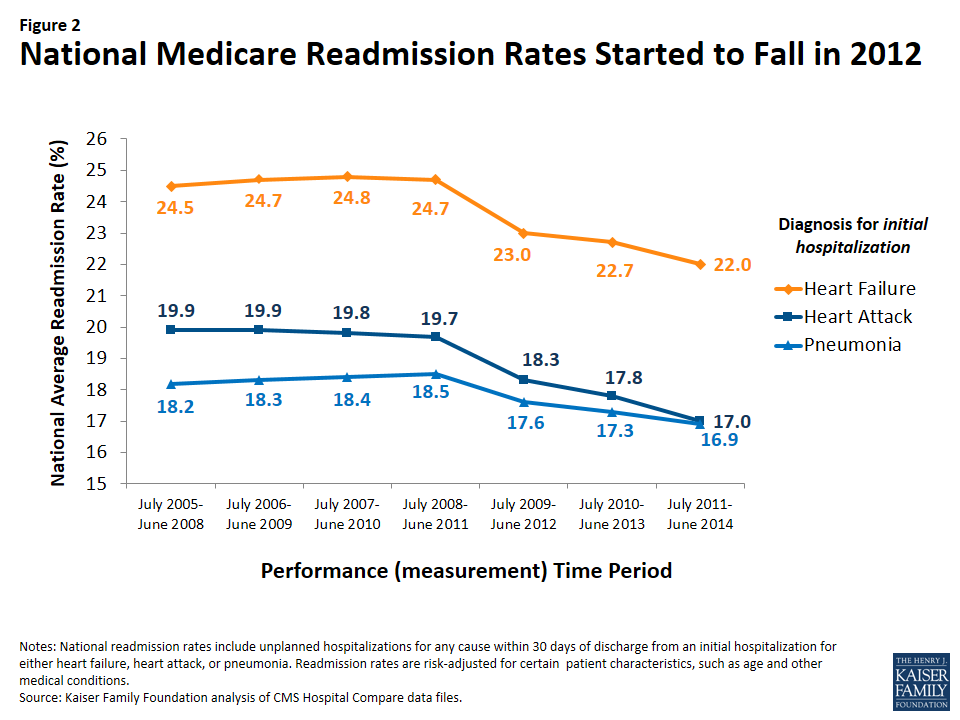
Readmission rates for Medicare patients started to fall in 2012—when CMS began measuring them for the penalty program—and have declined further since
CMS has been posting individual hospital readmission rates on its Hospital Compare website, in addition to other measures of quality and patient satisfaction, since 2009. Designed for use by Medicare consumers as well as researchers, this website also provides comparisons of each hospital’s Medicare readmission performance to the national average by indicating whether the hospital is “better/worse/no different” than the U.S. National rate. In addition to readmissions following hospitalizations for selected diagnoses, the Hospital Compare website started reporting each hospital’s overall Medicare readmission rates.
Analysis of this database shows that 2012 marks the first measurable declines in readmissions (Figure 2). Specifically, when the three-year moving average of hospital readmission rates began including data from 2012, the rates fell across all three diagnosis categories, and have continued through subsequent measurement periods.8 These notable drops started after Congress enacted the HRRP in the ACA, suggesting that hospitals may have initiated new interventions to lower their readmission rates during the measurement period leading up to the fines, which started in 2013. Additionally, other clinician activities outside the hospitals may have contributed to the decline in readmissions. With the decline in the rate of readmissions, the Department of Health and Human Services estimates 565,000 fewer Medicare patient readmissions from April 2010 through May 2015.9
Despite the reduction in readmission rates, average HRRP penalties have not declined, as shown earlier in Table 1. A main reason that declines in national readmission rates do not necessarily translate to lower fines is that penalty calculations are based on average hospital performance, rather than on fixed targets, as required by law. In other words, CMS must assess hospital penalties based on a curve, resulting in a certain percentage of hospitals always being penalized, regardless of improvements in national readmission rates. Advantages and disadvantages of changing this formula are discussed below.
Ongoing policy issues
Concerns raised by researchers and hospital representatives have prompted policymakers to consider refinements to the implementation of the HRRP and look for ways to engage other health care providers and patients. Some of the refinements under discussion include changes in the way hospital measures are risk-adjusted, setting hospital performance targets, and engaging other providers.
- Risk-adjustment. While Medicare’s readmission measures are adjusted for demographic characteristics associated with higher rates of hospital readmissions (such as age), the initial HRRP statute did not allow adjustments to the penalty calculations based on socioeconomic or community-level factors. However, subsequent to recommendations by the National Quality Forum (NQF) and the Medicare Payment Advisory Commission (MedPAC) to adjust for socioeconomic status, Congress recently modified the method that CMS will use to assess hospital performance, as outlined in the recently passed 21st Century Cures Act.10 Specifically, the new law directs the Secretary of Health and Human Services to divide hospitals into peer groups based on similar shares of inpatients who qualify for both Medicare and full Medicaid and then determine each hospital’s performance on readmissions relative to its peer group. This change will be effective fiscal year 2019, but the law also allows for the Secretary to consider implementing additional risk adjustments in the future.CMS has previously raised concerns regarding socioeconomic adjustment—namely, the potential that softening penalties for hospitals with lower-income patients could hold those hospitals to a lower standard, and unintentionally weaken incentives to improve health outcomes for disadvantaged patients.11 In part, the peer group methodology may address some of this concern. However, depending on how the hospital peer groups are divided in the new adjustment methodology, further complicating issues could arise, due to state variation in the criteria for Medicaid eligibility among seniors and people with disabilities.
- Moving goalposts for multiple measures. Hospital performance in the HRRP is essentially graded on a curve because the calculations for determining penalties are based on comparisons to the national average, with future modifications based on hospital peer groups, as described above. Therefore, for each measure, if the national rate of Medicare readmissions declines—the main goal of the HRRP—then it is possible for hospitals to improve their readmission rates, but still be penalized. Also, the shifting penalties do not capture hospital performance across all initial hospitalization diagnoses—sometimes referred to as a hospital-wide or all-condition readmission measure.On the one hand, some suggest that if Medicare established fixed target rates for an all-condition readmission measure, hospitals might have an easier time understanding the HRRP, embracing interventions to achieve those targets, and would not risk some readmissions being double-counted (in the case of CABG and heart failure, for example).12 On the other hand, others could argue that a fixed target for all conditions might mitigate the level of hospital improvement because it would establish a minimum performance, rather than encourage hospitals to keep up with the average for each of the selected diagnoses, especially relevant when the average improves.
- Other providers play a role. Hospital administrators and policymakers have noted that incentives to reduce readmissions should not rest on hospitals alone because other providers and the patients themselves may play important roles in this effort. Further, hospitals may have little to no control over the care that patients receive after they are discharged from an inpatient stay. While researchers readily acknowledge that many readmissions are not preventable, studies show that hospitals can engage in collaborative activities to lower their number of readmissions, such as clarifying patient discharge instructions, coordinating with post-acute care providers, and reducing medical complications during the patients’ initial hospital stays.13
Discussion
Our analysis finds that most Medicare patient admissions (78%) for 2017 will occur in hospitals receiving either no readmission penalty or penalties of less than 1 percent of their Medicare inpatient revenue. Given the stress and problems that patients experience when readmitted to a hospital, it may be reassuring that most beneficiary stays are in hospitals with relatively lower readmission rates. While hospitals with higher penalty rates account for a considerably smaller proportion of beneficiary inpatient stays, to the extent that higher readmission rates signal concerns about care quality and discharge planning, patients going to higher-penalty hospitals may be at greater risk for related problems.
Overall, national readmission rates in traditional Medicare, started to decline in 2012 and have continued along that path in subsequent years. This timing suggests that hospitals may have started to implement strategies to lower their readmissions in response to the enactment of the HRRP, with the understanding that the financial penalties (starting in 2013) would be based on performance in prior years. Further, because the declines are seen for multiple conditions, multipronged and system-based efforts to reduce readmissions are likely, rather than limited improvements in selected clinical treatments.14 Moreover, the fact that the lower readmission rates have been sustained across several years also suggests that system-wide improvement have played a role. Simultaneously, other providers in the community may have also started focusing more attention on ways to lower hospital readmissions among their patients.
Despite these declines, our study shows that readmission rates and penalties continue to be higher among hospitals that have higher proportions of low-income Medicare patients, consistent with research conducted by MedPAC, NQF, and others.15 Health care providers and policymakers have noted that socioeconomic factors may often play a role in access to home and community support services aiding a patient’s recovery after hospitalizations. For example, lower-income communities and families may have limited resources for reliable transportation to take patients to follow-up medical appointments, assistance with patient mobility and daily living needs during recovery, and access to foods that meet patients’ special dietary needs. Further examination of ways to address patient and community needs in lower income areas may offer insights into ways to lower hospital readmissions among patients in hospitals with higher shares of low-income patients.
In light of the socioeconomic issues that have been raised about the HRRP, Congress recently required a new “peer group” method for assessing hospital performance that categorizes hospitals based on their proportion of inpatients who are dually eligible for Medicare and full Medicaid. While this new method aims to identify hospitals serving low-income Medicare patients, the significant variation between states in Medicaid eligibility criteria (such as income thresholds and asset limits) raises several issues.16 For example, hospitals in states with relatively stricter Medicaid eligibility criteria for seniors and people with disabilities are likely to have lower average incomes among their patients dully covered by Medicare and Medicaid—and potentially higher readmission rates—than hospitals in states with more generous Medicaid eligibility criteria. Therefore, penalties based on readmission rates within the peer groups may not fairly account for patient income if the peer groups span across states.
Similarly, any future changes to the structural financing of the Medicaid program, such as block grant proposals recently discussed in Congress, could have varying effects on states’ ability to provide Medicaid coverage to low-income seniors and people with disabilities.17 This could further complicate the ability of the HRRP to identify comparable hospital peer groups, if based exclusively on their share of inpatients dully eligible for Medicare and Medicaid.
Finally, because the HRRP affects Medicare payments to hospitals, its effect on Medicare patients is generally indirect. To the extent that the financial penalties encourage hospitals to implement activities designed to improve care quality and lower their rate of preventable readmissions, the penalty program could be beneficial to Medicare patients and the Medicare program. Alternatively, some have noted that reducing financial resources to lower-performing hospitals could have a negative impact on their delivery of patient care. Regarding beneficiaries’ out-of-pocket expenses, a hospital’s penalty status has no direct effect on beneficiaries’ cost sharing during inpatient stays. For readmissions in particular, the inpatient hospital deductible ($1,316 in 2017) is waived, but beneficiaries do face other out-of-pocket liabilities—mostly in the form of coinsurance for separately billed physician services received during their stay—as they would in all inpatient stays.18
In the coming years
With the enactment of the HRRP in the ACA, the aim to reduce preventable hospital readmissions has gained traction among providers and policymakers. Moreover, key programs, such as Accountable Care Organizations (ACOs), bundled-payment initiatives, and medical home programs, include provider incentives to lower hospital readmissions, either directly or indirectly. For a description of these models and a summary of the available evidence on spending and quality outcomes, see Payment and Delivery System Reform in Medicare: A Primer on Medical Homes, Accountable Care Organizations, and Bundled Payments. Additionally, the Community-based Care Transitions Program, also enacted by the ACA, is designed to assess ways that local organizations might partner with hospitals to improve patients’ transitions to other settings, such as skilled nursing facilities or the patients’ home.19 Also, in traditional Medicare, CMS has recently started allowing physicians to bill Medicare for “transitional care management” after a beneficiary’s discharge from a hospital or other health care facility, in an effort to reimburse physicians for follow-up activities that could reduce readmissions and other complications.
As more results become available from Medicare’s payment and delivery system reforms a key question continues to be whether and how care improves for patients with the greatest health care needs—often those who have been hospitalized one or more times during the year. Reductions in hospital readmission may be a likely outcome on which to focus and may help policymakers identify which models to pursue more broadly. A continuing decline in preventable readmission rates would help slow the growth in Medicare spending and may also signal improved care for patients during and after their hospitalizations.
Appendix
| Appendix Table: Variation in penalties by hospital type, 2013-2017 | |||||||||||||||||
| Hospital type | % of hospitals | % of Medicare patients | Average hospital payment adjustment | % of hospitals with any penalty | % of hospitals at max penalty | ||||||||||||
| 2013 | 2014 | 2015 | 2016 | 2017 | 2013 | 2014 | 2015 | 2016 | 2017 | 2013 (-1%) | 2014 (-2%) | 2015 (-3%) | 2016 (-3%) | 2017 (-3%) | |||
| All | 100% | 100% | -0.27% | -0.25% | -0.49% | -0.48% | -0.58% | 64% | 66% | 78% | 78% | 79% | 8.0% | 0.6% | 1.2% | 1.1% | 1.8% |
| Rural/urban | |||||||||||||||||
| Urban | 75% | 89% | -0.26% | -0.23% | -0.46% | -0.46% | -0.57% | 65% | 66% | 78% | 79% | 80% | 7.1% | 0.1% | 0.8% | 0.9% | 1.5% |
| Rural | 25% | 11% | -0.30% | -0.31% | -0.57% | -0.51% | -0.64% | 62% | 65% | 79% | 77% | 77% | 11.5% | 1.9% | 2.2% | 1.7% | 2.7% |
| Teaching status | |||||||||||||||||
| Major teaching | 9% | 18% | -0.43% | -0.34% | -0.51% | -0.50% | -0.66% | 86% | 87% | 92% | 92% | 93% | 16.5% | 0.4% | 3.0% | 0.0% | 1.0% |
| Other teaching | 22% | 37% | -0.26% | -0.22% | -0.44% | -0.45% | -0.57% | 68% | 66% | 79% | 81% | 84% | 5.8% | 0.1% | 3.0% | 0.4% | 1.1% |
| nonteaching | 68% | 45% | -0.26% | -0.25% | -0.50% | -0.48% | -0.58% | 61% | 63% | 76% | 76% | 75% | 8.2% | 0.8% | 1.5% | 1.5% | 2.2% |
| Size | |||||||||||||||||
| <100 beds | 39% | 10% | -0.22% | -0.23% | -0.45% | -0.42% | -0.50% | 50% | 53% | 66% | 65% | 65% | 7.8% | 1.4% | 2.3% | 2.1% | 2.6% |
| 100-299 beds | 42% | 42% | -0.30% | -0.28% | -0.55% | -0.54% | -0.67% | 74% | 75% | 87% | 86% | 87% | 8.2% | 0.2% | 0.6% | 0.8% | 1.6% |
| 300+ beds | 20% | 49% | -0.31% | -0.25% | -0.43% | -0.45% | -0.57% | 71% | 73% | 85% | 87% | 90% | 9.5% | 0.0% | 0.2% | 0.0% | 0.6% |
| Proportion of patients who are low-income, Medicare | |||||||||||||||||
| Quartile 1 (Lowest) | 24% | 20% | -0.18% | -0.15% | -0.43% | -0.41% | -0.47% | 49% | 51% | 67% | 66% | 66% | 4.3% | 0.4% | 1.7% | 1.8% | 2.3% |
| Quartile 2 | 25% | 30% | -0.24% | -0.22% | -0.46% | -0.47% | -0.56% | 61% | 62% | 81% | 79% | 81% | 5.4% | 0.0% | 0.2% | 1.0% | 1.5% |
| Quartile 3 | 25% | 30% | -0.31% | -0.28% | -0.53% | -0.52% | -0.64% | 73% | 73% | 84% | 85% | 86% | 8.0% | 0.4% | 1.0% | 0.5% | 1.1% |
| Quartile 4 (Highest) | 25% | 20% | -0.37% | -0.36% | -0.54% | -0.52% | -0.69% | 77% | 78% | 84% | 85% | 86% | 14.7% | 1.3% | 1.8% | 1.4% | 2.5% |
| NOTES: The low-income Medicare patient proportion is derived from hospital ratios of Supplemental Security Income (SSI) patient days, with the 4th quartile having the highest ratio of low-income patient days. The percent of hospitals in each group is for 2016. The percent of patient admissions is from based on the March 2015 update of the FY 2014 MedPAR. Analysis excludes hospitals not subject to HRRP because they are not paid under the Medicare Hospital Inpatient Prospective Payment System (IPPS) (e.g., Maryland hospitals, psychiatric hospitals).SOURCE: Kaiser Family Foundation analysis of CMS Final Rules and Impact Files for the Hospital IPPS; CMS’s SSI calculations are from 2014 claims run out. | |||||||||||||||||
Endnotes
- Jencks, S. F. et al., “Hospitalizations among Patients in the Medicare Fee-for-Service Program,” New England Journal of Medicine Vol. 360, No. 14: 1418-1428, 2009.; Epstein, A. M. et al., “The Relationship between Hospital Admission Rates and Rehospitalizations,” New England Journal of Medicine Vol. 365, No. 24: 2287-2295, 2011. ↩︎
- Ahmad, F. S. et al., “Identifying Hospital Organizational Strategies to Reduce Readmissions,” American Journal of Medical Quality Vol. 28, No. 4: 278-285, 2013.; Silow-Carroll, S. et al., “Reducing Hospital Readmissions: Lessons from Top-Performing Hospitals,” Commonwealth Fund Synthesis Report, New York: Commonwealth Fund, 2011.; Jack, B. W. et al., “A Reengineered Hospital Discharge Program to Decrease Hospitalization: A Randomized Trial,” Annals of Internal Medicine Vol. 50, No. 3: 178-187, 2009.; and Kanaan, S. B., “Homeward Bound: Nine Patient-Centered Programs Cut Readmissions,” Oakland, CA: California HealthCare Foundation, 2009. ↩︎
- Other examples include several of the payment delivery system reforms launched by the CMS Innovation Center, including Pioneer Accountable Care Organizations (ACOs), bundled-payment initiatives, and the Independence at Home demonstration, all of which include provider incentives to lower hospital admission and readmission rates, either directly or indirectly. Additionally, the Community-based Care Transitions Program, also enacted by the ACA, is designed to assess ways that community-based organizations might partner with hospitals to improve patients’ transitions to other settings, such as skilled nursing facilities or the patients’ home. ↩︎
- Maryland hospitals have a longstanding Medicare waiver that exempt them from the IPPS and allows Maryland to set all-payer rates for its hospital services. ↩︎
- Hospitals’ excess readmission ratios are also weighted by Medicare’s cost for admissions with the given initial diagnosis. ↩︎
- Penalties assessed as reductions in base payments on all Medicare inpatient admissions, and do not apply to added payment adjustments, such as graduate medical education payments. ↩︎
- Sheingold, S., R. Zuckerman, and A. Shartzer, “Understanding Medicare Hospital Readmission Rates and Differing Penalties Between Safety-net and Other Hospitals,” Health Affairs, 35, No.1, January 2016; Kahn, C., T. Ault, L. Potetz, T. Walke, J. Chambers, and S. Burch, “Assessing Medicare’s Hospital Pay-For-Performance Programs And Whether They Are Achieving Their Goals,” Health Affairs, 34, No.8, August 2015; Joynt, K. and A. Jha, “A Path Forward on Medicare Readmissions” New England Journal of Medicine Vol. 368, No. 13, 2013; Medicare Payment Advisory Commission, “Chapter 4: Refining the Hospital Readmissions Reduction Program,” Report to the Congress: Medicare and the Health Care Delivery System, June 2013. ↩︎
- Research using quarterly data shows declines occurred for some measures earlier. See Zuckerman, R. S. Sheingold, J. Orav, J. Ruhter, and A. Epstein, “Readmissions, Observations, and the Hospital Readmissions Reduction Program,” New England Journal of Medicine, Vol. 374, No.16, 2016; ↩︎
- Obama, B., “United States Health Care Reform: Progress to Date and Next Steps,” Journal of American Medicine (July 11 2016). ↩︎
- Medicare Payment Advisory Commission, “Chapter 4: Refining the Hospital Readmissions Reduction Program,” Report to the Congress: Medicare and the Health Care Delivery System, June 2013; National Quality Forum, “Risk Adjustment for Socioeconomic Status or Other Sociodemographic Factors,” Technical Report, August 15, 2014. ↩︎
- Final Rule for 42 CFR Parts 405, 412, 413, and 489—scheduled to be published in the Federal Register on August 22, 2016. Federal Register Vol. 79, No. 163: 49659-50536, 2014. ↩︎
- This issue and other complexities with the penalty formula are discussed in Medicare Payment Advisory Commission, “Chapter 4: Refining the Hospital Readmissions Reduction Program,” Report to the Congress: Medicare and the Health Care Delivery System, June 2013; Lynn, Joanne and Steve Jencks, “A Dangerous Malfunction in the Measure of Readmission Reduction,” MediCaring.org, August 26, 2014. More recently, MedPAC submitted relevant comments to CMS on the IPPS proposed rule http://medpac.gov/-documents-/comment-letters ↩︎
- See studies listed in endnote 2. ↩︎
- While hospital readmission rates among Medicare patients has declined, some other types of hospital rates have increased, including outpatient emergency room visits and observation stays. Medicare claims analysis by Gerhardt et al (2014) suggests that reductions in readmissions in 2012 were largely independent from these other types of hospital uses. (Gerhardt, G., A. Yemane, K. Apostle, A. Oelschlaeger, E. Rollins, and N. Brennan. 2014. “Evaluating Whether Changes in Utilization of Hospital Outpatient Services Contributed to Lower Medicare Readmission Rate.” Medicare & Medicaid Research Review 4(1), E1-E13.) ↩︎
- Medicare Payment Advisory Commission, “Chapter 4: Refining the Hospital Readmissions Reduction Program,” Report to the Congress: Medicare and the Health Care Delivery System, June 2013; National Quality Forum, “Risk Adjustment for Socioeconomic Status or Other Sociodemographic Factors,” Technical Report, August 15, 2014. Sheingold, S., R. Zuckerman, and A. Shartzer, “Understanding Medicare Hospital Readmission Rates and Differing Penalties Between Safety-net and Other Hospitals,” Health Affairs, 35, No.1, January 2016; Kahn, C., T. Ault, L. Potetz, T. Walke, J. Chambers, and S. Burch, “Assessing Medicare’s Hospital Pay-For-Performance Programs And Whether They Are Achieving Their Goals,” Health Affairs, 34, No.8, August 2015; Joynt, K. and A. Jha, “A Path Forward on Medicare Readmissions” New England Journal of Medicine Vol. 368, No. 13, 2013; ↩︎
- Watts, M., E. Cornachione, M. Musumeci, “Medicaid Financial Eligibility for Seniors and People with Disabilities in 2015. Kaiser Family Foundation (March 2016) https://modern.kff.org/medicaid/report/medicaid-financial-eligibility-for-seniors-and-people-with-disabilities-in-2015/ ↩︎
- For further information on Medicaid reform proposals, such as block grants and per capita caps, see: Rudowitz, Robin, “5 Key Questions: Medicaid Block Grants & Per Capita Caps,” Kaiser Family Foundation, January 31, 2017. https://modern.kff.org/medicaid/issue-brief/5-key-questions-medicaid-block-grants-per-capita-caps/ ↩︎
- In general, beneficiaries are not responsible for an inpatient deductible if admitted to a hospital within 60 days of a prior hospitalization. ↩︎
- Based on a subset of participating CBCT organizations, preliminary results find that a small number of organizations were able to achieve reductions in readmissions. Further analysis is expected to highlight both successful and unsuccessful strategies and techniques. (Econometrica, Inc, “Evaluation of the Community-based Care Transitions Program,” submitted to CMS (May 2014). ↩︎