10 Things to Know About Medicare Part D Coverage and Costs in 2019
Data Note
The Medicare Part D program provides an outpatient prescription drug benefit to older adults and people with long-term disabilities in Medicare who enroll in private plans, including stand-alone prescription drug plans (PDPs) to supplement traditional Medicare and Medicare Advantage prescription drug plans (MA-PDs) that include drug coverage and other Medicare-covered benefits. This analysis provides the latest data about Medicare Part D coverage and costs in 2019 and trends over time.
1. Medicare Part D enrollment has doubled since 2006, now totaling 45 million people in 2019
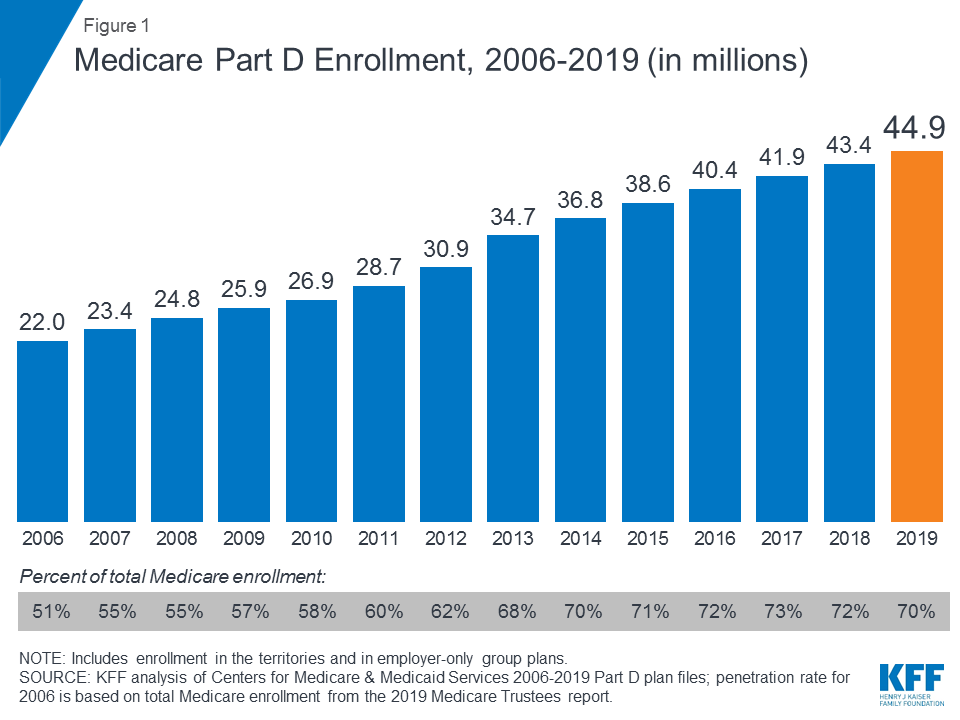
A total of 45 million people with Medicare are currently enrolled in plans that provide the Medicare Part D drug benefit, representing 70 percent of all Medicare beneficiaries. This total includes plans open to everyone with Medicare, including stand-alone PDPs and MA-PDs, and plans for retirees of a former employer or union. Part D enrollment has doubled since the program started in 2006, when the number of enrollees was 22.0 million, or roughly half of all Medicare beneficiaries.
2. For the first time since the Part D program started in 2006, enrollment in stand-alone drug plans has decreased somewhat, while enrollment in Medicare Advantage drug plans continues to increase
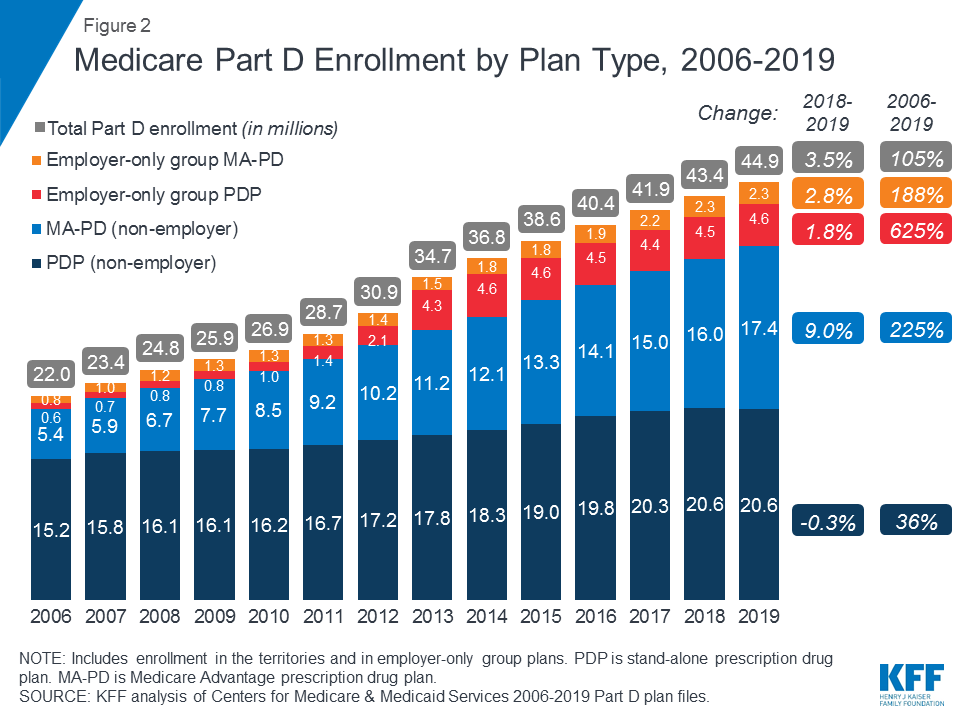
In 2019, close to half of all Part D enrollees are enrolled in stand-alone PDPs (46%), but nearly 4 in 10 (39%) are in Medicare Advantage prescription drug plans (MA-PDs). The remaining 15 percent of Part D enrollees are in employer/union group plans, both PDPs and MA-PDs. Over time, enrollment in MA-PDs has increased, reflecting enrollment growth in Medicare Advantage plans overall. Between 2018 and 2019, the number of MA-PD enrollees increased by 9 percent, from 16.0 million to 17.4 million, while enrollment in PDPs fell by a modest 0.3 percent, from 20.64 million to 20.57 million.
3. Three firms—UnitedHealth, Humana, and CVS Health—cover nearly 60 percent of all Medicare Part D enrollees in 2019
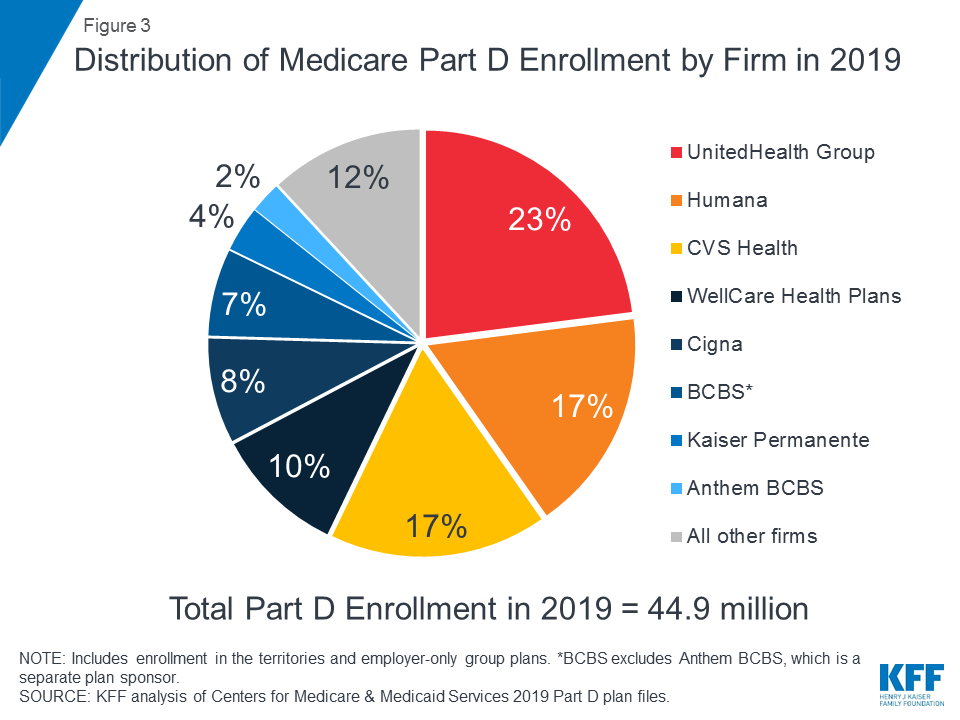
The top three firms—UnitedHealth, Humana, and CVS Health—cover nearly 60 percent of all beneficiaries enrolled in Part D in 2019 (57%), while the top five firms—including WellCare and Cigna—account for three-quarters (75%) of Part D enrollment (see also Table 1). The recent acquisitions of Aetna by CVS Health and Express Scripts by Cigna have resulted in further consolidation of the Part D marketplace. In particular, between 2018 and 2019, Cigna increased its market share from 3 percent to 8 percent, while CVS Health increased its market share from 14 percent to 17 percent. Under the CVS Health-Aetna merger, Aetna divested its stand-alone PDP business to WellCare, resulting in a more than doubling of WellCare’s Part D market share, from 4 percent in 2018 to 10 percent in 2019.
4. CVS Health, UnitedHealth, and Humana have the most stand-alone PDP enrollees in 2019, but PDP enrollment in each firm decreased modestly from 2018

In 2019, 9 out of 10 stand-alone drug plan enrollees are in plans sponsored by five firms—CVS Health, UnitedHealth, Humana, WellCare, and Cigna. Enrollment in PDPs sponsored by CVS Health, which has the most stand-alone drug plan enrollees in 2019, increased over time through acquisition of other plan sponsors, while UnitedHealth and Humana have had large market shares since the Part D program began (data not shown). However, enrollment in PDPs sponsored by the three largest firms declined between 2018 and 2019, while WellCare and Cigna gained PDP enrollees in part due to merger activity: specifically, Cigna’s acquisition of Express Scripts and the divestiture of Aetna’s PDP enrollment to WellCare pursuant to the acquisition of Aetna by CVS.
The decline in Humana’s PDP enrollment between 2018 and 2019 was driven by a large drop in enrollment in the Humana Walmart Rx PDP, which may be attributable to a 37% increase in the average monthly premium for this PDP (from $20 in 2018 to $28 in 2019). This plan was among the lowest-premium PDPs in all regions in 2018, but that is no longer the case in 2019.
5. Based on enrollment decisions for 2019, the average monthly premium for stand-alone PDPs decreased by 4% in 2019 to $40, after several years of modest increases
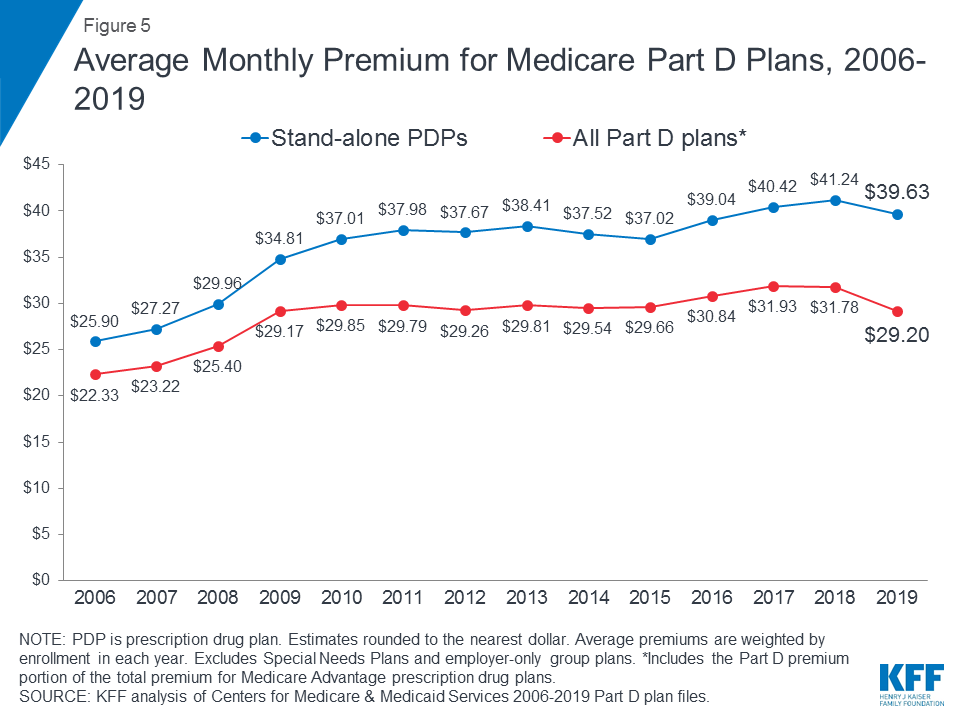
In 2019, PDP enrollees are in plans with a weighted average monthly premium of $39.63, a 4 percent reduction (-$1.61) from 2018. The average monthly PDP premium amount has remained within a few dollars of this amount since 2010. The combined average Part D premium for PDP and MA-PD enrollees is $29.20 in 2019, a reduction of 8 percent (-$2.58) from 2018. The overall Part D premium is lower than the average for stand-alone PDPs due in part to the ability of MA-PD sponsors to use rebate dollars from Medicare payments for benefits covered under Parts A and B to lower their Part D premiums.
6. Monthly premiums for the top 10 PDPs by enrollment vary, but most are lower than the national average
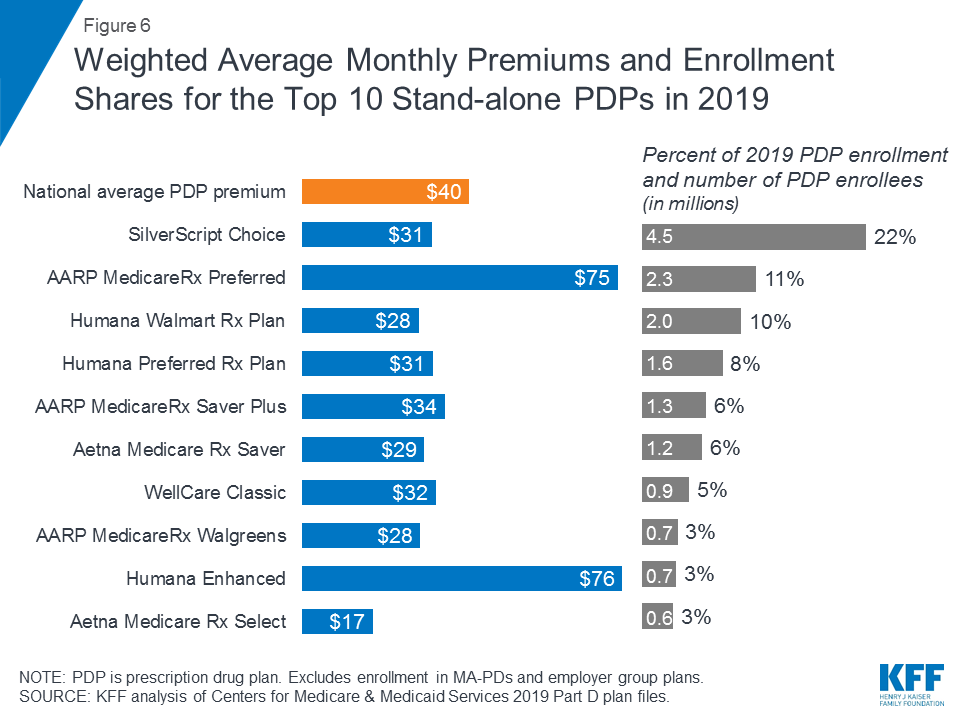
Average monthly premiums in 2019 vary widely among the most popular PDPs, but most are lower than the $40 weighted national average PDP premium. Average premiums range from $17 per month for Aetna Medicare Rx Select to 4.5 times more for Humana Enhanced ($76 per month) and AARP MedicareRx Preferred ($75 per month). The average monthly premium for Silverscript Choice, the PDP with the most enrollees in 2019 (roughly 1 in 5 PDP enrollees (22%) or 4.5 million), is $31, while the 2.3 million enrollees in the second largest PDP in 2019, AARP MedicareRx Preferred, pay $75 per month, on average.
7. Most Part D enrollees face relatively low cost sharing for preferred generic drugs, but higher amounts for generics not on the preferred tier
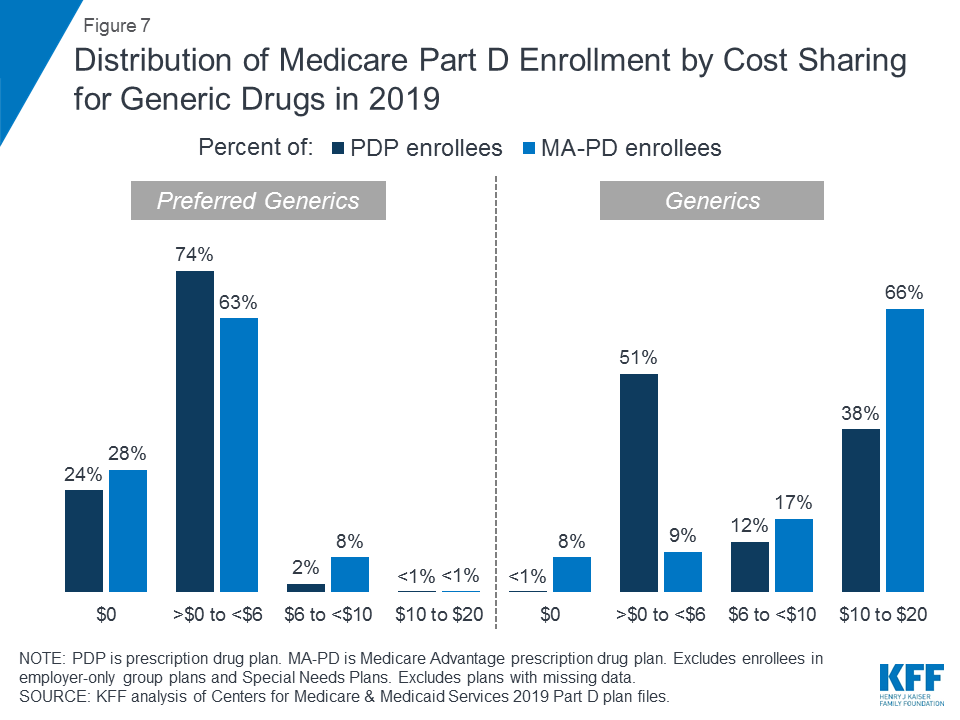
Around one-fourth of Part D enrollees (both PDP and MA-PD enrollees) pay $0 for preferred generics in 2019, but many pay $10 or more for generics that are not on the preferred tier. For preferred generics, 24 percent of PDP enrollees and 28 percent of MA-PD enrollees have a $0 copayment, while 74 percent of PDP enrollees and 63 percent of MA-PD enrollees face copays greater than $0 but less than $6. For generic drugs that are not on the preferred generic tier, nearly 4 in 10 PDP enrollees (38%) and 66 percent of MA-PD enrollees pay between $10 and $20. (See also Table 2)
8. For non-preferred drugs, most MA-PD enrollees face copayments while most PDP enrollees face coinsurance; for preferred brands, copayments are more common than coinsurance for both types of enrollees
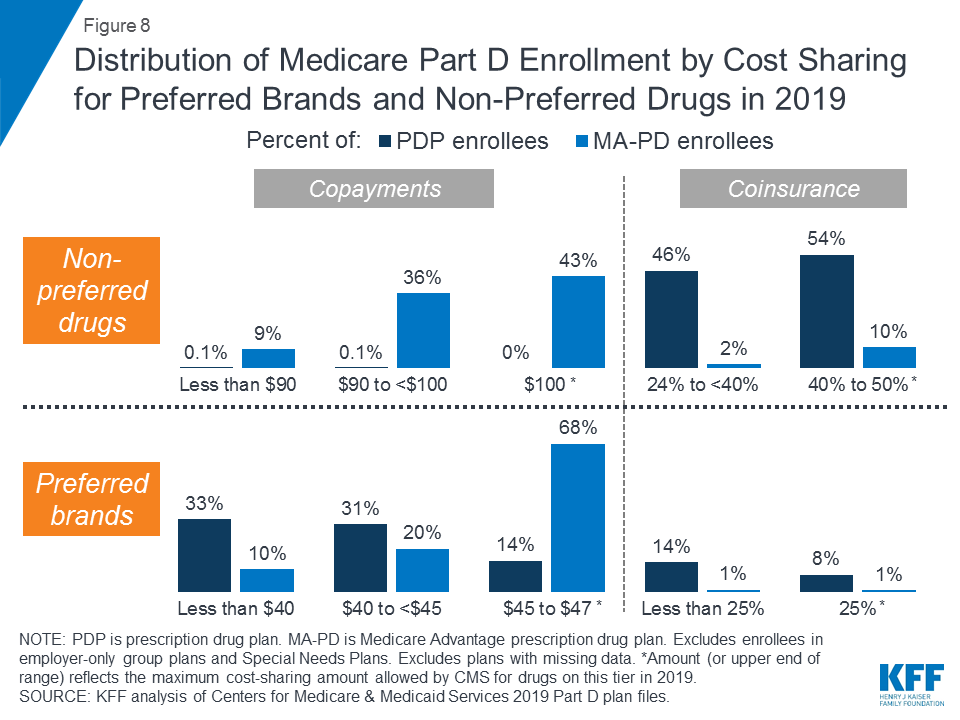
For non-preferred drugs, virtually all PDP enrollees pay coinsurance between 24 percent and 50 percent in 2019, while most MA-PD enrollees (79%) pay copayments between $90 and $100. For preferred brands, nearly two-thirds of PDP enrollees (64%) pay copayments less than $45 in 2019, while roughly the same share of MA-PD enrollees (68%) pay $45 to $47. For both types of drugs, the upper end of the cost-sharing range—$100 or 50 percent for non-preferred drugs; $47 or 25 percent for preferred brands—is the maximum cost-sharing amount allowed by CMS for drugs on these tiers in 2019.
For drugs placed on the specialty tier, many Part D enrollees pay coinsurance of 33 percent, the maximum allowed for specialty tier drugs (data not shown). Nearly 4 in 10 PDP enrollees (39%) and close to half of all MA-PD enrollees (46%) are in plans that charge the maximum 33 percent coinsurance rate for specialty tier drugs, defined by CMS as those that cost at least $670 per month. Only those plans that waive some or all of the standard deductible are permitted to set the specialty tier coinsurance rate above 25 percent. (See Table 2)
9. In 2019, roughly 3 in 10 Part D enrollees receive low-income subsidies (LIS) to help pay their Part D premiums and cost sharing, but the share of enrollees receiving these subsidies has declined over time
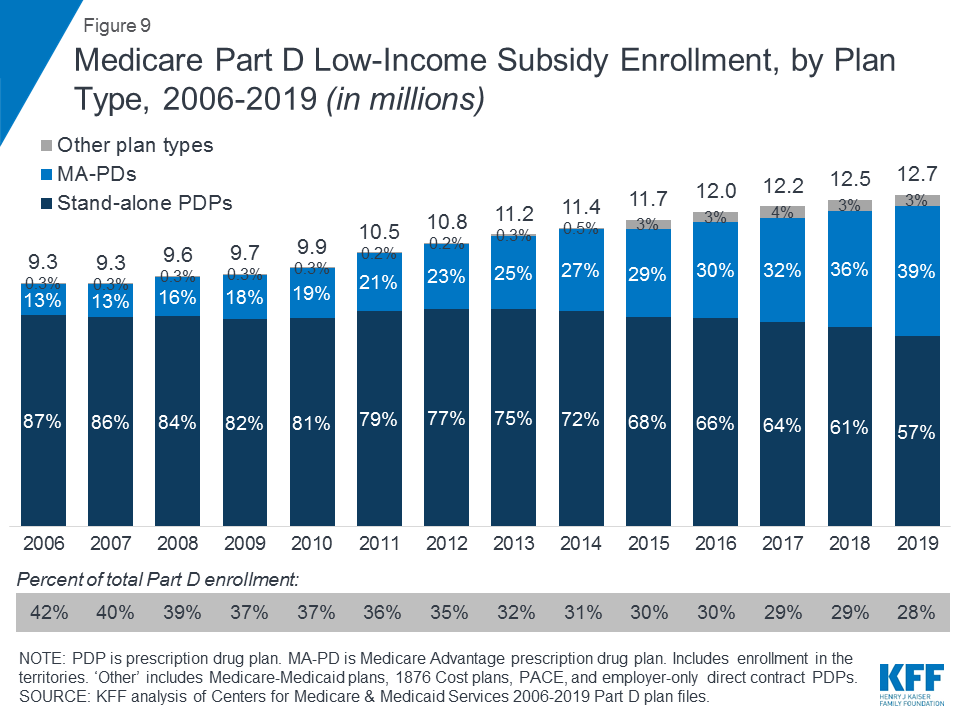
In 2019, nearly 13 million Part D enrollees—roughly 3 in 10—receive premium and cost-sharing assistance through the Part D Low-Income Subsidy (LIS) program. These additional financial subsidies, also called “Extra Help,” pay Part D premiums for eligible beneficiaries, as long as they enroll in stand-alone PDPs designated as premium-free “benchmark” plans, and reduce cost sharing. Reflecting overall trends in Part D enrollment, the share of LIS enrollees in stand-alone PDPs has declined over time, from 87 percent in 2006 to 57 percent in 2019, while the share in MA-PDs has increased, from 13 percent in 2006 to 39 percent in 2019.
Overall, the share of Part D enrollees receiving low-income subsidies has declined over time, from 42 percent of Part D enrollees in 2006 to 28 percent in 2019. The rate of growth in LIS enrollment (2.4% compound annual growth rate between 2006 and 2019) has not kept pace with the rate of growth in Part D enrollment overall (5.7% between 2006 and 2019) or in total Medicare enrollment (3.6% between 2007 and 2019).
10. In 2019, around 1 in 10 low-income subsidy enrollees pay an average of nearly $24 per month for Part D coverage because they are not enrolled in a premium-free plan
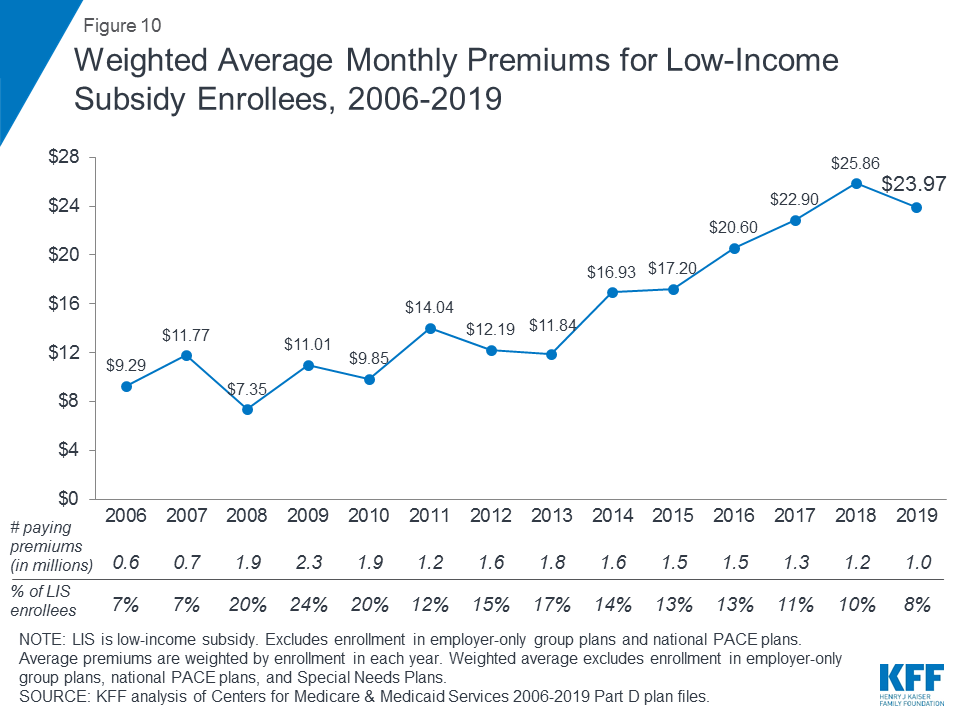
In 2019, 1.0 million LIS beneficiaries (8% of all LIS beneficiaries) pay a premium for Part D coverage, even though they may be able to obtain coverage without paying a premium by enrolling in a benchmark PDP. This total includes 0.7 million PDP enrollees who are not enrolled in benchmark PDPs, and more than 0.3 million enrollees in MA-PDs that charge a premium. MA-PDs are not designated as benchmark plans by CMS, although most of the LIS enrollees in MA-PDs are currently enrolled in zero-premium plans. On average, the 1.0 million LIS beneficiaries paying Part D premiums in 2019 pay nearly $24 per month, or nearly $300 per year. This amount is down 7 percent (-$1.89) from 2018, but is 2.6 times the amount in 2006.
Juliette Cubanski and Tricia Neuman are with KFF.Anthony Damico is an independent consultant.
| Data and Methods This analysis uses data from the Centers for Medicare & Medicaid services (CMS) Part D Enrollment, Benefit, Landscape, and Low Income Subsidy files for the respective year, with enrollment data from March of each year. The analysis excludes plans with small enrollment counts in estimates that are plan-enrollment weighted. For analysis of cost sharing for formulary tiers in PDPs and MA-PDs, we did not analyze which drugs are on what tier under each type of plan and whether this has changed over time, factors which would also influence enrollees’ out-of-pocket costs. |
Tables
Table 1: Top Firms Offering Medicare Part D Plans Ranked by 2019 Enrollment | ||||
| Name of firm | 2019 Enrollment | Percent of totalPart D enrollment | ||
| PDP | MA-PD | Total | ||
| UnitedHealth Group | 5,108,180 | 5,215,144 | 10,323,324 | 23% |
| Humana | 4,299,086 | 3,473,709 | 7,772,795 | 17% |
| CVS Health | 5,979,883 | 1,602,402 | 7,582,285 | 17% |
| WellCare Health Plans | 4,015,902 | 531,189 | 4,547,091 | 10% |
| Cigna | 3,237,013 | 433,296 | 3,670,309 | 8% |
| BCBS* | 998,355 | 2,037,224 | 3,035,579 | 7% |
| Kaiser Permanente | – | 1,575,636 | 1,575,636 | 4% |
| Anthem BCBS | 428,699 | 647,159 | 1,075,858 | 2% |
| Total, top firms | 24,067,118 | 15,515,759 | 39,582,877 | 88% |
| Total Part D | 25,152,764 | 19,773,155 | 44,925,919 | 100% |
| NOTE: PDP is prescription drug plan. MA-PD is Medicare Advantage prescription drug plan. Includes enrollment in the territories and employer group plans. Number may not sum to total due to rounding. *BCBS excludes Anthem BCBS, which is a separate plan sponsor.SOURCE: KFF analysis of Centers for Medicare & Medicaid Services 2019 Part D plan files. | ||||
Table 2: Medicare Part D Cost-Sharing Amounts by Plan Type and Formulary Tier, 2019 | ||||||
| PDP | MA-PD | |||||
| Formulary tier | Minimum | Median | Maximum | Minimum | Median | Maximum |
| Preferred generic | $0 | $1 | $10 | $0 | $2 | $15 |
| Generic | $0 | $5 | $20 | $0 | $10 | $20 |
| Preferred brand copayments | $19 | $40 | $47 | $0 | $47 | $47 |
| Preferred brand coinsurance | 10% | 20% | 25% | 15% | 22% | 25% |
| Non-preferred drug copayments | $70 | $70 | $93 | $5 | $99 | $100 |
| Non-preferred drug coinsurance | 25% | 40% | 50% | 24% | 45% | 50% |
| Specialty | 25% | 25% | 33% | 25% | 31% | 33% |
| NOTE: PDP is prescription drug plan. MA-PD is Medicare Advantage prescription drug plan. Cost-sharing amounts are weighted by enrollment. Excludes enrollees in employer-only group plans and Special Needs Plans. Excludes plans with missing data.SOURCE: KFF analysis of Centers for Medicare & Medicaid Services 2019 Part D plan files. | ||||||